79
Annual Report 2011 One world...
| Date post: | 31-Mar-2018 |
| Category: |
Documents |
| Upload: | truongkhue |
| View: | 219 times |
| Download: | 3 times |

Annual Report 2011
One world...

Orascom Telecom Holdings Annual Report 2011 03Orascom Telecom Holdings Annual Report 2011B
Financial highlights
Strong performance across the board
Contents :
Financial highlights 03OTH at a glance 04Letter from the Chairman and CEO 06Business review 08Social responsibility 18Board of directors 20Governance 22Financial review 24Financial statements 42
Orascom Telecom is a leading integrated telecommunications services company operating GSM networks in the Middle East, Africa, Canada and Asia. OTH’s core belief is that communication is the essence of life, and the inherent right of every human. Being a borderless company, OTH seeks to provide the means of communication to people wherever they are in the world.
Communication empowers people to tell their stories, enhance their lives and advance their communities. OTH believes and strives to osition itself as the primary provider of communication services in its countries of operation. Integrating the most suitable and best technological innovation for each country enables OTH operator companies to facilitate and enrich their subscribers’ lives.
...one voiceFinancial data (IFRS)
in US$ millions 2009 2010 2011
Revenue 3760 3565 3636
EBITDA 1518 1496 1647
EBITDA margin (%) 40% 42% 45%
Net income 379 781 661
Earnings per GDR 0.36 0.73 0.63
CAPEX 761 782 816
Net Debt* 5113 4008 3022
Subscribers
78m
201120102009
78
69
61
Revenue
3,636m
201120102009
363635653760
EBITDA
1,647m
201120102009
1647
14961518
*Net Debt is calculated as a sum of short term debt, long term debt, less cash and cash equivalents.

Orascom Telecom Holdings Annual Report 2011Orascom Telecom Holdings Annual Report 2011 0504
Orascom Telecom at a glance
Diverse marketsOTH operates in countries on three continents, serving a population of 415 million customers with an average penetration of 48%.
Our operations
Country Population Mobile penetration Subscribers Market PositionContribution
to Group revenue
Algeria 35 million 83% 16.6 million 1 51%
Pakistan 190 million 58% 34.2 million 1 32%
Bangladesh 162 million 49% 23 million 2 14%
Telecel Global
Burundi 11 million 24% 1.2 million 1
Central African Republic
5 million 19% 0.4 million 1 2%
Zimbabwe 13 million 56% 1.5 million 2
Canada 34 million 70% 0.4 million n/aEquity
Consolidation

Orascom Telecom Holdings Annual Report 2011Orascom Telecom Holdings Annual Report 2011 0706
A year of progress
Strategic Milestones
Janu
ary
2011
Orascom Telecom Holdings Annual Report 2011
Letter from the Chairman and Chief Executive
Jo Lunder, Chairman,“Given the strategic importance of Orascom Telecom Holding after the successful merger between VimpelCom Ltd. and Wind Telecom, I am very excited to have been appointed Chairman of the company. Our focus will be on executing our operational strategy which will deliver an increase in cash flows through driving profitable growth, operational excellence and capital efficiency.
Ahmed Abou Doma, Chief Executive Officer,“After an incredibly exciting year, Orascom Telecom ends 2011 poised to capture the growth momentum across its dynamic markets. With our operators showing impressive growth for 2011, Orascom Telecom now counts over 78 million customers, an increase of almost 13% compared to the closing base of 2010. While the depreciation of local currencies in Algeria, Pakistan, Bangladesh and Burundi impacted US dollar revenues for the quarter, performance indicators show expansion and development in most of our operations. Additionally, EBITDA growth surpassed revenue growth in most operations as a result of our focus on driving profitable growth, as well as our operational excellence and capital efficiency programs.
In Algeria, OTA continues to lead the market with a growth in subscribers of 10% over the course of 2011. While revenues were up by 5% in local currency, EBITDA increased 11% YoY as a result of Opex savings. Despite the healthy margin, the Algerian unit continues to face severe limitations, such as the ban on foreign currency transfers,
June
201
1
0706
which challenges network expansion and capacity needs.
In Pakistan, the subscriber base of over 34 million has contributed to a healthy revenue growth of 4% in local currency terms compared to the previous year. Mobilink’s EBITDA increased 7% YoY, as a result of lower sales costs, leading to an improved EBITDA margin for 2011.
In Bangladesh, banglalink’s aggressive focus on VAS has helped drive subscriber growth. A 23% increase in subscribers was reflected by 19% revenue growth in local currency compared to the same period last year.
Telecel Globe subscribers have exceeded 3 million, with high additions to the networks in Burundi and Zimbabwe.
In Canada, WIND Mobile subscribers have continued to grow, as a result of innovative offerings and an expanded coverage across Canada’s urban centers.”
In my new capacity as Chairman of OTH, I look forward to working closely with Ahmed Abou Doma and the management team to deliver maximum value to all our shareholders and contribute to OTH’s successful role as a major player in the global telecommunications arena.”
OTH Senior Secured Lenders support further financial flexibility from representation, warranties, and covenants related to OTA M
arch
201
1
VimpelCom Ltd. voted in their Special General Meeting in favor of the combination with WIND TELECOM, OTH’s parent company, to create a new global telecom group
Ap
ril 2
011
OTH’s EGM approves Demerger, Refinancing Plan and Internal Reorganization M
ay 2
011
Appointment of new Chief Executive Officer, Mr. Ahmed Abou Doma
OTH announces the sale of Powercom Ltd. in Namibia to Investec and Nedbank
Successful Refinancing of OTH’s capital structure, through the purchase by VimpelCom in full of the interests of the creditors under the Senior Credit Facility, and the interest of the holder of the Equity Linked Notes followed by the redemption of the High Yield Notes and the termination and close out the hedging transactions
Sep
tem
ber
201
1
Orascom Telecom Bangladesh receives its 2G license renewal guidelines. OTB is to pay approximately BDT 19.8 Billion (equivalent to approximately US$ 263 Million*) over three years as spectrum and license renewal fees. In addition, according to the received guidelines, the validity of the license renewal is for 15 years
Appointment of new Chief Financial Officer, Mr. Khalid Ellaicy
No
vem
ber
201
1
Appointment of new Chairman elected by the Board of Directors, Mr. Jo Lunder
Dec
emb
er 2
011
OTH completes Demerger after receiving approval from the Egyptian Financial Supervisory Authority. As a result of the Demerger, during November and December 2011, ownership of the Spin-Off Assets were transferred from OTH to Orascom Telecom Media and Technology (OTMT)O
cto
ber
201
1

Orascom Telecom Holdings Annual Report 2011Orascom Telecom Holdings Annual Report 2011 0908
Business review
Financial Data
FY 2010 FY 2011
Inc/(dec)Dec 2011 vs.
Dec 2010
Revenues (DZD bn) 129 136 5.4%
EBITDA (DZD bn) 73 80 9.6%
EBITDA Margin 56.6% 58.8% 2.2p.p
Capex (US$ m) 90 40 (56%)
Operational Data
Dec 2010 Dec 2011
Inc/(dec)Dec 2011 vs.
Dec 2010
Subscribers 15,087,393 16,595,233 10.0%
Market Share 57.6% 55.5% (2.1%)
ARPU (DZD) (3 months) 724 673 (7.0%)
MOU (3 months) 288 278 (3.5%)
Churn (3 months) 5.7% 5.5% (0.2) p.p
Key priorities
• Balanced value pricing strategy
• Focus on data opportunity
• Consolidate Djezzy brand leadership and strengthen emotional bonding with customers
• Increase quality and control over the distribution channel
• Define leaner site configurations
Company Strategy
OTA’s main focus during 2011 has been on maintaining company value through key strategic pillars. These strategic pillars mainly focus on Value Segmentation, Distribution Control, Operational Excellence, New Revenue Streams & Assets Monetization, Control of Regulatory Risks, and finally retaining our key staff members as well as introducing new talent development programs.
The year in review
Brand
Orascom Telecom Algeria SPA (“OTA”) operates a GSM network in Algeria and provides a range of prepaid and postpaid products encompassing voice, data and multimedia, using the corporate brand “Orascom Telecom Algerie” and the dial commercial brand of “Djezzy” and “Allo”. OTA was awarded the second GSM license in Algeria in 2001 and launched its operations in February 2002. OTA commenced its operations under the brand “Djezzy” and introduced a second prepaid brand “Allo” in August 2004. Despite having launched its GSM operation approximately three years after the launch by the incumbent, Algerian Mobile Network (“AMN” conducting business under the brand name “Mobilis”), OTA was able to rapidly grow into Algeria’s leading and preferred telecommunications operator.
Market share
During 2011 OTA succeeded in managing to the best of its ability a very challenging year amidst extreme and adverse conditions, closing with 16.6m subscribers, maintaining its market leadership position with a 56% market share, controlling the largest distribution network with 20,000 POS selling SIM cards and over 65,000 selling airtime across all 48 Wilayas. During 2011 competition has intensified in form of network roll-out, channel incentives, consumer pull activities and BTL activities, compensating for the resulting gap out of OTA’s blockage situation.
Regulatory environment
The Algerian telecommunication regulator (ARPT) continues to classify OTA as a dominant operator and hence applying much tighter rules in evaluating its proposed tariffs and promotions compared to the other two operators. The regulator introduced new promotional rules during 1Q 2011, with respect to the duration of prepaid promotions, which were reduced from one month to fifteen days, and with respect to the required time period between prepaid promotions within any given month.
Algeria
Success Story
During 2011 OTA continued to reinforce its brand leadership through several new initiatives launched during the year. Main actions undertaken were the launch of a new communication platform and campaign for High Value Customers supported by new postpaid offers, the consolidation of OTA brand architecture supported by a national equity campaign and several campaigns during major yearly festivities, a leadership campaign (Being number one) reinforcing OTA’s leadership on network, products and customer relationship, as well as the launch of new products and services like Scoop or Ring Back Tones. OTA also focused on capturing leadership on the digital media front through targeting the online community by improved presence on social media such as Facebook and YouTube. Finally, OTA launched a new yearly initiative called “Prodiges” aiming to promote young Algerian talents active in all disciplines (music, cinema, writing, sport, dance, entrepreneurship) involving famous Algerian ambassadors (like Yasmina Khadra) and broadcasted on radio, billboard and press.
Leveraging Revenue Streams
Voice
At close to 100% penetration, subscriber growth in the mobile market has slowed considerably, and the attention is shifting to maintaining or improving the average revenue per user (ARPU), which has continued to decline under intensifying price competition. New postpaid pricing plans (Control 900 & 1900) were launched during this first half of 2011 supported by an initial 50% reduction in subscription fee and the first monthly fee. Other promotions included a recharge bonus for the “Allo” prepaid product. In the future, OTA’s main focus will be to reinforce the segmented approach.
Value Added Services
During 2011 OTA’s focus was on launching new products as well as improving the performance of current top value added service. OTA distinguished itself in the marketplace through the launch of the Arabic version of “Scoop”, OTA information services as well as the re-launch of “Ranati”, the ring back tone service, through a strong communication campaign. Finally a large SMS educational campaign was launched to increase SMS penetration among non-users, the campaign leveraged on a “free SMS” upon recharge promotion and was communicated through all media channels, including TV.
Data
In a market where voice and 2G services are saturated, OTA has entered the underdeveloped internet market by launching basic mobile data services. The licensing of a third generation (3G) spectrum has been delayed, which has made it difficult for OTA to fully compete in the broadband sector. However, 3G licenses are now expected to be issued in 2012.
Opportunities for the Future
Algeria has resolutely embarked on the process of developing a digital economy based on the knowledge and the integration of IT and communication technologies in all the aspects of daily life. It is therefore expected that the high speed mobile internet that will be brought by 3G mobile telephony will highly contribute to spreading the usage of IT and communication technologies. Future opportunities will come from mobile broadband and mobile internet services in the long run, while in the medium term opportunities lie in connectivity and the low penetration rate given by the fixed line operator (Algerie Telecom).
Orascom Telecom Holdings Annual Report 2011Orascom Telecom Holdings Annual Report 2011 1110
Success Story
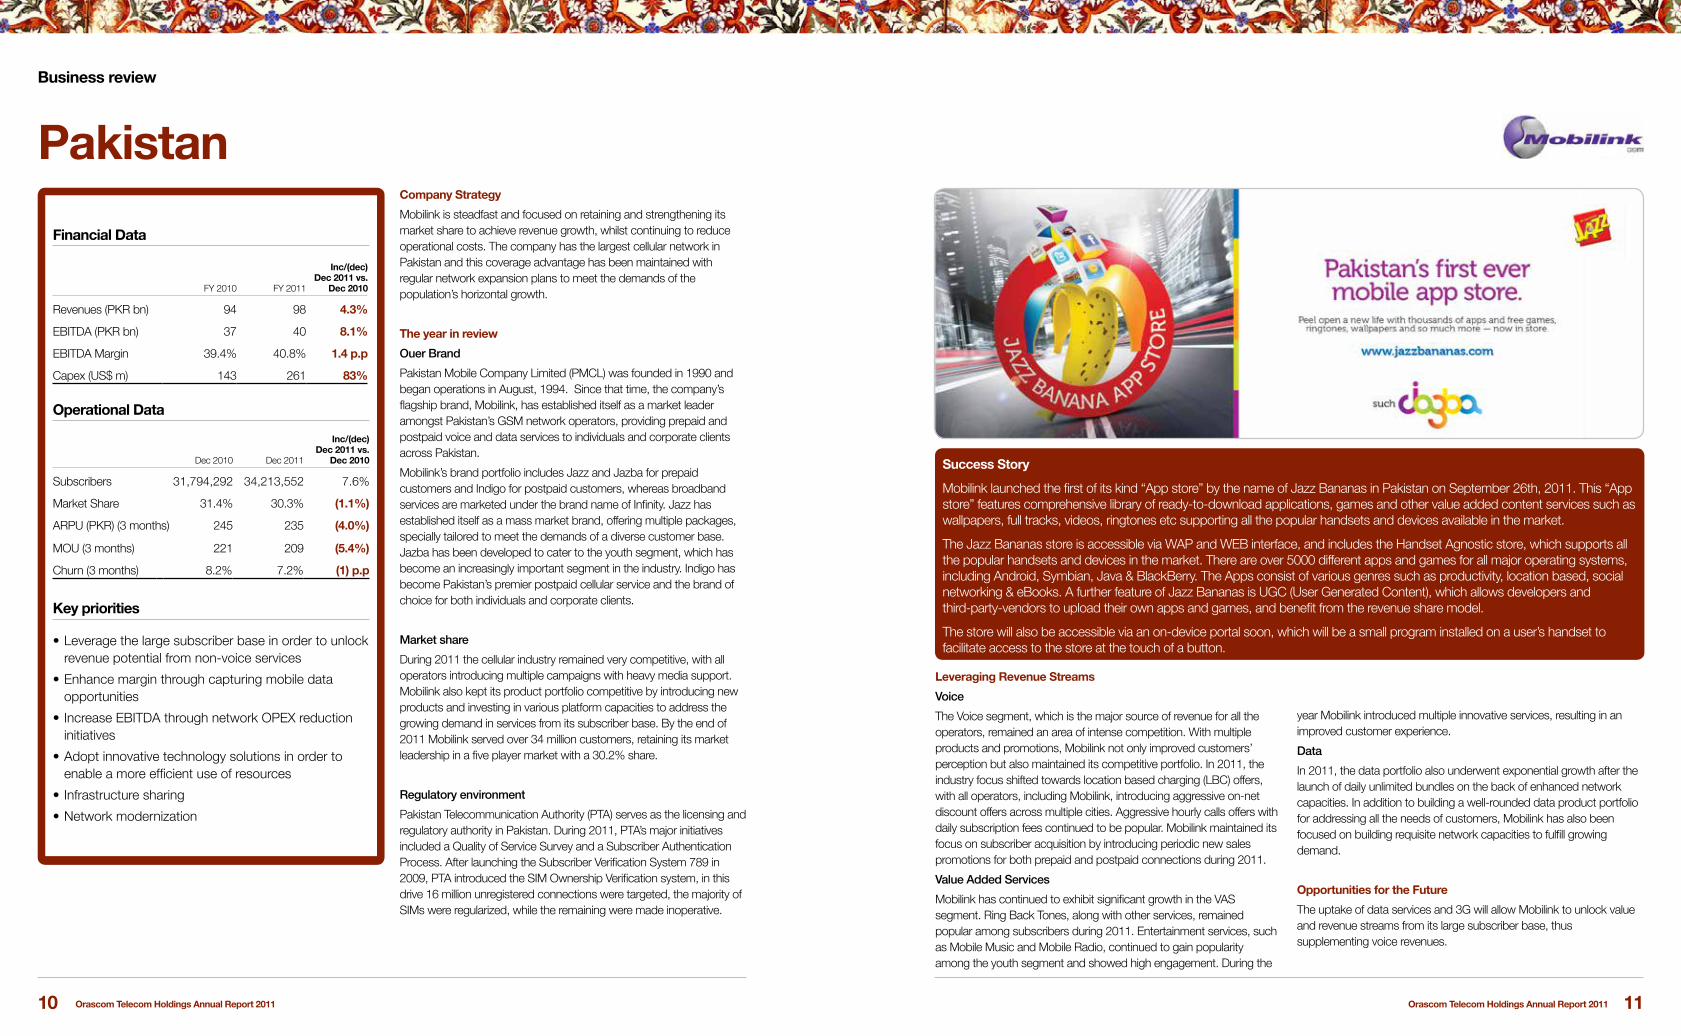
Mobilink launched the first of its kind “App store” by the name of Jazz Bananas in Pakistan on September 26th, 2011. This “App store” features comprehensive library of ready-to-download applications, games and other value added content services such as wallpapers, full tracks, videos, ringtones etc supporting all the popular handsets and devices available in the market.
The Jazz Bananas store is accessible via WAP and WEB interface, and includes the Handset Agnostic store, which supports all the popular handsets and devices in the market. There are over 5000 different apps and games for all major operating systems, including Android, Symbian, Java & BlackBerry. The Apps consist of various genres such as productivity, location based, social networking & eBooks. A further feature of Jazz Bananas is UGC (User Generated Content), which allows developers and third-party-vendors to upload their own apps and games, and benefit from the revenue share model.
The store will also be accessible via an on-device portal soon, which will be a small program installed on a user’s handset to facilitate access to the store at the touch of a button.
Business review
Financial Data
FY 2010 FY 2011
Inc/(dec)Dec 2011 vs.
Dec 2010
Revenues (PKR bn) 94 98 4.3%
EBITDA (PKR bn) 37 40 8.1%
EBITDA Margin 39.4% 40.8% 1.4 p.p
Capex (US$ m) 143 261 83%
Operational Data
Dec 2010 Dec 2011
Inc/(dec)Dec 2011 vs.
Dec 2010
Subscribers 31,794,292 34,213,552 7.6%
Market Share 31.4% 30.3% (1.1%)
ARPU (PKR) (3 months) 245 235 (4.0%)
MOU (3 months) 221 209 (5.4%)
Churn (3 months) 8.2% 7.2% (1) p.p
Key priorities
• Leverage the large subscriber base in order to unlock revenue potential from non-voice services
• Enhance margin through capturing mobile data opportunities
• Increase EBITDA through network OPEX reduction initiatives
• Adopt innovative technology solutions in order to enable a more efficient use of resources
• Infrastructure sharing
• Network modernization
Company Strategy
Mobilink is steadfast and focused on retaining and strengthening its market share to achieve revenue growth, whilst continuing to reduce operational costs. The company has the largest cellular network in Pakistan and this coverage advantage has been maintained with regular network expansion plans to meet the demands of the population’s horizontal growth.
The year in review
Ouer Brand
Pakistan Mobile Company Limited (PMCL) was founded in 1990 and began operations in August, 1994. Since that time, the company’s flagship brand, Mobilink, has established itself as a market leader amongst Pakistan’s GSM network operators, providing prepaid and postpaid voice and data services to individuals and corporate clients across Pakistan.
Mobilink’s brand portfolio includes Jazz and Jazba for prepaid customers and Indigo for postpaid customers, whereas broadband services are marketed under the brand name of Infinity. Jazz has established itself as a mass market brand, offering multiple packages, specially tailored to meet the demands of a diverse customer base. Jazba has been developed to cater to the youth segment, which has become an increasingly important segment in the industry. Indigo has become Pakistan’s premier postpaid cellular service and the brand of choice for both individuals and corporate clients.
Market share
During 2011 the cellular industry remained very competitive, with all operators introducing multiple campaigns with heavy media support. Mobilink also kept its product portfolio competitive by introducing new products and investing in various platform capacities to address the growing demand in services from its subscriber base. By the end of 2011 Mobilink served over 34 million customers, retaining its market leadership in a five player market with a 30.2% share.
Regulatory environment
Pakistan Telecommunication Authority (PTA) serves as the licensing and regulatory authority in Pakistan. During 2011, PTA’s major initiatives included a Quality of Service Survey and a Subscriber Authentication Process. After launching the Subscriber Verification System 789 in 2009, PTA introduced the SIM Ownership Verification system, in this drive 16 million unregistered connections were targeted, the majority of SIMs were regularized, while the remaining were made inoperative.
Pakistan
Leveraging Revenue Streams
Voice
The Voice segment, which is the major source of revenue for all the operators, remained an area of intense competition. With multiple products and promotions, Mobilink not only improved customers’ perception but also maintained its competitive portfolio. In 2011, the industry focus shifted towards location based charging (LBC) offers, with all operators, including Mobilink, introducing aggressive on-net discount offers across multiple cities. Aggressive hourly calls offers with daily subscription fees continued to be popular. Mobilink maintained its focus on subscriber acquisition by introducing periodic new sales promotions for both prepaid and postpaid connections during 2011.
Value Added Services
Mobilink has continued to exhibit significant growth in the VAS segment. Ring Back Tones, along with other services, remained popular among subscribers during 2011. Entertainment services, such as Mobile Music and Mobile Radio, continued to gain popularity among the youth segment and showed high engagement. During the
year Mobilink introduced multiple innovative services, resulting in an improved customer experience.
Data
In 2011, the data portfolio also underwent exponential growth after the launch of daily unlimited bundles on the back of enhanced network capacities. In addition to building a well-rounded data product portfolio for addressing all the needs of customers, Mobilink has also been focused on building requisite network capacities to fulfill growing demand.
Opportunities for the Future
The uptake of data services and 3G will allow Mobilink to unlock value and revenue streams from its large subscriber base, thus supplementing voice revenues.

Orascom Telecom Holdings Annual Report 2011Orascom Telecom Holdings Annual Report 2011 1312
Business review
Financial Data
FY 2010 FY 2011
Inc/(dec)Dec 2011 vs.
Dec 2010
Revenues (BDT bn) 32 38 18.8%
EBITDA (BDT bn) 9 13 44.4%
EBITDA Margin 28.1% 34.2% 6.1 p.p
Capex (US$ m) 235 161 (31%)
Operational Data
Dec 2010 Dec 2011
Inc/(dec)Dec 2011 vs.
Dec 2010
Subscribers 19,327,005 23,753,552 22.9%
Market Share 28.5% 27.9% (0.6%)
ARPU (BDT) (3 months) 149 140 (5.8%)
MOU (3 months) 221 207 (6.3%)
Churn (3 months) 46.9% 5.4% 0.8 p.p
Key priorities
• Tap into mobile data opportunities
• Leverage large base by unlocking mass-market value potential
• Apply a dual market strategy providing tailored services for high-end segments, as well as optimized services for lower-end segments in the market
• Capture technology synergies by introducing and swapping into outdoor sites and implementing innovative hybrid solutions
• Site sharing
Company Strategy
Orascom Telecom Bangladesh Limited (OTB) is a GSM telecommunications operator in Bangladesh and providing wide range of voice and data services.
OTB’s marketing strategy focused on targeting different consumer segments with specially designed products and services that are tailored to the needs of these segments.
OTB aggressively enhanced its network since inception, and has consistently increased its capital expenditures to build an efficient and dependable network.
The year in review
Brand
OTB provides its services under two brand names: “banglalinkTM” and “icon”. OTB’s prepaid brand, “banglalink desh”, is perceived as the best prepaid package in the country with innovative tariff and value for money features. “banglalink business”, “banglalink SME” and “banglalink PCO” cater the needs of the business segment including the thriving SME sector where OTB has been the pioneer in the country. The premium brand ‘icon’ has already created awareness and acceptability within its target market.
Market share
Telecommunications services in Bangladesh are provided by 5 GSM and 1 CDMA operators, and 8 fixed-line operators. Among the GSM operators, OTB stands as the second largest operator.
As of December 31st, 2011, OTB’s network covered 97% population of Bangladesh with 23.75 million subscribers and a market share of 27.9%. This phenomenal growth was attributable to overwhelming response of subscribers to OTB’s innovative products, strong brand equity, extensive distribution network, and continuous improvement in service quality.
Telenor Mobile Communications AS owns 55.8% shares of Grameenphone the only operator in Bangladesh which is a publicly listed company. Axiata Bangladesh Ltd (Robi), the third largest player is a joint venture company in which Axiata holds 70% and NTT DoCoMo holds a 30% stake. Teletalk Bangladesh Ltd is the state owned mobile operator while Airtel Bangladesh is a subsidiary of Bharti Airtel Limited. Pacific Bangladesh Telecom Ltd. (“Citycell”), is the only CDMA operator, in which SingTel acquired a minority interest. The Bangladesh Telecommunications Company Limited (“BTCL”) is the incumbent state-owned fixed-line operator.
Bangladesh
Success Story
OTB is a pioneer in launching mobile financial services in Bangladesh, being the first operator in South Asia to launch international remittance over mobile. OTB won an award from the International Association of Money Transfer Networks (IAMTN) for this first-ever service in Bangladesh. OTB also launched several other mobile financial services, such as train ticketing, utility bill pay, concert ticketing and domestic remittance services with Bangladesh Post Office.
OTB received several awards in 2011. ‘Krishi Bazaar 2474’ has won the World Communication Award 2011, while OTB Mobile Cash service won the mBillionth South Asia Award 2011. In addition, OTB won the ICMAB (an association of leading professional accountants’ of Bangladesh) best corporate award 2011 for publication of its annual report 2010.
Regulatory environment
2G licenses awarded by the Government of Bangladesh to four mobile operators including OTB, expired on 11 November 2011. OTB along with Grameenphone, Axiata and Pacific Telecom deposited the license renewal fees within the stipulated payment schedule. The Government of Bangladesh is currently processing the renewal of the 2G licenses of the four operators, including OTB.
Leveraging Revenue Streams
Voice
Under the flagship brand “banglalink desh”, the prepaid products have been introduced with features such as flat tariff, 1 sec pulse and long call benefit, to address different usage needs of the 2.2 million prepaid consumers. “banglalink business”, “banglalink SME” and “banglalink PCO” cater to the needs of the business segment, including the thriving SME sector. In 2011, OTB introduced “banglalink inspire”, targeting different professional groups of society with a variety of special features.
Value Added Services
OTB subscribers enjoy a wide range of innovative and superior services including caller ring-back tone, music station, voice portal, voice chat, news alerts etc. In recent years, OTB has been leading the industry in offering new and enhanced services for business customers, namely premium field force locator, corporate SMS broadcast and mobile advertising to name a few examples.
Opportunities for the future
OTB has started to strengthen it’s footsteps by consolidating a nationwide EDGE/GPRS network with competitive mobile internet products, aiming to monetize small screen mobile internet usage. Moreover, OTB’s value-added service continues be a value driver for maintaining and enhancing the overall value proposition of OTB’s product offering.

Orascom Telecom Holdings Annual Report 2011Orascom Telecom Holdings Annual Report 2011 1514
Business review
Financial Data
FY 2010 FY 2011
Inc/(dec)Dec 2011 vs.
Dec 2010
Revenues ($US m) 102 94 (7.8%)
EBITDA ($US m) 24 8 (66.7%)
EBITDA Margin 23.5% 8.5% (15.0) p.p
Operational Data
Dec 2010 Dec 2011
Inc/(dec)Dec 2011 vs.
Dec 2010
Subscribers 2,974,000 3,140,000 5.6%
Key priorities
• Derive profitability by reaching the critical mass in the underlying markets while capitalizing on our market leadership
• Maintain value-driven pricing
• Increase coverage footprint through cautious investment in rural areas by deploying low CAPEX sites suitable for rural environments
• Introduce low-cost outdoor sites in order to manage CAPEX demands
• Employ hybrid solutions
Telecel CARTelecel is the market leader in CAR with an approximate market share of 50%. It operates a GSM/GPRS/EDGE/WIMAX network. For historical reasons Telecel holds a special place in Central Africans’ hearts. This bond is reflected in the company’s communication with the use of the emotive phrase “Biani, Biani”, which translated from Sango is “all of us, together”. Among all four international mobile phone operators in CAR, Telecel boasts the biggest VAS portfolio, the largest network coverage and the most extensive distribution network. With its recent rebranding to the color red, it has also become the country’s most visible network, reflecting its dominant market position. Having now consolidated its lead in the capital Bangui, Telecel CAR is preparing for the next stage of its growth; developing the vast and underserved rural market. With only 20% penetration, there is still plenty of room for growth.
leo BurundiU-Com Burundi S.A. trading under the brand name ‘leo’ is the leading telecommunications operator in Burundi. It started providing analog services in 1993 and moved to GSM protocol in the year 2000. GPRS/EDGE data services were launched commercially in 2009 along with WIMAX broadband (fixed internet) services. ‘Leo’ has launched a 3G network in October 2011 along with fiber-optic backhaul connectivity in its strategic drive to commercialize broadband data services to all segments (mass-market as well as SME and corporate) at competitive prices in this landlocked country.
‘leo’ has a subscriber base of 1.2 million customers with the highest market share amongst 5 other mobile and fixed operators of 59%. Current GSM (SIM) penetration is 25% and therefore there is still significant scope for growth especially in rural areas and leo has firmly positioned itself as the telecommunications operator of choice in terms of coverage, accessibility, products, services, customer care and brand values.
Telecel Globe
Telecel ZimbabweTelecel Zimbabwe has been part of the Orascom Group since 2000. It currently operates a GSM/GPRS/EDGE/3G network. Telecel Zimbabwe serves a growing customer base and constantly demonstrates its core values of simplicity, value for money, innovation and trust and care for which it has become well known for in the Zimbabwean market. It’s attractive voice and data bundle offerings, effective marketing communications, improved distribution network, enhanced network quality and coverage all complement each other and help in reaching customers everywhere and in providing them with world-class telecommunication services. TZIM currently operates in a three-player market and at the end of 2011 held the 2nd position with a market share of 22.2% and total subscriber base of 1.52 million customers. With a fairly low market penetration at the end of 2011 (56%), growth still lies ahead! TZIM’s focus is to bring smart choices to customers with best value for money offers in a young, friendly and responsible way. The opportunities for the future reside in strengthening our distribution network to fuel the anticipated growth, developing segmentation capabilities to grow the value from our existing customers, capturing the data opportunity through 3G, enhancing the brand image to further strengthen the customer bond, and to continue to roll-out our network.
Success Story
Orascom Telecom’s three African operators are key players in the efforts to make mobile data services available to the masses in the countries where they operate.
The Central African Republic and Burundi were the first operators to offer high speed Internet using WIMAX. Telecel Zimbabwe was the first to offer 3G services, followed by leo Burundi. Telecel Central Africa currently provides mobile Internet using GPRS / EDGE but will soon be joining its African sister companies offering 3G.
3G has proved to be extremely popular and Telecel Zimbabwe and leo Burundi are seeing strong demand for their 3G
offerings. Between November 2011 and March 2012, data revenues for both these operations combined have experienced an amazing four-fold increase!
Both Zimbabwe and Burundi gained access to the sea cables in 2010-2011 and CAR is to connect to the Central African backbone by mid-2013. As a result, the cost of bandwidth has fallen dramatically. Along with cheaper high-speed data via the undersea cables, low cost smart phones are being developed, making it easier for middle class Africans to access the Internet and connect to the digital world.

Orascom Telecom Holdings Annual Report 2011Orascom Telecom Holdings Annual Report 2011 1716
Business review
Operational Data
Dec 2010 Dec 2011
Inc/(dec)Dec 2011 vs.
Dec 2010
Subscribers 232,641 403,000 73.2%
ARPU (CAD) (3 months) 29.0 26.4 (9.0%)
Regional strategy
dam aut hit a volesto ma nime si culparunti doluptae resequas ius, alibus sequam, ent, ad qui dis eum ime que omnis quod quatquos sit vitatusam fuga. Nam faccuscipis aliti id qui dolorum, volenist expercipis sunt offic totae expe volut vidusci ligent.
Key priorities
• Capture market share
• Expand network coverage
• Grow distrubution network
• Continue providing value for money services
Company Strategy
WIND continued to play a significant role in shaping the wireless market in Canada, WIND’s adjusted its strategy targeting the “Value Plus” customer segment in the Canadian market offering a variety of voice services, including a mix of simple and feature-rich service plans, typically with an unlimited voice component.
WIND continued its commitment to the prepaid market in Canada, but reflected a conscious and disciplined mandate not to “race to the bottom” following unreasonably aggressive pricing waves adopted by low end market entrants proven to have no financial feasibility and in fact unsustainable in the mid-term.
Also, fixed line businesses operate under numerous brands with services including long distance, operator services, billing clearinghouse services, reservation-less conferencing and VoIP to small and medium-sized businesses.
WIND successfully executed on its new postpaid strategy, “Value Plus”, by extending its handset subsidy program (“TAB”) to a new TAB+ program. This new program includes larger subsidies and a broader range of high-end Android, Blackberry and Windows 7 handsets. The effect has been positive, as greater than 50% of WIND Canada’s gross additions in Q4 2011 were postpaid sales.
The year in review
Brand
WIND’s re-launched “WIND Mobile” brand targeting the “Value Plus” customer segment in the Canadian market.
Market share
Wind Mobile launched in December 2009, by the end of 2011 it had a market share of 2.0% of licensed population and 4.28% market share normalized to its coverage. The Canadian market has primarily been served by three large facilities-based providers, Rogers Communications, which had 36% of the wireless subscribers in 2011, followed by Bell Group at (29%), TELUS Communications Company (28%), and other providers, principally MTS Allstream and SaskTel. In 2010, three other new service providers commenced operations to offer mobile service using spectrum acquired as part of the AWS auction in 2008; Mobilicity, Public Mobile and Videotron.
Regulatory environment
Two major announcements from the Canadian Government came in Q1 2012 These are:
• Policy regarding the upcoming auction (expected to take place in H1 2013) of 700MHz spectrum; and
• Long-awaited decision to lift (for at companies with less than 10% market share) the existing restrictions on non-Canadian ownership and control of telecommunications companies operating in Canada.
Canada
Leveraging Revenue Streams
Data
WIND offers a variety of data products and value added services ranging from mobile internet, mobile broadband data sticks, blackberry and social media add-ons.
Value Added Services
Value added services include text, multimedia messaging, web portal, voice mail and call control features, and premium apps through various content providers.
Opportunities for the future
WIND will continue its focus on network rollout with a clear goal to expand coverage, increase quality, and data speed to support its Value Plus strategy. Special focus is assigned to growing distribution network on the dealer and indirect channels. WIND is exploring a number of strategic alliances to strengthen its position as Canada’s fourth national player.
Success Story
WIND’s success has been built on simple, transparent, and feature-rich postpaid and prepaid talk, text, and data plans that offering unlimited features with no term contracts. WIND’s re-launched “WIND Mobile” brand targeting “Value Plus” customer segment in the Canadian market. The successful execution of its new strategy increased the share of postpaid voice subscribers to +60% of net additions. The strategy shift entails carefully managing prepaid segment economics. WIND managed a 73% growth in 2011 Subscribers base over 2010 in its second year of operations after increasing its coverage reaching more than 12.7 million people (37% of the total population and 47% of the ‘licensed’ population), WIND covers five of the top six populated areas in Canada.

Orascom Telecom Holdings Annual Report 2011Orascom Telecom Holdings Annual Report 2011 1918
CSR
Corporate Responsibility Orascom Telecom Holding S.A.E’s approach to corporate social responsibility is based on decentralization and the consequential delegation of a number of tasks. Decentralization has been a key element of our corporate culture and is also the basis of our success in implementing group recommended social, governance and environmental initiatives that are tailored to meet local market needs.
Over the past two years, we have made progress on our sustainability priorities by improving the energy efficiency of our network and increasing our paper-less billing methods across our operating companies. We have also completed our environmental management 14001 and occupational health and safety 18001 systems for OTH headquarters in Cairo.
In 2011 Orascom Telecom Holding S.A.E and its local operating companies achieved a number of awards. Orascom Telecom was ranked third on the EGX ESG index for 2011.
The assessment was based on our environmental, social and corporate governance activities disclosed through our annual sustainability report. In 2011, banglalink received the World Communication Award for the banglalink krishi bazaar service.
Orascom Telecom is proud to be a pioneer in the industry’s efforts to improve responsible business practices in emerging markets. We continue to support the United Nations Global Compact and its principles on human rights, labor rights, the environment and anti-corruption. We participate in the national quarterly roundtable discussions and our annual sustainability report meets the criteria of the UN global compact communication on progress requirements.
For more information, please read our annual sustainability report available on www.otelecom.com /responsibility
Social Investment
Orascom Telecom provides support to programs and projects that contribute to the social development and improves the standard of living through direct financial donations, in kind, as well as employee donations and volunteering. Across our operating companies and through our products and social investment program, we contribute to the achievement of the United Nations Millennium Development Goals. Below are some examples.
Table 1: Total Subscribers1
MDG Goal Country Example of our Contribution
Eradicate extreme poverty
Bangladesh & Zimbabwe
The launch of mobile-banking is helping people access to banking service anytime and anywhere which will boost rural economy and national output by scaling up money circulation in villages in Bangladesh and Zimbabwe.
Achieve universal primary education Zimbabwe
In Zimbabwe, Burundi and Central African Republic, we have been supporting primary school education by providing bursary schemes and financial support to help students who can’t afford enroll in schools and continue their education.
Promoting gender equality and empower women Pakistan
In partnership with UNESCO Mobilink in Pakistan has been empowering women and young ladies through the provision of literacy to adolescent girls using mobile phones.
Reduce child mortality Pakistan
Mobilink has partnered with the Polio Eradication Fraternity including UNICEF and Ministry of Health, to help create awareness of this disease.
Improve maternal health Egypt
Our services can improve maternal healthcare services considerably especially in remote areas where access to health units is difficult. Mobinil has piloted a new service “Mobile baby” in partnership with Great Connections.
Combat HIV/AIDS, malaria and other diseases Burundi
Leo Burundi provides direct financial donation to children schools and orphanages. The target beneficiaries are children whom are whose parents are HIV positive.
Ensure Environmental sustainability
Across the Group
Across our operations, we reduce our carbon emissions and energy consumptions by using alternative energy generation techniques such as solar power and wind energy.
Egypt- Orascom Telecom Holding
Orascom Telecom sponsors Cairo University to compete in SIFE World Cup
Orascom Telecom Holding S.A.E proudly sponsored the SIFE Egypt team from Cairo University to compete in SIFE 2011 World Cup. The competition took place in Kuala Lumpur, Malaysia, October 3rd -5th where 40 national champion university teams representing 40 countries presented their civic engagement projects.
SIFE (Students In Free Enterprise) an international non-profit organization that brings together the leaders of today and tomorrow to create a better, more sustainable world through the positive power of business. Founded in 1975, SIFE has active programs on more than 1,500 college and university campuses in over 40 countries. For more information contact SIFE World Headquarters at 417-831-9505 or visit www.sife.org.
Through SIFE, students around the world are discovering that “doing well” and “doing good” can be accomplished simultaneously throughout college and career. More than 400 global business leaders assembled at the Kuala Lumpur Convention Center October 3-5 to evaluate the outreach projects of 40 national champion teams. The teams were judged on how successful they’ve been at using business solutions to create economic opportunity for others.
Pakistan – Mobilink
Flood Relief Efforts for 2011
Mobilink in collaboration with the Armed Forces and Torchbearers reached out to 7000 families in flood hit regions of Sindh with essential food items. Mobilink ration bags were designed to feed a family of 7 for 15 days. Through this initiative, Mobilink provided food and clean drinking water to about 50,000 people. Mobilink also distributed 126,000 liters of clean drinking water
Mobilink torchbearers and franchises helped identify areas that were in need of help and were active in distributing ration items in those areas with the help of the armed forces. As a result Mobilink was able to reach out to villages where no aid had been distributed and villages which were ignored by traditional NGOs and international aid agencies.
Mobilink was the first company to set up an SMS code to raise funds from external sources for flood relief. Mobilink also launched an internal
fundraising drive. Mobilink Employees at all levels donated generously from their salaries and we were able to raise Rs. 700,000 in the first four weeks of fundraising.
While many other organizations just donated funds, Mobilink not only donated funds and goods but the time of its personnel and encouraged its staff to volunteer in the field, to visit places and identify underserved regions. Mobilink torchbearers sacrificed over one thousand hours towards flood relief including weekends.
Mobilink remains committed to providing relief to flood victims. With funds raised by employees and commitments made by the management, Mobilink is going to expand its flood relief efforts in the near future. Mobilink will continue to provide relief goods and will also be constructing homes for people who lost their homes to the floods in Sindh.
Burundi – Leo
Education Assistance Program
Leo Burundi’s Educational Assistance Program began in March 2009 and it has benefited 1643 schoolchildren. The programme provides assistance with the education of disadvantaged children, including orphans and children with disabilities, channelling its assistance through eight institutions. The programme contributes to the educational development of children in both urban and rural communities who are unable to afford basic educational facilities. Assistance includes school fees, uniforms, and stationary items, such as pencils and exercise books, and equipment for handicapped students.
The institutions to which Leo Burundi has provided assistance are: Association RET (Association Regard à l’Enfant Traumatise), which takes care of children traumatised by the war in Burundi, Association ASENBU (Association pour L’Enfant Non Acompagné de Buyengero), which takes care of children in the Buyengero region affected by the war, École EPHPHATA, which is a school in Bujumburu for the deaf and mute, CESDA (Centre Spécialisé pour Deficients Auditifs), which is a school in Gitega province for children who are deaf or have hearing difficulties, Ecole KANURA, a school for the blind, Ecole RUMURI, which is a school for the blind in Gitega Province, Association Solidarité pour Aider les Sinistrés Burundais, and Centre Handicapé de Kiganda.
Orascom Telecom Holdings Annual Report 2011Orascom Telecom Holdings Annual Report 2011 2120
Board of directors
Experienced leadership
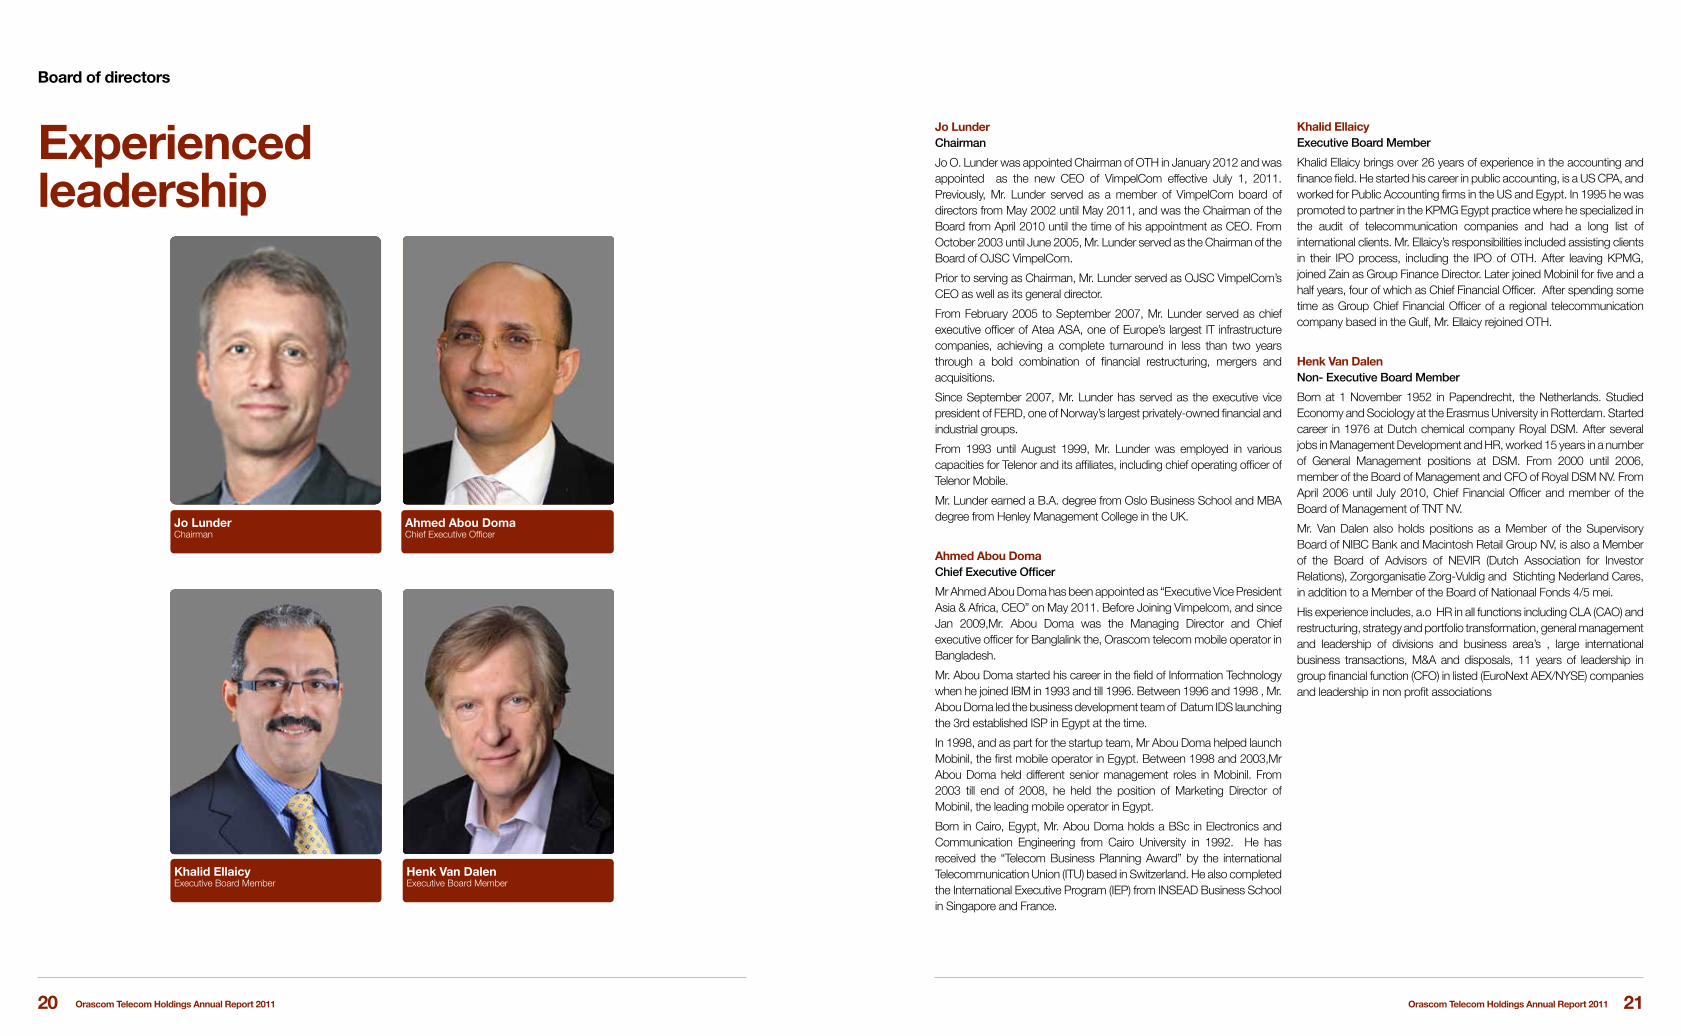
Jo Lunder Chairman
Ahmed Abou Doma Chief Executive Officer
Jo Lunder Chairman
Jo O. Lunder was appointed Chairman of OTH in January 2012 and was appointed as the new CEO of VimpelCom effective July 1, 2011. Previously, Mr. Lunder served as a member of VimpelCom board of directors from May 2002 until May 2011, and was the Chairman of the Board from April 2010 until the time of his appointment as CEO. From October 2003 until June 2005, Mr. Lunder served as the Chairman of the Board of OJSC VimpelCom.
Prior to serving as Chairman, Mr. Lunder served as OJSC VimpelCom’s CEO as well as its general director.
From February 2005 to September 2007, Mr. Lunder served as chief executive officer of Atea ASA, one of Europe’s largest IT infrastructure companies, achieving a complete turnaround in less than two years through a bold combination of financial restructuring, mergers and acquisitions.
Since September 2007, Mr. Lunder has served as the executive vice president of FERD, one of Norway’s largest privately-owned financial and industrial groups.
From 1993 until August 1999, Mr. Lunder was employed in various capacities for Telenor and its affiliates, including chief operating officer of Telenor Mobile.
Mr. Lunder earned a B.A. degree from Oslo Business School and MBA degree from Henley Management College in the UK.
Ahmed Abou DomaChief Executive Officer
Mr Ahmed Abou Doma has been appointed as “Executive Vice President Asia & Africa, CEO” on May 2011. Before Joining Vimpelcom, and since Jan 2009,Mr. Abou Doma was the Managing Director and Chief executive officer for Banglalink the, Orascom telecom mobile operator in Bangladesh.
Mr. Abou Doma started his career in the field of Information Technology when he joined IBM in 1993 and till 1996. Between 1996 and 1998 , Mr. Abou Doma led the business development team of Datum IDS launching the 3rd established ISP in Egypt at the time.
In 1998, and as part for the startup team, Mr Abou Doma helped launch Mobinil, the first mobile operator in Egypt. Between 1998 and 2003,Mr Abou Doma held different senior management roles in Mobinil. From 2003 till end of 2008, he held the position of Marketing Director of Mobinil, the leading mobile operator in Egypt.
Born in Cairo, Egypt, Mr. Abou Doma holds a BSc in Electronics and Communication Engineering from Cairo University in 1992. He has received the “Telecom Business Planning Award” by the international Telecommunication Union (ITU) based in Switzerland. He also completed the International Executive Program (IEP) from INSEAD Business School in Singapore and France.
Khalid EllaicyExecutive Board Member
Khalid Ellaicy brings over 26 years of experience in the accounting and finance field. He started his career in public accounting, is a US CPA, and worked for Public Accounting firms in the US and Egypt. In 1995 he was promoted to partner in the KPMG Egypt practice where he specialized in the audit of telecommunication companies and had a long list of international clients. Mr. Ellaicy’s responsibilities included assisting clients in their IPO process, including the IPO of OTH. After leaving KPMG, joined Zain as Group Finance Director. Later joined Mobinil for five and a half years, four of which as Chief Financial Officer. After spending some time as Group Chief Financial Officer of a regional telecommunication company based in the Gulf, Mr. Ellaicy rejoined OTH.
Henk Van Dalen Non- Executive Board Member
Born at 1 November 1952 in Papendrecht, the Netherlands. Studied Economy and Sociology at the Erasmus University in Rotterdam. Started career in 1976 at Dutch chemical company Royal DSM. After several jobs in Management Development and HR, worked 15 years in a number of General Management positions at DSM. From 2000 until 2006, member of the Board of Management and CFO of Royal DSM NV. From April 2006 until July 2010, Chief Financial Officer and member of the Board of Management of TNT NV.
Mr. Van Dalen also holds positions as a Member of the Supervisory Board of NIBC Bank and Macintosh Retail Group NV, is also a Member of the Board of Advisors of NEVIR (Dutch Association for Investor Relations), Zorgorganisatie Zorg-Vuldig and Stichting Nederland Cares, in addition to a Member of the Board of Nationaal Fonds 4/5 mei.
His experience includes, a.o HR in all functions including CLA (CAO) and restructuring, strategy and portfolio transformation, general management and leadership of divisions and business area’s , large international business transactions, M&A and disposals, 11 years of leadership in group financial function (CFO) in listed (EuroNext AEX/NYSE) companies and leadership in non profit associations
Khalid Ellaicy Executive Board Member
Henk Van Dalen Executive Board Member

Orascom Telecom Holdings Annual Report 2011Orascom Telecom Holdings Annual Report 2011 2322
Jeffrey D. McGhieNon- Executive Board Member
Jeffrey D. McGhie is General Counsel of VimpelCom Ltd. Mr McGhie held the position of Vice President, General Counsel of OJSC VimpelCom since June 2007, he served as Chief Legal Officer since March 2006.
Prior to joining VimpelCom, he held the position of associate in the Moscow office of Akin Gump Strauss Hauer & Feld LLP from September 2002 until December 2004, and counsel from January 2005 until March 2006.
From December 1999 until August 2002, Mr. McGhie was an associate at Kirkland & Ellis in Chicago, Illinois.
Mr. McGhie graduated with a B.A.in Russian from Brigham Young University (Provo, Utah USA) in 1995 and received a J.D. magna cum laude and MBA from Indiana University (Bloomington) in 1999 (Bloomington, Indiana USA).
Iskandar Shalaby Non- Executive Board Member
On September 1, 2008 Alex Shalaby was appointed Chairman of the Egyptian Company for Mobile Services (Mobinil) by Board consensus; prior to that he was its President and CEO since 2005.
Shalaby came to Mobinil from Washington, DC where he was AT&T Director for Public Affairs, serving as the company’s link to lawmakers on Capitol Hill and lobbying the executive branch of the U.S. government. He helped in achieving more liberalization of the telecoms sector internationally for the emerging nations of the Middle East, Africa, and Eastern Europe through the relevant bi-lateral and multi-lateral agencies. During these years, he served on the boards of the American Chamber of Commerce becoming its president during the period (1991 – 1992), the Bi-national Fulbright Commission, and Seeds of Peace; he currently chairs the board of Injaz & SIFE in Egypt.
In 1966 Shalaby graduated with a Bachelors of Science degree in Electrical Engineering from the University of Alexandria and earned a Masters of Science degree in Electrical Engineering and Computer Science from San Jose State University in California.
Mohamed Shaker Non- Executive Board Member
Ambassador Shaker is Chairman of the Egyptian Council for Foreign Affairs (ECFA) since its inception in 1999 and again since 2009. As of 2002, he is Chairman of the Board of the Regional Information Technology Institute (RITI). He is also Chairman of the Board of Trustees of the National Center for Middle East Studies since 2006. As of 2009, He was designated member of the Board of The Diplomatic Institute, Egyptian Foreign Ministry.
He is also Chairman of the Board of Trustees of the Sawiris Foundation for Social Development as of 2001. In 2008, he was elected as Chairman of the Board of Trustees of Magdi Yacoub Foundation for Heart Research. As of June 2009, he is a member of the Board of the Nuclear Power Plants Authority.
Ambassador Shaker served as ambassador to the UK, Austria, the IAEA and the UN.
Ambassador Shaker completed his studies as Docteur es Sciences Politiques at the Graduate Institute of International Studies, University of Geneva, in 1975, after having acquired the Licence en Droit (LLB) from Cairo University in 1955. Amb Shaker chaired two major conferences on peaceful uses of nuclear energy and nonproliferation in 1985 and 1987. Among Ambassador Shaker’s major works is a book on The Nuclear Non-Proliferation Treaty.
Elena ShmatovaNon- Executive Board Member
Elena Shmatova has served as Executive Vice President and Chief Financial Officer of OJSC VimpelCom since October 2005. She has also served as Vice President since June 2004 and as Chief Financial Officer of VimpelCom since January 2003. Ms. Shmatova served as Director of Treasury of VimpelCom from March 2002 until January 2003 and as Financial Controller of VimpelCom from December 1999 until March 2002. From 1992 until 1999, Ms. Shmatova served as Deputy Finance Director, Finance Director and Vice President of Finance at the Sprint Communications/GlobalOne Group of companies in Russia. Prior to 1992, Ms. Shmatova served as a Financial Director of “Express Mail Service-Garantpost” and was an economist at the Ministry of Telecommunications of the USSR and the Center of International Accounting of the Ministry of Telecommunications of the USSR.
In June 2010 Elena Shmatova was appointed the General Director of OJSC “VimpelCom” and lead the Russia business unit till December 2011. In January 2012 she joined VimpelCom’s finance team in Amsterdam as Group Director Business Control, Development and M&A.
Ms. Shmatova received a bachelor’s degree in economics from the Moscow Telecommunications University.
Jeffrey D. McGhie Non- Executive Board Member
Iskandar Shalaby Non- Executive Board Member
Mohamed ShakerNon- Executive Board Member
Elena ShmatovaNon- Executive Board Member
Experienced leadership
Board of directors

Orascom Telecom Holdings Annual Report 2011Orascom Telecom Holdings Annual Report 2011 2524
Governance
Committed to the highestglobal standardsThe Company is committed to achieving and maintaining the highest standards of corporate governance. The Company considers effective corporate governance essential to enhancing shareholders’ value and protecting stakeholders’ interests. Accordingly, the Board attributes a high priority to identifying and implementing appropriate corporate governance practices to ensure transparency, accountability and effective internal controls. The Board continued to further its commitment to corporate governance through reviewing existing processes and, where appropriate, developing new ones. The Company substantially complies with the practices enunciated in the Egypt Code of Corporate Governance and will strive to comply with these and other appropriate standers and governance guidelines. The key corporate governance principles and practices are as follows:
The General Assembly The General Assembly (”GA”) of the Company is the ultimate governing body of the Company. In summary, the (”GA”):
• includes all the shareholders of the Company; • takes its decision by voting among shares represented in the meeting. The voting rule is: 1 share = 1 vote for all shares indifferently;• holds at least one ordinary meeting per year and may have an extra-ordinary meeting as needed;• The responsibilities of the GA are based on the laws and Company Statues; • it appoints the board, approves the financial results, appoints the external auditors, and approves dividends distribution. Board of Directors The Board has the responsibility to work to enhance the value of the Company in the interest of the Company and its shareholders. In summary, the Board:
• is engaged in active and continuous strategic planning and approves corporate strategies, including the approval of transactions relating to acquisitions and divestments, and capital expenditure above delegated authority limits;
• reviews and approves the corporate plan for the forthcoming year and following two years, including the capital expenditure and operating budget, and reviews performance against strategic objectives;
• assesses business opportunities and risks on an ongoing basis and oversees the Company’s control and accountability systems; • monitors and approves the Company’s financial reporting and dividend policies; • appoints and has the authority to remove the Chief Executive Officer and approves the recommendations of the Human Resources;• ratifies the appointment and has the authority to remove the Chief Financial Officer and Group General Counsel and appoints the
Company Corporate Secretary; and • oversees succession planning for the Chief Executive Officer and senior management.
The Chairman and the Chief Executive Officer establish meeting agendas to ensure adequate coverage of key issues during the year. In addition workshops and strategy meetings take place. Executives and other senior people regularly attend Board meetings and are also available to be contacted by Directors between meetings.
The Board met ten times in 2011.
Composition of the Board of Directors
ChairmanJo Lunder
Board MembersJo Lunder (Chairman)Ahmed Abou Doma (Chief Executive Officer)Khalid Ellaicy (Executive Board Member)Iskandar Shalaby (Non-Executive Board Member)Mohamed Shaker (Non-Executive-Board Member)Henk Van Dalen (Non-Executive-Board Member)Jeffery McGhie (Non-Executive-Board Member)Elena Shmatova (Non-Executive-Board Member)
The above Board Members classification is based on the Egyptian Corporate Governance code. The latter did not specify the criteria for independent directors that would allow the Company to benchmark against, yet in our opinion and based on internationally recognized best practices, a number of our directors would qualify as independent directors bringing to the company the highest possible standing from both a personal and professional standpoint.
Secretary to the Board David DobbieThe company Secretary is responsible to the Board and is available to individual Directors in respect of Board procedures. The Company Secretary was appointed in March 2012. He joined the Group in October 2008. Board Committees• The Board has established a number of committees which are
the most important tools for the management and the operational integration of the Company and provides sufficient resources to enable them to undertake their duties. Executive Directors are not members of the Audit Committee, although they may be invited to attend meetings.
It has recently been revised to:• Monitor the implementation of strategies and the development of
plans and results. • Ensure the overall coordination of business actions and the
management of the relative cross-over business issues. • Build up the necessary operating synergies between the various
functions involved in the technological, business and support processes.
• Support the integrated development of the innovation processes of the Company.
• In particular, the Committee System of the Board includes:
Investment CommitteeThe objective of the Investment Committee is to assist the Board in reviewing the Company’s investment policies, strategies, transactions and performance. This C. also oversees the Company’s capital and financial resources. The Committee has appropriate resources and authority to discharge its responsibilities, including the authority to retain experts or consultants.
Audit CommitteeThe objective of the Audit Committee is to assist the Board in fulfilling its oversight responsibilities by reviewing (i) proposed financial plans; (ii) the financial information provided to shareholders and others; (iii) systems of internal controls which management and the Board of Directors have established; and (iv) the audit process, including both internal and external audits. The Audit Committee interacts directly with the independent auditor to ensure the independent auditor’s ultimate accountability to the Board and the Committee, as representatives of the shareholders, and is directly responsible for the appointment, compensation and oversight of the independent auditor.
Remuneration CommitteeThe objective of the Remuneration Committee is to ensure that the company has a formal process of considering management’s and directors’ remuneration: that is, executive directors should play no part in decisions regarding their own remuneration. There should be an alignment of the remuneration schemes and the performance objectives of the Company, and the remuneration schemes should attract and retain talented individuals.
Management CommitteesManagement committees have ultimate responsibility for directing the activities of the Company, ensuring that it is well run and delivering the expected outcomes.
The management committees should provide leadership to the Company by:• Setting the strategic direction to guide and direct the activities of
the Company; • Ensuring the effective management of the Company and its
activities; and • Monitoring the activities of the Company to ensure that they are
complying with the founding principles, objects and values. • In particular, the Committee System of the Company consists of:
Executive Committee The objective of the Executive Committee is to review and, where appropriate, authorize corporate action with respect to most matters concerning the Company’s and its subsidiaries’ interests. This committee is also in charge of the day-to-day activities on the Operating and Holding level.
24 Orascom Telecom Holdings Annual Report 2011

Orascom Telecom Holdings Annual Report 2011Orascom Telecom Holdings Annual Report 2011 2726
Financial review
Table 1: Total Subscribers1
Subsidiary31 Dec 2010US$ (3 months)
30 Sept 2011 US$ (3 months)
31 Dec 2011 US$ (3 months)
Inc/(dec)
Dec 2011 vs. Dec 2010
Djezzy (Algeria) 15,087,393 16,288,615 16,595,233 10.0%
Mobilink (Pakistan) 31,794,292 33,415,696 34,213,552 7.6%
banglalink (Bangladesh) 19,327,005 22,139,953 23,753,552 22.9%
Telecel Globe2 2,974,000 2,825,000 3,140,000 5.6%
Total 69,182,690 74,669,264 77,702,337 12.3%
Operations accounted for under the equity method31 Dec 2010 US$(3 months)
30 Sept 2011 US$(3 months)
31 Dec 2011 US$(3 months)
Inc/(dec)Dec 2011 vs. Dec 2010
Wind Canada (Canada) 232,641 358,000 403,000 73.2%
Total 232,641 358,000 403,000 73.2%
Grand Total 69,415,331 75,027,264 78,105,337 12.5%
1. For comparative purposes, the subscriber figures for 2010 and September 2011 have been adjusted to reflect the demerger of Mobinil, koryolink and Alfa2. Global ARPU is calculated on a year to date basis, taking into account the weighted average subscribers for calculation.2 Including Zimbabwe; after excluding Powercom Ltd (Namibia) subscribers in December 2010
The Demerger has already been reflected in the consolidated balance sheet as of December 31, 2011, whilst, for income statement purposes, the results of operations have been classified as discontinued operations.
Operating performance
SubscribersOrascom Telecom ended the year 2011 with a subscriber base of over 78 million, showing an increase of almost 13% compared to the previous year. For comparative purposes, the subscriber figure for 2010 has been adjusted to reflect the demerger of Mobinil, koryolink and Alfa, as well as the sale of Powercom Ltd in Namibia.
Algeria’s subscribers increased 10% in comparison to December 2010, as a result of controlling churn alongside successful customer acquisitions.
In Pakistan, Mobilink’s subscriber base grew almost 8% YoY after expanding its portfolio of location-based promotions and focusing on high-quality acquisitions by introducing new pre-paid and post-paid sales promotions. In addition, reactivation promotions were launched to help control churn, which culminated in successful customer retention.
In Bangladesh the subscriber base showed an impressive growth of 23% compared to the previous year, driven by an aggressive acquisition strategy following the SIM Tax reduction in June 2011, as well as loyalty programs and reactivation promotions.
Telecel Globe subscribers showed an increase of 6% in comparison to December 2010, as well as an improvement in subscriber growth QoQ. The subscriber growth is mostly driven by a surge in Burundi’s and Zimbabwe’s customer bases, as a result of increased penetration into rural areas, as well as improved sales and distribution channels performance. It is also worth noting the impressive growth in subscribers compared to 3Q 2011, which was boosted by Zimbabwe’s recapturing of subscribers after a dip in 1H 2011.
In Canada, WIND Mobile subscribers increased 73% compared to the closing base of 2010.
ARPU
In Algeria, ARPU for 4Q 2011 showed a decline of 7% in US$ and local currency terms as compared to 4Q 2010. The decrease is due to the penetration of lower income segments within the customer base, in addition to an accounting provision concerning the “Imtiyaz” loyalty program.
In Pakistan, Mobilink’s ARPU decreased by 7% YoY in US$ terms and by 4% in local currency terms amidst a highly competitive environment. The decline is due to the penetration of lower-end segments in the market through location based promotions in most of the major cities in Pakistan. It is worth noting that ARPU levels were stable in comparison
to the previous quarter.
In Bangladesh, ARPU showed a decline in both US$ and local currency terms, decreasing 14% and 6% respectively. Accelerated growth of subscribers in rural and youth market segments led to some ARPU dilution, while the continuing devaluation of the local currency against the US$ also had an adverse impact on ARPU for 4Q 2011.
In Canada, WIND Mobile experienced a 13% decline in ARPU YoY, while showing stability compared to the previous quarter.
A year of record performance
Highlights
• Total subscribers exceeded 78 million, an increase of 13% over the same period last year, after the exclusion of Alfa, Mobinil and koryolink subscribers for comparative purposes.
• Revenues reached US$ 896 million1, decreasing by 2% compared to 4Q 2010, as a result of the liquidation of the handset business of “Ring” as well as unfavourable currency movements. GSM revenues showed almost 2% growth for the quarter. Revenues for the full year showed an increase of 2% compared to 31 December 2010.
• EBITDA reached US$ 346 million1, a decrease of 4% compared to the same period last year, mainly driven by an increase in corporate contingent liability provisions at the OT Holding level, in addition to unfavourable currency movements. GSM EBITDA increased by 4% YoY. EBITDA for the full year increased 10% compared to the previous year, driven by strong GSM performance of 11%.
• Group EBITDA margin stood at 38.7%, stable over 4Q 2010. EBITDA margins for the major subsidiaries were: Djezzy 58.6%, Mobilink 41.4%, and banglalink 19.2%.
• Net Income before minority interest for the quarter was negative for US$ 83 million1 compared to a loss of US$ 170 million recorded during the same period last year. The improvement is due to a three-fold boost in operating income, which was adversely impacted by the impairment of the company’s assets in Namibia the previous year. Net income attributable to equity holders for the year 2011 was US$ 661 million1.
• Net Debt2 as of December 31, 2011 stood at US$ 3,022 million1, a decrease of over 25% compared to 31 December 2010; with a Net Debt/EBITDA of 1.8x.
Table 2: Blended Average Revenue Per User (ARPU)1
Operations accounted for under the equity method31 Dec 2010 US$ (3 months)
30 Sept 2011 US$ (3 months)
31 Dec 2011 US$ (3 months)
Inc/(dec) Dec 2011 vs. Dec 2010
Djezzy (Algeria) 9.7 9.9 9.0 (7.2%)
Mobilink (Pakistan) 2.9 2.7 2.7 (6.9%)
banglalink (Bangladesh) 2.1 1.9 1.8 (14.3%)
Wind Canada (Canada) 30.0 25.9 26.0 (13.3%)
Global ARPU (YTD)2 4.2 4.2 4.1 (2.8%)
Global ARPU (3 months) 4.2 4.2 4.1 (2.8%)
1. After excluding Mobinil and koryolink subscribers from December 2010.2. Global ARPU is calculated on a year to date basis, taking into account the weighted average subscribers for calculation.
1. US$ financial figures in the Income Statement & Balance Sheet are according to the International Financial Reporting Standards (IFRS).
2. Net Debt is calculated as a sum of Short Term Debt, Long Term Debt, less Cash and Cash Equivalents.

Orascom Telecom Holdings Annual Report 2011Orascom Telecom Holdings Annual Report 2011 2928
Market Share & Competition
During the fourth quarter of 2011, Orascom Telecom continued to lead in its core operating markets, with the exception of Bangladesh where banglalink continues to maintain its second largest market share position.
In Algeria, market share declined by 2.2 p.p. in comparison to 3Q 2011 as a result of aggressive competitive pressures surrounding channel acquisitions, and the ongoing adverse operating conditions resulting from the ban on foreign currency transfers and other Government
actions, which have restricted the import of essential equipment, and the undertaking of critical network maintenance.
In Pakistan, the market share of Mobilink dropped 0.2 p.p. as measured on internal traffic patterns, as a result of the continued market-wide focus on MNP and aggressive competitive pressures.
In Bangladesh, banglalink witnessed an increase in market share of 0.7 p.p. as a result of its successful customer acquisition strategy.
CAPEX
Total consolidated capital expenditures for 4Q 2011 showed a 24% increase compared to the previous year, in line with strategic investment plans.
In Algeria, CAPEX declined 41% in comparison to 4Q 2010, as a result of the ongoing ban on foreign currency transfers preventing the payment of essential suppliers, as well as the importing of equipment critical to network maintenance and necessary expansion.
In Pakistan, CAPEX increased 129% YoY due to the continued focus on network and IT development for Mobilink.
In Bangladesh, CAPEX decreased 16% in comparison to the aggressive network roll-out plan of the previous year. It is worth noting that the 2G license renewal fee was booked as accrued (accounting) CAPEX since the company received the title for the license while the payment will be made in instalments. From a cash flow perspective, however, the actual amount paid in Q4 was US$118 million and the remaining part of approximately US$138 million is deferred.
“Other” CAPEX increased by 112% compared to the same period last year. The increase is mainly due to investments made in
Table 4: Market Share & Competition
Country Brand Name Market Share (%) Market Position Names of additional network operations
30 Sept 2011 31 Dec 2011
Algeria Djezzy 57.7% 55.5% 1 AMN, Qtel
Pakistan1 Mobilink 30.3% n.a2 1 U-Fone, Paktel, Telenor, Al Warid
Bangladesh1 banglalink 27.2% 27.9% 2 Grameen, Aktel, Citycell, BTTB, Airtel
1. Market share, as announced by the national Regulator is based on information disclosed by the other operators which use different subscriber recognition policies. 2. Market share for December 2011 had not been disclosed by the Pakistani Regulator prior to this release.
Telecel Globe for the purpose of network expansion and 3G.
Table 5: Capital Expenditure of OTH Subsidiaries1
Subsidiary 4Q 2010 4Q 2011 inc / (dec)
TotalUS$ Million2010
TotalUS$ Million2011 inc / (dec)
Djezzy (Algeria) 35 21 (41%) 90 40 (56%)
Mobilink (Pakistan) 48 110 129% 143 261 83%
banglalink (Bangladesh) 82 69 (16%) 235 409 74%
Other2 6 13 112% 27 28 2%
Total Consolidated 172 213 24% 495 738 49%
Consolidated Capex/Sales 18.7% 23.8% 5 p.p. 13.9% 20.3% 6.4 p.p.
1.CAPEX figures excluding license fees.2. “Other” companies include OT Holding, Ring and Telecel Globe.
Table 3: Blended Average Revenue Per User (ARPU) (Local Currency)
Subsidiary31 Dec 2010 US$(3 months)
30 Sept 2011 US$(3 months)
31 Dec 2011 US$(3 months)
Inc/(dec) Dec 2011 vs.Dec 2010
Djezzy (Algeria) (DZD) 724.1 714.9 673.1 (7.0%)
Mobilink (Pakistan) (PKR) 244.6 235.6 234.9 (4.0%)
banglalink (Bangladesh) (BDT) 148.9 147.1 140.3 (5.8%)

Orascom Telecom Holdings Annual Report 2011Orascom Telecom Holdings Annual Report 2011 3130
Financial Review
Revenues
Total Consolidated Revenues for 4Q 2011 declined by 2% compared to the previous year, as a result of modest growth in GSM revenues countered by the liquidation of the handset business of “Ring”, as well as local currency devaluation against the US$ in OTH’s main operating countries. For the full year, consolidated revenues improved by 2%, driven by nearly 6% increase in GSM revenues.
In Algeria, revenues remained stable for the quarter showing 1% growth in comparison to 4Q 2010. In local currency terms, revenues increased 3% YoY, mostly driven by the growth in OTA’s subscriber base.
In Pakistan, revenues increased 1.5% in US$ terms, impacted by currency devaluation. In local currency terms, revenues were up 4% in 4Q 2011 compared to the previous year, mainly due to an increase in
subscribers, steady VAS uptake, as well as higher administrative fees on scratch cards.
In Bangladesh, the ongoing devaluation of the local currency against the US$ was responsible for the difference in revenue growth in US$ vs. local currency, up 5% and 16.5% respectively for the quarter. The growth in revenues is attributable to tariff revisions, aggressive competitive moves, and a strong focus on VAS, which contributed to solid additions to the subscriber base of banglalink.
Telecel Globe revenues declined by 5% in comparison to 4Q 2010 as a result of the sale of the operation in Namibia, in addition to currency devaluation in Burundi. On a comparable basis, excluding the sale of Powercom Ltd. in Namibia, revenues display an increase of 8.6% YoY.
Table 6: Consolidated Revenues YoY
Subsidiary
Represented4Q - 20101
(3 months)US$ (000)
4Q - 2011(3 months)US$ (000)
Inc/(dec)
Represented 31 Dec 20101
US$ (000
31 Dec2011US$ (000)
Inc/(dec)
GSM
Djezzy (Algeria) 452,911 457,085 0.9% 1,746,566 1,859,804 6.5%
Mobilink (Pakistan) 280,863 285,175 1.5% 1,107,067 1,133,704 2.4%
banglalink (Bangladesh) 122,285 128,278 4.9% 456,984 511,291 11.9%
Telecel Globe (Africa)2 25,007 23,743 (5.1%) 101,830 93,683 (8.0%)
Total GSM 881,068 894,282 1.5% 3,412,447 3,598,482 5.5%
Telecom Services
Ring 37,121 1,432 (96.1%) 152,278 37,096 (75.6%)
Total Telecom Services 37,121 1,432 (96.1%) 152,278 37,096 (75.6%)
Total Consolidated 918,188 895,714 (2.4%) 3,564,725 3,635,578 2.0%
1. 2010 figures have been represented to reflect the completion of the demerger process.2. As per IFRS rules, Telecel Globe figures have not been represented in 2010 and H1 2011to reflect the disposal of Powercom Ltd. in 2Q 2011.
Table 7: Consolidated Revenues QoQ
Subsidiary Represented 4Q - 2010 (3 months) US$ (000) 4Q - 2011 (3 months) US$ (000) Inc/ (dec)
GSM
Djezzy (Algeria) 486,671 457,085 (6.1%)
Mobilink (Pakistan) 281,490 285,175 1.3%
banglalink (Bangladesh) 129,306 128,278 (0.8%)
Telecel Globe (Africa) 21,340 23,743 11.3%
Total GSM 918,807 894,282 (2.7%)
Telecom Services
Ring 6,644 1,432 (78.4%)
Other 27,931 - n.a.
Total Telecom Services 6,644 1,432 (78.4%)
Total Consolidated 925,451 895,714 (3.2%)
Total consolidated revenues for 4Q 2011 decreased 3% compared to 3Q 2011, mostly impacted by a drop in GSM revenues for the quarter.
In Algeria, revenues declined 6% in US$ terms and 4% in local currency terms. The decrease is a result of an accounting provision concerning the “Imtiyaz” loyalty program.
In Pakistan, revenues increased 1% in US$ terms and 2% in local currency terms, in line with subscriber usage and VAS growth.
In Bangladesh, revenues increased 3% in local currency terms, mostly due to tariff revisions, VAS and MFS offerings, as well as additions to the subscriber base. Revenues were partially slowed by disconnection regulations concerning the post-paid base.
Telecel Globe revenues grew by 11% compared to the previous quarter, driven by increases in the ARPU of CAR, as well as a significant subscriber increase in Burundi for 4Q 2011.
Table 8: Proforma Consolidated Revenues (Local Currency)1
Subsidiary4Q - 2010(3 months)
4Q - 2011(3 months) Inc/ (dec)
3Q - 2011(3 months) Inc/ (dec) 31 Dec 2010 31 Dec. 2011 Inc/ (dec)
GSM
Djezzy (Algeria) (DZD bn) 32.84 33.86 3.1% 35.4 (4.3%) 129.24 135.64 5.0%
Mobilink (Pakistan) (PKR bn) 23.94 25.00 4.3% 24.5 2.0% 94.34 97.90 3.8%
banglalink (Bangladesh)(BDT) 8.47 9.87 16.5% 9.6 2.9% 31.82 37.88 19.0%
1. Un-audited Figures.

Orascom Telecom Holdings Annual Report 2011Orascom Telecom Holdings Annual Report 2011 3332
EBITDA
Consolidated EBITDA for 4Q 2011 decreased 4% YoY, mainly driven by an increase in corporate contingent liability provisions at the OT Holding level, in addition to unfavourable currency movements. GSM EBITDA increased by 4% YoY. On a year-to-date basis, consolidated EBITDA increased over 10%, as a result of the operational excellence program, which helped boost GSM EBITDA by nearly 11%.
In Algeria, EBITDA increased 11% in US$ terms while showing an 18% increase in local currency terms, as a result of currency devaluation against the US$. The increase is mainly attributable to OPEX savings coupled with strong top line performance in the quarter.
In Pakistan, EBITDA was impacted by currency devaluation, leading to a 6% increase in US$ terms, while increasing 10% in local currency. EBITDA was positively impacted by higher revenues, and declining cost of sales, such as lower interconnect and SIM card costs.
In Bangladesh, EBITDA in local currency declined 4% as a result of rising SIM tax subsidies related to strong customer acquisitions. In US$ terms, EBITDA declined by 20% as a result of the devaluation of the local currency against the US$.
Telecel Globe’s EBITDA experienced a significant decline compared to 4Q 2010 due to retroactive tax adjustments in CAR, in addition to an exceptional tax assessment and a bad debt provision in Burundi.
Table 9: Consolidated EBITDA1,2 YoY
Subsidiary
Represented 4Q - 2010 (3 months)US$ (000)
4Q - 2011(3 months)US$ (000)
Inc/(dec)
Represented 31 Dec 2010US$ (000
31 Dec2011US$ (000)
Inc/(dec)
GSM
Djezzy (Algeria) 241,355 267,660 10.9% 982,167 1,100,663 12.1%
Mobilink (Pakistan) 111,221 118,186 6.3% 438,071 463,406 5.8%
banglalink (Bangladesh) 30,772 24,670 (19.8%) 127,686 168,630 32.1%
Telecel Globe (Africa)3 6,643 (5,291) n.m. 23,505 7,776 (66.9%)
Total GSM 389,991 405,225 3.9% 1,571,428 1,740,475 10.8%
Telecom Services
Ring (9,878) 6,790 n.m. (6,885) (3,167) 54.0%
Other4 (88) (1) 98.3% (204) (40) 80.6%
Total Telecom Services (9,966) 6,789 n.m. (7,090) (3,207) 54.8%
OT Holding & Other5 (19,307) (65,569)6 n.m. (69,255) (90,525) (30.7%)
Total Consolidated 360,718 346,444 (4.0%) 1,495,084 1,646,743 10.1%
1. EBITDA excludes management fees which were previously treated as a cost in each subsidiary and as a revenue for the Holding.
2. 2010 figures have been represented to reflect the completion of the demerger process.
3. As per IFRS rules, Telecel Globe figures have not been represented in 2010 and H1 2011 to reflect the disposal of Powercom Ltd. in 2Q 2011.
4. Other Telecom Services Companies include: C.A.T. and OTWIMAX.
5. Other non operating companies include: OTH, C.C., OTUH, OTV, OIH, OTI Malta, OTN, OIIH, Cortex, Eurasia, FPPL, ITCL, IWCPL, Moga, Oratel, OT Finance, Swyer, OT Holding Canada, OT Asia, Oscar, OT ESOP, OT Services Europe, TMGL, Pioneers, OT Wireless Europe, TIL and TILSA.
6. Mainly driven by an increase in corporate contingent liability provisions at the OT Holding level.
Table 10: Consolidated EBITDA QoQ
SubsidiaryRepresented 3Q - 2011 (3 months) US$ (000)
4Q - 2011 (3 months) US$ (000)
Inc/(dec)
GSM
Djezzy (Algeria) 289,763 267,660 (7.6%)
Mobilink (Pakistan) 116,456 118,186 1.5%
banglalink (Bangladesh) 44,401 24,670 (44.4%)
Telecel Globe (Africa) 7,009 (5,291) n.m.
Total GSM 457,629 405,225 (11.5%)
Telecom Services
Ring (1,281) 6,790 n.m.
Other (1.00) (1.47) (47.2%)
Total Telecom Services (1,282) 6,789 n.m.
OT Holding & Other (8,173) (65,569) n.m.
Total Consolidated 448,174 346,444 (22.7%)
Consolidated EBITDA for 4Q 2011 decreased by 23% compared to the previous quarter, heavily impacted by the 11.5% drop in GSM EBITDA caused by local currency devaluation in our main operating countries, as well as an increase in corporate contingent liability provisions at the OT Holding level.
In Algeria, the 8% decrease in EBITDA is a result of the devaluation of the local currency against the US$, while in local currency terms OTA’s EBITDA decreased almost 4%, as a result of lower revenues for the quarter.
In Pakistan, EBITDA increased despite pressures on the local currency, growing nearly 2% in US$ terms and 4% in local currency terms. The increase is mostly attributable to higher revenues and lower cost of sales.
Due to further local currency devaluation against the US$, banglalink’s EBITDA dropped 44% QoQ in US$ terms, while in local currency terms it decreased 36% QoQ. The decline was mainly due to an adjustment in SIM tax subsidy allocation.
Telecel Globe’s EBITDA showed a substantial decline QoQ, as a result of the retroactive tax in CAR, in addition to a bad debt provision and tax reassessment in Burundi.
Table 11: Proforma Consolidated EBITDA (Local Currency)1
Subsidiary4Q - 2010(3 months)
4Q - 2011(3 months) Inc/ (dec)
3Q - 2011(3 months) Inc/ (dec) 31 Dec 2010 31 Dec. 2011 Inc/ (dec)
GSM
Djezzy (Algeria) (DZD bn) 17.1 20.14 18.1% 20.9 (3.6%) 72.50 80.43 10.9%
Mobilink (Pakistan) (PKR bn) 9.5 10.43 10.1% 10.03 4.0% 37.33 40.02 7.2%
banglalink (Bangladesh) 2.13 2.05 (3.6%) 3.2 (35.8%) 8.89 12.50 40.5%
1. Un-audited Figures.

Orascom Telecom Holdings Annual Report 2011Orascom Telecom Holdings Annual Report 2011 3534
EBITDA MARGIN
The Consolidated EBITDA margin for the fourth quarter of 2011 stood at 38.7% showing relative stability compared to the same period last year.
In Algeria, Djezzy’s margin increased by 5.3 p.p. compared to 4Q 2010, as a result of the improved EBITDA level for this quarter countering the limitations imposed upon the operation by the Algerian government.
In Pakistan, the EBITDA margin of Mobilink showed an increase of 1.8 p.p. as a result of healthy revenue growth and a solid EBITDA for the quarter.
In Bangladesh, banglalink’s EBITDA margin decreased by 6.0 p.p. compared to the same period last year as a result of higher SIM tax costs related to subscriber acquisitions.
Telecel Globe’s EBITDA margin decreased 48.9 p.p. in comparison to 4Q 2010, mainly due to declining EBITDA levels.
Table 12: Consolidated EBITDA Margin
Subsidiary
Represented4Q - 2010(3 months)US$ (000)
4Q - 2011(3 months)US$ (000) Change
Represented 31 Dec 2010US$ (000)
31 Dec2011US$ (000) Change
GSM
Djezzy (Algeria) 53.3% 58.6% 5.3 56.2% 59.2% 3.0
Mobilink (Pakistan) 39.6% 41.4% 1.8 39.6% 40.9% 1.3
banglalink (Bangladesh) 25.2% 19.2% (6.0) 27.9% 33.0% 5.1
Telecel Globe (Africa)1 26.6% (22.3%) (48.9) 23.1% 8.3% (14.8)
Total GSM 44.3% 45.3% 1.0 46.0% 48.4% 2.4
Total Telecom Services (26.8%) 474.1% 500.9 (4.7%) (8.6%) (4.0)
EBITDA Margin 39.3% 38.7% (0.6) 41.9% 45.3% 3.4
1. As per IFRS rules, Telecel Globe figures have not been represented in 2010 and H1 2011to reflect the disposal of Powercom Ltd. in 2Q 2011.
Foreign Exchange Rates
Table 13: Foreign Exchange Rates used in the Income Statement & Balance Sheet
Currency Dec. 2010 Sept. 2011 Dec. 2011
% Chg3 Dec. 2011 VS Dec. 2010
% Chg3 Dec. 2011 VS Sept. 2011
Egyptian Pound/USD
Income Statement1 5.6359 5.9306 5.9449 5.5 0.2
Balance Sheet2 5.8057 5.9658 6.0308 3.9 1.1
Algerian Dinar/USD
Income Statement1 73.9910 72.5542 72.9327 (1.4) 0.5
Balance Sheet2 74.2862 74.1680 75.3273 1.4 1.6
Pakistan Rupee/USD
Income Statement1 85.6721 85.8751 86.3331 0.8 0.5
Balance Sheet2 85.1836 87.4806 89.9467 5.6 2.8
Bangladeshi Taka/USD
Income Statement1 69.6256 73.1028 74.0699 6.4 1.3
Balance Sheet2 70.5983 75.1685 81.8348 15.9 8.9
Canadian Dollar/USD
Income Statement1 1.0297 0.9778 0.9886 (4.0) 1.1
Balance Sheet2 0.9970 1.0446 1.0213 2.4 (2.2)
1- Represents the average monthly exchange rate from the start of the year until the end of the period.2- Represents the spot exchange rate at the end of the period.3- Appreciation / (Depreciation) of USD vs. Local Currency.
Net Income
Net Income before minority interest for 4Q 2011 was negative for US$ 83 million, improving 51% compared to the previous year. While Net Income attributable to equity holders of the parent declined by 11% for the full year, it is worth noting that profit from continuing operations was up 81%. The decline is a result of the non-recurring extraordinary gains related to the sale of operations in Tunisia in 2010.
Net Income for 2010 was adversely impacted by the impairment of the company’s assets in Namibia. As a result, Net Income for 4Q 2011 showed an increase compared to the previous year, boosted by a strong operating income, which increased three-fold compared to 4Q 2010. The Net Income in 4Q 2011 was impacted by an increase in unrealized FX losses in Bangladesh and in OT Holding, driven by currency devaluations vs. the US$, in relation to certain loans and payables in foreign currencies; this was partially compensated by FX gains in relation to financial receivables from Wind Canada as a result of the appreciation of the Canadian dollar.
Net Income for the full year of 2011 stood at US$701 million with an EPS of US$ 0.63 per GDR.

Orascom Telecom Holdings Annual Report 2011Orascom Telecom Holdings Annual Report 2011 3736
Table 14: Income Statement in IFRS/US$
Represented4Q - 2010 (3 months) US$ (000)
4Q - 2011(3 months)US$ (000)
“Inc/(dec)”
Represented31 Dec. 2010 US$ (000)
31 Dec. 2011 US$ (000)
Inc/(dec)
Revenues 918,188 895,714 (2%) 3,564,725 3,635,578 2%
Other Income 7,693 9,279 29,363 30,252
Total Expense (565,434) (558,502) (2,099,166) (2,019,087)
Net unusual Items 272 (46) 161 (0)
EBITDA1 360,718 346,444 (4%) 1,495,084 1,646,743 10%
Depreciation & Amortization (231,762) (191,354) (777,740) (773,472)
Impairment of Non Current Assets (78,048)2 (6,522) (96,154)2 (10,026)
Gain (Loss) on Disposal of Non Current Assets 81 (360) (149) 58,0853
Operating Income 50,989 148,208 191% 621,040 921,331 48%
Financial Expense (95,909) (92,408) (456,558) (535,732)
Financial Income (2,207)4 19,215 53,664 79,625
Foreign Exchange Gain (Loss) 10,768 (50,494)5 (74,051) (150,359)
Net Financing Cost (87,348) (123,687) (476,944) (606,466)
Share of Profit (Loss) of Associates (40,543) (51,696) (142,562) (135,280)
Impairment of Financial Recievables (18,142) (21,888) (18,142) (21,888)
Profit Before Tax (95,044) (49,063) 48% (16,608) 157,696 n.m.
Income Tax (78,129) (65,830) (225,350) (243,493)
Profit from Continuing Operations (173,173) (114,894) 34% (241,958) (85,797) 65%
Gains or losses from discontinued operations 3,597 31,977 1,023,4066 746,169
Profit for the Period (169,576) (82,916) 51% 781,448 660,372 (15%)
Attributable to:
Equity Holders of the Parent7 (178,877) (91,275) 49% 743,095 627,541 (16%)
Earnings Per Share (US$/GDR)8 (0.19) (0.09) 52% 0.73 0.63 (14%)
Minority Interest 9,301 8,359 38,353 32,831
Net Income (169,576) (82,916) 51% 781,448 660,372 (15%)
1- Management Presentation developed from IFRS financials.
2- Due to the impairment of Telecel Globe’s investment in Namibia and the impairment of MedCable in Algeria.
3- Due to the disposal of Powercom Ltd (Namibia).
4- Due to the resettlement of the intercompany loan to Globalive Wireless Corp. Canada
5- Mainly unrealized FX losses due to devaluation of BDT and EGP vs. US$; partially offset by the appreciation of CAD.
6- a) 2010 figures include the accounting treatment of Mobinil as a discontinued operation as a result of the amended and restated shareholders’ and settlement agreements concluded with France Telecom which entered into force on July 13, 2010.
b) On 4 January 2011, OTH sold its entire shareholding in Orascom Tunisia Holding and Carthage Consortium through which OTH owned 50% of Orascom Telecom Tunisia (“OTT”). As a result the proportionate consolidation of OTT during Q4 2010 was no longer applicable under IFRS as it renders the entity an investment held for sale, and consequently a discontinued operation under IFRS rules. Figures for 2010 have been restated to reflect the accounting treatment of OTT.
7- Equates to Net Income after Minority Interest.
8- Based on a weighted average for the outstanding number of GDRs of 1,046,278,130 GDRs for 4Q 2011. The weighted average for the outstanding number of GDRs for 4Q 2010, FY 2010 and FY 2011 is 1,046,501,539 GDRs, 1,015,240,054 GDRs and 1,046,175,604 GDRs respectively.
Table 15 : Balance Sheet in IFRS/US$
IFRS/US$31 December2010US$ (000)
IFRS/US$31 December2011US$ (000)
Assets
Property and Equipment (net) 3,763,359 2,901,831
Intangible Assets 1,486,662 1,557,590
Investment in Associates 1,029,294 -
Other Non-Current Assets 1,104,740 1,089,077
Total Non-Current Assets 7,384,055 5,548,498
Cash and Cash Equivalents 824,085 1,013,543
Trade Receivables 258,820 205,195
Assets Held for Sale 422,604 -
Other Current Assets 1,090,912 1,186,206
Total Current Assets 2,596,421 2,404,944
Total Assets 9,980,476 7,953,442
Equity Attributable to Equity Holders of the Company 2,726,524 1,854,630
Minority Share 74,639 56,729
Total Equity 2,801,163 1,911,359
Liabilities
Long Term Debt 3,859,447 3,492,164
Other Non-Current Liabilities 354,225 255,159
Total Non-Current Liabilities 4,213,672 3,747,323
Short Term Debt 973,454 543,826
Trade Payables 811,443 738,289
Other Current Liabilities 1,180,744 1,012,645
Total Current Liabilities 2,965,641 2,294,760
Total Liabilities 7,179,313 6,042,083
Total Liabilities & Shareholder’s Equity 9,980,476 7,953,442
Net Debt1 4,008,816 3,022,447
1- Net Debt is calculated as a sum of Short Term Debt, Long Term Debt, less Cash and Cash Equivalents.

Orascom Telecom Holdings Annual Report 2011Orascom Telecom Holdings Annual Report 2011 3938
Table 16: Cash Flow Statement in IFRS/US$
IFRS/RepresentedDecember 31,US$ (000)
IFRS/US$December 31,US$ (000)
Cash Flows from Operating Activities
Profit for the Period (241,958) (85,815)
Depreciation, Amortization & Impairment of Non-Current Assets 873,894 783,498
Income Tax Expense 225,350 243,511
Net Financial Charges 476,783 606,466
Share of Loss (Profit) of Associates Accounted for Using the Equity Method 142,562 135,280
Impairment of Financial Assets 18,142 21,888
Other 58,170 (7,567)
Changes in Assets Carried as Working Capital (574,009) (187,731)
Changes in Other Liabilities Carried as Working Capital 17,574 (53,007)
Income Tax Paid (300,686) (199,393)
Interest Expense Paid (351,990) (217,029)
Net Cash Generated by Operating Activities 343,832 1,040,101
Cash Flows from Investing Activities
Cash Outflow for Investments in Property & Equipment, Intangible Assets, and Financial Assets & Consolidated Subsidiaries (503,022) (648,061)
Proceeds from Disposal of Property & Equipment, Subsidiaries and Financial Assets 38,374 26,713
Advances & Loans made to Associates & other parties (300,348) (202,886)
Dividends & Interest Received 18,101 14,940
Net Cash Used in Investing Activities (746,895) (809,294)
Cash Flows from Financing Activities
Proceeds from loans, banks' facilities and bonds 332,320 874,508
Payments for loans, banks' facilities and bonds (855,108) (1,619,030)
Net Payments from financial liabilities (14,290) 1,800
Net Change in Cash Collateral (668) (129,195)
Payments for Treasury Shares (460) -
Capital injection 765,233 -
Net Cash generated by Financing Activities 227,027 (871,917)
Discontinued operations
Net cash generated by operating activities 202,935 90,242
Net cash (used in) generated by investing activities 61,389 1,044,128
Net cash (used in) generated by financing activities 30,884 (9,025)
Net cash generated from discontinued operations 295,208 1,125,345
Net Increase in Cash & Cash Equivalents 119,172 484,235
Cash included in Assets Held for Sale (44,559) (262,657)
Effect of Exchange Rate Changes on Cash & Cash Equivalents (10,079) (32,115)
Cash & Cash Equivalents at the Beginning of the Period 759,546 824,080
Cash & Cash Equivalents at the End of the Period 824,080 1,013,543
Table 17: Income Statement in EAS/Egyptian Pounds
Represented 4Q - 2010 (3 months)LE (000)
4Q - 2011 (3 months)LE (000)
Inc/(dec)
Represented 31 Dec 2010LE (000)
31 Dec 2011LE (000)
Inc/(dec)
Revenues 3,731,234 5,363,890 44% 20,090,371 21,613,060 8%
Other Income 43,759 55,458 165,489 179,844
Total Expense (2,466,480) (3,234,520) (11,839,852) (12,018,608)
EBITDA1 1,308,513 2,184,828 67% 8,416,008 9,774,295 16%
Depreciation & Amortization (1,071,449) (1,145,492) (4,380,659) (4,594,293)
Other (439,046) (40,085) (542,426) 285,878
Operating Income (201,982) 999,251 n.m. 3,492,922 5,465,880 56%
Financial Expense (633,838) (555,742) (2,660,994) (3,170,905)
Financial Income (18,848) 115,090 302,447 473,358
Foreign Exchange Gain (Loss) 68,449 (302,829) (417,327) (893,868)
Net Financing Cost (584,237) (743,481) (2,775,874) (3,591,415)
Share of Profit (Loss) of Associates (246,803) (308,514) (803,465) (804,225)
Impairment of Financial Recievables (102) (130,121) (102) (130,121)
Profit Before Tax (1,033,124) (182,865) 82% (86,518) 940,119 n.m.
Income Tax (264,839) (393,304) (1,293,231) (1,447,642)
Profit from Continuing Operations (1,297,962) (576,169) 56% (1,379,749) (507,523) 81%
Gains or losses from discontinued operations 427,055 88,629 2,505,889 4,689,321
Profit for the Period (870,907) (487,540) 44% 1,126,140 4,181,797 n.m.
Attributable to:
Equity Holders of the Parent (924,337) (537,664) 42% 881,709 3,986,884 n.m.
Earnings Per Share (EGP/Share)2 (0.18) (0.10) 44% 0.17 0.80 n.m.
Minority Interest 53,430 50,124 244,431 194,913
Net Income (870,907) (487,540) 44% 1,126,140 4,181,797 n.m.
1- Management Presentation developed from EAS financials.
2- Based on a weighted average for the outstanding number of ordinary shares of 5,230,878,022 for 4Q11. The weighted average for the outstanding number of ordinary shares for 4Q10, 2010 and 2011 is 5,076,200,270; 5,232,507,695 and 5,231,390,650 respectively.

Orascom Telecom Holdings Annual Report 2011Orascom Telecom Holdings Annual Report 2011 4140
Table 18: Balance Sheet in EAS/Egyptian Pounds1 EAS/LE“31 December 2010”LE (000)
EAS/LE“31 December 2011”LE (000)
Assets
Property and Equipment (net) 21,710,070 17,367,279
Intangible Assets 8,584,912 9,347,975
Other Non-Current Assets 8,558,597 6,590,484
Total Non-Current Assets 38,853,579 33,305,738
Cash and Cash Equivalents 4,784,360 6,112,496
Trade Receivables 1,502,624 1,237,494
Assets Held for Sale 2,430,567 -
Other Current Assets 6,332,816 7,157,572
Total Current Assets 15,050,367 14,507,562
Total Assets 53,903,946 47,813,300
Equity Attributable to Equity Holders of the Company 12,246,749 11,179,176
Minority Share 458,581 342,121
Total Equity 12,705,330 11,521,297
Liabilities
Long Term Debt 22,314,854 20,972,669
Other Non-Current Liabilities 1,735,569 1,538,404
Total Non-Current Liabilities 24,050,423 22,511,073
Short Term Debt 5,639,775 3,269,496
Trade Payables 4,710,968 4,452,491
Other Current Liabilities 6,797,450 6,058,943
Total Current Liabilities 17,148,193 13,780,930
Total Liabilities 41,198,616 36,292,003
Total Liabilities & Shareholder’s Equity 53,903,946 47,813,300
Net Debt2 23,170,269 18,129,668
1- Management presentation developed from EAS financials.
2- Net Debt is calculated as a sum of Short Term Debt, Long Term Debt, less Cash and Cash Equivalents.
Table 19: Ownership Structure & Consolidation Methods
Ownership December 31 Consolidation Method December 31
2010 2011 2010 2011
GSM Operations
Mobinil (Egypt)1 28.75% 28.75% Equity Method Demerged
Egyptian Co. for Mobile Services 20.00% 20.00% Equity Method Demerged
IWCPL (Pakistan) 100.00% 100.00% Full Consolidation Full Consolidation
Orascom Telecom Algeria2 96.81% 96.81% Full Consolidation Full Consolidation
Telecel (Africa) 100.00% 100.00% Full Consolidation Full Consolidation
Orascom Telecom Tunisia 50.00% Divested Proportionate Consolidation Divested
Telecel Globe 94.00% 100.00% Full Consolidation Full Consolidation
OT Ventures3 100.00% 100.00% Full Consolidation Full Consolidation
CHEO 75.00% 75.00% Full Consolidation Demerged
Internet Service
Intouch 100.00% 100.00% Full Consolidation Demerged
Non GSM Operations
Ring 99.00% 99.00% Full Consolidation Full Consolidation
OTCS 100.00% 100.00% Full Consolidation Full Consolidation
OT ESOP 100.00% 100.00% Full Consolidation Full Consolidation
OT Services Europe 100.00% 100.00% Full Consolidation Full Consolidation
MedCable 100.00% 100.00% Full Consolidation Demerged
Mena Cable 100.00% 100.00% Full Consolidation Demerged
Moga Holding 100.00% 100.00% Full Consolidation Full Consolidation
Oratel 100.00% 100.00% Full Consolidation Full Consolidation
C.A.T.4 50.00% 50.00% Proportionate Consolidation Proportionate Consolidation
OT Wireless Europe 100.00% 100.00% Full Consolidation Full Consolidation
OT WIMAX 100.00% 100.00% Full Consolidation Divested
TWA 51.00% 51.00% Full Consolidation Demerged
OIIH 100.00% 100.00% Full Consolidation Demerged
OT Holding 100.00% 100.00% Full Consolidation Full Consolidation
FPPL 100.00% 100.00% Full Consolidation Full Consolidation
MinMax Ventures 100.00% 100.00% Full Consolidation Full Consolidation
OIH5 100.00% 100.00% Full Consolidation Full Consolidation
OTFCSA 100.00% 100.00% Full Consolidation Full Consolidation
OT Holding Canada6 100.00% 100.00% Full Consolidation Full Consolidation
ITCL 50.00% 50.00% Proportionate Consolidation Proportionate Consolidation
SAWLTD 100.00% 100.00% Full Consolidation Full Consolidation
OT_OSCAR 100.00% 100.00% Full Consolidation Full Consolidation
OTLB 100.00% 100.00% Full Consolidation Demerged
TMGL 100.00% 100.00% Full Consolidation Full Consolidation
OTO 100.00% 100.00% Full Consolidation Full Consolidation
C.C 100.00% 100.00% Full Consolidation Divested
OTUH 100.00% 0.00% Full Consolidation Divested
Waselabank 100.00% 100.00% Full Consolidation Full Consolidation
CORTEX 100.00% 100.00% Full Consolidation Full Consolidation
1. Mobinil is a holding company which controls 51% of ECMS, the mobile operator. Mobinil is also the brand name used by ECMS.2. Direct and Indirect stake through Moga Holding Ltd. and Oratel. 3. OT Ventures owns 100% of Sheba Telecom which operates under the trade name banglalink.4. Direct and Indirect stake through International Telecommunications Consortium Limited (ITCL). 5. OIH owns 100% of Orascom Telecom Iraq which sold Iraqna in December 2007.6. Holding company for OTH’s Share in Globalive which has been accounted for under the equity method.Appendix

Orascom Telecom Holdings Annual Report 2011Orascom Telecom Holdings Annual Report 2011 4342
Glossary
• ARPU (Average Revenue per User): Average monthly recurrent revenue per customer (excluding visitors roaming revenue and connection fee. This includes airtime revenue (national and international), as well as, monthly subscription fee, SMS, GPRS & data revenue. Quarterly ARPU is calculated as an average of the last three months.
• Capex: Tangible & Intangible fixed assets additions during the reporting period, includes work in progress, network, IT, and other tangible and intangible fixed assets additions but excludes license fees
• Churn: Disconnection rate. This is calculated as the number of disconnections during a month divided by the average customer base for that month.
• Churn Rule: A subscriber is considered churned (removed from the subscriber base) if he exceeds the 90 days from the end of the validity period without recharging. It is worth noting that the validity period is a function of the scratch denomination. In cases where scratch cards have open validity, the subscriber is considered churned in case he has not made a single billable event in the last 90 days (i.e. outgoing or incoming call or sms, wap session…). Open cards validity is applied for OTA, Mobilink, Mobinil and banglalink so far. A koryolink customer is considered churn if he/she does not recharge within four months after the validity of the scratch card.
• MOU (Minutes of Usage): Average airtime minutes per customer per month. This includes billable national & international outgoing traffic originated by subscribers (on-net, to land line & to other operators). Also, this includes incoming traffic to subscribers from land line or other operators.
• OTH’s Market Share Calculation Method: The market share is calculated through the data warehouse of OTH’s subsidiaries. The number of SIM cards of competitors that appeared in the call detail record of each of OTH’s subsidiaries is collected. This reflects the number of subscribers of the competition. However, OTH deducts the number of SIM cards that did not appear in the call detail records for the last 90 days to account for churn. The same is applied to OTH subsidiaries. This method is used to calculate the market shares of Djezzy and Mobinil only. In Pakistan and Bangladesh, Market share as announced by the Regulators is based on disclosed information by the other operators which may use different subscriber recognition policy.
Financial statements
Index to the consolidated financial statements
Page
Consolidated balance sheet 1
Consolidated income statement 2
Consolidated statement of comprehensive income 3
Consolidated statement of changes in equity 4
Consolidated statement of cash flows 5
Notes to the consolidated financial statements 7
Appendix A - Liabilities to banks 55
Appendix B – Bonds 57
Appendix C - Scope of consolidation 58
Orascom Telecom Holdings Annual Report 2011Orascom Telecom Holdings Annual Report 2011 4544
IFRS consolidated

Orascom Telecom Holdings Annual Report 2011Orascom Telecom Holdings Annual Report 2011 4746
For the year ended December 31, Note 2011 2010
(in million of US$) Reclassified
Continuing operations
Revenues 8 3,636 3,565
Other income 30 29
Purchases and services 9 (1,600) (1,683)
Other expenses 10 (175) (195)
Personnel costs 11 (244) (220)
Depreciation and amortization 12 (773) (778)
Impairment charges 13 (10) (96)
Disposal of non current assets 14 58 -
Operating income 922 622
Financial income 15 80 54
Financial expense 15 (536) (457)
Foreign exchange loss 15 (150) (74)
Net financing costs (606) (477)
Share of loss of associates 16 (135) (143)
Impairment of financial assets 17 (22) (18)
Profit/(loss) before income tax 159 (16)
Income tax expense 18 (243) (225)
Loss from continuing operations (84) (241)
Discontinued operations
Profit from discontinued operation (net of income tax) 7 745 1,022
Profit for the year 661 781
Attributable to:
Owners of the Company 628 743
Non-controlling interest 33 38
Earnings per share - (in US$) 30
Basic and diluted earnings / (loss) per share: 0.13 0.15
From continuing operations: (0.01) (0.05)
From discontinued operations: 0.14 0.20
Consolidated income statementConsolidated balance sheet
As of December 31, Note 2011 2010
(in million of US$)
Assets
Property and equipment 19 2,902 3,763
Intangible assets 20 1,558 1,487
Investment in associates - 1,029
Other non-current financial assets 21 1,024 1,033
Deferred tax assets 22 65 72
Total non-current assets 5,549 7,384
Inventories 33 56
Trade receivables 23 205 259
Other current financial assets 21 230 46
Current income tax receivables 18 99 83
Other current assets 24 825 905
Cash and cash equivalents 25 1,014 824
Assets held for sale 7 - 423
Total current assets 2,406 2,596
Total assets 7,955 9,980
Equity and liabilities
Share capital 598 1,031
Reserves (192) (279)
Retained earnings 1,450 1,975
Equity attributable to owners of the Company 1,856 2,727
Non-controlling interest 57 74
Total equity 26 1,913 2,801
Liabilities
Non-current borrowings 27 3,492 3,859
Other non-current liabilities 28 167 112
Provisions 8 1
Non-current income tax liabilities 18 9 -
Deferred tax liabilities 22 71 242
Total non-current liabilities 3,747 4,214
Current borrowings 27 544 973
Trade payables 29 738 811
Other current liabilities 28 592 753
Current income tax liabilities 18 328 148
Provisions 93 86
Liabilities held for sale 7 - 194
Total current liabilities 2,295 2,965
Total liabilities 6,042 7,179
Total equity and liabilities 7,955 9,980

Orascom Telecom Holdings Annual Report 2011Orascom Telecom Holdings Annual Report 2011 4948
Consolidated statement of changes in equity Attributable to owners of the Company
(in million of US$) Note Share capitalTreasury
sharesOther
reservesRetained earnings Total
Non controlling
Interest Total equity
As of January 1, 2011 1,031 (44) (235) 1,975 2,727 74 2,801
Comprehensive income
Profit for the year - - - 628 628 33 661
Other comprehensive income - - 117 (42) 75 12 87
Total comprehensive income - - 117 586 703 45 748
Transactions with owners
Demerger effect 2 (433) - (55) (1,106) (1,594) (57) (1,651)
Dividends paid - - - - - (5) (5)
Increase in legal reserve - - 5 (5) - - -
Share based compensation 32 - 43 (23) - 20 - 20
Total transactions with owners (433) 43 (73) (1,111) (1,574) (62) (1,636)
As of December 31, 2011 598 (1) (191) 1,450 1,856 57 1,913
Attributable to owners of the Company
(in million of US$) Note Share capitalTreasury
sharesOther
reservesRetained earnings Total
Non controlling
Interest Total equity
As of January 1, 2010 258 (48) (166) 1,232 1,276 140 1,416
Comprehensive income
Profit for the year - - - 743 743 38 781
Other comprehensive income - - (54) - (54) (9) (63)
Total comprehensive income - - (54) 743 689 29 718
Transactions with owners
Capital increase 26 773 (4) (4) - 765 - 765
Change in non controlling interest - - - - - (57) (57)
Dividends paid - - - - - (38) (38)
Share based compensation 32 - 8 (11) - (3) - (3)
Total transactions with owners 773 4 (15) - 762 (95) 667
As of December 31, 2010 1,031 (44) (235) 1,975 2,727 74 2,801
For the year ended December 31, 2011 2010
(in million of US$)
Profit for the year 661 781
Other comprehensive income:
Changes in fair value of available-for-sale financial assets 6 (2)
Cash flow hedges reserve 57 6
Currency translation differences 24 (67)
Other comprehensive income for the year, net of tax 87 (63)
Total comprehensive income for the year 748 718
Attributable to:
Owners of the Company 703 689
Non-controlling interest 45 29
Consolidated statement of comprehensive income

Orascom Telecom Holdings Annual Report 2011Orascom Telecom Holdings Annual Report 2011 5150
Discontinued operations
Net cash generated by operating activities 90 203
Net cash generated by investing activities 1,044 61
Net cash (used in)/ generated by financing activities (9) 31
Net cash generated by discontinued operations 1,125 295
Net increase in cash and cash equivalents 484 121
Cash included in assets held for sale and Spin-off Assets (263) (43)
Effect of exchange rate changes on cash and cash equivalents (31) (14)
Cash and cash equivalents at the beginning of the year 824 760
Cash and cash equivalents at the end of the year 1,014 824
For the year ended December 31,
(in millions of US$) 2011 2010
Reclassified
Continuing operations
Cash flows from operating activities
Loss for the year ( 84) (241)
Adjustments for:
Depreciation, amortization and impairment charges 783 874
Income tax expense 243 225
Share-based compensation 3 3
Net financial charges 456 403
Currency translation differences 150 74
Gain on disposal of non-current assets (58) -
Share of loss of associates 135 143
Impairment of current financial assets 22 18
Change in assets carried as working capital (189) (575)
Change in provisions and allowances
48 55
Change in other liabilities carried as working capital (53) 18
Income tax paid (199) (301)
Interest expense paid (217) (351)
Net cash generated by operating activities 1,040 345
Cash flows from investing activities
Cash outflow for investments in:
- Property and equipment (452) (394)
- Intangible assets (139) (80)
- Consolidated subsidiaries (57) (30)
Proceeds from disposals of:
- Property and equipment 12 13
- Intangible assets - 1
- Consolidated subsidiaries - 15
- financial assets 14 11
Advances and loans made to associate and other parties (203) (300)
Dividends and interest received 15 18
Net cash used in investing activities (810) (746)
Cash flows from financing activities
Proceeds from loans, banks' facilities and bonds 877 332
Payments for loans, banks' facilities and bonds (1,619) (855)
Net payments for other current financial liabilities - (14)
Net change in cash collateral (129) (1)
Capital injections - 765
Net cash (used in) / generated by financing activities (871) 227
Net cash used in continuing operations (641) (174)
Consolidated statement of cash flows

Orascom Telecom Holdings Annual Report 2011Orascom Telecom Holdings Annual Report 2011 5352
The Demerger was performed based on the book value of the Spin-Off Assets, taking into consideration the terms and conditions of a separation agreement entered into between the relevant parties, which requires among others, OTH to reimburse OTMT for certain revenue items pertaining to the Spin-Off Assets. The effect of the Demerger was a reduction of total equity of US$ 1,651 million, including a reduction of US$ 433 million in share capital.
The Demerger was effected through a reduction in the issued capital of the Company. In particular, the nominal value of the Company’s shares was reduced from L.E. 1 to L.E. 0.58.
As the Demerger took place before the balance sheet date, the Demerger, including the transfer of the Spin-Off Assets has already been reflected in the consolidated balance sheet as of December 31, 2011, whilst, for income statement purposes, the results of operations relating to the Spin-Off Assets have been classified as “discontinued operations” in 2010 and 2011.
Refinancing Plan
Certain of the Company’s financial liabilities included mandatory repayment clauses in the event of a change in control. In particular, the Company’s senior secured credit facility and equity linked notes became repayable as a result of the VimpelCom Transaction. At an extraordinary general assembly meeting of the Company held on April 14, 2011 (the “April 14 EGM”), the shareholders approved a refinancing plan to refinance/repay the Company’s outstanding secured debt and unsecured high yield notes, together with certain derivative transactions for an amount of approximately US$ 2.7 billion (the “Refinancing Plan”). Therefore, in May 2011 VimpelCom provided two shareholder loans to the Group to refinance such financial liabilities. These shareholder loans are repayable in May 2014 and bear a fixed interest rate of 9.5% which is payable in kind at maturity.
3. Significant accounting policies
3.1 Basis of presentation
The Consolidated Financial Statements of the Group, as of and for the year ended December 31, 2011, have been prepared in accordance with International Financial Reporting Standards (IFRS) promulgated by the International Accounting Standards Board (IASB) and all interpretations of the International Financial Reporting Interpretations Committee (IFRIC) and the Standing Interpretations Committee (SIC).
The consolidated financial statements have been prepared under the historical cost basis except for the following:
• derivative financial instruments are measured at fair value;
• financial instruments at fair value through profit or loss are measured at fair value; and
• available-for-sale financial assets are measured at fair value
• assets and liabilities held for sale (or disposal group) are measured at the lower of their carrying amount and fair value less cost to sell.
For presentational purposes, the current/non-current distinction has been used for the balance sheet, while expenses are analyzed in the income statement using a classification based on their nature. The indirect method has been selected to present the cash flow statement.
The information in this document has been presented in millions of United States Dollar (“US$”), except earnings per share and unless otherwise stated.
3.2 Change in Accounting Polices
The Group has adopted the following new and amended IFRSs and IFRIC Interpretations, as of January 1, 2011, with no material impact on these financial statements:
• IAS 32 (amendment), “Financial instruments: Presentation – Classification of rights issues”. Amended to allow rights, options or warrants to acquire a fixed number of the entity’s own equity instruments for a fixed amount of any currency to be classified as equity instruments provided the entity offers the rights, options or warrants pro rata to all of its existing owners of the same class of its own non-derivative equity instruments.
• IAS 24, “Related party disclosures” (revised). The revised standard clarifies the definition of a related party and modifies certain related-party disclosure requirements for government-related entities.
• IFRIC 19, “Extinguishing financial liabilities with equity instruments”. The interpretation clarifies the requirements of IFRSs when an entity
Financial statements
Notes to the financial statements continued
1. General information
Orascom Telecom Holding S.A.E. (“OTH” or the “Company”) is a joint stock company with its head office in Cairo, Egypt. The Company, through its subsidiaries (together the “Group”) is a leading mobile telecommunications company operating in high growth emerging markets in the Middle East, Africa, Europe, Canada and Asia, having a total population under license of approximately 415 million. The Company is listed on the Egyptian Stock Exchange and has Global Depository Receipts (“GDR”) listed on the London Stock Exchange.
The Company is a subsidiary of VimpelCom Ltd. (“VimpelCom”).
These consolidated financial statements as of and for the year ended December 31, 2011 (the “Consolidated Financial Statements”) were approved for issue by the Board of Directors on April 12, 2012.
2. VimpelCom Transaction and the Demerger
VimpelCom Ltd. (“VimpelCom”) and Weather Investments II Sarl (“Weather II”) announced in October 2010 that they had signed an agreement to combine VimpelCom and Wind Telecom SpA (the “VimpelCom Transaction”). The VimpelCom Transaction closed in April 2011 and as a result VimpelCom owns, through Wind Telecom SpA (“Wind Telecom”), 51.7% of the Company and 100% of Wind Telecomunicazioni S.p.A. (“Wind Italy”).
Demerger and Spin-Off Assets
Under the terms of the VimpelCom Transaction, VimpelCom, Weather II and OTH agreed a demerger plan (the “Demerger”) pursuant to which the Company’s investments in certain telecom, media and technology assets (the “Spin-Off Assets”) which were not intended to form part of the VimpelCom business going forward would be transferred to a new company, Orascom Telecom Media and Technology Holding S.A.E. (“OTMT”). The Demerger was performed in accordance with the guidelines of the Egyptian Financial Supervisory Authority and in particular decree no. 124 of 2010 and was completed in December 2011. The split of the OTH shares by the way of the Demerger resulted in OTH shareholders holding the same percentage interest in OTMT as they held in the Company. The demerger plan was approved in shareholders meetings dated April 14, 2011 and October 23, 2011. Approval from the Egyptian Financial Supervisory Authority was received in December 2011.
As a result of the Demerger, during November and December 2011, ownership of the following Spin-Off Assets were transferred from the Company to OTMT:
• 28.755% ownership stake in Mobinil for Telecommunications S.A.E.
• 20.00% ownership stake in the Egyptian Company for Mobile Services
• 75% ownership stake in CHEO Technology Joint Venture Company, together with all other assets and businesses located in North Korea
• 95% ownership in Orabank NK
• 100% direct and indirectly held ownership stake in Middle East and North Africa for Sea Cables
• 51% ownership stake in Trans World Associate (Private) Limited (Pakistan)
• 100% ownership of Med Cable Limited (UK)
• 99.99% ownership stake in Intouch Communications Services S.A.E. (a/k/a OT Ventures Internet portals and other ventures in Egypt including Link Development, ARPU+ and LINKonLine) and
• 1% ownership stake in ARPU for Telecommunications Services S.A.E.

Orascom Telecom Holdings Annual Report 2011Orascom Telecom Holdings Annual Report 2011 5554
begins up to the date when that significant influence ceases. Investments in associates with negative shareholders’ equity are impaired and a provision for its losses is accrued only if the Group has a legal or constructive obligation to cover such losses. Equity changes in investees accounted for using the equity method that do not result from profit or loss are recognized directly in consolidated equity reserves;
• unrealized gains and losses generated from transactions between the Company or its subsidiaries and its investees accounted for using the equity method are eliminated on consolidation for the portion
pertaining to the Group; unrealized losses are eliminated unless they represent an impairment.
• The license of the Group’s associated undertaking in Canada, Globalive Wireless Management Corp, are indefinite lived assets. Although the spectrum licenses have an initial term of 10 years, based on available information, the management believes that they are subject to perfunctory renewal and that renewal cost will not be significant. Accordingly, they are not subject to amortization but are tested annually for impairment, or when indicators exist that the carrying value is not recoverable.
Joint ventures
Joint ventures are those entities over whose activities the Group has joint control, established by contractual agreement and requiring unanimous consent for strategic financial and operating decisions.
Interests in joint ventures are consolidated using the proportionate method under which the assets and liabilities and income and expenses of the joint venture are consolidated on a line-by-line basis in proportion to the share held by the Group in the venture. The carrying amount of the consolidated investment is then eliminated against the respective portion of equity. Transactions, balances and any unrealized gains and losses on intercompany transactions are proportionately eliminated.
Unrealized gains arising from transactions with associates (and jointly controlled entities) are eliminated to the extent of the Group’s interest in the enterprise. Unrealized gains resulting from transactions with associates and joint ventures are eliminated against the investment in the associates or joint venture.
Appendix C includes a list of the entities included in the scope of consolidation.
Foreign currency translation
Functional and presentation currency
The functional currency of each subsidiary is the local currency where that entity operates. The functional currency of OTH is the Egyptian Pound. In order to present financial information to international investors the Group’s presentation currency is US$.
Transactions and balances
Transactions in foreign currencies are translated into the functional currency of the relevant entity at the exchange rate prevailing at the date of the transaction. Monetary assets and liabilities denominated in foreign currencies are translated, at the balance sheet date, into the prevailing exchange rates at that date. Foreign currency exchange differences arising on the settlement of transactions and the translation of the balance sheet are recognized in the income statement.
Group companies
The financial statements of the Group entities are translated into the presentation currency as follows:
• assets and liabilities are translated at the closing exchange rate;
• income and expenses are translated at the average exchange rate for the year;
• all resulting exchange differences are recognized as a separate component of equity in the “translation reserve”;
• goodwill and fair value adjustments arising on the acquisition of a foreign entity are treated as assets and liabilities of the foreign entity and are translated at the closing exchange rate; and
• in the preparation of the consolidated cash flow statement, the cash flows of foreign subsidiaries are translated at the average exchange rate for the year.
renegotiates the terms of a financial liability with its creditor and the creditor agrees to accept the entity’s shares or other equity instruments to settle the financial liability fully or partially.
• IFRIC 14 (amendment), “IAS 19 – The limit on a defined benefit assets, minimum funding requirements and their interaction”. The amendment removes unintended consequences arising from the treatment of pre-payments where there is a minimum funding requirement. Results in pre-payments of contributions in Certain circumstances being recognized as an asset rather than an expense.
3.3 Summary of main accounting principles and policies
The main accounting principles and policies adopted in preparing these Consolidated Financial Statements are set our below. These policies have been consistently applied to all periods in those consolidated financial statements, and have been applied consistently by the group entities.
Basis of consolidation
The Consolidated Financial Statements include the financial statements of the Company and those entities over which the Company exercises control, both directly or indirectly, from the date of acquisition to the date when such control ceases. Control may be exercised through direct or indirect ownership of shares with majority voting rights, or by exercising a dominant influence expressed as the direct or indirect power, based on contractual agreements or statutory provisions, to determine the financial and operational policies of the entity and obtain the related benefits, regardless of any equity relationships. The existence of potential voting rights that are exercisable or convertible at the balance sheet date is also considered when determining whether there is control or not.
The financial statements used in the consolidation process are those prepared by the individual Group entities as of and for the year ended December 31, 2011 (the reporting date for these Consolidated Financial Statements) in accordance with IFRS and approved by the respective Boards of Directors.
The consolidation procedures used are as follows:
• the assets and liabilities and income and expenses of consolidated subsidiaries are included on a line-by-line basis, allocating to non-controlling interests, where applicable, the share of equity and profit or loss for the year that is attributable to them. The resulting balances are presented separately in consolidated equity and the consolidated income statement;
• the purchase method of accounting is used to account for business
combinations in which the control of an entity is acquired. The cost of an acquisition is measured as the fair value of the assets acquired, liabilities incurred or assumed and equity instruments issued at the acquisition date, plus all other costs directly attributable to the acquisition. The excess of the cost of acquisition over the fair value of the assets, liabilities and contingent liabilities acquired is recorded as goodwill. If the cost of acquisition is less than the fair value of the net assets of the subsidiary acquired, the difference is recognized immediately in the income statement;
• business combinations in which all of the combining entities or businesses are ultimately controlled by the same party or parties both before and after the business combination are considered business combinations involving entities under common control. In the absence of an accounting standard guiding the accounting treatment of these operations and in accordance with IAS 8, the Group consolidate the book values of the entity transferred and report any gains arising from the transfer in goodwill;
• the purchase of equity holdings from non-controlling holders in entities where control is already exercised is considered a purchase. Therefore the difference between the cost incurred for the acquisition and the respective share of the accounting equity acquired is recognized in goodwill;
• any options to purchase non-controlling interests outstanding at the end of the year are treated as exercised and are reported as a financial liability or in equity depending on whether the transaction is to be settled in cash or through the exchange of equity instruments;
• unrealized gains and losses on transactions carried out between companies consolidated on a line-by-line basis and the respective tax effects are eliminated if material, as are corresponding balances for receivables and payables, income and expense, and finance income and expense;
• gains and losses arising from the sale of holdings in consolidated entities are recognized in the income statement as the difference between the selling price and the corresponding portion of consolidated equity sold.
Associates
Investments in companies where the Group exercises a significant influence (hereafter “associates”), which is presumed to exist when the Group holds between 20% and 50%, are accounted for using the equity method.
The equity method is as follows:
• the Group’s share of the profit or loss of an investee is recognized in the income statement from the date when significant influence
Notes to the consolidated financial statements
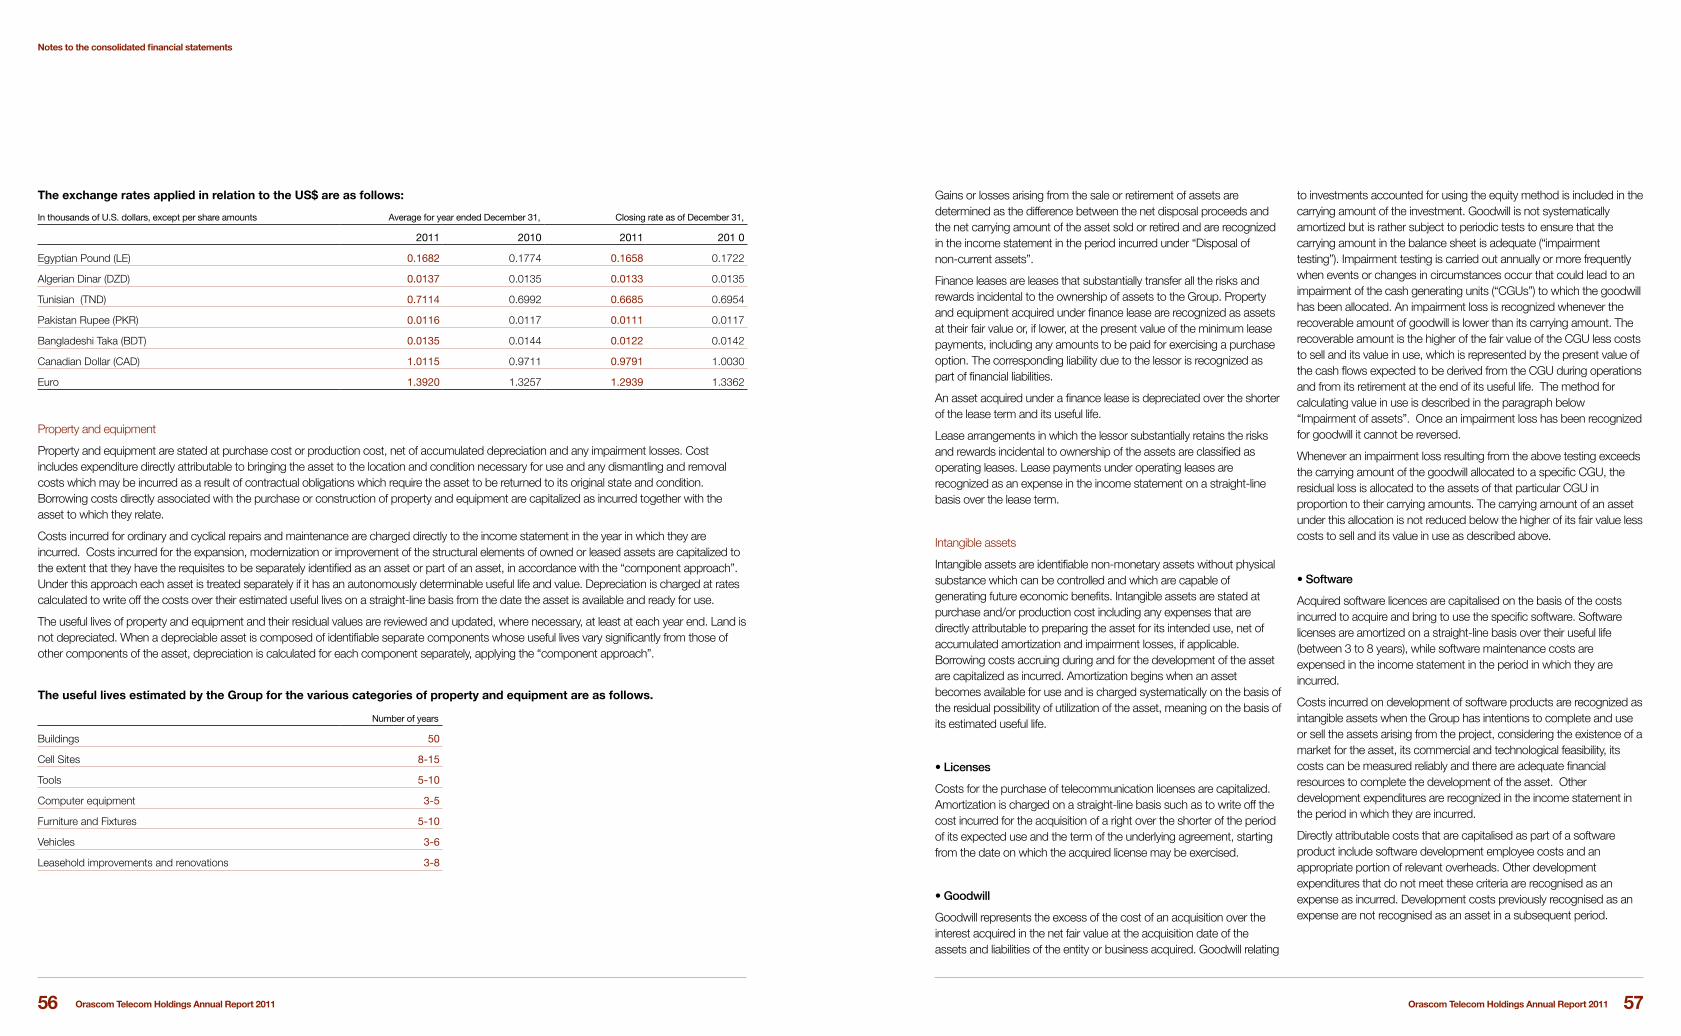
Orascom Telecom Holdings Annual Report 2011Orascom Telecom Holdings Annual Report 2011 5756
Gains or losses arising from the sale or retirement of assets are determined as the difference between the net disposal proceeds and the net carrying amount of the asset sold or retired and are recognized in the income statement in the period incurred under “Disposal of non-current assets”.
Finance leases are leases that substantially transfer all the risks and rewards incidental to the ownership of assets to the Group. Property and equipment acquired under finance lease are recognized as assets at their fair value or, if lower, at the present value of the minimum lease payments, including any amounts to be paid for exercising a purchase option. The corresponding liability due to the lessor is recognized as part of financial liabilities.
An asset acquired under a finance lease is depreciated over the shorter of the lease term and its useful life.
Lease arrangements in which the lessor substantially retains the risks and rewards incidental to ownership of the assets are classified as operating leases. Lease payments under operating leases are recognized as an expense in the income statement on a straight-line basis over the lease term.
Intangible assets
Intangible assets are identifiable non-monetary assets without physical substance which can be controlled and which are capable of generating future economic benefits. Intangible assets are stated at purchase and/or production cost including any expenses that are directly attributable to preparing the asset for its intended use, net of accumulated amortization and impairment losses, if applicable. Borrowing costs accruing during and for the development of the asset are capitalized as incurred. Amortization begins when an asset becomes available for use and is charged systematically on the basis of the residual possibility of utilization of the asset, meaning on the basis of its estimated useful life.
• Licenses
Costs for the purchase of telecommunication licenses are capitalized. Amortization is charged on a straight-line basis such as to write off the cost incurred for the acquisition of a right over the shorter of the period of its expected use and the term of the underlying agreement, starting from the date on which the acquired license may be exercised.
• Goodwill
Goodwill represents the excess of the cost of an acquisition over the interest acquired in the net fair value at the acquisition date of the assets and liabilities of the entity or business acquired. Goodwill relating
to investments accounted for using the equity method is included in the carrying amount of the investment. Goodwill is not systematically amortized but is rather subject to periodic tests to ensure that the carrying amount in the balance sheet is adequate (“impairment testing”). Impairment testing is carried out annually or more frequently when events or changes in circumstances occur that could lead to an impairment of the cash generating units (“CGUs”) to which the goodwill has been allocated. An impairment loss is recognized whenever the recoverable amount of goodwill is lower than its carrying amount. The recoverable amount is the higher of the fair value of the CGU less costs to sell and its value in use, which is represented by the present value of the cash flows expected to be derived from the CGU during operations and from its retirement at the end of its useful life. The method for calculating value in use is described in the paragraph below “Impairment of assets”. Once an impairment loss has been recognized for goodwill it cannot be reversed.
Whenever an impairment loss resulting from the above testing exceeds the carrying amount of the goodwill allocated to a specific CGU, the residual loss is allocated to the assets of that particular CGU in proportion to their carrying amounts. The carrying amount of an asset under this allocation is not reduced below the higher of its fair value less costs to sell and its value in use as described above.
• Software
Acquired software licences are capitalised on the basis of the costs incurred to acquire and bring to use the specific software. Software licenses are amortized on a straight-line basis over their useful life (between 3 to 8 years), while software maintenance costs are expensed in the income statement in the period in which they are incurred.
Costs incurred on development of software products are recognized as intangible assets when the Group has intentions to complete and use or sell the assets arising from the project, considering the existence of a market for the asset, its commercial and technological feasibility, its costs can be measured reliably and there are adequate financial resources to complete the development of the asset. Other development expenditures are recognized in the income statement in the period in which they are incurred.
Directly attributable costs that are capitalised as part of a software product include software development employee costs and an appropriate portion of relevant overheads. Other development expenditures that do not meet these criteria are recognised as an expense as incurred. Development costs previously recognised as an expense are not recognised as an asset in a subsequent period.
The exchange rates applied in relation to the US$ are as follows:
In thousands of U.S. dollars, except per share amounts Average for year ended December 31, Closing rate as of December 31,
2011 2010 2011 201 0
Egyptian Pound (LE) 0.1682 0.1774 0.1658 0.1722
Algerian Dinar (DZD) 0.0137 0.0135 0.0133 0.0135
Tunisian (TND) 0.7114 0.6992 0.6685 0.6954
Pakistan Rupee (PKR) 0.0116 0.0117 0.0111 0.0117
Bangladeshi Taka (BDT) 0.0135 0.0144 0.0122 0.0142
Canadian Dollar (CAD) 1.0115 0.9711 0.9791 1.0030
Euro 1.3920 1.3257 1.2939 1.3362
Property and equipment
Property and equipment are stated at purchase cost or production cost, net of accumulated depreciation and any impairment losses. Cost includes expenditure directly attributable to bringing the asset to the location and condition necessary for use and any dismantling and removal costs which may be incurred as a result of contractual obligations which require the asset to be returned to its original state and condition. Borrowing costs directly associated with the purchase or construction of property and equipment are capitalized as incurred together with the asset to which they relate.
Costs incurred for ordinary and cyclical repairs and maintenance are charged directly to the income statement in the year in which they are incurred. Costs incurred for the expansion, modernization or improvement of the structural elements of owned or leased assets are capitalized to the extent that they have the requisites to be separately identified as an asset or part of an asset, in accordance with the “component approach”. Under this approach each asset is treated separately if it has an autonomously determinable useful life and value. Depreciation is charged at rates calculated to write off the costs over their estimated useful lives on a straight-line basis from the date the asset is available and ready for use.
The useful lives of property and equipment and their residual values are reviewed and updated, where necessary, at least at each year end. Land is not depreciated. When a depreciable asset is composed of identifiable separate components whose useful lives vary significantly from those of other components of the asset, depreciation is calculated for each component separately, applying the “component approach”.
The useful lives estimated by the Group for the various categories of property and equipment are as follows.
Number of years
Buildings 50
Cell Sites 8-15
Tools 5-10
Computer equipment 3-5
Furniture and Fixtures 5-10
Vehicles 3-6
Leasehold improvements and renovations 3-8
Notes to the consolidated financial statements

Orascom Telecom Holdings Annual Report 2011Orascom Telecom Holdings Annual Report 2011 5958
• Financial receivables
Financial receivables are non-derivative financial instruments which are not traded on an active market and which are expected to generate fixed or determinable repayments. They are included as current assets unless they are contractually due more than twelve months after the balance sheet date in which case they are classified as non-current assets. These assets are measured at amortized cost using the effective interest method. If there is objective evidence of factors which indicate impairment, the asset is reduced to the present value of future cash flows. The impairment loss is recognized in the income statement. If in future years the factors which caused the impairment cease to exist, the carrying amount of the asset is reinstated up to the amount that would have been obtained had amortized cost been applied.
• Financial assets available-for-sale
Financial assets available for sale are non-derivative financial instruments which are either designated in this category or not classified in any of the other categories. Available for sale financial assets are measured at fair value. Changes in the fair value of monetary securities denominated in a foreign currency and classified as available for sale are analyzed between translation differences resulting from changes in amortized cost of the security and other changes in the carrying amount of the security. The translation differences on monetary securities are recognized in profit or loss; translation differences on non-monetary securities are recognized in equity. Changes in the fair value of monetary and non-monetary securities classified as available for sale are recognized in equity.
When securities classified as available for sale are sold or impaired, the accumulated fair value adjustments recognized in equity are included in the income statement.
The classification of an asset as current or non-current is the consequence of strategic decisions regarding the estimated period of ownership of the asset and its effective marketability, with those which are expected to be realized within twelve months from the balance sheet date being classified as current assets.
• Financial assets held to maturity
These are non-derivative assets with fixed maturities that the Group has the intention and ability to hold to maturity. Those maturing within 12 months are carried as current assets. These financial assets are measured at amortized cost using the effective interest method.
Impairment of financial assets
Individually significant financial assets are tested for impairment on an individual basis. The remaining financial assets are assessed collectively in groups that share similar credit risk characteristics. In the case of equity securities classified as available for sale, a significant or prolonged decline in the fair value of the security below its cost is considered as an indicator that the securities are impaired. If any such evidence exists for available for sale financial assets, the cumulative loss – measured as the difference between the acquisition cost and the current fair value, less any impairment loss on that financial asset previously recognized in profit or loss – is removed from equity and recognized in the income statement. Impairment losses recognized in the income statement on equity instruments are not reversed through the income statement.
Financial liabilities
Financial liabilities consisting of borrowings, trade payables and other obligations are measured at amortized cost using the effective interest method. When there is a change in cash flows which can be reliably estimated, the value of the financial liability is recalculated to reflect such change based on the present value of expected cash flows and the originally determined internal rate of return. Financial liabilities are classified as current liabilities except where the Group has an unconditional right to defer payment until at least twelve months after the balance sheet date.
Financial liabilities are derecognized when settled and the Group has transferred all the related costs and risks relating to an instrument.
Derivative financial instruments
Derivatives are initially recognized at fair value on the date a derivative contract is entered into and subsequently remeasured at fair value. The method of recognizing the resulting gain or loss depends on whether the derivative is designated as a hedging instrument, and if so, the nature of the item being hedged.
The Group documents at the inception of the transaction the relationship between hedging instruments and hedged items, as well as its risk management objectives and strategy for undertaking various hedging transactions. The Group also documents its assessment, both at hedge inception and on an ongoing basis, of whether the derivatives that are used in hedging transactions are highly effective in offsetting changes in fair values or cash flows of hedged items.
The full fair value of a hedging derivative is classified as a current asset or liability when the remaining maturity of the hedged item is less than 12 months. Derivatives which do not qualify for hedge accounting are classified as a financial asset at fair value through profit or loss.
• Customer List
The customer list as an intangible asset consists of the list of customers identified when allocating the purchase price in acquisitions carried out by the Group. Amortization is charged on the basis of the respective estimated useful lives which range from 5 to 10 years.
Impairment of non-financial assets
At each balance sheet date, property and equipment and intangible assets with finite lives are assessed to determine whether there is any indication that an asset may be impaired. If any such indication exists, the recoverable amount of the asset concerned is estimated and any impairment loss is recognized in the income statement. Intangible assets with an indefinite useful life are tested for impairment annually or more frequently when events or changes in circumstances occur that could lead to an impairment loss. The recoverable amount of an asset is the higher of its fair value less costs to sell and its value in use, which is represented by the present value of its estimated future cash flows. In determining an asset’s value in use the estimated future cash flows are discounted using a pre-tax rate that reflects the market’s current assessment of the cost of money for the investment period and the specific risk profile of the asset. If an asset does not generate independent cash flows its recoverable amount is determined in relation to the cash-generating unit (CGU) to which it belongs. An impairment loss is recognized in the income statement when the carrying amount of an asset or the CGU to which it is allocated exceeds its recoverable amount. If the reasons for previously recognizing an impairment loss cease to exist, the carrying amount of an asset other than goodwill is increased to the net carrying amount of the asset that would have been determined (net of amortization or depreciation) had no impairment loss been recognized for the asset, with the reversal being recognized in the income statement.
Investments
Investments in companies other than those classified as available for sale are measured at fair value with any changes in fair value being recognized in the income statement. (The accounting treatment of financial assets available for sale is discussed in “Financial assets available for sale”). If fair value cannot be reliably determined, an investment is measured at cost. Cost is adjusted for impairment losses if necessary, as described in the paragraph “Impairment of financial assets”. If the reasons for an impairment loss no longer exist, the carrying amount of the investment is increased up to the extent of the loss with the related effect recognized in the income statement. Any risk arising from losses exceeding the carrying amount of the investment is accrued in a specific provision to the extent of the Group’s legal or constructive obligations on behalf of the associate. Investments held for
sale or to be wound up in the short term are classified as current assets and stated at the lower of their carrying amount and fair value less costs to sell.
Financial instruments
Financial instruments consist of financial assets and liabilities whose classification is determined on their initial recognition and on the basis of the purpose for which they were purchased. Purchases and sales of financial instruments are recognized at their settlement date. Financial assets are derecognized when the right to receive cash flows from them ceases and the Group has effectively transferred all risks and rewards related to the instrument and its control.
The fair values of quoted investments are based on current bid prices. If the market for a financial asset is not active (and for unlisted securities), the Group establishes fair value by reference to prices supplied by third-party operators and by using valuation models based primarily on objective financial variables and, where possible, prices in recent transactions and market prices for similar financial instruments.
• Financial Assets
Financial assets are initially recognized at fair value and classified in one of the following four categories and subsequently measured as described:
• Financial assets at fair value through profit or loss
Financial assets at fair value through profit or loss includes financial assets purchased primarily for sale in the short term, (held for trading) and derivative financial instruments, except for the effective portion of those designated as cash flow hedges. These assets are measured at fair value; any change in the year is recognized in the income statement. Financial instruments included in this category are classified as current assets if they are held for trading or expected to be disposed of within twelve months from the balance sheet date. Derivatives are treated as assets or liabilities depending on whether their fair value is positive or negative; positive and negative fair values arising from transactions with the same counterparty are offset if this is contractually provided for. Fair value gains and losses from foreign currency swaps are recognized in foreign currency gains and losses in the income statement.
Notes to the consolidated financial statements

Orascom Telecom Holdings Annual Report 2011Orascom Telecom Holdings Annual Report 2011 6160
Deferred income tax is provided on temporary differences arising on investments in subsidiaries, associates and joint ventures, except where the timing of the reversal of the temporary difference is controlled by the Group and it is probable that the temporary difference will not reverse in the foreseeable future.
Additional income taxes that arise from the distribution of dividends are recognised at the same time that the liability to pay the related dividend is recognised.
Deferred tax assets and liabilities are offset if there is a legally enforceable right to offset current tax liabilities and assets, and they relate to income taxes levied by the same tax authority on the same taxable entity, or on different tax entities, but they intend to settle current tax liabilities and assets on a net basis or their tax assets and liabilities will be realised simultaneously.
Provisions
Provisions are only recognized when the Group has a present legal or constructive obligation arising from past events that will result in a future outflow of resources, and when it is probable that this outflow of resources will be required to settle the obligation. The amount provided represents the best estimate of the present value of the outlay required to meet the obligation. The interest rate used in determining the present value of the liability reflects current market rates and takes into account the specific risk of each liability. Provisions are not recognised for future operating losses.
Employee benefits
• Short-term benefits
Short-term benefits are recognized in the income statement in the year when an employee renders service.
• Share-based employee benefits
The Group recognizes additional benefits to certain managers and other members of personnel through share based payment plans. IFRS 2 - Share-based Payment considers these plans to represent a component of employee remuneration. The fair value of the employee services received at the grant date in exchange for the grant of options or shares is recognized as an expense with a correspondent increase in equity. The total amount to be expensed is determined by reference to the fair value of the options granted, excluding the impact of any non-market service and performance vesting conditions. The total amount expensed is recognized over the vesting period, which is the period over which all of the specified vesting conditions are to be satisfied.
Share capital
Ordinary shares are classified as equity. Incremental costs directly attributable to the issue of new shares are shown in equity as a deduction, net of tax, from proceeds.
Treasury shares
Where any Group company purchases the Company’s equity share capital (treasury shares), the consideration paid, including any directly attributable incremental costs (net of income taxes) is deducted from equity attributable to equity holders of the Company until the shares are cancelled or re-issued. Where such shares are subsequently re-issued, any consideration received, net of any directly attributable incremental transaction costs and the related income tax effects, is included in equity attributable to equity holders of the Company.
Legal reserve
As per the Company’s statutes, 5% of net profit for the year is set aside to form a legal reserve, the transfer to such reserve ceases once it reaches 50% of the Company’s paid in share capital. The reserve can be utilized for covering losses or for increasing the Company’s share capital. If the reserve falls below the said 50%, the Company should resume setting aside 5% of its annual net profit until the reserve reaches 50% of the Company’s paid in share capital.
Dividend distribution
Dividend distribution to the Company’s shareholders is recognized as a liability in the Consolidated Financial Statements in the period in which the dividends are approved by the Company’s shareholders.
Revenue recognition
Revenue comprises the fair value of the consideration received or receivable for the sale of goods and services in the ordinary course of the Group’s activities. Revenue is shown net of value added tax, rebates and discounts and after eliminating sales within the Group.
Revenue from the sale of goods is recognized when the Group transfers the risks and rewards of ownership of the goods. Revenue from services is recognized in the income statement by reference to the stage of completion and only when the outcome can be reliably estimated.
More specifically, the criteria followed by the Group in recognizing ordinary revenue are as follows:
• revenue arising from post-paid traffic, interconnection and roaming is recognized on the basis of the actual usage made by each
• Fair value hedge
Changes in the fair value of derivatives that are designated and qualify as fair value hedges are recorded in the income statement, together with any changes in the fair value of the hedged asset or liability that are attributable to the hedged risk. If the hedge is not fully effective, meaning that these changes are different, the non-effective portion is treated as part of the net financing cost for the year in the income statement.
• Cash flow hedge
The effective portion of changes in the fair value of derivatives that are designated and qualify as cash flow hedges is recognized in equity in a specific reserve (the “cash flow hedge reserve”) . The gain or loss relating to the ineffective portion is recognized immediately in the income statement.
A hedge is normally considered highly effective if from the beginning and throughout its life the changes in the expected cash flows for the hedged item are substantially offset by the changes in the fair value of the hedging instrument. When the economic effects deriving from the hedged item are realized, the related gains or losses in the reserve are reclassified to the income statement together with the economic effects of the hedged item. Whenever the hedge is not highly effective, the non-effective portion of the change in fair value of the hedging instrument is immediately recognized as part of the net financing cost for the year in the income statement.
When a hedging instrument expires or is sold, or when a hedge no longer meets the criteria for hedge accounting, any cumulative gain or loss existing in equity at that time remains in equity and is recognized when the forecast transaction is ultimately recognized in the income statement. When a forecast transaction is no longer expected to occur, the cumulative gain or loss that was reported in equity is immediately transferred to the income statement.
Inventories
Inventories are stated at the lower of purchase cost or production cost and net realizable value. Cost is based on the weighted average method. Net realizable value is the estimated selling price in the ordinary course of business, less the estimated costs of completion and selling expenses. When necessary, obsolescence allowances are made for slow-moving and obsolete inventories. Inventories mainly comprise handsets and SIM cards.
Cash and cash equivalents
Cash and cash equivalents include cash in hand, deposits held at call with banks and other short-term highly liquid investments with original maturities of three months or less.
Non-current assets and liabilities held for sale
Non-current assets (or disposal groups comprising assets and liabilities) that are expected to be recovered primarily through sale rather than through continuing use is classified as held for sale. Immediately before classification as held for sale, the assets (or components of a disposal group) are remeasured in accordance with the Group’s accounting policies. Thereafter the assets and liabilities held for sale (or disposal group) are measured at the lower of their carrying amount and fair value less cost to sell. Any impairment loss on a disposal group first is allocated to goodwill, and then to remaining assets and liabilities on pro rata basis, except that no loss is allocated to inventories, financial assets, and deferred tax assets, which continue to be measured in accordance with the Group’s accounting policies. Impairment losses on initial classification as held for sale and subsequent losses on remeasurement are recognised in the income statement. Subsequent increase in fair value less costs to sell may be recognised in the income statement only to the extent of the cumulative impairment loss that has been recognised previously.
Current and deferred income tax
The tax expense for the period comprises current and deferred tax. Tax is recognised in the income statement, except to the extent that it relates to items recognised directly in equity. In this case, the tax is also recognised in equity.
The current income tax charge is calculated on the basis of the tax laws enacted or substantively enacted at the balance sheet date in the countries where the Group’s subsidiaries, associates and joint venture operate and generate taxable income. Management periodically evaluates positions taken in tax returns with respect to situations in which applicable tax regulation is subject to interpretation. It establishes provisions where appropriate on the basis of amounts expected to be paid to the tax authorities.
Deferred income tax is recognized, using the balance sheet liability method, on temporary differences arising between the tax bases of assets and liabilities and their carrying amounts in the consolidated financial statements. However, deferred income tax is not accounted for if it arises from initial recognition of goodwill or the initial recognition of an asset or liability in a transaction other than a business combination that at the time of the transaction affects neither accounting nor taxable profit or loss. Deferred income tax is determined using tax rates (and laws) that have been enacted or substantially enacted at the balance sheet date and are expected to apply when the related deferred income tax asset is realised or the deferred income tax liability is settled.
Deferred income tax assets are recognized only to the extent that it is probable that future taxable profit will be available against which the temporary differences can be utilized.
Notes to the consolidated financial statements
Orascom Telecom Holdings Annual Report 2011Orascom Telecom Holdings Annual Report 2011 6362
is the first standard issued as part of a wider project to replace IAS 39. IFRS 9 retains but simplifies the mixed measurement model and establishes two primary measurement categories for financial assets: amortized cost and fair value. The basis of classification depends on the entity’s business model and the contractual cash flow characteristics of the financial asset. The guidance in IAS 39 on impairment of financial assets and hedge accounting continues to apply.
IFRS 10, “Consolidated financial statements” (effective date January 1, 2013). The objective of IFRS 10 is to establish principles for the presentation and preparation of consolidated financial statements when an entity controls one or more other entity (an entity that controls one or more other entities) to present consolidated financial statements. Defines the principle of control, and establishes controls as the basis for consolidation. Set out how to apply the principle of control to identify whether an investor controls an investee and therefore must consolidate the investee. Sets out the accounting requirements for the preparation of consolidated financial statements.
IFRS 11, “Joint arrangements” (effective date January 1, 2013). IFRS 11 is a more realistic reflection of joint arrangements by focusing on the rights and obligations of the arrangement rather than its legal form. Proportional consolidation of joint ventures is no longer allowed.
IFRS 12, “Disclosures of interests in other entities” (effective date January 1, 2013). IFRS 12 includes the disclosure requirements for all forms of interests in other entities, including joint arrangements, associates, special purpose vehicles and other off balance sheet vehicles.
IFRS 13, “Fair value measurement” (effective date January 1, 2013). IFRS 13 aims to improve consistency and reduce complexity by providing a precise definition of fair value and a single source of fair value measurement and disclosure requirements for use across IFRSs. The requirements, which are largely aligned between IFRSs and US GAAP, do not extend the use of fair value accounting but provide guidance on how it should be applied where its use is already required or permitted by other standards within IFRSs or US GAAP.
IAS 28, “Associates and joint ventures” (revised). This revised standard includes the requirements for joint ventures, as well as associates, to be equity accounted following the issue of IFRS 11.
The Group is currently assessing the impact of these new standards and amendments.
4 Use of Estimates
The preparation of these Consolidated Financial Statements required management to apply accounting policies and methodologies that are based on complex, subjective judgments, estimates based on past experience and assumptions determined from time to time to be
reasonable and realistic based on the related circumstances. The use of these estimates and assumptions affects the amounts reported in the balance sheet, the income statement and the cash flow statement as well as the notes. The final amounts for items for which estimates and assumptions were made in the Consolidated Financial Statements may differ from those reported in these statements due to the uncertainties that characterize the assumptions and conditions on which the estimates are based.
The accounting principles requiring a higher degree of subjective judgment in making estimates and for which changes in the underlying conditions could significantly affect the Consolidated Financial Statements are briefly described below.
Goodwill
Goodwill is tested for impairment on an annual basis to determine whether any impairment losses have arisen that should be recognized in the income statement. More specifically, the test is performed by allocating the goodwill to a cash generating unit and subsequently estimating the unit’s fair value. Should the fair value of the net capital employed be lower than the carrying amount of the CGU an impairment loss is recognized for the allocated goodwill. The allocation of goodwill to cash generating units and the determination of the fair value of a CGU requires estimates to be made that are based on factors that may vary over time and that could as a result have an impact on the measurements made by management which might be significant.
Impairment of non-current assets
Non-current assets are reviewed to determine whether there are any indications that the net carrying amount of these assets may not be recoverable and that they have suffered an impairment loss that needs to be recognized. In order to determine whether any such elements exist it is necessary to make subjective measurements, based on information obtained within the Group and in the market and also on past experience. When a potential impairment loss emerges it is estimated by the Group using appropriate valuation techniques. The identification of the elements that may determine a potential impairment loss and the estimates used to measure such loss depend on factors which may vary over time, thereby affecting the estimates and measurements.
Depreciation of non-current assets
The cost of property and equipment is depreciated on a straight-line basis over the useful lives of the assets. The useful life of property and equipment is determined when the assets are purchased and is based on the past experience of similar assets, market conditions and
subscriber and telephone operator. Such revenue includes amounts paid for access to and usage of the Group network by customers and other domestic and international telephone operators;
• revenue from the sale of prepaid cards and recharging is recognized on the basis of the prepaid traffic actually used by subscribers during the year. The unused portion of traffic at period end is recognized as deferred income in “other liabilities”;
• revenue from the sale of mobile phones and fixed-line phones and related accessories is recognized at the time of sale;
• one-off revenue from landline and mobile (prepaid or subscription) activation and/or substitution, prepaid recharge fees and the activation of new services and tariff plans is recognized for the full amount at the moment of activation independent of the period in which the actual services are rendered by the Group. In the case of promotions with a cumulative plan still open at the end of the year, the activation fee is recognized on an accruals basis so as to match the revenue with the year in which the service may be used.
Dividend income from investments recorded at fair value through profit and loss or as available for sale is recognized when the right to receive payment is established.
Interest income
Interest income is recognized on a time-proportion basis using the effective interest rate method.
Earnings per share
Basic
Basic earnings per share are calculated by dividing the profit for the year attributable to equity holders of the Company, both from continuing and discontinued operations, by the weighted average number of ordinary shares in issue during the year excluding ordinary shares purchased by the Company and held as treasury shares.
Diluted
Diluted earnings per share are calculated by dividing the profit for the year attributable to equity holders of the Company by the weighted average of the number of ordinary shares of the Company outstanding during the year where, compared to basic earnings per share, the weighted average number of shares outstanding is modified to include the conversion of all dilutive potential shares, while the profit for the year is modified to include the effects of such conversion net of taxation. Diluted earnings per share are not calculated when there are losses as any dilutive effect would improve earnings per share.
Discontinued operations
A discontinued operation is a component of the Group’s business that represents a separate major line of business or geographical area of operations that has been disposed of or is held for sale, or is a subsidiary acquired exclusively with a view to resale. Classification as a discontinued operation occurs upon disposal or when the operation meets the criteria to be classified as held for sale, if earlier. When an operation is classified as a discontinued operation, the comparative income statement is re-presented as if the operation had been discontinued from the start of the comparative period.
Segment reporting
Operating segments are reported in a manner which is consistent with the internal reporting information provided to the chief operating decision-maker. The chief operating decision-maker, who is responsible for allocating resources and assessing performance of the operating segments, has been identified as the board of directors.
Recent accounting pronouncements
The following new standards, amendments to standards and interpretations have been issued but are not effective for the financial year 2011 and have not been early adopted:
IFRS 7 (amendment), “Financial instruments: Disclosures” (effective date July 1, 2011). The amendment will promote transparency in the reporting of transfer transactions and improve users’ understanding of the risk exposures relating to transfers of financial assets and the effect of those risks on an entity’s financial position, particularly those involving securitization of financial assets.
IAS 12 (amendment), “Income taxes” (effective date January 1, 2012). The amendment introduces an exception to the existing principle for the measurement of deferred tax assets or liabilities arising on investment property measured at fair value.
IAS 1 (amendment), “Financial statement presentation” (effective date July 1, 2012). The main change resulting from these amendments is a requirement for entities to group items presented in ‘other comprehensive income’ (OCI) on the basis of whether they are potentially reclassifiable to profit or loss subsequently (reclassification adjustments). The amendments do not address which items are presented in OCI.
IAS 19 (amendment), “Employee benefits” (effective date January 1, 2013). These amendments eliminate the corridor approach and calculate finance costs on a net funding basis.
IFRS 9, “Financial instruments” (effective date January 1, 2015). IFRS 9
Notes to the consolidated financial statements

Orascom Telecom Holdings Annual Report 2011Orascom Telecom Holdings Annual Report 2011 6564
As of December 31, 2011, if the functional currencies had weakened / strengthened by 10% against the US$, the Euro and CAD, with all other variables held constant, the translation of foreign currency receivables and payables would have resulted in a decrease/ increase in profit for the year (after tax)of US$ 5 million, mainly relating to US$ denominated borrowings.
Additionally, the Group has investments in foreign operations, whose net assets are exposed to foreign currency translation risk. Currency exposure to such risk is not hedged.
Cash flow and fair value interest rate risk
The Group is exposed to market risks as a result of changes in interest rates particularly in relation to borrowings. Borrowings issued at floating rates expose the Group to cash flow interest rate risk. Borrowings issued at fixed rates expose the Group to fair value interest rate risk.
The basic strategy of interest rate risk management is to balance the debt structure with an appropriate mix of fixed and floating interest rate borrowings based on the Group’s perception of future interest rate movements. In particular, the risk monitored relates to the impact of movements in floating rate indices on the Group’s finance costs. As of December 31, 2011 26.5% of the Group’s financial liabilities were floating rate liabilities, mainly relating to borrowings of PMCL.
Prior the Refinancing Plan the Group used certain interest rate derivatives to hedge movements in interest rates. Subsequent to the Refinancing Plan, the majority of the Group’s long term borrowings are fixed rate. Therefore the Group does not use interest rate derivatives.
The Group considers the sensitivity of its finance costs to movements in interest rates. In particular an increase / decrease of 1.0% in interest rates as of December 31, 2010 would have resulted in an increase / decrease in finance costs of US$ 11million.
Price risk
The Group has limited exposure to equity securities price risk on investments held by the Group.
Credit Risk
The Group considers that it is not exposed to major concentrations of credit risk in relation to trade receivables. However, credit risk can arise in the event of non-performance of a counterparty, particularly in relation to credit exposures for trade and other receivables, financial instruments and cash and cash equivalents.
The Group considers that the concentration of credit risk with respect to trade receivables is limited given that the Group’s customer base is largely pre-paid subscribers. Post paid subscribers generally represent a small portion of the subscriber base and therefore the credit exposure
is limited. In addition, the Group tries to mitigate credit risk by adopting specific control procedures, including assessing the credit worthiness of the counterparty and limiting the exposure to any one counterparty.
Credit risk relating to cash and cash equivalents, derivative financial instruments and financial deposits arises from the risk that the counterparty becomes insolvent and accordingly is unable to return the deposited funds or execute the obligations under the derivative transactions as a result of the insolvency. To mitigate this risk, wherever possible the Group conducts transactions and deposits funds with financial institutions with a minimum of investment grade rating.
The Group is exposed to credit risk relating to financial receivables as follows:
• During 2008 the Company entered into two loan agreements to provide a total amount of CAD 508 million to Globalive Wireless Management Corp (“GWMC”), a subsidiary of the associate Globalive Investment Holdings Corp (“Globalive”). During 2009, 2010 and 2011 further loans were provided and as of December 31, 2011 the amount outstanding under such loan agreements, including accrued interest, was CAD 1,453 million (equivalent to US$ 1,423 million).The loans were primarily provided to GWMC to fund the acquisition of spectrum licenses in Canada. The licenses were awarded to GWMC during March 2009 by Industry Canada and GWMC launched operations in December 2009. During the start-up phase of operations Globalive has incurred losses and as a result the Group’s share of losses exceeds the carrying value of the investment. The Group discloses the loan provided together with the excess losses and management fees. After considering such losses an amount of US$ 959 million is recorded in financial receivables. (see Note 21 “Other financial assets” for further details).
In general the remaining other receivables and financial receivables included in financial assets generally relate to a variety of smaller amounts due from a wide range of counterparties, therefore, the Group does not consider that it has a significant concentration of credit risk except for the ones mentioned above.
Liquidity Risk
The Group monitors and mitigates liquidity risk arising from the uncertainty of cash inflows and outflows by maintaining sufficient liquidity of cash balances as well as undrawn credit lines and by diversifying its sources of finance. In general, liquidity risk is monitored at entity level whereby each subsidiary is responsible for managing and monitoring its cashflows and rolling liquidity reserve forecast in order to ensure that it has sufficient committed facilities to meet its liquidity needs.
forecasts concerning future events which may affect them, amongst which are changes in technology. The actual useful lives may therefore differ from the estimates of these lives. The Group regularly reviews technological and business sector changes, dismantling costs and recoverable amounts in order to update residual useful lives. Such regular updating may entail a change of the depreciation period and consequently a change in the depreciation charged in future years.
Deferred tax assets
The recognition of deferred tax assets is based on forecasts of future taxable profit. The measurement of future taxable profit for the purposes of determining whether or not to recognize deferred tax assets depends on factors which may vary over time and which may lead to significant effects on the measurement of this item.
Income tax
The companies of the Group are subject to different tax legislation. A significant amount of estimates are necessary in order to account for the total tax effects on the financial statements. The Group has a number of operations for which the relevant taxes are difficult to estimate and thus has to accrue some tax liabilities based on estimates. Whenever the actual tax expense is different from the estimated, the difference is recorded in the income statement.
Fair value of derivatives and other financial instruments
The fair value of financial instruments is determined based on quoted market prices, where available, or on estimates using present values or other valuation techniques. Those techniques are significantly affected by the assumptions used, including discount rates and estimates of future cash flows. Where market prices are not readily available, fair value is based on either estimates obtained from independent experts or quoted market prices of comparable instruments.
Provisions and contingencies
In recognizing provisions the Group analyses the extent to which it is probable that a liability will arise from disputes with employees, suppliers and third parties and in general the losses it will be required to incur as a result of past obligations. The definition of such provisions entails making estimates based on currently known factors which may vary over time and which could actually turn out to be significantly different from those referred to in preparing the financial statements.
5. Financial Risk Management
Financial Risk Factors
The Group’s activities expose it to a variety of financial risks: market risk (including currency risk, fair value interest risk and cash flow interest
risk), credit risk and liquidity risk. In particular the Group is exposed to risks from movements in exchange rates, interest rates and market prices. The Group’s overall risk management program focuses on the unpredictability of financial markets and seeks to minimize potential adverse effects on the Group’s performance through ongoing operational and finance activities. Depending on the risk assessment, the Group uses selected derivative hedging instruments. The management has overall responsibility for the establishment and oversight of the group’s risk management framework.
Market Risk
Foreign exchange risk
The Group operates internationally and is exposed to foreign exchange risk arising when its business transactions are in currencies other than its functional currency. The main currencies to which the Group is exposed are the US Dollar, the Canadian Dollar and the Euro.
In general the Group’s subsidiaries are encouraged to obtain financing in their functional currency in order to have a natural hedge of the exchange rate of such financing. As some transactions are executed in foreign currencies, and in particular in US$, CAD and Euro, the Group may be subject to the risk of exchange rate fluctuations.
As of December 31, 2011 the Group’s borrowings included US$ borrowings amounting to US$ 3,293 million, PKR borrowings amounting to PKR 35,946 million (equivalent to US$ 400 million), BDT borrowings amounting to BDT 18,150 million (equivalent to US$ 222 million) and Euro borrowings amounting to Euro 50 million (equivalent to US$ 65 million).
In certain instances the Group has entered into economic hedging agreements to manage the risk of fluctuations relating to these financing operations. In particular, Pakistan Mobile Communication Limited (“PMCL”) had borrowings for US$ 144 million and Euro 50 million (equivalent to US$ 65 million) as of December 31, 2011. Such borrowings were fully hedged by PMCL using cross currency swaps pursuant to which interest payments and principal payments are paid in Pakistani Rupee.
The Group subsidiaries generally execute their operating activities in their respective functional currencies. Some Group subsidiaries are, however, exposed to foreign currency risks in connection with scheduled payments in currencies that are not their functional currencies. In general this relates to foreign currency denominated supplier payables and receivables. The Group monitors the exposure to foreign currency risk arising from operating activities and, where relevant, enters into hedging transactions in order to manage the exposure.
As described further in “Credit Risk”, the Group has provided loan facilities to Globalive Wireless Management Corp which are denominated in CAD.
Notes to the consolidated financial statements
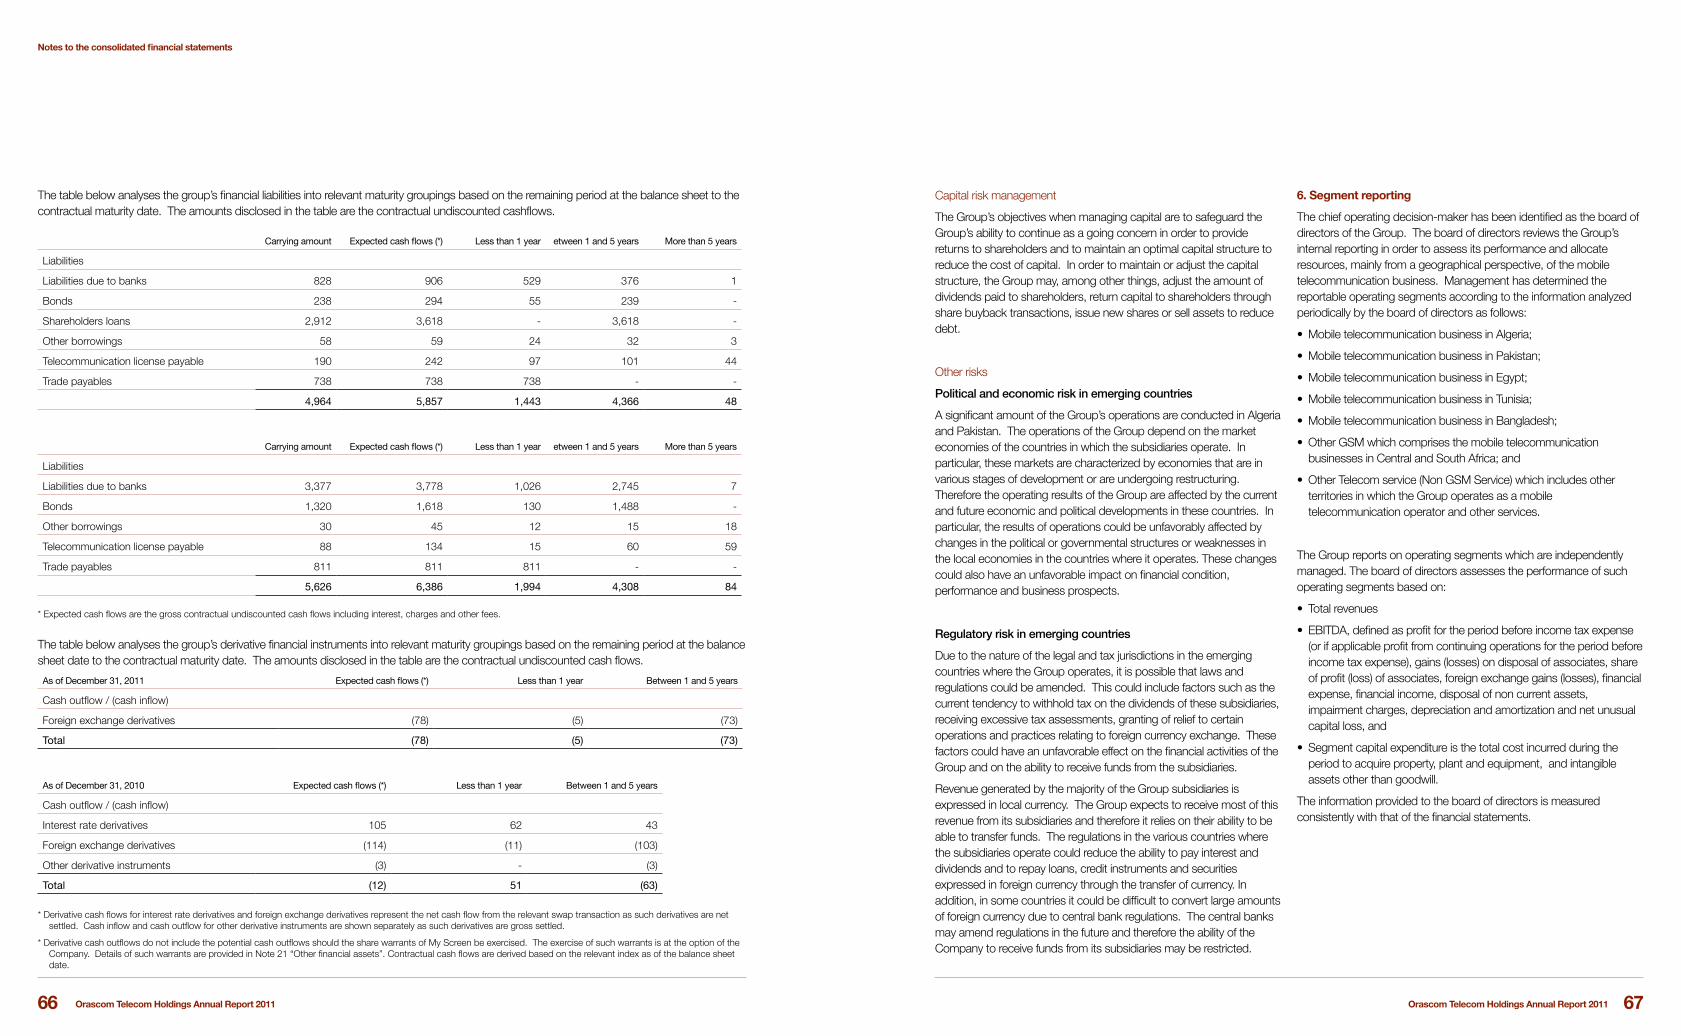
Orascom Telecom Holdings Annual Report 2011Orascom Telecom Holdings Annual Report 2011 6766
Capital risk management
The Group’s objectives when managing capital are to safeguard the Group’s ability to continue as a going concern in order to provide returns to shareholders and to maintain an optimal capital structure to reduce the cost of capital. In order to maintain or adjust the capital structure, the Group may, among other things, adjust the amount of dividends paid to shareholders, return capital to shareholders through share buyback transactions, issue new shares or sell assets to reduce debt.
Other risks
Political and economic risk in emerging countries
A significant amount of the Group’s operations are conducted in Algeria and Pakistan. The operations of the Group depend on the market economies of the countries in which the subsidiaries operate. In particular, these markets are characterized by economies that are in various stages of development or are undergoing restructuring. Therefore the operating results of the Group are affected by the current and future economic and political developments in these countries. In particular, the results of operations could be unfavorably affected by changes in the political or governmental structures or weaknesses in the local economies in the countries where it operates. These changes could also have an unfavorable impact on financial condition, performance and business prospects.
Regulatory risk in emerging countries
Due to the nature of the legal and tax jurisdictions in the emerging countries where the Group operates, it is possible that laws and regulations could be amended. This could include factors such as the current tendency to withhold tax on the dividends of these subsidiaries, receiving excessive tax assessments, granting of relief to certain operations and practices relating to foreign currency exchange. These factors could have an unfavorable effect on the financial activities of the Group and on the ability to receive funds from the subsidiaries.
Revenue generated by the majority of the Group subsidiaries is expressed in local currency. The Group expects to receive most of this revenue from its subsidiaries and therefore it relies on their ability to be able to transfer funds. The regulations in the various countries where the subsidiaries operate could reduce the ability to pay interest and dividends and to repay loans, credit instruments and securities expressed in foreign currency through the transfer of currency. In addition, in some countries it could be difficult to convert large amounts of foreign currency due to central bank regulations. The central banks may amend regulations in the future and therefore the ability of the Company to receive funds from its subsidiaries may be restricted.
6. Segment reporting
The chief operating decision-maker has been identified as the board of directors of the Group. The board of directors reviews the Group’s internal reporting in order to assess its performance and allocate resources, mainly from a geographical perspective, of the mobile telecommunication business. Management has determined the reportable operating segments according to the information analyzed periodically by the board of directors as follows:
• Mobile telecommunication business in Algeria;
• Mobile telecommunication business in Pakistan;
• Mobile telecommunication business in Egypt;
• Mobile telecommunication business in Tunisia;
• Mobile telecommunication business in Bangladesh;
• Other GSM which comprises the mobile telecommunication businesses in Central and South Africa; and
• Other Telecom service (Non GSM Service) which includes other territories in which the Group operates as a mobile telecommunication operator and other services.
The Group reports on operating segments which are independently managed. The board of directors assesses the performance of such operating segments based on:
• Total revenues
• EBITDA, defined as profit for the period before income tax expense (or if applicable profit from continuing operations for the period before income tax expense), gains (losses) on disposal of associates, share of profit (loss) of associates, foreign exchange gains (losses), financial expense, financial income, disposal of non current assets, impairment charges, depreciation and amortization and net unusual capital loss, and
• Segment capital expenditure is the total cost incurred during the period to acquire property, plant and equipment, and intangible assets other than goodwill.
The information provided to the board of directors is measured consistently with that of the financial statements.
The table below analyses the group’s financial liabilities into relevant maturity groupings based on the remaining period at the balance sheet to the contractual maturity date. The amounts disclosed in the table are the contractual undiscounted cashflows.
Carrying amount Expected cash flows (*) Less than 1 year etween 1 and 5 years More than 5 years
Liabilities
Liabilities due to banks 828 906 529 376 1
Bonds 238 294 55 239 -
Shareholders loans 2,912 3,618 - 3,618 -
Other borrowings 58 59 24 32 3
Telecommunication license payable 190 242 97 101 44
Trade payables 738 738 738 - -
4,964 5,857 1,443 4,366 48
Carrying amount Expected cash flows (*) Less than 1 year etween 1 and 5 years More than 5 years
Liabilities
Liabilities due to banks 3,377 3,778 1,026 2,745 7
Bonds 1,320 1,618 130 1,488 -
Other borrowings 30 45 12 15 18
Telecommunication license payable 88 134 15 60 59
Trade payables 811 811 811 - -
5,626 6,386 1,994 4,308 84
* Expected cash flows are the gross contractual undiscounted cash flows including interest, charges and other fees.
The table below analyses the group’s derivative financial instruments into relevant maturity groupings based on the remaining period at the balance sheet date to the contractual maturity date. The amounts disclosed in the table are the contractual undiscounted cash flows.
As of December 31, 2011 Expected cash flows (*) Less than 1 year Between 1 and 5 years
Cash outflow / (cash inflow)
Foreign exchange derivatives (78) (5) (73)
Total (78) (5) (73)
As of December 31, 2010 Expected cash flows (*) Less than 1 year Between 1 and 5 years
Cash outflow / (cash inflow)
Interest rate derivatives 105 62 43
Foreign exchange derivatives (114) (11) (103)
Other derivative instruments (3) - (3)
Total (12) 51 (63)
Notes to the consolidated financial statements
* Derivative cash flows for interest rate derivatives and foreign exchange derivatives represent the net cash flow from the relevant swap transaction as such derivatives are net settled. Cash inflow and cash outflow for other derivative instruments are shown separately as such derivatives are gross settled.
* Derivative cash outflows do not include the potential cash outflows should the share warrants of My Screen be exercised. The exercise of such warrants is at the option of the Company. Details of such warrants are provided in Note 21 “Other financial assets”. Contractual cash flows are derived based on the relevant index as of the balance sheet date.

Orascom Telecom Holdings Annual Report 2011Orascom Telecom Holdings Annual Report 2011 6968
7. Assets and liabilities classified as held for sale and discontinued operations
2011 Discontinued Operations
Discontinued operations in 2011 and 2010 relate to the Spin-Off Assets and Orascom Telecom Tunisia S.A. (“OTT”).
Spin Off Assets
As described in Note 2, during November and December 2011 the Company transferred its shareholdings in the Spin-Off Assets to OTMT as a result of the Demerger. The results of operations relating to the Spin-Off Assets have been classified as discontinued operations in 2011 and 2010.
ECMS
The Spin-off Assets include the Group’s investment in ECMS. Prior to July 2010 this investment was recorded as a joint venture and proportionally consolidated. Subsequently, due to a change in governance structure, it is recorded as an associate using the equity method.
In particular, in April 2010 France Telecom and the Company entered into a new and comprehensive agreement regarding ECMS which brought to an end all disputes in relation to their joint investment in ECMS. A revised shareholders’ agreement was implemented and became effective on July 14, 2010, as a result of which France Telecom controls ECMS and the Company ceased to have joint control over ECMS, which became an associate.
Orascom Telecom Tunisia S.A.
In November 2010, the Company announced that it had entered into a share purchase agreement with Qatar Telecom Q.S.C., pursuant to which the Company sold its entire 50% shareholding of OTT for a total cash consideration of US$ 1.2 billion. The transaction was completed on January 2, 2011. In accordance with IFRS 5 the assets and liabilities held for sale were shown in a separate caption on the balance sheet in 2010.
The following provides a breakdown of discontinued operations for the years indicated:
For the year ended December 31, 2011 2011
(In millions of US$) Spin-Off
AssetsOTT Total Spin-Off Assets OTT Total
Revenues 291 - 291 699 352 1,051
Expenses (193) - (193) (556) (220) (776)
Share of profit/(loss) from associates (42) - (42) 24 - 24
Profit before tax from discontinued operations 56 - 56 167 132 299
Income tax (4) - (4) (38) (69) (107)
Profit after tax from discontinued operations 52 - 52 129 63 192
Gain from ceasing joint control – ECMS - - - 951 - 951
Gain from disposal of OTT - 930 930
Income tax on gains - (237) (237) (121) - (121)
Profit from discontinued operations 52 693 745 959 63 1,022
As of December 31, 2011 there are no assets and liabilities held for sale. The following provides a breakdown of assets and liabilities held for sale relating to OTT as of December 31, 2010:
2011 Algeria Pakistan Egypt Tunisia BangladeshOther GSM
Other (Non GSM)
Holdings & Others
Discontinuing Operation
Total
2010
Total segment revenue-current period 1,860 1,134 511 233 189 -291 3,636
Total segment revenue-previous period 1,747 1,107 439 352 457 168 482 -1,065 3,687
(Inter-segment revenue - current period)
(Inter-segment revenue-previous period) -136 14 -122
Total revenue from external customers-current period
1,860 1,134 511 233 189 -291 3,636
Total revenue from external customers-previous period 1,747 1,107 439 352 457 168 346 -1,051 3,565
EBITDA-current period 1,051 402 170 109 21 17 -123 1,647
EBITDA-previous period 988 446 171 195 127 81 9 -68 -453 1,496
Depreciation, amortization and impairments-current period
-314 -285 -160 -31 -9 -7 23 -783
Depreciation, amortization and impairments-previous period
-340 -282 -46 -63 -126 -129 -34 -5 151 -874
Gains (losses) on disposal of non current assets - current period
-3 2 -42 935 57 2 -893 58
Gains (losses) on disposal of non current assets - previous period
-2 43 -13 -28
Interest income-current period 2 10 2 3 5 62 -4 80
Interest income-previous period 11 3 2 1 4 40 -7 54
Intereset expense and impairment of financial assets-current period
-2 -95 -51 -8 -2 -403 3 -558
Intereset expense and impairment of financial assets-previous period
-12 -101 -26 -3 -42 -8 -9 -344 70 -475
Net foreign exchange gain / (loss) - current period -7 -28 -55 -7 2 -55 -150
Net foreign exchange gain / (loss) - previous period -2 -33 7 -1 -5 -1 -41 2 -74
Share of profit (losses) of Associates - current period
-135 -135
Share of profit (losses) of Associates - previous period -143 -143
Profit (Loss) Before Tax - current period 728 7 -42 935 -95 123 6 -515 -988 159
Profit (Loss) Before Tax - previous period 634 41 1,060 130 -47 -56 12 -540 -1,250 -16
Total assets - current period 2,441 2,103 1,179 174 45 2,013 7,955
Total assets - previous period 2,859 2,176 423 1,078 424 667 2,353 9,980
Capital expenditure - current period 40 261 409 26 78 2 816
Capital expenditure - previous period 90 143 71 55 235 72 113 3 782
*Holding and other mainly represent income and expense relating to activities provided from the holding and other companies. These represent mainly management fees and revenue as a result of supporting activities provided by Orascom Telecom Holding.
The following table provides a breakdown of revenue and other income by product and service:
2011 2010
Product and services
Mobile 3,599 3,492
Fixed - line and Internet 37 73
Other revenue & income 30 29
Total revenue and other income 3,666 3,594
Notes to the consolidated financial statements
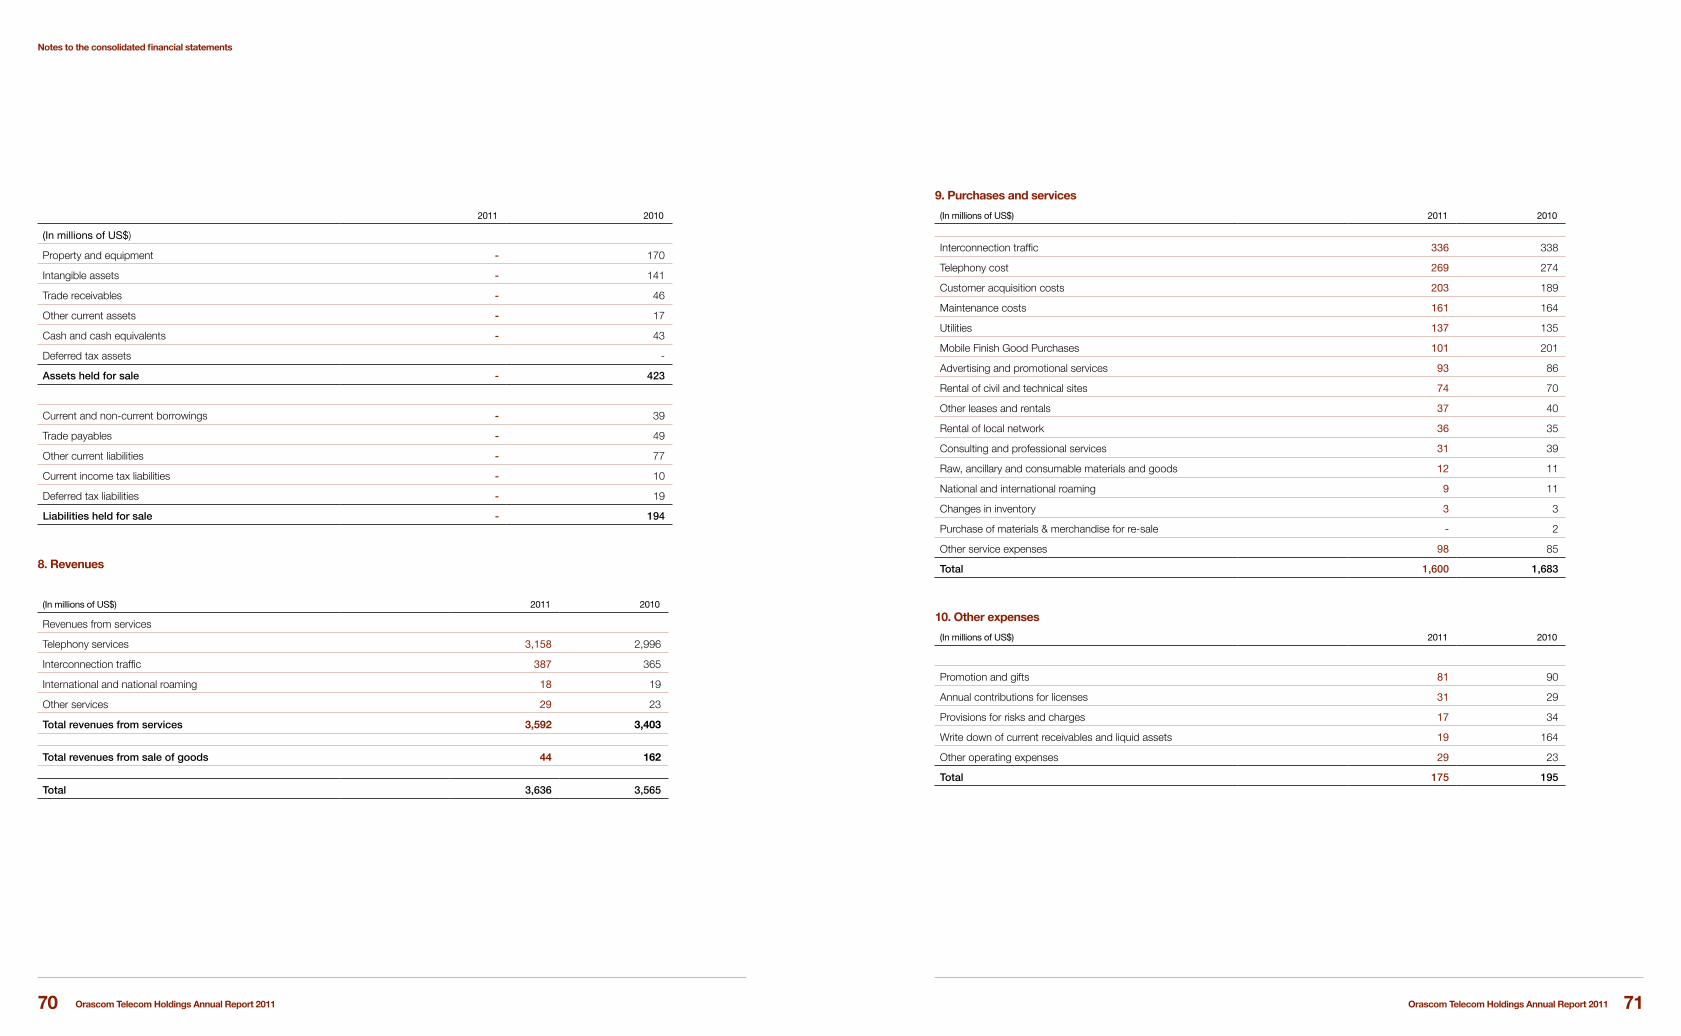
Orascom Telecom Holdings Annual Report 2011Orascom Telecom Holdings Annual Report 2011 7170
9. Purchases and services
(In millions of US$) 2011 2010
Interconnection traffic 336 338
Telephony cost 269 274
Customer acquisition costs 203 189
Maintenance costs 161 164
Utilities 137 135
Mobile Finish Good Purchases 101 201
Advertising and promotional services 93 86
Rental of civil and technical sites 74 70
Other leases and rentals 37 40
Rental of local network 36 35
Consulting and professional services 31 39
Raw, ancillary and consumable materials and goods 12 11
National and international roaming 9 11
Changes in inventory 3 3
Purchase of materials & merchandise for re-sale - 2
Other service expenses 98 85
Total 1,600 1,683
10. Other expenses
(In millions of US$) 2011 2010
Promotion and gifts 81 90
Annual contributions for licenses 31 29
Provisions for risks and charges 17 34
Write down of current receivables and liquid assets 19 164
Other operating expenses 29 23
Total 175 195
2011 2010
(In millions of US$)
Property and equipment - 170
Intangible assets - 141
Trade receivables - 46
Other current assets - 17
Cash and cash equivalents - 43
Deferred tax assets -
Assets held for sale - 423
Current and non-current borrowings - 39
Trade payables - 49
Other current liabilities - 77
Current income tax liabilities - 10
Deferred tax liabilities - 19
Liabilities held for sale - 194
8. Revenues
(In millions of US$) 2011 2010
Revenues from services
Telephony services 3,158 2,996
Interconnection traffic 387 365
International and national roaming 18 19
Other services 29 23
Total revenues from services 3,592 3,403
Total revenues from sale of goods 44 162
Total 3,636 3,565
Notes to the consolidated financial statements

Orascom Telecom Holdings Annual Report 2011Orascom Telecom Holdings Annual Report 2011 7372
13. Impairment charges
Impairment charges amounting to US$10 million in 2011 mainly relate to the impairment of property and equipment in Bangladesh.
Impairment charges amounting to US$96 million in 2010 mainly relate to the impairment of Powercom Namibia (“Powercom”) for an amount of US$ 93 million due to uncertainty regarding future operations.
14. Disposal of non current assets
The Company has disposed during the second quarter of 2011 Powercom against the debt related to it, generating a net gain amounting to US$ 58 million.
15. Net financing costs
(in million of US$) 2011 2010
Interest income – deposits 15 15
Other interest income 65 39
Financial income 80 54
Interest on bonds (76) (130)
Interest on bank borrowings (79) (197)
Interest on shareholders loans (146) -
Refinancing Plan (150) -
Fair value losses on derivatives (65) (91)
Other financial expenses (20) (39)
Financial expense (536) (457)
Foreign exchange losses, net (142) (31)
Fair value losses on foreign exchange derivatives (8) (43)
Net foreign exchange losses (150) (74)
Net financing costs (606) (477)
Financial income
Financial income increased in 2011 compared to 2010 mainly due to an increase in other interest income related to an increase in the average level of deposits, particularly in relation to OTA.
11. Personnel costs
(In millions of US$) 2011 2010
Wages and salaries 160 153
Social security 8 7
Pension costs 18 5
Other personnel costs 58 55
Total 244 220
Personnel costs include Board of Directors remuneration of US$ 1 million in 2011 and in 2010 and share based compensation costs of US$ 3 million in both years.
The table below provides a breakdown of the number of employees as of December 31 (2010 employee numbers have been restated for the Spin-Off entities):
(in number of employees) 2011 2010
Senior management 183 222
Middle management 1,107 902
Staff 11,689 11,754
Total 12,979 12,878
The table below provides a breakdown of the average number of employees for the years ended December 31, 2011 and 2010
(2010 employee numbers have been restated for the Spin-Off entities):
12. Depreciation and amortization
(In millions of US$) 2011 2010
Depreciation of property and equipment:
-Plant and machinery 616 624
-Commercial and other tangible assets 33 36
-Buildings 13 16
Amortization of intangible assets
-Licenses 107 98
-Other intangible assets 4 4
Total 773 778
Notes to the consolidated financial statements

Orascom Telecom Holdings Annual Report 2011Orascom Telecom Holdings Annual Report 2011 7574
17. Impairment of financial assets
Impairment of financial assets in 2011 relates to a settlement loss on the receivable from OTMT. In particular, pursuant to the separation agreement, an amount of US$ 72 million was recognized as the receivable due from OTMT. The receivable balance was adjusted pursuant to a memorandum of understanding among the various parties and as a result a settlement loss of US$ 22 million was recorded.
Impairment of financial assets in 2010 include an amount of US$ 18 million relating to Globalive. During 2010 the credit agreements with Globalive were re-negotiated and the interest rate was reduced from Libor plus 18% to Libor plus 10.8%, to reflect market conditions. As a result of the renegotiation the outstanding receivable due from Globalive was re-measured at fair value. Following this re-measurement an impairment was recorded to reflect the fair value adjustment.
18. Income tax expense
(In millions of US$) 2011 2010
Current income tax expense 369 174
Deferred taxes (126) 51
Income tax expense 243 225
Current income tax receivables and liabilities in the consolidated balance sheet are as follows:
(In millions of US$) 2011 2010
Current income tax receivable 99 83
Current and non current income tax liabilities (337) (148)
The tax on the Group’s profit before tax differs from the theoretical amount that would arise using the weighted average tax rate applicable to profits of the consolidated entities as follows:
(In millions of US$) 2011 2010
Profit/(loss) before income tax 159 (16)
Tax calculated at Company's income tax rate 40 (3)
Different income tax rates in subsidiaries (120) 80
Theoretical income tax for the year (80) 77
Permanent differences 200 22
Unrecognized deferred tax for tax losses 81 63
Reversal of unused deferred tax assets 23 34
Minimum tax expense 14 11
Adjustments in respect of prior years 4 16
Other differences 1 2
Income tax for the year 243 225
Financial expense
As a result of the Refinancing Plan (see also note 2 for further details):
• the unamortized portion of the arrangement fees (US$ 74 million) relating to the Senior Facility, the Equity Linked Notes and the OTH High Yield Notes has been recognized in the income statement upon the extinguishment of the relevant financial instruments;
• the Group incurred early repayments fees for US$ 30 million in relation to the equity linked notes due 2013 issued by Orascom Telecom Oscar S.A.;
• interest rate derivatives were entirely extinguished and the cumulative gains and losses which had been recognized in cash flow hedge reserves, amounting to US$ 46 million, were reclassified from equity to the income statement.
VimpelCom provided two shareholders loans to the Group to refinance such financial liabilities. These shareholders loans are repayable in May 2014 and bear fixed rates of interest of 9.5% which is payable in kind prior to maturity.
16. Share of profit and loss of associates
Share of loss of associates in 2011 and 2010 includes the investment in Globalive Canada Investment Holdings Corp. and Globalive Canada Holdings Corp. (collectively “Globalive”). The Group holds a 65.4% investment in Globalive which comprises a combination of voting and non-voting rights. Considering direct and indirect interests, the Group holds 65.4% of the outstanding shares and holds 33.2% of the voting rights. The Group has significant influence over this investment but does not have control over the financial and operating policies of Globalive. Therefore the investment is equity accounted.
The following table provides selected financial information of the Group’s associates as of December 31, 2011 and 2010 and for each of the years then ended.
(In millions of US$) 2011 2010
Current assets 91 70
Non-current assets 883 862
Current liabilities 209 99
Non-current liabilities 1,467 1,208
Revenue 206 138
Net loss (372) (275)
% shareholding 65.4% 65.4%
Proportional share of net loss (243) (180)
Elimination of intercompany transactions 112 71
Equity accounting and other adjustments (4) (34)
Share of loss in associate (135) (143)
Notes to the consolidated financial statements

Orascom Telecom Holdings Annual Report 2011Orascom Telecom Holdings Annual Report 2011 7776
(In millions of US$) Land and BuildingsPlant and
machinery
Commercial and other tangible
assets
Assets Under Construction
Total
Cost
As of January 1, 2010 196 6,717 356 830 8,099
Additions 18 189 45 496 748
Change in the scope of consolidation (63) (1,326) (120) (61) (1,570)
Reclassification to assets held for sale (10) (292) (19) (32) (353)
Disposals (2) (35) (7) (5) (49)
Currency translation differences (4) (148) (16) (16) (184)
Reclassifications - 402 3 (405) -
As of December 31, 2010 135 5,507 242 807 6,691
Depreciation and impairment losses
As of January 1, 2010 68 2,748 218 33 3,067
Depreciation for the year 18 712 43 - 773
Change in the scope of consolidation (13) (604) (68) - (685)
Reclassification to assets held for sale (4) (166) (13) - (183)
Disposals (1) (30) (7) - (38)
Impairment losses 1 56 1 6 64
Currency translation differences - (53) (6) (11) (70)
As of December 31, 2010 69 2,663 168 28 2,928
Net book value as of December 31, 2010 66 2,844 74 779 3,763
Additions to property and equipment in 2011 mainly relate to cell sites investments and assets under construction relating to new base stations in Bangladesh (Orascom Telecom Bangladesh Limited), Pakistan (Pakistan Mobile Telecommunications Limited) and Algeria (Orascom Telecom Algeria). These investments are mainly driven by the expansion of the business, increased capacity and the change in GSM technology.
Depreciation and amortization charged during the year ended December 31, 2011 includes US$ 21 million relating to the discontinued operations (see Note 7 for further details).
Change in the scope of consolidation in 2011 relates to the property and equipment of the Spin-Off Assets and Powercom. See Note 7 for further details.
Property and equipment transferred to assets held for sale in 2010 relates to property and equipment of Orascom Telecom Tunisia. See Note 7 “Assets and liabilities classified as held for sale and discontinued operations” for further information.
Impairment losses in 2011 relate to the impairment of plant and equipment in Bangladesh. Impairment losses in 2010 relate to the full impairment of property and equipment of Powercom due to its financial conditions.
Property and equipment pledged as security for bank borrowings amount to US$ 1.1 billion as of December 31, 2011 (US$ 1.2 billion as of December 31, 2010) and primarily relate to securities for borrowings of PMCL.
In the year ended December 31, 2011 and 2010 the Group capitalized borrowing costs of US$ 200 thousands and US$ 28 million, respectively, relating to the acquisition of property and equipment.
The Group leases various assets under non-cancelable finance lease agreements. As of December 31, 2011 the Group had assets under finance lease with net book value of US$ 24 million (US$ 25 million as of December 31, 2010) mainly relating to a sale and lease back of the premises at Nile City Towers (headquarter offices in Cairo), as well as minor finance leases for vehicles and equipment.
19. Property and equipment
(In millions of US$) Land and BuildingsPlant and machinery
Commercial and other tangible
assets
Assets Under Construction
Total
Cost
As of January 1, 2011 135 5,507 242 807 6,691
Additions 6 73 27 488 594
Change in the scope of consolidation (8) (221) (17) (388) (634)
Disposals (6) (17) (7) (35) (65)
Exchange differences (5) (326) (12) (40) (383)
Reclassifications 1 373 7 (381) -
As of December 31, 2011 123 5,389 240 451 6,203
Depreciation and impairment losses
As of January 1, 2011 69 2,663 168 28 2,928
Depreciation for the year 13 631 35 - 679
Change in the scope of consolidation (3) (111) (12) (4) (130)
Disposals (5) (5) (4) - (14)
Impairment losses - 9 - 1 10
Exchange differences (4) (157) (9) (2) (172)
As of December 31, 2011 70 3,030 178 23 3,301
Net book value as of December 31, 2010 66 2,844 74 779 3,763
Net book value as of December 31, 2011 53 2,359 62 428 2,902
Notes to the consolidated financial statements

Orascom Telecom Holdings Annual Report 2011Orascom Telecom Holdings Annual Report 2011 7978
Additions to licenses in 2011 mainly relate to the 2G license in Bangladesh and licenses in Algeria.
Impairments in 2010 relate to the full impairment of the intangible assets of Powercom due to uncertainty regarding the future operations of such entity.
Intangible assets pledged as security for bank borrowings amount to US$ 1.1 billion as of December 31, 2011 (US$ 1.2 billion as of December 31, 2010) and primarily relate to securities for borrowings of PMCL.
Impairment tests for goodwill
Goodwill is allocated to the individual CGU which reflects the minimum level at which the units are monitored for management control purposes.
The carrying amount as of December 31, 2011 and 2010 was subject to an impairment test to compare the carrying amount with value in use and the recoverable amount. During 2011 no impairments were identified. In 2010, the goodwill of Algeria Win Call Eurl, allocated within the Algeria segment, was impaired prior to performing this test. Additionally the goodwill of Powercom, allocated within the Central and South Africa segment, was fully impaired due to uncertainties regarding the future operations of this entity. Value in use was determined by discounting the expected cash flows, resulting from business plans approved by the respective Board of Directors, using the post-tax weighted average cost of capital (WACC) as the discount rate. More specifically, the value in use was calculated on the basis of the discounted cash flows resulting from the five year business plan , using a growth rate of 3-5% and a discount rate equal to the weighted average cost of capital, calculated using the capital asset pricing model.
The following table provides an analysis of goodwill by segment:
As of December 31, 2011 (In millions of US$)
Algeria Pakistan BangladeshCentral and South
Africa and otherTotal
GSM 485 273 17 64 839
Telecom Services - - - 1 1
485 275 17 65 840
As of December 31, 2010(In millions of US$)
Algeria Pakistan BangladeshCentral and South
Africa and otherTotal
GSM 503 276 12 64 854
Telecom Services - 1 - 1 2
Internet & Fixed Line - - - 6 6
503 277 11 71 863
The movement in goodwill includes US$ 6 million relating to the Spin Off Assets and US$ 17 million from foreign currency translation movements.
20. Intangible assets
(In millions of US$) Licenses Goodwill Others Total
Cost
As of January 1, 2011 1,358 1,014 51 2,423
Additions 287 - 5 292
Change in the scope of consolidation (101) (50) (9) (160)
Reclassifications 7 - (7) -
Currency translation differences (34) (19) (5) (58)
As of December 31, 2011 1,517 945 35 2,497
Amortization and impairment losses
As of January 1, 2011 760 151 25 936
Amortization for the year 111 - 4 115
Change in the scope of consolidation (28) (44) (9) (81)
Currency translation differences (26) (2) (3) (33)
As of December 31, 2011 817 105 17 939
Net book value as of December 31, 2010 598 863 26 1,487
Net book value as of December 31, 2011 700 840 18 1,558
(In millions of US$) Licenses Goodwill Others Total
Cost
As of January 1, 2010 1,846 1,271 286 3,403
Additions 28 - 7 35
Change in the scope of consolidation (401) (175) - (576)
Reclassification to assets held for sale (267) (34) (3) (304)
Disposals (32) - - (32)
Reclassifications 238 (2) (236) -
Currency translation differences (54) (46) (3) (103)
As of December 31, 2010 1,358 1,014 51 2,423
Amortization and impairment losses
As of January 1, 2010 829 135 178 1,142
Amortization for the year 125 - 4 129
Disposals (32) - - (32)
Change in the scope of consolidation (151) (11) - (162)
Reclassifications to assets held for sale (163) - - (163)
Impairment losses 13 42 5 60
Reclassifications 165 (2) (163) -
Currency translation differences (26) (13) 1 (38)
As of December 31, 2010 760 151 25 936
Net book value as of December 31, 2010 598 863 26 1,487
Notes to the consolidated financial statements

Orascom Telecom Holdings Annual Report 2011Orascom Telecom Holdings Annual Report 2011 8180
Derivative financial instruments
2011 2010
(In millions of US$) Assets Liabilities Assets Liabilities
Interest rate derivatives - - - 105
Foreign exchange derivatives 61 - 80 -
Other derivative instruments - - 3 -
Total 61 - 83 105
Less non-current portion
Interest rate derivatives - - - 36
Foreign exchange derivatives 57 - 69 -
Other derivative instruments - - 3 -
Current portion 4 - 11 69
Interest rate derivatives
Interest rate derivatives during 2010 relate to (i) the Company’s interest rate swaps for a notional amount of US$ 1.5 billion relating to the A1 and A2 term loan supplements of the Company. As of December 31, 2010 the fair value of the derivative liability was US$ 83 million and (ii) a switchable interest rate swap for a notional amount of US$ 500 million to cover a portion of the syndication loan. As of December 31, 2010 the fair value of the derivative liability was US$ 21 million. These financings were repaid in 2011 as a result of the Refinancing plan. Therefore, the derivatives were entirely extinguished. The interest swap for the term loan supplements qualified for hedge accounting. Therefore, on extinguishment the cumulative gains and losses which had been recognized in reserves, amounting to US$ 57 million were reclassified to the income statement.
Foreign exchange derivatives
Foreign exchange derivatives primarily relate to the economic hedge of PMCL. The cross currency swap relates to certain borrowings of PMCL, which are swapped from US$ to PKR and from Euro to PKR, whilst the associated interest is swapped from LIBOR to KIBOR and from Euribor to KIBOR. The changes in the fair value of the derivative
are recognized in foreign exchange loss / gain in the income statement. As of December 31, 2011 the fair value of this derivative asset was US$ 61 million (US$ 80 million as of December 31, 2010).
Other derivative instruments
Other derivative instruments in 2010 relate to the embedded derivative on the Company’s indexed notes. These notes were refinanced through the Refinancing Plan in May 2011 and as such the embedded derivative was unwound.
Deposits
Deposits primarily relate to letters of guarantee and other restricted cash held as security for the performance of Group obligations.
Deposits with amounts of US$ 160 million as of December 31, 2011 (US$ 33 million December 31, 2010) are pledged or blocked as security against related bank borrowings or others commitments.
Deposits as of December 31, 2010 included an amount of US$ 28 million relating to bank accounts held in local currency in North Korea which was subject to restrictions.
21. Other financial assets
2011 2010
(In millions of US$) Non-current Current Total Non-current Current Total
Financial receivables 964 52 1,016 887 3 890
Derivative financial instruments 57 4 61 72 11 83
Deposits 1 160 161 63 3 66
Financial assets held for trading - 4 4 - 21 21
Financial assets available for sale 2 10 12 11 8 19
1,024 230 1,254 1,033 46 1,079
Financial Receivables
As of December 31, 2011 and 2010 financial receivables mainly relate to loans provided to Globalive Management Corp (“GWMC”), a subsidiary of Globalive (see Note 16 “Share of loss of associates”).
During 2008 the Company entered into two loan agreements with Globalive Management Corp (“GWMC”, a subsidiary of Globalive) to borrow an amount of up to CAD 508 million. Both loans are non-revolving term loans bearing interest of Libor plus 18%. In 2009 the loan agreements were amended to increase the facility to CAD 608 million and were further amended during 2010 to increase the facility to CAD 970 million. Effective from January 1, 2011 the interest rate was reduced to Libor plus 10.8% and a further amount of CAD 207 million was advanced during 2011.
Globalive was awarded CAD 442 million of spectrum licenses in March 2009 and the loans are secured on a subordinated basis by an assignment of these licenses and are guaranteed on a non recourse basis.
Globalive launched its wireless network to the Canadian market in December 2009 and is therefore in the start-up phase of operations and has incurred losses to date. The Group’s share of these losses is in excess of the carrying value of the investment. As of December 31, 2011 the amount outstanding under such loan agreements, including accrued interest, was CAD 1,453 million equivalent to US$ 1,423 million (CAD 1,092 million equivalent to US$ 1,105 million as of December 31, 2010), the Group’s share of the excess losses of Globalive compared to the carrying value of the investment have therefore been disclosed together with the long term receivable. After considering the share of such losses and management fees, the amount recorded in financial receivables is US$ 959 million (US$ 870 million as of December 31, 2010).
Financial receivables as of December 31, 2011 also include an amount of US$ 50 million due from OTMT, related to the separation agreement entered into between the relevant parties in relation to the Spin-Off Assets. See Note 2 and Note 17 for further information.
Notes to the consolidated financial statements

Orascom Telecom Holdings Annual Report 2011Orascom Telecom Holdings Annual Report 2011 8382
Smart Village
The investment in Smart Village was transferred to OTMT as part of the Demerger.
Other investments
Other investments mainly relate to government treasury bills and investment bonds purchased by PMCL.
22. Deferred taxes
Deferred income tax assets and liabilities are offset when there is a legally enforceable right to offset current tax assets and liabilities and when the deferred income tax assets and liabilities relate to income taxes due to the same tax authority. The following table provides a reconciliation of deferred tax assets and liabilities of the Group to the amounts included in the face of the balance sheet.
(In millions of US$) 2011 2010
Deferred tax liabilities, gross 226 431
Deferred tax assets offset (155) (189)
Deferred tax liabilities 71 242
Deferred tax assets, gross 220 261
Deferred tax liabilities offset (155) (189)
Deferred tax assets 65 72
of which recognized directly in equity - -
The movement in the deferred income tax account is as follows:
(In millions of US$) 2011 2010
As of January 1, 170 97
Charged / (credited) to the income statement (126) 144
Charged directly to equity 16 -
Change in the scope of consolidation (50) (57)
Assets held for sale - (13)
Currency translation differences (4) (1)
As of December 31, 6 170
The following table shows the ageing analysis of financial receivables and deposits as of December 31, 2011 and 2010:
2011 2010
(In millions of US$) Deposits Financial receivables Deposits Financial receivables
Not past due 161 1,016 66 890
Past due 0-30 days - - - -
Past due 31-120 days - - - -
Past due more than 150 days - - - -
161 1,016 66 890
Financial assets available for sale
Company name % ownership December 31, 2011 December 31, 2010
Smart Village (ECDMIV) 10% - 8
My Screen Mobile Inc 9% - -
Lingo Media Corporation 23% 1 2
Other investments 11 9
12 19
My Screen Mobile Inc
In May 2008, the Company concluded a “Restricted Stock Purchase Agreement” with My Screen Mobile Inc, an entity specializing in the delivery of advertising to mobile phones, to acquire 12.5 million shares which represents approximately 9% of the total share capital and existing voting rights. Additionally, the Company purchased share warrants to acquire up to 20 million shares at an exercise price of US$ 2 per share. The warrants can be exercised from the date of the agreement until May 23, 2012. The total purchase price of the shares and warrants was US$ 10 million. Upon exercise of the warrants, the Company would hold approximately 20% of the existing and potential voting rights. Based on an assessment of the potential ownership percentage and other contractual rights, management does not consider that it has significant influence over the company. As of December 31, 2011 and 2010 the carrying value of the investment had been written down to zero.
Lingo Media Corporation
In August 2008, the Company entered into a subscription agreement to acquire 2,857,143 common shares of Lingo Media Corporation, a media entity focusing on online advertising. The investment represents approximately 23% of the total share capital and existing voting rights. The Company also purchased share warrants to acquire up to 2,142,857 shares of this entity. The warrants can be exercised from the date of the agreement for a period of two years, at an increasing price from US$4 up to US$8. The total purchase price of the shares and warrants was US$ 5 million. Based on an assessment of the contractual rights, management does not consider that it has significant influence over the company. Therefore, the investment has been recorded as a financial asset available for sale and measured at fair value. As of December 31, 2011, the fair value of the investment was written down to US$ 1 (US$ 2 million as of December 31, 2010). The warrants expired, unexercised, during 2010.
Notes to the consolidated financial statements

Orascom Telecom Holdings Annual Report 2011Orascom Telecom Holdings Annual Report 2011 8584
23. Trade receivables
(In millions of US$) 2011 2010
Receivables due from customers 217 171
Receivables due from telephone operators 87 90
Receivables due from authorized dealers 5 9
Other trade receivables 11 97
Allowance for doubtful receivables (115) (108)
Total 205 259
The following table shows the movement in the allowance for doubtful receivables:
(In millions of US$) 2011 2010
At January 1 108 84
Currency translation differences (8) -
Additions (allowances recognized as an expense) 14
27
Change in the scope of consolidation (1) (8)
Assets held for sale - (4)
Use (3) (4)
Reversal - (3)
Reclassifications 1 16
At December 31, 115 108
The following table shows the ageing analysis of trade receivables as of December 31, 2011 and 2010, net of the relevant provision for doubtful receivables:
(In millions of US$) 2011 2010
Not past due 43 102
Past due 0-30 days 88 93
Past due 31-120 days 14 30
Past due 121 - 150 days 30 14
Past due more than 150 days 30 20
Trade receivables 205 259
The maximum exposure of credit risk at the reporting date is the carrying value of the receivable. The Group does not hold any collateral as security.
24. Other current assets
(In millions of US$) 2011 2010
Receivables due from tax authority 719 748
Prepaid expenses 67 81
Advances to suppliers 7 20
Other receivables 66 89
Allowance for doubtful current assets (34) (33)
Total 825 905
The following table shows the movement in the allowance for other current assets:
(In millions of US$) 2011 2010
(In millions of US$) 33 49
At January 1 - (2)
Currency translation differences 4 4
Additions (allowances recognized as an expense) (3) (16)
As of December 31, 34 33
25. Cash and cash equivalents
(In millions of US$) 2011 2010
Bank accounts and Deposits 1,013 821
Cash on hand 1 3
Total 1,014 824
Cash and cash equivalents at December 31, 2011 includes US$ 896 million (US$ 327 million as of December 31, 2010) held in subsidiaries which have regulatory restrictions, contractual restrictions or operate in countries where exchange controls and other legal restrictions apply and are therefore not available for general use by the Company.
The movement of deferred tax assets and liabilities during the year, without taking into consideration any offsetting is provided in the tables below:
Deferred tax liabilitiesDepreciation and
amortization Unremitted earnings Fair value Other Total
(In millions of US$)
As of December 31, 2010 249 159 21 2 431
Charged / (credited) to the income statement (30) (103) (2) (1) (136)
Change in the scope of consolidation - (53) - - (53)
Currency translation differences (15) (3) (1) 3 (16)
As of December 31, 2011 204 - 18 4 226
Deferred tax assets Tax lossesAccrued expense
Depreciation and
amortizationImpairment
of assets Fair value Other Total
(In millions of US$)
As of December 31, 2010 184 46 7 5 15 4 261
Charged / (credited) to the income statement (27) 5 (2) - 11 3 (10)
Change in the scope of consolidation - - - - - (4) (4)
Charged directly to equity - - - - (16) - (16)
Exchange differences (8) - - - - (3) (11)
As of December 31, 2011 149 51 5 5 10 - 220
Deferred tax assets on tax losses carry forwards mainly refer to income tax loss carry forwards of the Group’s subsidiaries in Pakistan with no expiry date.
No deferred tax assets were recognized on income tax loss carryforwards for some foreign subsidiaries, mainly Orascom Telecom Bangladesh Limited (“OTB”) and CAT, as it is currently not probable that taxable profit will be available in the near future against which such tax loss carryforwards might be utilized.
Generally the Group does not recognize deferred tax assets for temporary differences related to accruals for provisions, due to uncertainties in connection with the tax treatment of such expenses, as they might be challenged by local tax authorities.
No liability has been recognized in respect of unremitted earnings associated with investments in subsidiaries, branches and associates and interests in joint ventures, where the Group is in a position to control the timing of the reversal of the temporary differences and it is probable that such differences will not reverse in the foreseeable future.
The following table provides a breakdown by estimated recoverability of recognized deferred tax assets and liabilities:
Deferred tax liabilities Deferred tax assets
(In millions of US$) 2011 2010 2011 2010
within 1 year 1 50 8 9
within 1 - 5 years 180 298 181 194
after 5 years 45 83 31 58
226 431 220 261
Notes to the consolidated financial statements
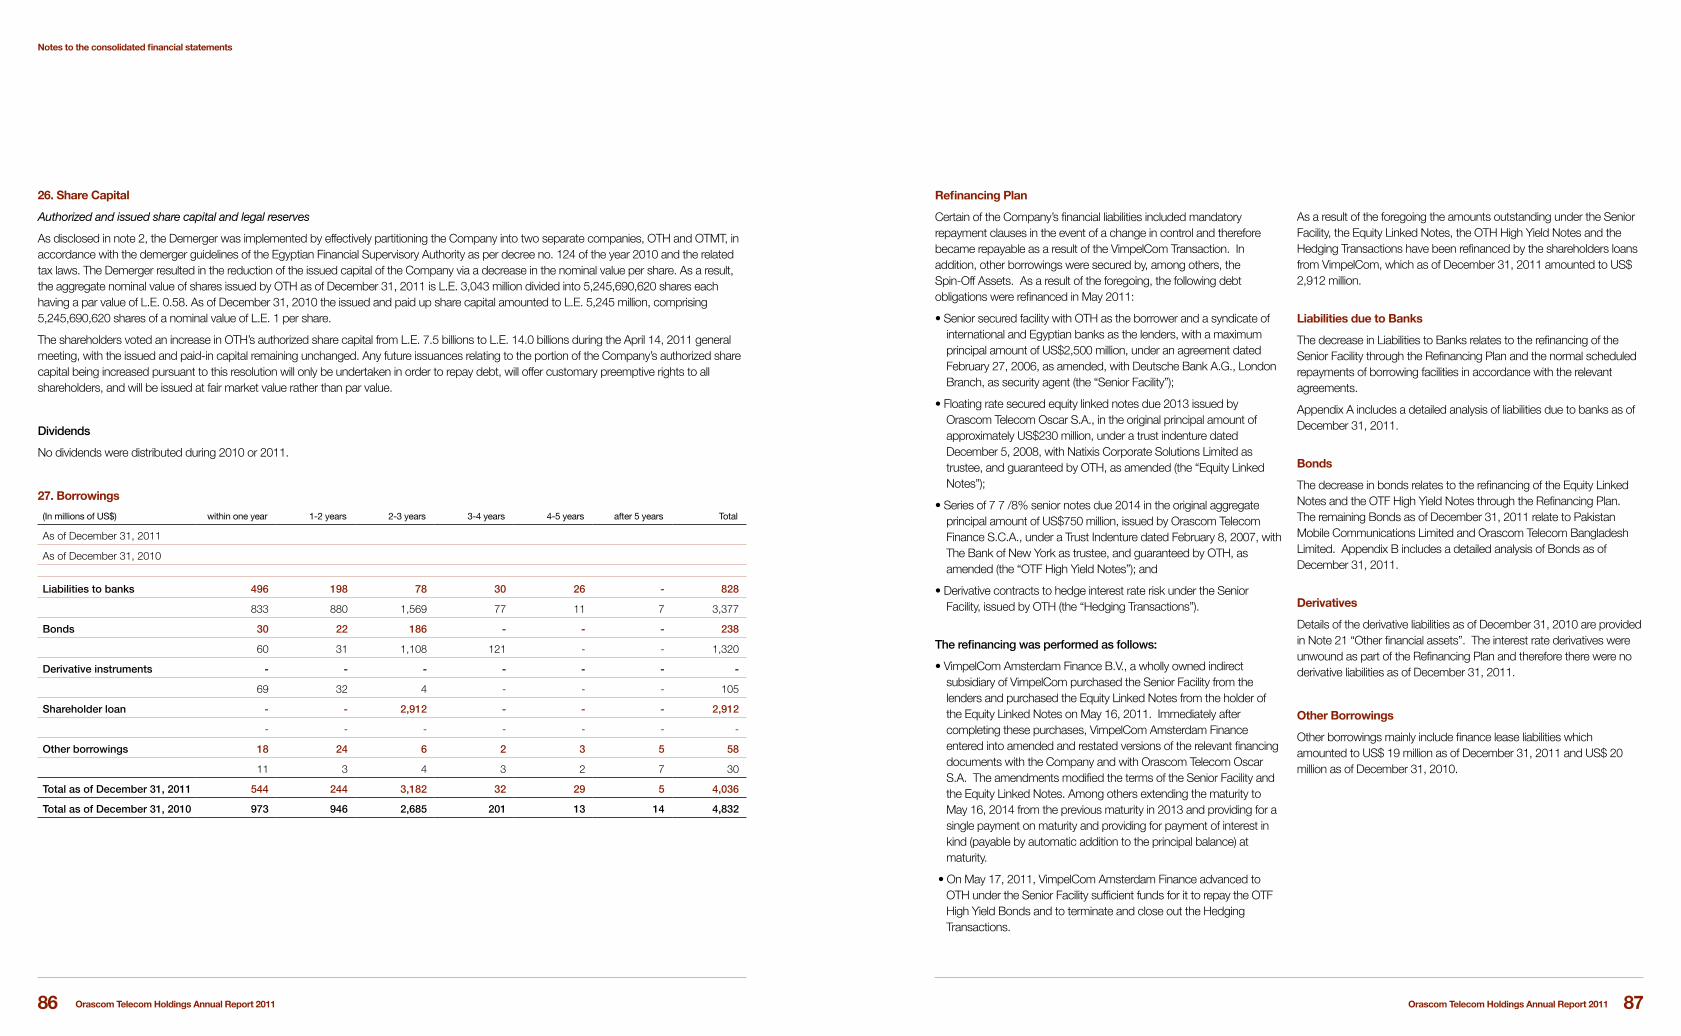
Orascom Telecom Holdings Annual Report 2011Orascom Telecom Holdings Annual Report 2011 8786
Refinancing Plan
Certain of the Company’s financial liabilities included mandatory repayment clauses in the event of a change in control and therefore became repayable as a result of the VimpelCom Transaction. In addition, other borrowings were secured by, among others, the Spin-Off Assets. As a result of the foregoing, the following debt obligations were refinanced in May 2011:
• Senior secured facility with OTH as the borrower and a syndicate of international and Egyptian banks as the lenders, with a maximum principal amount of US$2,500 million, under an agreement dated February 27, 2006, as amended, with Deutsche Bank A.G., London Branch, as security agent (the “Senior Facility”);
• Floating rate secured equity linked notes due 2013 issued by Orascom Telecom Oscar S.A., in the original principal amount of approximately US$230 million, under a trust indenture dated December 5, 2008, with Natixis Corporate Solutions Limited as trustee, and guaranteed by OTH, as amended (the “Equity Linked Notes”);
• Series of 7 7 /8% senior notes due 2014 in the original aggregate principal amount of US$750 million, issued by Orascom Telecom Finance S.C.A., under a Trust Indenture dated February 8, 2007, with The Bank of New York as trustee, and guaranteed by OTH, as amended (the “OTF High Yield Notes”); and
• Derivative contracts to hedge interest rate risk under the Senior Facility, issued by OTH (the “Hedging Transactions”).
The refinancing was performed as follows:
• VimpelCom Amsterdam Finance B.V., a wholly owned indirect subsidiary of VimpelCom purchased the Senior Facility from the lenders and purchased the Equity Linked Notes from the holder of the Equity Linked Notes on May 16, 2011. Immediately after completing these purchases, VimpelCom Amsterdam Finance entered into amended and restated versions of the relevant financing documents with the Company and with Orascom Telecom Oscar S.A. The amendments modified the terms of the Senior Facility and the Equity Linked Notes. Among others extending the maturity to May 16, 2014 from the previous maturity in 2013 and providing for a single payment on maturity and providing for payment of interest in kind (payable by automatic addition to the principal balance) at maturity.
• On May 17, 2011, VimpelCom Amsterdam Finance advanced to OTH under the Senior Facility sufficient funds for it to repay the OTF High Yield Bonds and to terminate and close out the Hedging Transactions.
As a result of the foregoing the amounts outstanding under the Senior Facility, the Equity Linked Notes, the OTH High Yield Notes and the Hedging Transactions have been refinanced by the shareholders loans from VimpelCom, which as of December 31, 2011 amounted to US$ 2,912 million.
Liabilities due to Banks
The decrease in Liabilities to Banks relates to the refinancing of the Senior Facility through the Refinancing Plan and the normal scheduled repayments of borrowing facilities in accordance with the relevant agreements.
Appendix A includes a detailed analysis of liabilities due to banks as of December 31, 2011.
Bonds
The decrease in bonds relates to the refinancing of the Equity Linked Notes and the OTF High Yield Notes through the Refinancing Plan. The remaining Bonds as of December 31, 2011 relate to Pakistan Mobile Communications Limited and Orascom Telecom Bangladesh Limited. Appendix B includes a detailed analysis of Bonds as of December 31, 2011.
Derivatives
Details of the derivative liabilities as of December 31, 2010 are provided in Note 21 “Other financial assets”. The interest rate derivatives were unwound as part of the Refinancing Plan and therefore there were no derivative liabilities as of December 31, 2011.
Other Borrowings
Other borrowings mainly include finance lease liabilities which amounted to US$ 19 million as of December 31, 2011 and US$ 20 million as of December 31, 2010.
26. Share Capital
Authorized and issued share capital and legal reserves
As disclosed in note 2, the Demerger was implemented by effectively partitioning the Company into two separate companies, OTH and OTMT, in accordance with the demerger guidelines of the Egyptian Financial Supervisory Authority as per decree no. 124 of the year 2010 and the related tax laws. The Demerger resulted in the reduction of the issued capital of the Company via a decrease in the nominal value per share. As a result, the aggregate nominal value of shares issued by OTH as of December 31, 2011 is L.E. 3,043 million divided into 5,245,690,620 shares each having a par value of L.E. 0.58. As of December 31, 2010 the issued and paid up share capital amounted to L.E. 5,245 million, comprising 5,245,690,620 shares of a nominal value of L.E. 1 per share.
The shareholders voted an increase in OTH’s authorized share capital from L.E. 7.5 billions to L.E. 14.0 billions during the April 14, 2011 general meeting, with the issued and paid-in capital remaining unchanged. Any future issuances relating to the portion of the Company’s authorized share capital being increased pursuant to this resolution will only be undertaken in order to repay debt, will offer customary preemptive rights to all shareholders, and will be issued at fair market value rather than par value.
Dividends
No dividends were distributed during 2010 or 2011.
27. Borrowings
(In millions of US$) within one year 1-2 years 2-3 years 3-4 years 4-5 years after 5 years Total
As of December 31, 2011
As of December 31, 2010
Liabilities to banks 496 198 78 30 26 - 828
833 880 1,569 77 11 7 3,377
Bonds 30 22 186 - - - 238
60 31 1,108 121 - - 1,320
Derivative instruments - - - - - - -
69 32 4 - - - 105
Shareholder loan - - 2,912 - - - 2,912
- - - - - - -
Other borrowings 18 24 6 2 3 5 58
11 3 4 3 2 7 30
Total as of December 31, 2011 544 244 3,182 32 29 5 4,036
Total as of December 31, 2010 973 946 2,685 201 13 14 4,832
Notes to the consolidated financial statements

Orascom Telecom Holdings Annual Report 2011Orascom Telecom Holdings Annual Report 2011 8988
29. Trade payables
(In millions of US$) 2011 2010
Capex payables 396 380
Trade payables due to suppliers 141 152
Trade payables to telephone operators 75 97
Other trade payables 126 182
Total 738 811
Trade payables are all due within one year.
30. Earnings per share
(a) Basic
Basic earnings per share is calculated by dividing the profit attributable to equity holders of the Company by the weighted average number of ordinary shares outstanding during the year, excluding ordinary shares purchased by the Company and held as treasury shares or for the purposes of the share based compensation.
2011 2010
Profit /(loss) attributable to equity holders of the Company (in million of US$):
- from continuing operations (84) (241)
- from discontinued operations 745 1,022
Weighted average number of shares (in millions of shares) 5,231 5,074
Earnings per share – basic (in US$) 0.13 0.15
(b) Diluted
Diluted earnings per share is calculated by adjusting the weighted average number of ordinary shares outstanding to assume conversion of all dilutive potential ordinary shares. However diluted earnings per share are not calculated when there are losses as any dilutive effect would improve earnings per share.
During 2010 the dilutive potential ordinary shares relate to the share based compensation plan.
2011 2010
Profit attributable to equity holders of the Company (in million of US$)
- from continuing operations (84) (241)
- from discontinued operations 745 1,022
Weighted average number of shares in issue (in millions of shares) 5,231 5,074
Adjustments for:
- Shares granted (in millions of shares) . 10
Weighted average number of shares for diluted earnings per share (in Million of shares) 5,231 5,084
Earnings per share – diluted (in US$) 0.13 0.15
Currency Information of Borrowings
US$ EuroEgyptian
PoundPakistan
RupeeBangladeshi
TakaAlgerian
DinarTunisian
DinarOthers Total
As of December 31, 2011
Total borrowings by currency of issue 3,293 65 44 400 222 2 - 11 4,036
Notional amount of currency derivatives (144) (65) - 209 - - - - -
Borrowings after derivative effect 3,149 - 44 608 222 2 - 11 4,036
of which (after derivative effect):
floating rate borrowings 237 - - 608 221 2 - - 1,069
fixed rate borrowings 2,912 - 43 - - - - 11 2,967
As of December 31, 2010
Total borrowings by currency of issue 3,894 162 23 504 188 1 - 60 4,832
Notional amount of currency derivatives (161) (159) - 320 - - - - -
Borrowings after derivative effect 3,733 3 23 824 188 1 - 60 4,832
of which (after derivative effect):
floating rate borrowings 917 3 1 824 186 1 - - 1,932
fixed rate borrowings 2,816 - 22 - 2 - - 60 2,900
Financial liabilities include secured liabilities of US$ 740 million as of December 31, 2011 and US$ 3,697 million as of December 31, 2010. In general, the financial liabilities are secured on property and equipment of the relevant subsidiary, pledged shares and receivables.
28. Other liabilities
2011 2010
(In millions of US$) Current Non-current Total Current Non-current Total
Telecommunication license payable 82 108 190 14 74 88
Prepaid Traffic and deferred income 139 - 139 189 - 189
Due to local authorities 174 - 174 289 - 289
Personnel payables 67 19 86 77 3 80
Other 130 40 170 184 35 219
Total 592 167 759 753 112 865
The increase in telecommunication license payable is mainly related to the renewal of the license of Orascom Telecom Bangladesh. The license was renewed in September 2011 for a further 15 years and in accordance with the agreement the fee of BDT 19.8 billion is payable over three years.
Notes to the consolidated financial statements

Orascom Telecom Holdings Annual Report 2011Orascom Telecom Holdings Annual Report 2011 9190
2011 2010
Average exercise price in US$ per GDR
option granted
GDR options (thousands)
GDRs granted for free
(thousands)
Average exercise price in US$ per GDR
option granted
GDR options (thousands)
GDRs granted for free
(thousands)
At January 1 - - 3,514 9.20 4 723
Granted - - - - - 1,831
Forfeited - - - - - (190)
Exercised - - (3,514) 9.20 (4) (203)
Expired - - - - - -
Rights Issue - - - - - 1,353
At December 31 - - - - - 3,514
thereof exercisable - 1,377
During 2011 all the GDRs granted for free have been exercised and no further GDRs have been granted.
In September 2011, the remuneration Committee has granted an incentive to eligible employees payable in cash based on the GDR price during the last 30 days before the vesting date (December 31, 2011). The total incentive amounted to US$ 2.5 million paid in January 2012.
31. Commitments
The commitments as of December 31, 2011 and 2010 are provided in the table below:
(In millions of US$) As of December 31,
2011As of December 31, 2010
Intangible assets - 23
Property and equipment 90 74
Total 90 97
Commitments for purchase of property and equipment mainly relate to the purchase of tools related to PMCL and Bangladesh capital commitments.
The following table provides the future aggregate minimum lease payments under non-cancellable operating leases:
(In millions of US$) 2011 2010
Within one year - 12
Between 1-5 years 53 4
After 5 years 78 67
131 83
32. Share based compensation
The Company introduced in 2003 an Executive Share Option Plan (ESOP) and since then the Company used treasury shares bought from the market to cover the plan. The Board of Directors of the Company has appointed a Committee that can grant GDR options or GDRs to employees of the Company and its subsidiaries through Orascom Telecom ESOP Limited., Malta, a wholly owned subsidiary. Such GDRs of the Company are listed on the London Stock Exchange and denominated in US$. Awards under the ESOP were generally reserved for employees at a senior management level and above that have spent at least one full year of services in the Company and that have a satisfactory performance according to their appraisal reports.
The Company has made annual grants until January 1, 2010. The GDRs granted vested in three installments over the vesting periods that vary from 12 to 42 months. The GDRs were granted for free and had to be exercised within two years after the end of the vesting period. Exercise of an award was subject to employment in the Group at the exercise date. The Group had no legal obligation to repurchase or settle the awards in cash.
GDRs were valued using the Black-Scholes option-pricing model. The assumptions for calculations of the fair value per GDR at the grant date include the GDR price at each grant date, nil exercise price, a GDR price volatility between 29.0% and 72.6%, a dividend yield of zero and an annual risk free rate between 1.7% and 6.4%.
The following table provides a breakdown of the movements of outstanding GDR options and GDRs granted and their weighted average exercise price:
Notes to the consolidated financial statements

Orascom Telecom Holdings Annual Report 2011Orascom Telecom Holdings Annual Report 2011 9392
Transactions with VimpelCom and Wind Telecom Group
Transactions with the VimpelCom Group relate to the shareholder loans provided by VimpelCom, as described in note 2 above.
Transactions with Wind Telecom and its subsidiaries mainly relate to management fees charged by the Company and interconnection traffic between the Group and the subsidiaries of Wind Telecom, and particularly Wind Telecomunicazioni SpA.
Transactions with Associates of the Group
OTH provided financing to GWMC, an associate of the Group, in connection with the funding of the acquisition of the spectrum licenses. For further details see Note 21 “Other financial assets”.
Transactions with other related parties
Transaction with other related parties mainly relate to transactions with entities under the control of the Sawiris family, such as Orascom Technology Solutions, and mainly refer to maintenance activities of electronic hardware and software carried out for the Group.
Key management compensation
Key management includes executive and non executive directors of the Board of Directors of the Company, the Company’s chief financial officer, other managing directors considered key personnel and the chief executive officers of significant subsidiaries.
The compensation paid or payable to key management for employee services is shown below:
2011 2010
(In millions of US$)
Salaries and other short-term employee benefits 11 11
Equity settled share based payments 3 3
34. Contingent assets and liabilities
The Group is subject to various legal proceedings and claims which arise in the ordinary course of business due to the nature of the operations of the Group and the nature of the markets where the Group operates.
The Group recognizes a provision for losses and liabilities when the existence of a liability or loss is certain or probable. As of December 31, 2011 the Company is a party in a number of ordinary course legal proceedings. Based on the legal advice obtained, the Company’s management believes that the outcome of these lawsuits, individually or in aggregate, would not be material to the Group’s results.
PMCL tax claims
Income tax proceedings
PMCL is involved in proceedings regarding tax claims up to the tax year 2007 related to assessments conducted by the tax authorities which resulted in the curtailing of expenditure claimed by PMCL. PMCL has filed appeals to the appellate authorities against the re-assessment orders.
The disputed amount under these assessments aggregate to Rs. 1,920.51 million (equivalent to approximately US$ 22.4 million). Based on advice from its legal and tax specialists, PMCL has made a provision for such assessments in the amount of RS 191 million (equivalent to approximately US$ 2.2 million).
33. Related party transactions
Transactions with subsidiaries, associates, with the Parent Company and its subsidiaries and other related parties are not considered atypical or unusual, as they fall within the Group’s normal course of business and are conducted under market conditions that would be performed by independent third parties.
The main related party transactions are summarized as follows:
Sale of services and goods Purchase of services and goods Interest income/(expenses)
(In millions of US$) 2011 2010 2011 2010 2011 2010
VimpelCom Group
VimpelCom Amsterdam Finance B.V. - - - - (146) -
Wind Telecom Group
Wind Telecom SpA 10 9 - - - -
Wind Telecomunicazioni SpA 3 1 - 1 - -
WIS sarl 12 88 11 64 - -
OTSE - - 2 10 - -
Joint ventures
OTT (*) - 3 - - - -
Associates
GWMC - - - - 57 36
ECMS 8 11 - - - -
Other related parties
Summit Technology (Orascom Technology Solution)
- - - 3 - -
Total 32 112 20 78 (89) 36
Receivables Borrowings Payables
(in millions of US$) 2011 2010 2011 2010 2011 2010
VimpelCom Group
VimpelCom Amsterdam Finance B.V. - - 2,912 - - -
Wind Telecom Group
Wind Telecom SpA - 6 - - - -
Wind Telecomunicazioni SpA - 1 - - - 2
WIS sarl - 15 - - - 8
Associates
GWMC 159 802 - - - -
ECMS - 2 - - - -
Total 159 826 2,912 - - 10
(*) In November 2010, the Company announced that it had entered into a share purchase agreement with Qatar Telecom Q.S.C., pursuant to which the Company sold its entire 50% shareholding of OTT. The transaction was completed on January 2, 2011. See note 7 for further details.
Notes to the consolidated financial statements
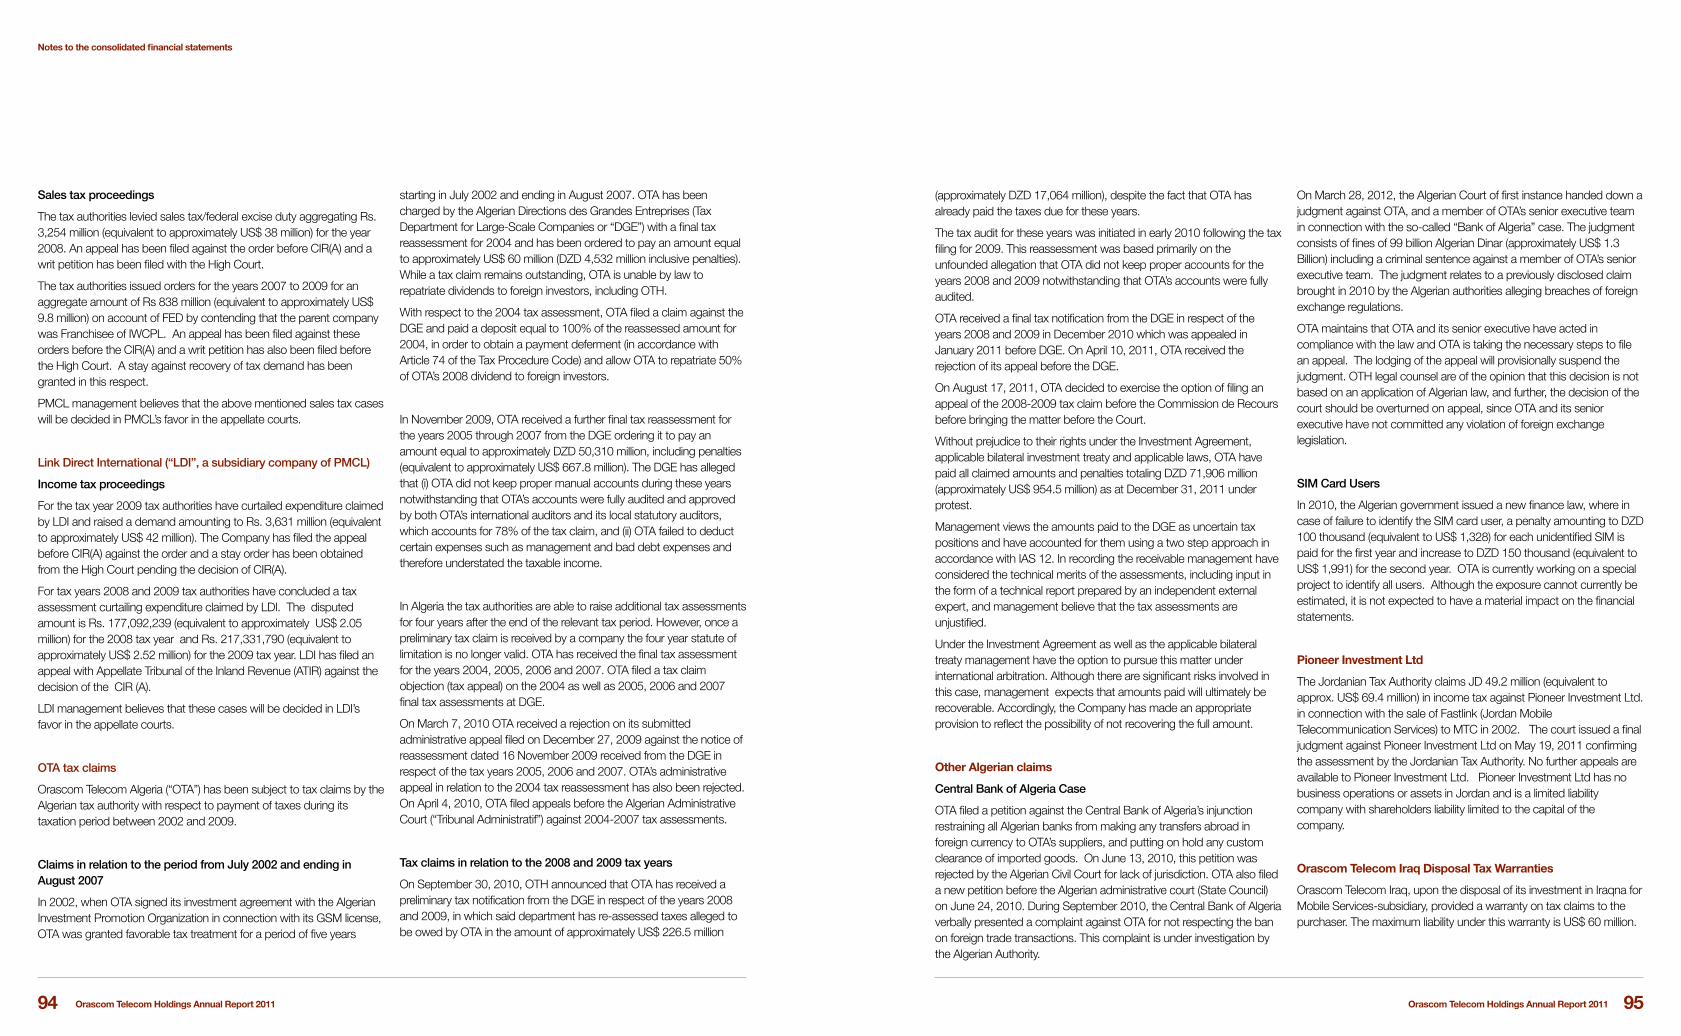
Orascom Telecom Holdings Annual Report 2011Orascom Telecom Holdings Annual Report 2011 9594
(approximately DZD 17,064 million), despite the fact that OTA has already paid the taxes due for these years.
The tax audit for these years was initiated in early 2010 following the tax filing for 2009. This reassessment was based primarily on the unfounded allegation that OTA did not keep proper accounts for the years 2008 and 2009 notwithstanding that OTA’s accounts were fully audited.
OTA received a final tax notification from the DGE in respect of the years 2008 and 2009 in December 2010 which was appealed in January 2011 before DGE. On April 10, 2011, OTA received the rejection of its appeal before the DGE.
On August 17, 2011, OTA decided to exercise the option of filing an appeal of the 2008-2009 tax claim before the Commission de Recours before bringing the matter before the Court.
Without prejudice to their rights under the Investment Agreement, applicable bilateral investment treaty and applicable laws, OTA have paid all claimed amounts and penalties totaling DZD 71,906 million (approximately US$ 954.5 million) as at December 31, 2011 under protest.
Management views the amounts paid to the DGE as uncertain tax positions and have accounted for them using a two step approach in accordance with IAS 12. In recording the receivable management have considered the technical merits of the assessments, including input in the form of a technical report prepared by an independent external expert, and management believe that the tax assessments are unjustified.
Under the Investment Agreement as well as the applicable bilateral treaty management have the option to pursue this matter under international arbitration. Although there are significant risks involved in this case, management expects that amounts paid will ultimately be recoverable. Accordingly, the Company has made an appropriate provision to reflect the possibility of not recovering the full amount.
Other Algerian claims
Central Bank of Algeria Case
OTA filed a petition against the Central Bank of Algeria’s injunction restraining all Algerian banks from making any transfers abroad in foreign currency to OTA’s suppliers, and putting on hold any custom clearance of imported goods. On June 13, 2010, this petition was rejected by the Algerian Civil Court for lack of jurisdiction. OTA also filed a new petition before the Algerian administrative court (State Council) on June 24, 2010. During September 2010, the Central Bank of Algeria verbally presented a complaint against OTA for not respecting the ban on foreign trade transactions. This complaint is under investigation by the Algerian Authority.
On March 28, 2012, the Algerian Court of first instance handed down a judgment against OTA, and a member of OTA’s senior executive team in connection with the so-called “Bank of Algeria” case. The judgment consists of fines of 99 billion Algerian Dinar (approximately US$ 1.3 Billion) including a criminal sentence against a member of OTA’s senior executive team. The judgment relates to a previously disclosed claim brought in 2010 by the Algerian authorities alleging breaches of foreign exchange regulations.
OTA maintains that OTA and its senior executive have acted in compliance with the law and OTA is taking the necessary steps to file an appeal. The lodging of the appeal will provisionally suspend the judgment. OTH legal counsel are of the opinion that this decision is not based on an application of Algerian law, and further, the decision of the court should be overturned on appeal, since OTA and its senior executive have not committed any violation of foreign exchange legislation.
SIM Card Users
In 2010, the Algerian government issued a new finance law, where in case of failure to identify the SIM card user, a penalty amounting to DZD 100 thousand (equivalent to US$ 1,328) for each unidentified SIM is paid for the first year and increase to DZD 150 thousand (equivalent to US$ 1,991) for the second year. OTA is currently working on a special project to identify all users. Although the exposure cannot currently be estimated, it is not expected to have a material impact on the financial statements.
Pioneer Investment Ltd
The Jordanian Tax Authority claims JD 49.2 million (equivalent to approx. US$ 69.4 million) in income tax against Pioneer Investment Ltd. in connection with the sale of Fastlink (Jordan Mobile Telecommunication Services) to MTC in 2002. The court issued a final judgment against Pioneer Investment Ltd on May 19, 2011 confirming the assessment by the Jordanian Tax Authority. No further appeals are available to Pioneer Investment Ltd. Pioneer Investment Ltd has no business operations or assets in Jordan and is a limited liability company with shareholders liability limited to the capital of the company.
Orascom Telecom Iraq Disposal Tax Warranties
Orascom Telecom Iraq, upon the disposal of its investment in Iraqna for Mobile Services-subsidiary, provided a warranty on tax claims to the purchaser. The maximum liability under this warranty is US$ 60 million.
Sales tax proceedings
The tax authorities levied sales tax/federal excise duty aggregating Rs. 3,254 million (equivalent to approximately US$ 38 million) for the year 2008. An appeal has been filed against the order before CIR(A) and a writ petition has been filed with the High Court.
The tax authorities issued orders for the years 2007 to 2009 for an aggregate amount of Rs 838 million (equivalent to approximately US$ 9.8 million) on account of FED by contending that the parent company was Franchisee of IWCPL. An appeal has been filed against these orders before the CIR(A) and a writ petition has also been filed before the High Court. A stay against recovery of tax demand has been granted in this respect.
PMCL management believes that the above mentioned sales tax cases will be decided in PMCL’s favor in the appellate courts.
Link Direct International (“LDI”, a subsidiary company of PMCL)
Income tax proceedings
For the tax year 2009 tax authorities have curtailed expenditure claimed by LDI and raised a demand amounting to Rs. 3,631 million (equivalent to approximately US$ 42 million). The Company has filed the appeal before CIR(A) against the order and a stay order has been obtained from the High Court pending the decision of CIR(A).
For tax years 2008 and 2009 tax authorities have concluded a tax assessment curtailing expenditure claimed by LDI. The disputed amount is Rs. 177,092,239 (equivalent to approximately US$ 2.05 million) for the 2008 tax year and Rs. 217,331,790 (equivalent to approximately US$ 2.52 million) for the 2009 tax year. LDI has filed an appeal with Appellate Tribunal of the Inland Revenue (ATIR) against the decision of the CIR (A).
LDI management believes that these cases will be decided in LDI’s favor in the appellate courts.
OTA tax claims
Orascom Telecom Algeria (“OTA”) has been subject to tax claims by the Algerian tax authority with respect to payment of taxes during its taxation period between 2002 and 2009.
Claims in relation to the period from July 2002 and ending in August 2007
In 2002, when OTA signed its investment agreement with the Algerian Investment Promotion Organization in connection with its GSM license, OTA was granted favorable tax treatment for a period of five years
starting in July 2002 and ending in August 2007. OTA has been charged by the Algerian Directions des Grandes Entreprises (Tax Department for Large-Scale Companies or “DGE”) with a final tax reassessment for 2004 and has been ordered to pay an amount equal to approximately US$ 60 million (DZD 4,532 million inclusive penalties). While a tax claim remains outstanding, OTA is unable by law to repatriate dividends to foreign investors, including OTH.
With respect to the 2004 tax assessment, OTA filed a claim against the DGE and paid a deposit equal to 100% of the reassessed amount for 2004, in order to obtain a payment deferment (in accordance with Article 74 of the Tax Procedure Code) and allow OTA to repatriate 50% of OTA’s 2008 dividend to foreign investors.
In November 2009, OTA received a further final tax reassessment for the years 2005 through 2007 from the DGE ordering it to pay an amount equal to approximately DZD 50,310 million, including penalties (equivalent to approximately US$ 667.8 million). The DGE has alleged that (i) OTA did not keep proper manual accounts during these years notwithstanding that OTA’s accounts were fully audited and approved by both OTA’s international auditors and its local statutory auditors, which accounts for 78% of the tax claim, and (ii) OTA failed to deduct certain expenses such as management and bad debt expenses and therefore understated the taxable income.
In Algeria the tax authorities are able to raise additional tax assessments for four years after the end of the relevant tax period. However, once a preliminary tax claim is received by a company the four year statute of limitation is no longer valid. OTA has received the final tax assessment for the years 2004, 2005, 2006 and 2007. OTA filed a tax claim objection (tax appeal) on the 2004 as well as 2005, 2006 and 2007 final tax assessments at DGE.
On March 7, 2010 OTA received a rejection on its submitted administrative appeal filed on December 27, 2009 against the notice of reassessment dated 16 November 2009 received from the DGE in respect of the tax years 2005, 2006 and 2007. OTA’s administrative appeal in relation to the 2004 tax reassessment has also been rejected. On April 4, 2010, OTA filed appeals before the Algerian Administrative Court (“Tribunal Administratif”) against 2004-2007 tax assessments.
Tax claims in relation to the 2008 and 2009 tax years
On September 30, 2010, OTH announced that OTA has received a preliminary tax notification from the DGE in respect of the years 2008 and 2009, in which said department has re-assessed taxes alleged to be owed by OTA in the amount of approximately US$ 226.5 million
Notes to the consolidated financial statements

Orascom Telecom Holdings Annual Report 2011Orascom Telecom Holdings Annual Report 2011 9796
Liabilities to banks
Current Non-current Total Currency Nominal Line of credit Maturity securities
Millions of USD Million of contract currency
Orascom Telecom Holding S.A.E
Credit Agricol 17 17 USD 100 22 30/11/2012 unsecured
NSGB Car Loan New EGP 3 6 3/8/2014 unsecured
NSGB Car Loan Ext EGP 1 3/8/2014 unsecured
HSBC1 6 6 USD 37 15 31/5/2012 unsecured
NSGB Car Loan 1 1 EGP 7 15 28/2/2013 unsecured
NSGB Car Loan EXT2 1 1 EGP 8 9 31/7/2015 unsecured
HSBC2 1 1 USD 9 15 31/5/2012 unsecured
24 2 26
Pakistan Mobile Communications Limited
Pakistan 97 123 220 PKR 18,383 22,060 4/1/2014 secured
Faysal Bank Limited 2 29 31 PKR 2,600 2,600 29/7/2015 secured
Islamabad Pakistan 20 9 29 PKR 5,100 5,100 9/5/2013 secured
Royal Bank of Scotland, London; Citibank International pIc;
Sumitomo Mitsui Banking Corporation Europe Limited-
11 16 27 USD 28 70 28/02/2014 secured
Royal Bank of Scotland, London; Citibank International pIc;
Sumitomo Mitsui Banking Corporation Europe Limited-
17 9 26 EUR 21 85 31/12/2013 secured
Habib Bank Limited - Islamabad - Pakistan (2007) 11 11 22 PKR 2,000 2,000 18/12/2013 secured
Royal Bank of Scotland, London; Citibank International pIc;
Sumitomo Mitsui Banking Corporation Europe Limited-
13 13 EUR 10 110 16/03/2012 secured
DEG - Germany 7 6 13 EUR 10 20 15/08/2013 secured
FMO - Netherlands 7 6 13 EUR 10 20 15/08/2013 secured
MCB PKR 900 Million 10 10 PKR 900 900 6/12/2016 secured
on 8 8 PKR 700 700 9/5/2012 secured
MCB Syndication PKR 7.08 Billion Facilit 1 7 8 PKR 700 7,081 13/10/2016 secured
Meezan Short Term 6 6 PK 575 3 months secured
Silkbank Limited PKR 400 Million 1 4 5 PKR 400 400 30/07/2015 secured
HSBC Bank Middle East Limited - Islamabad - Pakistan
PKR 800 less 1 year secured
Standard Chartered Bank Pakistan Limited - Islamabad-
Pakistan PKR 500 less 1 year secured
Citibank N.A PKR 400 less 1 year secured
Allied Bank Limited - Islamabad - Pakistan PKR 150 less 1 year secured
Detusche Bank A.G PKR 500 less 1 year secured
HBL Bank Ltd PKR 200 less 1 year secured
MCB Bank Ltd PK 100 less 1 year secured
Royal Bank of Scotland, London - Citibank London
ECGD - ECA 3 3 USD 3 48 less 1 year secured
204 230 434
Liabilities due to banks as of December 31, 2011Appendix A
Ring
During 2009, Ring received tax claims amounting to approximately US$ 46 million in respect of the tax years 2005 to 2008. No provisions have been recorded as the liquidation of this company is in process.
Wind Canada
In January 2010, Globalive Wireless Management Corp. was named as a respondent in an application by Public Mobile Inc. to the Federal Court of Canada for an order overturning the December 2009 Cabinet order which permitted GWMC to launch its wireless operations. In that December 2009 order, the Cabinet had determined that the Company met the requirements of Canada’s ownership and control rules and was, therefore, eligible to commence operations. On February 4, 2011, the Federal Court ruled that the Cabinet order contained two errors and should be quashed. WIND Mobile and the Canadian Government have appealed the decision of the Federal Court and the decision has been stayed pending the resolution of the appeal.
Telecel Globe Group
Telecel Central African Republic
On, August 2009, Telecel CAR received from the Post and Telecommunication Ministry of the Central African Republic a license re-valuation document, which stipulated that Telecel CAR must pay a supplement amount of 1 billion XAF (equivalent to approximately US$ 2 million) for the license. Telecel CAR disputes this notice and has not paid this amount and no provision has been recorded because the management believes that case will be decided in company’s favor.
U-Com Burundi
In January 2010, UCOM received a preliminary assessment from the tax administration amounting to US$ 11 million. U-Com disputed this assessment and booked a total provision with an amount US$ 7 million in this respect. On August 2010, a settlement was signed between U-COM and the local tax authority, in which U –Com agreed to pay US$ 3.1 million (of which US$ 1.9 million were paid on 30 September 2010) in order to resolve all pending issues relating to the tax due relating to financial years 2008 and 2009.
LETTERS OF CREDIT AND GUARANTEE
The Group has provided guarantees and letters of credit in the ordinary course of business of the Group’s activities. Guarantees include the following:
- A guarantee of BDT 92 million (equivalent to approx. US$ 1.3 million) provided by Orascom Telecom Bangladesh in favor of Ministry of Post & Telecommunication, the Chief Controller of Exports and Imports and Power development board.
-Letter of guarantee in a favor of Lebanon Ministry of Telecommunication (ROL) to guarantee OTH in the payment of any amount due by the selected Participant to ROL amount with US$ 30 million.
35. Subsequent events
Algerian International arbitration
In its board of directors meeting dated April 12, 2012 the company decided to commence an International arbitration against the People’s Democratic Republic of Algeria (Algeria) in respect of unlawful actions taken by the Algerian government against Orascom Telecom Algeria (OTA) (see note contingent liabilities).
The company is claiming that breached obligations under the Bi-lateral investment treaty between Egypt and Algeria.
The arbitration claim is being made under the arbitration rules of the United Nations Commission on International Trade Law.
Sale Agreement
As per the settlement agreement, Orascom Telecom Holding and OTMT entered into a Preliminary Sale Agreement of an Administrative Unit providing for the sale of the entire 26th floor located at 2005A – Nile City Towers – South Tower – Corniche Elnil – Ramlet Beaulac – 11221 Cairo
Notes to the consolidated financial statements

Orascom Telecom Holdings Annual Report 2011Orascom Telecom Holdings Annual Report 2011 9998
Current Non-current Total Currency Nominal Line of credit Maturity securities
Millions of USD Million of contract currency
Orascom Telecom Bangladesh Limited
USD Commercial Facility 33 24 57 USD 57 130 1/8/2013 secured
Hermes Facility 16 29 45 USD 46 120 1/7/2014 secured
Standard Chartered Bank, London 6 27 33 USD 36 50 30/09/2016 secured
WCS - SCB 2.5 bln 27 27 BDT 2,500 21/10/2012 Unsecured
WSC - SCB 2.14 bln 26 26 USD 2,145 18/11/2012 Unsecured
DFI Facility 7 11 18 BDT 19 30 15/06/2014 secured
Eastern Bank Ltd. 16 16 BDT 1,300 1,500 31/05/2012 Unsecured
The City Bank 13 13 BDT 1,050 1,150 14/08/2012 Unsecured
Dutch Bangla Bank Limited 11 11 BDT 900 1,000 31/10/2012 Unsecured
Citibank, N.A 10 10 BDT 800 1,235 19/09/2012 Unsecured
Mutual Trust Bank Limited 9 9 BDT 746 750 30/11/2012 Unsecured
Pubali Bank Limited 9 9 BDT 750 750 18/01/2012 Unsecured
Standard Chartered Bank8 8 BDT 640 1,100
new al in process
Unsecured
BRAC Bank Ltd. 8 8 BDT 600 750 28/01/2012 Unsecured
BDT B Facility 3 4 7 BDT 510 1,030 30/06/2014 secured
BDT A Facility 4 4 BDT 315 2,520 30/06/2012 secured
One Bank Limited 4 4 BDT 350 28/02/2012 Unsecured
Premier Bank Limited 3 3 BDT 250 500 17/03/2012 Unsecured
Commercial Bank of Ceylon1 1 BDT 100 100
Renewal in process
Unsecured
214 95 309
Current Non-current Total Currency Nominal Line of credit Maturity securities
Millions of USD Million of contract currency
Orascom Telecom Algeria S.P.A.
Hermes Loan 2006' Secured by pledge over OTA's business undertaking
pledge over OTA's bank account47 -
47 USD 3,51086
15/11/2012Secured
47 47
Liabilities to banks Current Non-current Total Currency Nominal Line of credit Maturity securities
Millions of USD Million of contract currency
Telecel Globe Limited
Banque de development des etats de l'afrique Central March 2007
1 2 3 XAF 4 2'464 6/30/15 Secured
Ecobank CerntrAfrique S.A 1 2 3 XAF 4 3,000 1/8/14 Secured
Banque Populaire Maroco Centrafricaine 1 1 XAF 934 2/28/12 Secured
12 months r
Ecobank CentrAfrique S-A -Overdraft 1 1 XAF 1 evolving Secured
12 months r
Banque Populaire Maroco Centrafricaine-Overdraft 1 1 XAF 1 evolving Secured
12 months r
Commercial Bank Centrafrique-Overdraft 1 1 XAF 1 evolving Secured
6 4 10
Total- liabilities to banks 496 332 828
Bonds Current Non-current Total Currency Nominal Line of credit Maturity securities
Millions of USD Million of contract currency
Pakistan Mobile communications Limited
Royal Bank of scotland 1 111 112 USD 250 11/13/13 Unsecured
and deutsche Bank Securities inc.(Euro Bond) 1 40 41 PKR 4,257 10/28/13 Unsecured
Allied Bank Limited - Karachi - Pakistan (2007)
Pak Oman Investment Company Limited - Karachi
Pakistan (Trustee-Public Listed TFC) 12 6 18 PKR 2,714 5/31/13 Secured
Orascom Telecom Bangladesh Limited
Senior Secured Bonds Due 2014 16 50 67 BDT 7,070 6/30/14 Secured
Total Bands 30 207 238
Scope of Consolidation as of December 31, 2011Appendix A
Liabilities due to banks as of December 31, 2011Appendix A
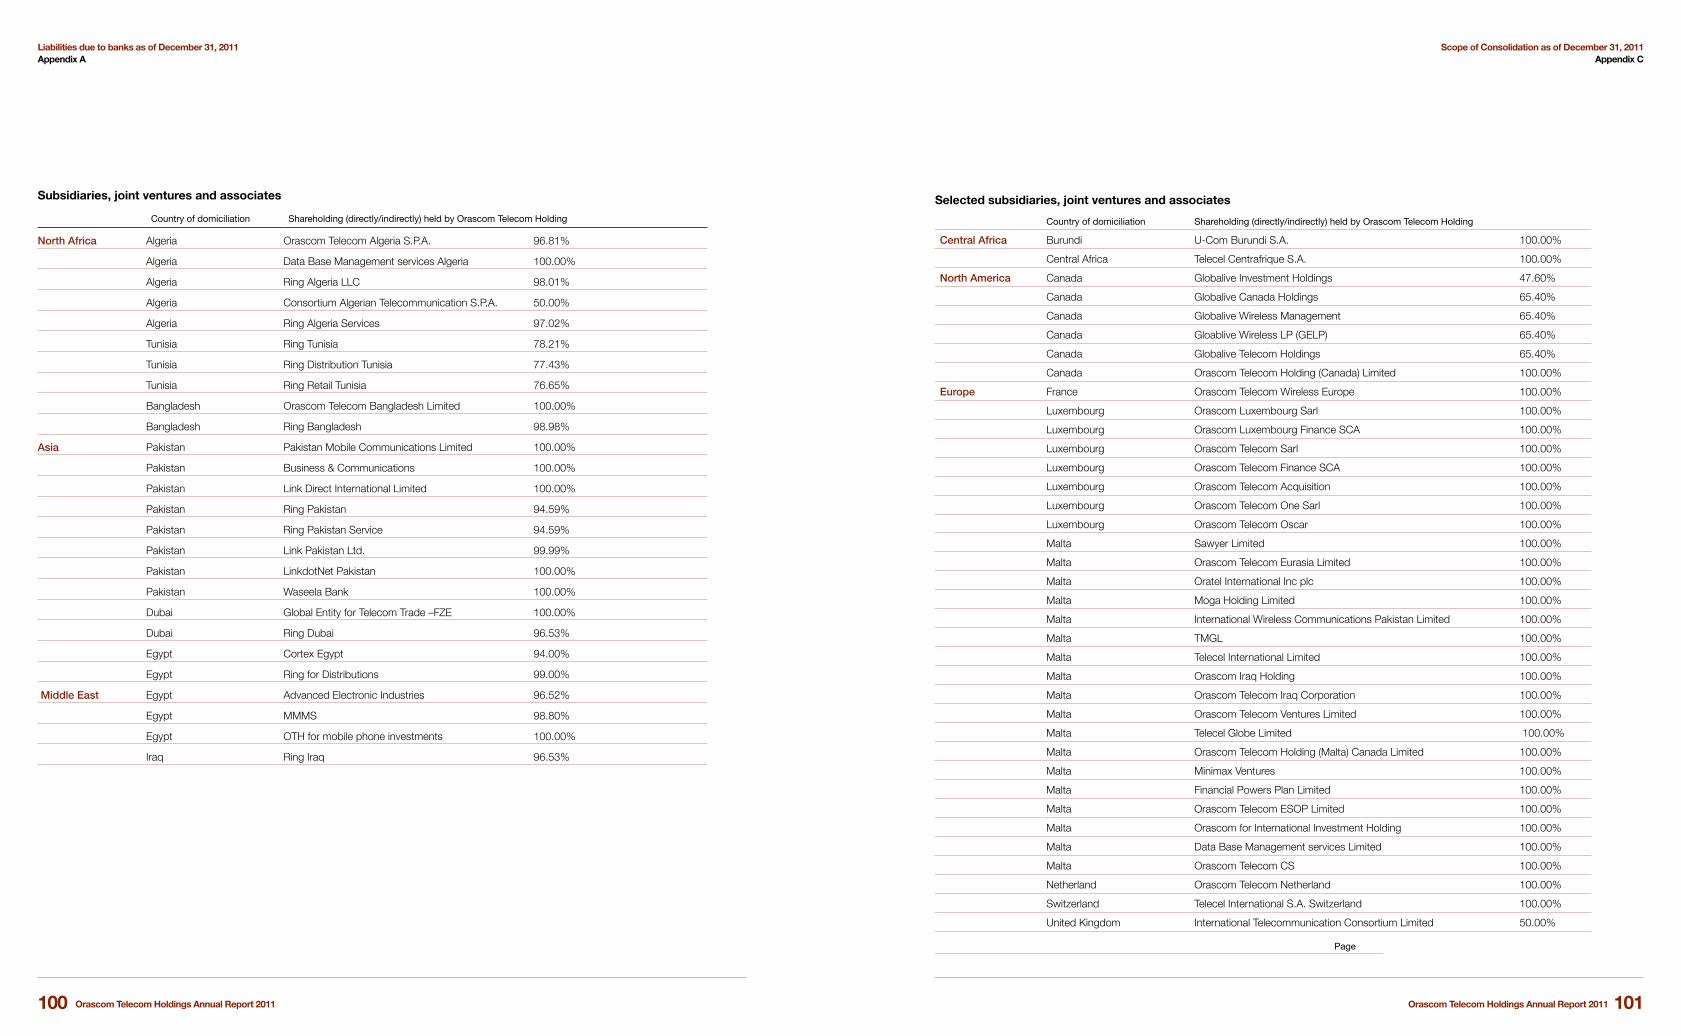
Orascom Telecom Holdings Annual Report 2011Orascom Telecom Holdings Annual Report 2011 101100
Subsidiaries, joint ventures and associates
Country of domiciliation Shareholding (directly/indirectly) held by Orascom Telecom Holding
North Africa Algeria Orascom Telecom Algeria S.P.A. 96.81%
Algeria Data Base Management services Algeria 100.00%
Algeria Ring Algeria LLC 98.01%
Algeria Consortium Algerian Telecommunication S.P.A. 50.00%
Algeria Ring Algeria Services 97.02%
Tunisia Ring Tunisia 78.21%
Tunisia Ring Distribution Tunisia 77.43%
Tunisia Ring Retail Tunisia 76.65%
Bangladesh Orascom Telecom Bangladesh Limited 100.00%
Bangladesh Ring Bangladesh 98.98%
Asia Pakistan Pakistan Mobile Communications Limited 100.00%
Pakistan Business & Communications 100.00%
Pakistan Link Direct International Limited 100.00%
Pakistan Ring Pakistan 94.59%
Pakistan Ring Pakistan Service 94.59%
Pakistan Link Pakistan Ltd. 99.99%
Pakistan LinkdotNet Pakistan 100.00%
Pakistan Waseela Bank 100.00%
Dubai Global Entity for Telecom Trade –FZE 100.00%
Dubai Ring Dubai 96.53%
Egypt Cortex Egypt 94.00%
Egypt Ring for Distributions 99.00%
Middle East Egypt Advanced Electronic Industries 96.52%
Egypt MMMS 98.80%
Egypt OTH for mobile phone investments 100.00%
Iraq Ring Iraq 96.53%
Scope of Consolidation as of December 31, 2011Appendix C
Liabilities due to banks as of December 31, 2011Appendix A
Selected subsidiaries, joint ventures and associates
Country of domiciliation Shareholding (directly/indirectly) held by Orascom Telecom Holding
Central Africa Burundi U-Com Burundi S.A. 100.00%
Central Africa Telecel Centrafrique S.A. 100.00%
North America Canada Globalive Investment Holdings 47.60%
Canada Globalive Canada Holdings 65.40%
Canada Globalive Wireless Management 65.40%
Canada Gloablive Wireless LP (GELP) 65.40%
Canada Globalive Telecom Holdings 65.40%
Canada Orascom Telecom Holding (Canada) Limited 100.00%
Europe France Orascom Telecom Wireless Europe 100.00%
Luxembourg Orascom Luxembourg Sarl 100.00%
Luxembourg Orascom Luxembourg Finance SCA 100.00%
Luxembourg Orascom Telecom Sarl 100.00%
Luxembourg Orascom Telecom Finance SCA 100.00%
Luxembourg Orascom Telecom Acquisition 100.00%
Luxembourg Orascom Telecom One Sarl 100.00%
Luxembourg Orascom Telecom Oscar 100.00%
Malta Sawyer Limited 100.00%
Malta Orascom Telecom Eurasia Limited 100.00%
Malta Oratel International Inc plc 100.00%
Malta Moga Holding Limited 100.00%
Malta International Wireless Communications Pakistan Limited 100.00%
Malta TMGL 100.00%
Malta Telecel International Limited 100.00%
Malta Orascom Iraq Holding 100.00%
Malta Orascom Telecom Iraq Corporation 100.00%
Malta Orascom Telecom Ventures Limited 100.00%
Malta Telecel Globe Limited 100.00%
Malta Orascom Telecom Holding (Malta) Canada Limited 100.00%
Malta Minimax Ventures 100.00%
Malta Financial Powers Plan Limited 100.00%
Malta Orascom Telecom ESOP Limited 100.00%
Malta Orascom for International Investment Holding 100.00%
Malta Data Base Management services Limited 100.00%
Malta Orascom Telecom CS 100.00%
Netherland Orascom Telecom Netherland 100.00%
Switzerland Telecel International S.A. Switzerland 100.00%
United Kingdom International Telecommunication Consortium Limited 50.00%
Page
Orascom Telecom Holdings Annual Report 2011Orascom Telecom Holdings Annual Report 2011 103102
Index to the consolidated financial statements
Consolidated balance sheet 1
Consolidated income statement 2
Consolidated statement of comprehensive income 3
Consolidated statement of changes in equity 4
Consolidated statement of cash flows 5
Notes to the consolidated financial statements 7
Appendix A - Liabilities to banks 55
Appendix B – Bonds 57
Appendix C - Scope of consolidation 58

Orascom Telecom Holdings Annual Report 2011Orascom Telecom Holdings Annual Report 2011 105104
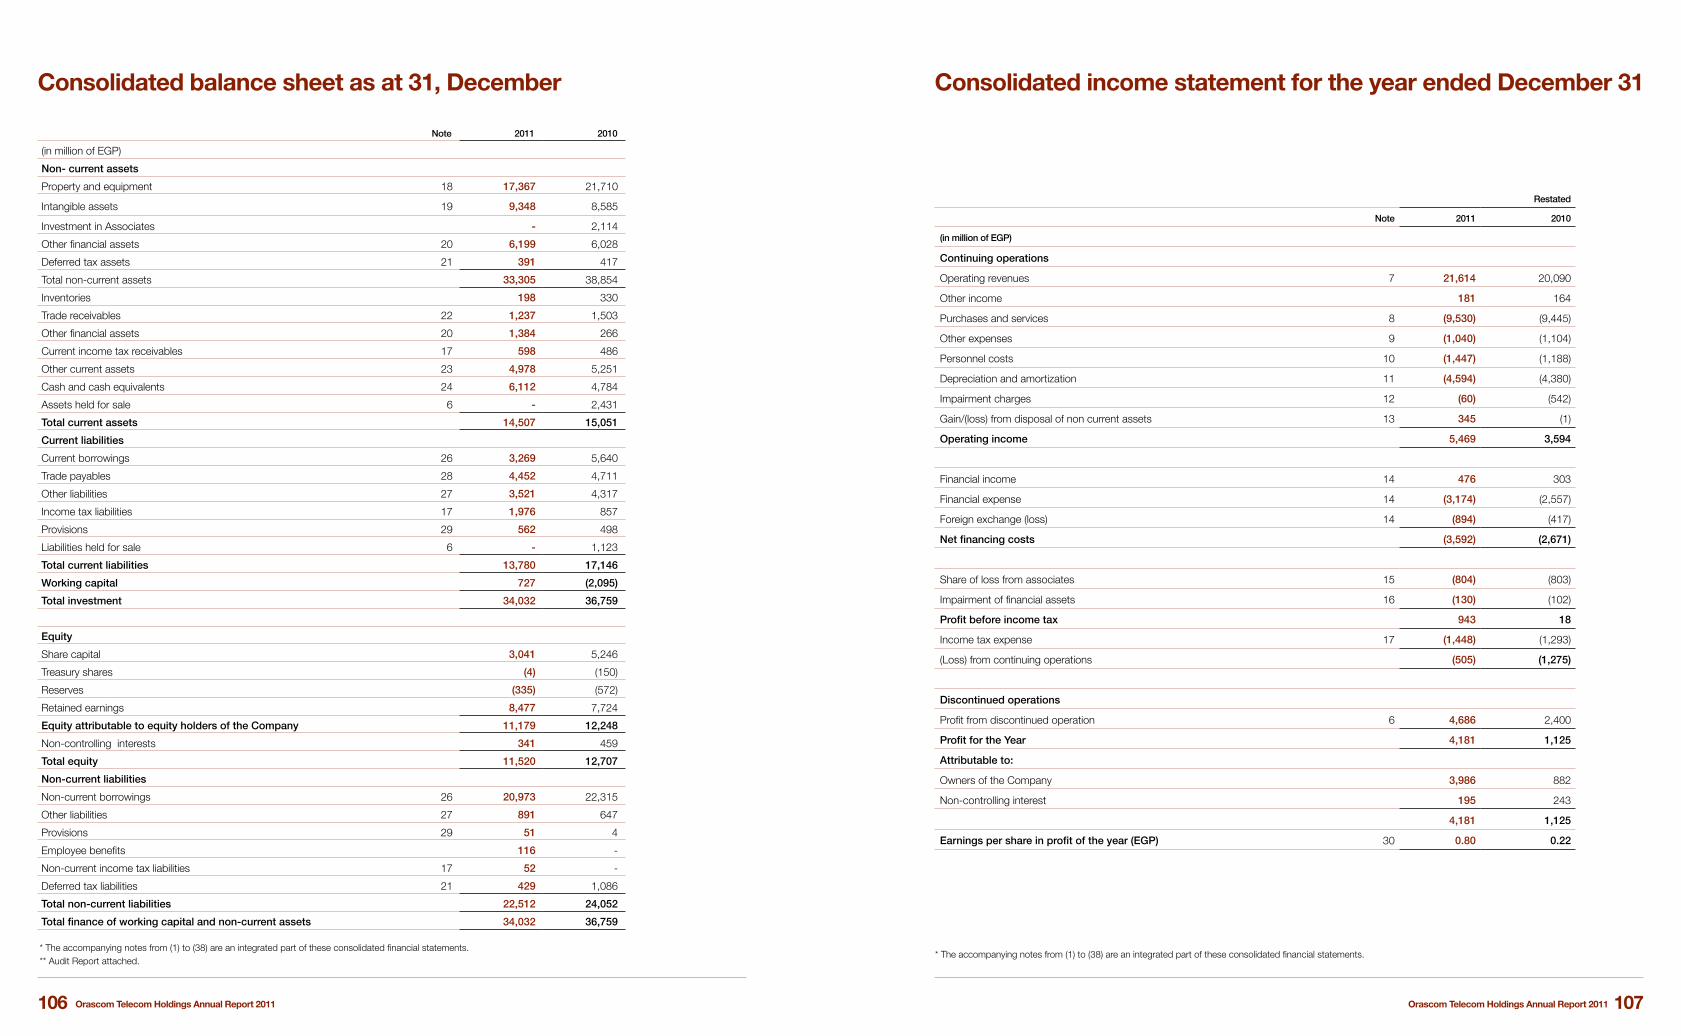
Orascom Telecom Holdings Annual Report 2011Orascom Telecom Holdings Annual Report 2011 107106
Restated
Note 2011 2010
(in million of EGP)
Continuing operations
Operating revenues 7 21,614 20,090
Other income 181 164
Purchases and services 8 (9,530) (9,445)
Other expenses 9 (1,040) (1,104)
Personnel costs 10 (1,447) (1,188)
Depreciation and amortization 11 (4,594) (4,380)
Impairment charges 12 (60) (542)
Gain/(loss) from disposal of non current assets 13 345 (1)
Operating income 5,469 3,594
Financial income 14 476 303
Financial expense 14 (3,174) (2,557)
Foreign exchange (loss) 14 (894) (417)
Net financing costs (3,592) (2,671)
Share of loss from associates 15 (804) (803)
Impairment of financial assets 16 (130) (102)
Profit before income tax 943 18
Income tax expense 17 (1,448) (1,293)
(Loss) from continuing operations (505) (1,275)
Discontinued operations
Profit from discontinued operation 6 4,686 2,400
Profit for the Year 4,181 1,125
Attributable to:
Owners of the Company 3,986 882
Non-controlling interest 195 243
4,181 1,125
Earnings per share in profit of the year (EGP) 30 0.80 0.22
Consolidated income statement for the year ended December 31Consolidated balance sheet as at 31, December
Note 2011 2010
(in million of EGP)
Non- current assets
Property and equipment 18 17,367 21,710
Intangible assets 19 9,348 8,585
Investment in Associates - 2,114
Other financial assets 20 6,199 6,028
Deferred tax assets 21 391 417
Total non-current assets 33,305 38,854
Inventories 198 330
Trade receivables 22 1,237 1,503
Other financial assets 20 1,384 266
Current income tax receivables 17 598 486
Other current assets 23 4,978 5,251
Cash and cash equivalents 24 6,112 4,784
Assets held for sale 6 - 2,431
Total current assets 14,507 15,051
Current liabilities
Current borrowings 26 3,269 5,640
Trade payables 28 4,452 4,711
Other liabilities 27 3,521 4,317
Income tax liabilities 17 1,976 857
Provisions 29 562 498
Liabilities held for sale 6 - 1,123
Total current liabilities 13,780 17,146
Working capital 727 (2,095)
Total investment 34,032 36,759
Equity
Share capital 3,041 5,246
Treasury shares (4) (150)
Reserves (335) (572)
Retained earnings 8,477 7,724
Equity attributable to equity holders of the Company 11,179 12,248
Non-controlling interests 341 459
Total equity 11,520 12,707
Non-current liabilities
Non-current borrowings 26 20,973 22,315
Other liabilities 27 891 647
Provisions 29 51 4
Employee benefits 116 -
Non-current income tax liabilities 17 52 -
Deferred tax liabilities 21 429 1,086
Total non-current liabilities 22,512 24,052
Total finance of working capital and non-current assets 34,032 36,759
* The accompanying notes from (1) to (38) are an integrated part of these consolidated financial statements.** Audit Report attached.
* The accompanying notes from (1) to (38) are an integrated part of these consolidated financial statements.
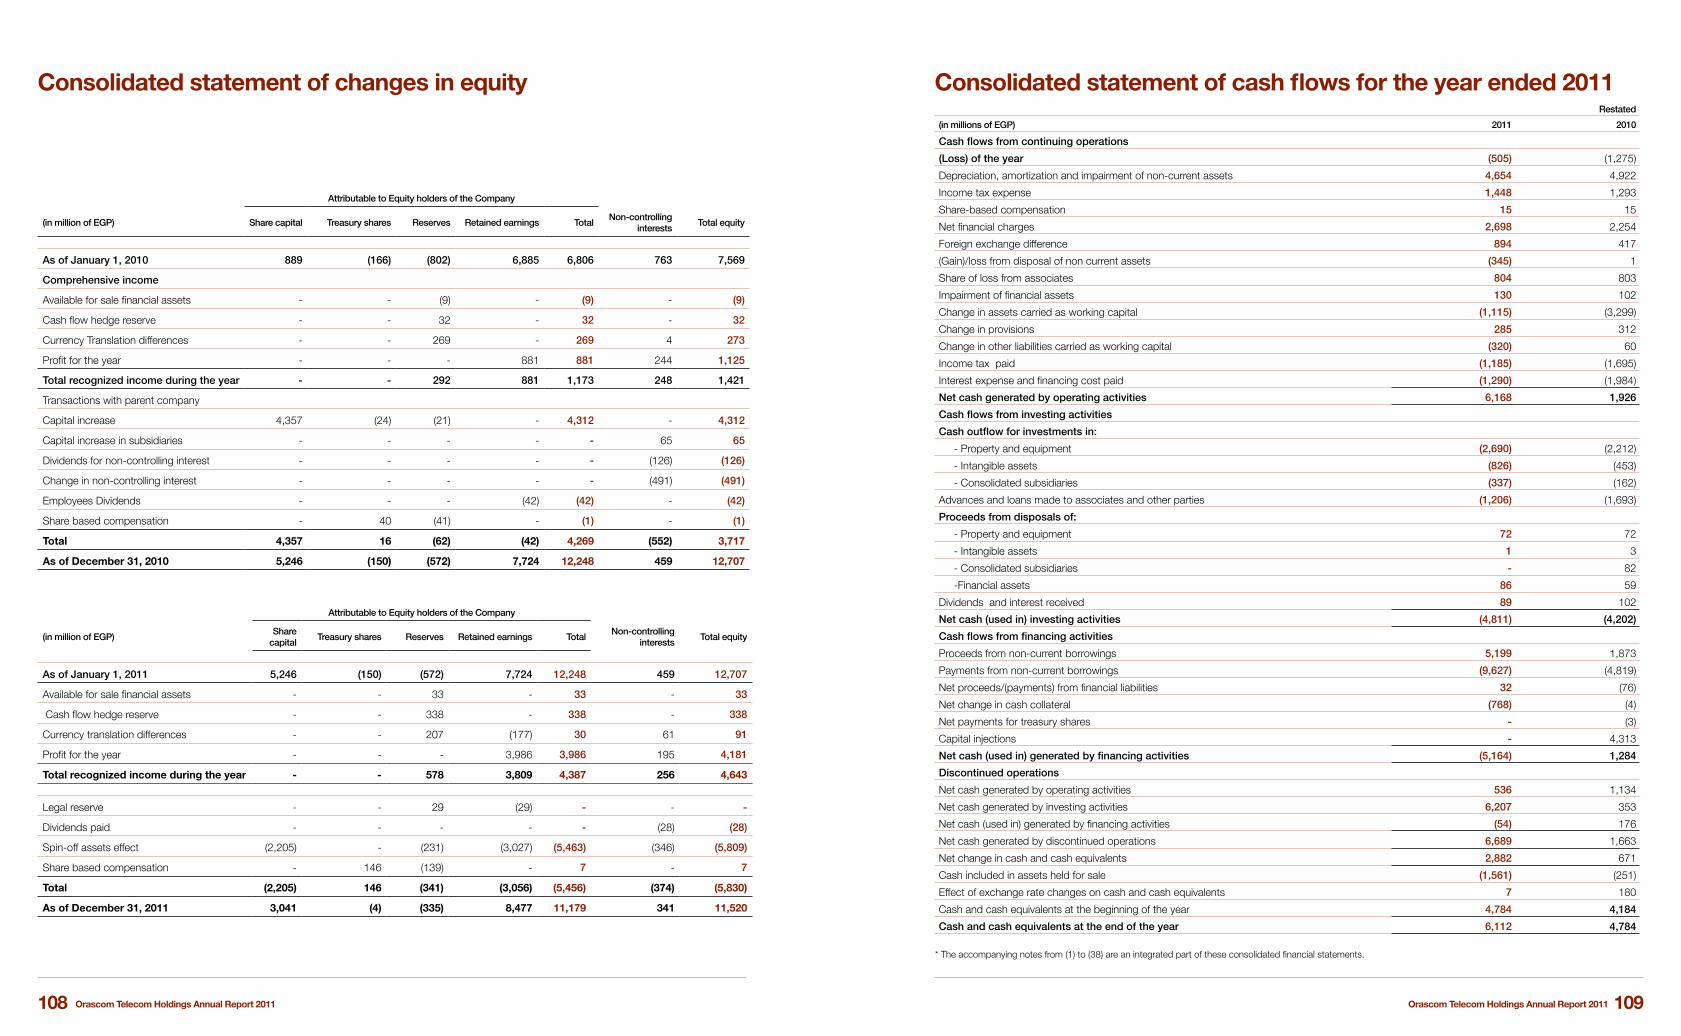
Orascom Telecom Holdings Annual Report 2011Orascom Telecom Holdings Annual Report 2011 109108
Restated
(in millions of EGP) 2011 2010
Cash flows from continuing operations
(Loss) of the year (505) (1,275)
Depreciation, amortization and impairment of non-current assets 4,654 4,922
Income tax expense 1,448 1,293
Share-based compensation 15 15
Net financial charges 2,698 2,254
Foreign exchange difference 894 417
(Gain)/loss from disposal of non current assets (345) 1
Share of loss from associates 804 803
Impairment of financial assets 130 102
Change in assets carried as working capital (1,115) (3,299)
Change in provisions 285 312
Change in other liabilities carried as working capital (320) 60
Income tax paid (1,185) (1,695)
Interest expense and financing cost paid (1,290) (1,984)
Net cash generated by operating activities 6,168 1,926
Cash flows from investing activities
Cash outflow for investments in:
- Property and equipment (2,690) (2,212)
- Intangible assets (826) (453)
- Consolidated subsidiaries (337) (162)
Advances and loans made to associates and other parties (1,206) (1,693)
Proceeds from disposals of:
- Property and equipment 72 72
- Intangible assets 1 3
- Consolidated subsidiaries - 82
-Financial assets 86 59
Dividends and interest received 89 102
Net cash (used in) investing activities (4,811) (4,202)
Cash flows from financing activities
Proceeds from non-current borrowings 5,199 1,873
Payments from non-current borrowings (9,627) (4,819)
Net proceeds/(payments) from financial liabilities 32 (76)
Net change in cash collateral (768) (4)
Net payments for treasury shares - (3)
Capital injections - 4,313
Net cash (used in) generated by financing activities (5,164) 1,284
Discontinued operations
Net cash generated by operating activities 536 1,134
Net cash generated by investing activities 6,207 353
Net cash (used in) generated by financing activities (54) 176
Net cash generated by discontinued operations 6,689 1,663
Net change in cash and cash equivalents 2,882 671
Cash included in assets held for sale (1,561) (251)
Effect of exchange rate changes on cash and cash equivalents 7 180
Cash and cash equivalents at the beginning of the year 4,784 4,184
Cash and cash equivalents at the end of the year 6,112 4,784
Attributable to Equity holders of the Company
(in million of EGP) Share capital Treasury shares Reserves Retained earnings TotalNon-controlling
interestsTotal equity
As of January 1, 2010 889 (166) (802) 6,885 6,806 763 7,569
Comprehensive income
Available for sale financial assets - - (9) - (9) - (9)
Cash flow hedge reserve - - 32 - 32 - 32
Currency Translation differences - - 269 - 269 4 273
Profit for the year - - - 881 881 244 1,125
Total recognized income during the year - - 292 881 1,173 248 1,421
Transactions with parent company
Capital increase 4,357 (24) (21) - 4,312 - 4,312
Capital increase in subsidiaries - - - - - 65 65
Dividends for non-controlling interest - - - - - (126) (126)
Change in non-controlling interest - - - - - (491) (491)
Employees Dividends - - - (42) (42) - (42)
Share based compensation - 40 (41) - (1) - (1)
Total 4,357 16 (62) (42) 4,269 (552) 3,717
As of December 31, 2010 5,246 (150) (572) 7,724 12,248 459 12,707
Attributable to Equity holders of the Company
(in million of EGP)Share
capitalTreasury shares Reserves Retained earnings Total
Non-controlling interests
Total equity
As of January 1, 2011 5,246 (150) (572) 7,724 12,248 459 12,707
Available for sale financial assets - - 33 - 33 - 33
Cash flow hedge reserve - - 338 - 338 - 338
Currency translation differences - - 207 (177) 30 61 91
Profit for the year - - - 3,986 3,986 195 4,181
Total recognized income during the year - - 578 3,809 4,387 256 4,643
Legal reserve - - 29 (29) - - -
Dividends paid - - - - - (28) (28)
Spin-off assets effect (2,205) - (231) (3,027) (5,463) (346) (5,809)
Share based compensation - 146 (139) - 7 - 7
Total (2,205) 146 (341) (3,056) (5,456) (374) (5,830)
As of December 31, 2011 3,041 (4) (335) 8,477 11,179 341 11,520
Consolidated statement of changes in equity Consolidated statement of cash flows for the year ended 2011
* The accompanying notes from (1) to (38) are an integrated part of these consolidated financial statements.

Orascom Telecom Holdings Annual Report 2011Orascom Telecom Holdings Annual Report 2011 111110
3-1-1 Subsidiary companies
• The consolidated financial statements include all subsidiaries that are controlled by the parent company and which the management intends to continue to control. Control exists when the Group has the power to govern the financial and operating policies of an entity so as to obtain benefits from its activities. In assessing control, potential voting rights that presently are exercisable are taken into account. The financial statements of subsidiaries are included in the consolidated financial statements from the date that control commences until the date that control ceases.
• Intragroup balances and transactions, including income, expenses and dividends, are eliminated in full. Profits and losses resulting from intragroup transactions that are recognized in assets, such as inventory and fixed assets, are eliminated in full. Intragroup losses may indicate an impairment that requires recognition in the consolidated financial statements. EAS 24 Income Taxes applies to temporary differences that arise from the elimination of profits and losses resulting from intragroup transactions.
• Non-controlling interest shall be presented in the consolidated balance sheet within equity, separately from the parent shareholder’s equity. Minority interests in the profit or loss of the group shall also be separately disclosed.
• A parent loses control when it loses the power to govern the financial and operating policies of an investee so as to obtain benefit from its activities.
3 -1- 2 Joint venture companies
Joint control is the contractually agreed sharing of control over an economic activity, and exists only when the strategic financial and operating decisions relating to the activity require the unanimous consent of the parties sharing control (the ventures).
Proportion consolidation is a method of accounting whereby a venture’s share of each of the assets, liabilities, income and expenses of a jointly controlled entity is combined line by line with similar items in the venture’s financial statements or reported as separate line items in the venture’s financial statements.
3-1-3 Investments in associates
Investments in associates are stated at equity method. Under the equity method the investment in associates is initially recognize at cost and the carrying amount is increased or decreased to recognize the investor’s share of the profit or loss of the associates after the date of acquisition. Distributions received from associates reduce the carrying amount of the investment.
Losses of an associate in excess of the Company’s interest in that associate (which includes any long-term interests that, in substance, form part of the Company’s net investment in the associate) are not recognized, unless the Company has incurred legal or constructive obligations or made payments on behalf of the associate.
Any excess of the cost of the acquisition over the Company’s share of the net faire value of the identifiable assets, liabilities and contingent liabilities of the associate recognized at the date of acquisition is recognized as goodwill. The goodwill is included within the carrying amount of the investment and is assessed for impairment as part of the investment.
The license of the Group’s associated undertaking in the Canada, Globalive Wireless Management Corp, are indefinite lived assets. Although the spectrum licenses have an initial term of 10 years, based on available information, the management believes that they are subject to perfunctory renewal and the renewal cost will not be significant. Accordingly, they are not subject to amortization but are tested annually for impairment, or when indicators exist that the carrying value is not recoverable.
3-2 Translation of the foreign currencies transactions
Orascom Telecom Holding and some of its subsidiaries maintain their accounting books in Egyptian Pound. Transactions denominated in foreign currencies are recorded at the prevailing exchange rate at the date of transactions. Monetary assets and liabilities denominated in foreign currencies at the balance sheet date are translated at the prevailing exchange rates at that date. The foreign currencies exchange differences arising on the settlement of transactions and the translation at the balance sheet date are recognized in the income statement.
3-3 Translation of the foreign subsidiaries’ financials
As at the balance sheet date the assets and liabilities of these consolidated subsidiaries are translated to Egyptian Pound at the prevailing rate as at the period end, and the shareholders’ equity accounts are translated at historical rates, where as the income statement items are translated at the average exchange rate prevailing during the period of the consolidated financial statements. Currency translation differences are recorded in the shareholders’ equity section of the balance sheet as translation reserves adjustments.
Notes to the consolidated financial statements for the year ended December 31, 2011
1- General
A- Legal status
Orascom Telecom Holding S.A.E “the Company” is an Egyptian Joint Stock Company subject to the provisions of the Capital Market Law No. 95 of 1992 and its executive regulations. The Company is a majority owned subsidiary of Wind Telecom S.P.A registered in Italy. The Company’s registered office is located in Nile City Towers, Ramlet Beaulac, Cairo, Egypt.
B- Purpose of the company
The Company’s purpose is to participate in companies issuing securities or to increase the share capital of these companies. The Company may have interest or participate in, by any mean, in companies and other enterprises that have activities similar to those of the Company or those that may assist the Company to achieve its objective in Egypt or abroad. It may also merge into those companies and enterprises purchase them or affiliate them, pursuant to the provisions of the law and its executive regulations.
The company and its subsidiaries are considered from the biggest companies in providing the mobile services in Middle East companies, Africa and South Asia, it covers a geographic area containing 415 million citizens.
C- Financial statement authorization
The consolidated financial statements were approved by the board of directors on April 12, 2012.
2- Basis of preparation
2-1 Statement of compliance
These Consolidated financial statements have been prepared in accordance with the Egyptian Accounting Standards (EASs) and relevant Egyptian laws and regulations.
2-2 Basis of measurement
The financial statements are prepared on the historical cost convention, except for the following assets and liabilities which are measured at fair value
• Derivative financial instruments.
• Financial instruments at fair value through profit and loss.
• Available-for-sale financial assets.
2-3 Functional and presentation currency
These financial statements are presented in Egyptian pounds (EGP), which is the Company’s functional currency. All financial information presented in Egyptian pounds has been rounded to the nearest million except for earnings per share information.
2-4 Use of estimates and judgments
The preparation of financial statements requires management to make judgments, estimates and assumptions that affect the application of accounting policies and the reported amounts of assets, liabilities, income and expenses. Actual results may differ from these estimates.
These estimates and underlying assumptions related to historical experience and various other factors that the company’s management considered reasonable in the circumstances and current events.
Estimates and underlying assumptions are reviewed on an ongoing basis. Revisions to accounting estimates are recognized in the period in which the estimate is revised and in any future periods affected.
In particular, information about significant areas of estimation uncertainty and critical judgments in applying accounting policies that have the most significant effect on the amount recognized in the financial statements are described in the following notes:
• Measurement of the recoverable amount of intangible assets and goodwill.
• Valuation of financial instruments
• Recognition of deferred tax assets.
• Provisions and contingencies.
3- Significant accounting policies applied
The main accounting principles and policies adopted in preparing these Consolidated Financial Statements are set our below. These policies have been consistently applied to all periods in those consolidated financial statements, and have been applied consistently by the group entities.
The functional currency of each subsidiary is the local currency where that entity operates. In order to present financial information to international investors, the information presented in this document has been presented in million of Egyptian Pounds (“EGP.”), except for earnings per share information and unless otherwise stated.
3-1 Basis of consolidation
The consolidated financial statements include the following companies:
Notes to the consolidated financial statements for the year ended December 31, 2011

Orascom Telecom Holdings Annual Report 2011Orascom Telecom Holdings Annual Report 2011 113112
3-7 Intangible assets
A- Goodwill
Goodwill (positive and negative) represents amounts arising on acquisition of subsidiaries, associates and joint ventures. Goodwill (positive and negative) represents the difference between the cost of the acquisition and the fair value of the net identifiable assets acquired at acquisition date.
• Positive goodwill is stated at cost less impairment losses.
• While negative goodwill arose will be recognized directly in the income statement.
• Goodwill resulting from further acquisitions after control is obtained is determined on the basis of the cost of the additional investment and the carrying amount of net assets at the date of acquisition, accordingly.
B- Other intangible assets
Other intangible assets that are acquired by the Group are stated at cost less accumulated amortization and impairment losses. Amortization is recognized in the income statement on a straight – line basis over the estimated useful lives of intangible assets. License fees are amortized over the period of the licenses, concessions and computers software are amortized from the date they are available for use. The estimated useful lives are as follows:
Assets Amortization period
- Licenses Fees Over licenses period
- Concessions and Computers software 3-15 years
C- Subsequent expenditure
Subsequent expenditure on capitalized intangible assets is capitalized only when it increases the future economic benefits embodied in the specific asset to which it relates. All other expenditure is expensed as incurred.
3-8 Investments at fair value
a- Available-for-sale financial assets
Available-for-sale financial assets are valued at fair value, with any resultant gain or loss being recognized in equity, except for impairment losses which is recognized in the income statement. When these investments are derecognized, the cumulative gain or loss previously recognized directly in equity is recognized in the income statement. The fair value of investments available for sale, identifies based on quoted price of the exchange market at the balance sheet date, investments that are not quoted, and whose fair value cannot be measured reliably, are stated at cost less impairment loss.
b - Investments at fair value through profit and loss
An instrument is classified as at fair value through income statement if it is held for trading or is designated as such upon initial recognition. Financial instruments are designated at fair value through income statement if the Company manages such investments and makes purchase and sale decisions based on their fair value. Costs related to acquisition of such investments are recognized through profit and loss. These investments are subsequently measured at fair value and revaluation differences are recorded through profit and loss.
3-9 Impairment
a- Financial assets
A financial asset is considered to be impaired if objective evidence indicates that one or more events have had a negative effect on the estimated future cash flows of that asset.
An impairment loss in respect of a financial asset measured at amortized cost is calculated as the difference between its carrying amount, and the present value of the estimated future cash flows discounted at the original effective interest rate. An impairment loss in respect of an available-for-sale financial asset is calculated by reference to its current fair value.
Individually significant financial assets are tested for impairment on an individual basis. The remaining financial assets are assessed collectively in groups that share similar credit risk characteristics.
All impairment losses are recognized in profit or loss. Any cumulative loss in respect of an available-for-sale financial asset recognized previously in equity is transferred profit or loss.
An impairment loss is reversed if the reversal can be related objectively to an event occurring after the impairment loss was recognized. For financial assets measured at amortized cost and available-for-sale financial assets that are debt securities, the reversal is recognized in profit or loss. For available-for-sale financial assets that are equity securities, the reversal is recognized directly in equity.
Notes to the consolidated financial statements for the year ended December 31, 2011
3-4 Derivative financial instruments
The Group uses derivative financial instruments to hedge its exposure to foreign exchange and interest rate risks arising from operational, financial and investment activities. In accordance with its treasury policy, the Group does not hold or issue derivative financial instruments for trading purposes. However, derivatives that do not qualify for hedge accounting are accounted for as trading instruments. Derivatives are recognized initially at fair value; attributable transaction costs are recognized in profit or loss when incurred.
Subsequent to initial recognition, derivatives are measured at fair value, and changes therein are accounted for as described below:-
Cash flow hedges
Changes in the fair value of the derivative hedging instrument designated as a cash flow hedge are recognized directly in equity to the extent that the hedge is effective. To the extent that the hedge is ineffective, changes in fair value are recognized in profit or loss.
If the hedging instrument no longer meets the criteria for hedge accounting, expires or is sold, terminated or exercised, then hedge accounting is discontinued prospectively. The cumulative gain or loss previously recognized in equity remains in place until the forecast transaction occurs. When the hedged item is a non-financial asset, the amount recognized in equity is transferred to the carrying amount of the asset when it is recognized. In other cases the amount recognized in equity is transferred to profit or loss in the same period that the hedged item affects profit or loss.
Fair value hedges
Changes in the fair value of a derivative hedging instrument designated as a fair value hedge are recognized in profit or loss. The hedged item also is stated at faire value in respect of the risk being hedged, with any gain or loss being recognized in profit or loss.
3-5 Property & equipment and depreciation
Property & equipment are stated at historical cost and presented in the balance sheet net of accumulated depreciation and impairment. Depreciation is charged to the income statement over the estimated useful-life of each asset using the straight-line method.
The following are the estimated useful lives:
Assets Depreciation period
Buildings 50 years
Cell sites 8-15 years
Tools 5-10 years
Computers equipment 3-5 years
Furniture and Fixtures 5-10 years
Vehicles 3-6 years
Leasehold improvements and renovations 3-8 years
Expenditure incurred to replace a component of an item of property and equipment that is accounted for separately, including major inspection and overhaul expenditure, is capitalized. Other subsequent expenditure is capitalized only when it increases the future economic benefits embodied in the property and equipment. All other expenditure is recognized in the income statement as an expense as incurred.
3-6 Property and equipment under construction
Property and equipment under construction are recognized initially at cost. Cost includes all expenditures directly attributable to bringing the asset to a working condition for its intended use. Property and equipment under construction are transferred to property and equipment caption when they are completed and are ready for their intended use.

Orascom Telecom Holdings Annual Report 2011Orascom Telecom Holdings Annual Report 2011 115114
3-16 Earning per share
The Company presents basic earnings per share (EPS) data for its ordinary shares. Basic EPS is calculated by dividing the profit or loss attributable to ordinary shareholders of the Company by the weighted average number of ordinary shares outstanding during the year.
3-17 Interest-bearing borrowings
Interest-bearing borrowings are recognized initially at fair value less attributable transaction costs. Subsequent to initial recognition, Interest-bearing borrowings are stated at amortized cost with any difference between cost and redemption value being recognized in the income statement over the period of the borrowings on an effective interest basis.
3-18 Issued capital
a - Treasury stocks
When share capital recognized as equity is repurchased, the amount of the consideration paid, including directly attributable costs, is recognized as a change in equity.
Repurchased shares are classified as treasury stock and presented as a deduction from total equity.
b- Dividends
Dividends are recognized as a liability in the year in which they are declared.
3-19 Legal reserve
As per the Company’s statutes 5% of net profit for the year is set aside to form a legal reserve, the transfer to such reserve ceases once it reaches 50% of the Company’s paid in share capital. The reserve can be utilized in covering losses or increasing the Company’s share capital.
3-20 Revenue recognition
(i) Cellular operations revenueGSM revenue is recognized when services rendered to the customers based on the actual usage airtime from the following activities:
• Prepaid cards is recognized based on the actual used calls minutes while the unused call minutes at the end of the period are deferred.
• Monthly and connection fees are recognized in the income statement on a straight-line basis over the period or the terms of the contract.
• Other GSM telecommunications services and facilities when provided.
(ii) Telecommunications services revenue
Revenue from the provision of telecommunications services includes the following:
• Goods soldRevenue is recognized when the significant risks and rewards of ownership have been transferred to the buyer.
• Construction contractsRevenue is recognized in proportion to the stage of completion of the contract.
• Satellite servicesRevenue is recognized once the services delivered to the client.
• VAS revenueValue added services (VAS) revenue is recognized once the services are delivered, or used by the customers.
• Space segment revenueSpace segment rental fees are recognized in the income statement on a straight-line basis over the terms of the lease.
(iii) Internet and fixed lines revenue
Revenue is recognized once the service delivered to the client.
3-21 Expenses
a- Borrowing costs
Borrowing costs are recognized as expenses in the income statement when incurred, with the exception of borrowing cost directly attributable to the construction and acquisition of new assets which is capitalized as part of the relevant assets cost and depreciated over assets’ estimated useful lives. This capitalization ceases once the assets become in operational condition and ready for use.
b-Employees’ pension
The Company contributes to the government social insurance system for the benefit of its personnel in accordance with the social insurance law. Under this law, the employees and the employers contribute into the system on a fixed percentage-of-salaries basis. The Company’s liability is confined to the amount of its contribution. Contributions are charged to income statement using the accrual basis of accounting.
3-22 Segment reporting
A segment is a distinguishable component of the group that is engaged either in providing products or services (business segment) or in providing products or services within a particular economic environment (geographical segment), which is subjected to risks and rewards that are different from those of other segments. The group’s primary format for segment reporting is based on business segment.
Notes to the consolidated financial statements for the year ended December 31, 2011
b - Non-financial assets
The carrying amounts of the Group’s non-financial assets, other than biological assets, investment property, inventories and deferred tax assets, are reviewed at each reporting date to determine whether there is any indication of impairment.
An impairment loss is recognized if the carrying amount of an asset or its cash-generating unit exceeds its recoverable amount. A cash-generating unit is the smallest identifiable asset group that generates cash flows that largely are independent from other assets and groups. Impairment losses are recognized in profit or loss.
The recoverable amount of an asset or cash-generating unit is the greater of its value in use and its fair value less costs to sell.
Impairment losses recognized in prior periods are assessed at each reporting date for any indications that the loss has decreased or no longer exists. An impairment loss is reversed if there has been a change in the estimates used to determine the recoverable amount.
An impairment loss is reversed only to the extent that the asset’s carrying amount does not exceed the carrying amount that would have been determined, net of depreciation or amortization, if no impairment loss had been recognized.
3-10 Cash and cash equivalents
For the purpose of preparing the Statement of Cash Flows, the Company considers all cash on hands and bank on demand deposits with banks and short-term highly liquid investments that are readily convertible to known amounts of cash and that are subject to an insignificant risk of changes in value with original maturities of three months or less are considered as cash and cash equivalents. The Statement of Cash Flows is prepared according to the indirect method.
3-11 Trade and other receivables
Trade and other receivables are stated at their cost less impairment losses.
3-12 Inventories
Inventories are stated at the lower of cost and net realizable value. Cost is determined using the weighted average method and net realizable value is the estimated selling price in the ordinary course of business, less the estimated costs of completion and other addition expenses.
3-13 Non-current assets held for sale
Non-current assets (or disposal groups comprising assets and liabilities) that are expected to be recovered primarily through sale rather than through continuing use is classified as held for sale. Immediately before
classification as held for sale, the assets (or components of a disposal group) are remeasured in accordance with the Group’s accounting policies. Thereafter generally the assets (or disposal group) are measured at the lower of their carrying amount and fair value less cost to sell. Any impairment loss on a disposal group first is allocated to goodwill, and then to remaining assets and liabilities on pro rata basis, except that no loss is allocated to inventories, financial assets, deferred tax assets, employee benefit assets, investment property and biological assets, which continue to be measured in accordance with the Group’s accounting policies. Impairment losses on initial classification as held for sale and subsequent gains or losses on remeasurement are recognised in profit or loss. Gains are not recognised in excess of any cumulative impairment loss.
3-14 Taxation
Income tax on the profit or loss for the year comprises current and deferred tax. Income tax is recognized in the income statement except to the extent that it relates to items recognized directly in equity, in which case it is recognized in equity.
Current tax is the expected tax payable on the taxable income for the year, using tax rates enacted or substantially enacted at the balance sheet date, and any adjustment to tax payable in respect of previous years.
Deferred tax is provided using the balance sheet liability method, providing for temporary differences between the carrying amounts of assets and liabilities for financial reporting purposes and the amounts used for taxation purposes. The amount of deferred tax provided is based on the expected manner of realization or settlement of the carrying amount of assets and liabilities, using tax rates enacted or substantively enacted at the balance sheet date.
A deferred tax asset is recognized only to the extent that it is probable that future taxable profits will be available against which the asset can be utilized. Deferred tax assets are reduced to the extent that it is no longer probable that the related tax benefit will be realized.
3-15 Provisions
Provisions are recognized when the Company has a legal or constructive obligation as a result of a past event and it’s probable that a flow of economic benefits will be required to settle the obligation. If the effect is material, provisions are determined by discounting the expected future cash flows at a pre-tax rate that reflects current market assessment of the time value of money and, where appropriate, the risks specific to the liability. Provisions are reviewed at the balance sheet date and amended (when necessary) to represent the best current estimate.

Orascom Telecom Holdings Annual Report 2011Orascom Telecom Holdings Annual Report 2011 117116
Cash flow and fair value interest rate risk
The Group is exposed to market risks as a result of changes in interest rates particularly in relation to borrowings.
Borrowings issued at floating rates expose the Group to cash flow interest rate risk. Borrowings issued at fixed rates expose the Group to fair value interest rate risk.
The basic strategy of interest rate risk management is to balance the debt structure with an appropriate mix of fixed and floating interest rate borrowings based on the Group’s perception of future interest rate movements. As of December 31, 2011 26.5% of the Group’s financial liabilities were floating rate liabilities, mainly relating to borrowings of PMCL.
Prior the Refinancing Plan the Group used certain interest rate derivatives to hedge movements in interest rates.
Subsequent to the Refinancing Plan, the majority of the Group’s long term borrowings are fixed rate. Therefore the Group does not use interest rate derivatives.
The Group considers the sensitivity of its finance costs to movements in interest rates. In particular an increase / decrease of 1% in interest rates as of December 31, 2011 would have result in an increase / decrease in finance costs of EGP 64 million.
Price risk
The Group has limited exposure to equity securities price risk on investments held by the Group.
Credit Risk
The Group considers that it is not exposed to major concentrations of credit risk in relation to trade receivables. However, credit risk can arise in the event of non-performance of a counterparty, particularly in relation to credit exposures for trade and other receivables, financial instruments and cash and cash equivalents.
The Group considers that the concentration of credit risk with respect to trade receivables is limited given that the Group’s customer base is largely pre-paid subscribers. Post paid subscribers generally represent a small portion of the subscriber base and therefore the credit exposure is limited. In addition, the Group tries to mitigate credit risk by adopting specific control procedures, including assessing the credit worthiness of the counterparty and limiting the exposure to any one counterparty.
Credit risk relating to cash and cash equivalents, derivative financial instruments and financial deposits arises from the risk that the counterparty becomes insolvent and accordingly is unable to return the deposited funds or execute the obligations under the derivative transactions as a result of the insolvency. To mitigate this risk, wherever possible the Group conducts transactions and deposits funds with financial institutions with a minimum of investment grade rating.
The Group is exposed to credit risk relating to financial receivables as follows:
During 2008 the Company entered into two loans agreements to provide a total amount of CAD 508 million equivalents to EGP 2,334 million to Globalive Wireless Management Corp (“GWMC”), a subsidiary of the associate Globalive Investment Holdings Corp (“Globalive”). The amount of these loans was increased to CAD 608 million during 2009, increased to CAD 970 million during 2010. As of December 31, 2011 the amount outstanding under such loan agreements, including accrued interest, was EGP 8,578 million (equivalent to CAD 1,453 million). The loans were primarily provided to GWMC to fund the acquisition of spectrum licenses in Canada. The licenses were awarded to GWMC during March 2009 by Industry Canada and GWMC launched operations in December 2009. During the start-up phase of operations Globalive has incurred losses and as a result the Group’s share of losses exceeds the carrying value of the investment. The Group considers the loan provided as part of the investment and has therefore deducted the excess losses from the receivable. After considering such losses, the financial receivables balance (including the accrued technical support fees) is EGP 5,787 million as of December 31, 2011 (EGP 4,655 million as of December 31, 2010) included in “Other financial assets” disclosure (note 20).
In general the remaining other receivables and financial receivables included in financial assets generally related to a variety of smaller amounts due from a wide range of counterparties, therefore, the management of the group does not consider that it has a significant concentration of credit risk.
Notes to the consolidated financial statements for the year ended December 31, 2011
3-23 Discontinued operations
A discontinued operation is a component of the Group’s business that represents a separate major line of business or geographical area of operations that has been disposed of or is held for sale, or is a subsidiary acquired exclusively with a view to resale. Classification as a discontinued operation occurs upon disposal or when the operation meets the criteria to be classified as held for sale, if earlier. When an operation is classified as a discontinued operation, the comparative income statement is re-presented as if the operation had been discontinued from the start of the comparative period.
4-Financial Risk Management
Financial Risk Factors
The Group’s activities expose it to a variety of financial risks: market risk (including currency risk, fair value interest risk and cash flow interest risk), credit risk and liquidity risk. In particular the Group is exposed to risks from movements in exchange rates, interest rates and market prices. The Group’s overall risk management program focuses on the unpredictability of financial markets and seeks to minimize potential adverse effects on the Group’s performance through ongoing operational and finance activities. Depending on the risk assessment, the Group uses selected derivative hedging instruments. The management has overall responsibility for the establishment and oversight of the group’s risk management framework.
The department of finance and cash resources of the holding company has the task of managing those risks through the application of policies and procedures approved by the Board of Directors of the group, where it performs, through the close cooperation with the departments of the subsidiaries of the group, the identification, evaluation and application of the hedging and managing activities for expected financial risk.
Market Risk
Foreign exchange risk
The Group operates internationally and is exposed to foreign exchange risk arising when its business transactions are in currencies other than its functional currency. The main currencies to which the Group is exposed are the US dollar, the Canadian Dollar and the Euro.
In general the Group’s subsidiaries are encouraged to obtain financing in their functional currency in order to have a natural hedge of the exchange rate of such financing. However, as some transactions are executed in foreign currencies, and in particular in US$, CAD and Euro, the Group may be subject to the risk of exchange rate fluctuations which, in certain instances the Group manages through the use of hedging strategies. As of December 31, 2011, the Group’s borrowings included US$ borrowings amounting to US$ 3,293 million, Euro borrowings amounting to Euro 50 million, PKR borrowings amounting to PKR 35,946 million, and BDT borrowings amounting to BDT 18,150 million. In certain instances the Group has entered into economic hedging agreements to manage the risk of fluctuations relating to these financing operations. In particular, Pakistan Mobile Communication Limited (PMCL) had borrowings for US$ 144 million and Euro 50 million as of December 31, 2011. Such borrowings were fully hedged by PMCL using cross currency swaps pursuant to which interest payments and principal payments are paid in Pakistani Rupee.
The Group subsidiaries generally execute their operating activities in their respective functional currencies. Some Group subsidiaries are, however, exposed to foreign currency risks in connection with scheduled payments in currencies that are not their functional currencies. In general this relates to foreign currency denominated supplier payables and receivables. The Group monitors the exposure to foreign currency risk arising from operating activities and, where relevant, enters into hedging transactions in order to manage the exposure.
As of December 31, 2011, if the functional currencies had weakened / strengthened by 10% against the US$, the Euro and CAD, with all other variables held constant, the current year’s profit will decrease/ increase by EGP 28 million, mainly relating to US$ denominated borrowings.
Additionally, the Group has investments in foreign operations, whose net assets are exposed to foreign currency translation risk. Currency exposure to such risk is not hedged.
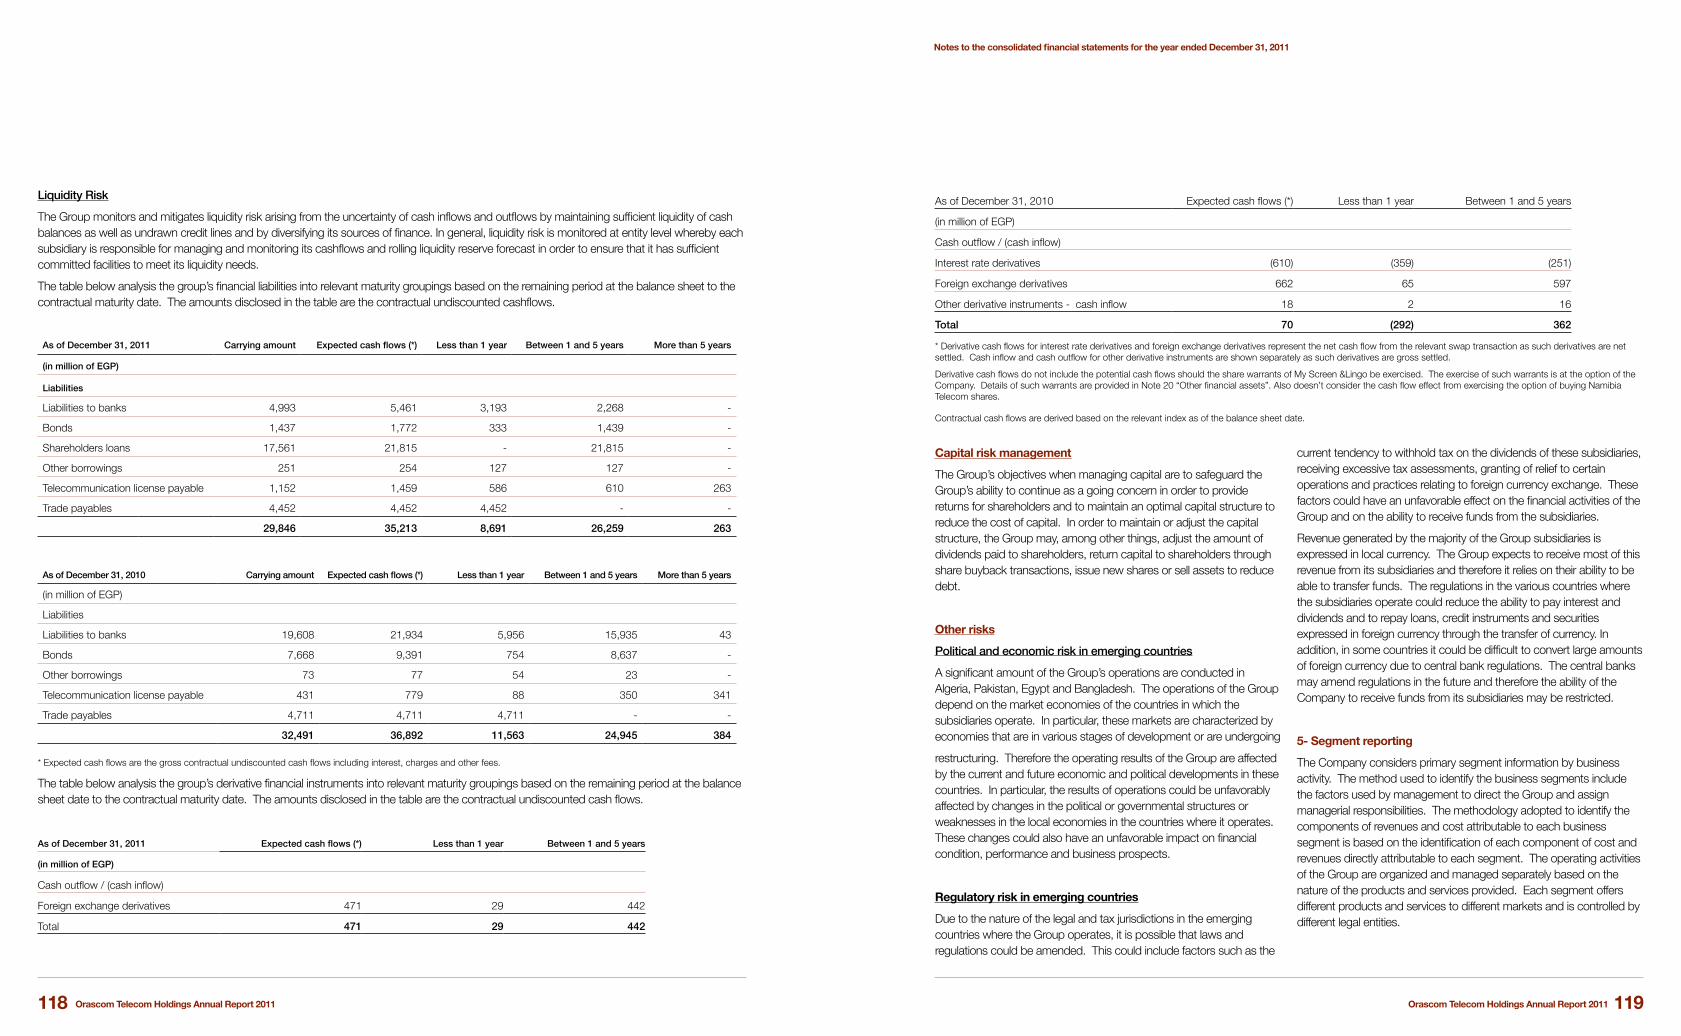
Orascom Telecom Holdings Annual Report 2011Orascom Telecom Holdings Annual Report 2011 119118
As of December 31, 2010 Expected cash flows (*) Less than 1 year Between 1 and 5 years
(in million of EGP)
Cash outflow / (cash inflow)
Interest rate derivatives (610) (359) (251)
Foreign exchange derivatives 662 65 597
Other derivative instruments - cash inflow 18 2 16
Total 70 (292) 362
* Derivative cash flows for interest rate derivatives and foreign exchange derivatives represent the net cash flow from the relevant swap transaction as such derivatives are net settled. Cash inflow and cash outflow for other derivative instruments are shown separately as such derivatives are gross settled.
Derivative cash flows do not include the potential cash flows should the share warrants of My Screen &Lingo be exercised. The exercise of such warrants is at the option of the Company. Details of such warrants are provided in Note 20 “Other financial assets”. Also doesn’t consider the cash flow effect from exercising the option of buying Namibia Telecom shares.
Contractual cash flows are derived based on the relevant index as of the balance sheet date.
Capital risk management
The Group’s objectives when managing capital are to safeguard the Group’s ability to continue as a going concern in order to provide returns for shareholders and to maintain an optimal capital structure to reduce the cost of capital. In order to maintain or adjust the capital structure, the Group may, among other things, adjust the amount of dividends paid to shareholders, return capital to shareholders through share buyback transactions, issue new shares or sell assets to reduce debt.
Other risks
Political and economic risk in emerging countries
A significant amount of the Group’s operations are conducted in Algeria, Pakistan, Egypt and Bangladesh. The operations of the Group depend on the market economies of the countries in which the subsidiaries operate. In particular, these markets are characterized by economies that are in various stages of development or are undergoing
restructuring. Therefore the operating results of the Group are affected by the current and future economic and political developments in these countries. In particular, the results of operations could be unfavorably affected by changes in the political or governmental structures or weaknesses in the local economies in the countries where it operates. These changes could also have an unfavorable impact on financial condition, performance and business prospects.
Regulatory risk in emerging countries
Due to the nature of the legal and tax jurisdictions in the emerging countries where the Group operates, it is possible that laws and regulations could be amended. This could include factors such as the
current tendency to withhold tax on the dividends of these subsidiaries, receiving excessive tax assessments, granting of relief to certain operations and practices relating to foreign currency exchange. These factors could have an unfavorable effect on the financial activities of the Group and on the ability to receive funds from the subsidiaries.
Revenue generated by the majority of the Group subsidiaries is expressed in local currency. The Group expects to receive most of this revenue from its subsidiaries and therefore it relies on their ability to be able to transfer funds. The regulations in the various countries where the subsidiaries operate could reduce the ability to pay interest and dividends and to repay loans, credit instruments and securities expressed in foreign currency through the transfer of currency. In addition, in some countries it could be difficult to convert large amounts of foreign currency due to central bank regulations. The central banks may amend regulations in the future and therefore the ability of the Company to receive funds from its subsidiaries may be restricted.
5- Segment reporting
The Company considers primary segment information by business activity. The method used to identify the business segments include the factors used by management to direct the Group and assign managerial responsibilities. The methodology adopted to identify the components of revenues and cost attributable to each business segment is based on the identification of each component of cost and revenues directly attributable to each segment. The operating activities of the Group are organized and managed separately based on the nature of the products and services provided. Each segment offers different products and services to different markets and is controlled by different legal entities.
Notes to the consolidated financial statements for the year ended December 31, 2011
Liquidity Risk
The Group monitors and mitigates liquidity risk arising from the uncertainty of cash inflows and outflows by maintaining sufficient liquidity of cash balances as well as undrawn credit lines and by diversifying its sources of finance. In general, liquidity risk is monitored at entity level whereby each subsidiary is responsible for managing and monitoring its cashflows and rolling liquidity reserve forecast in order to ensure that it has sufficient committed facilities to meet its liquidity needs.
The table below analysis the group’s financial liabilities into relevant maturity groupings based on the remaining period at the balance sheet to the contractual maturity date. The amounts disclosed in the table are the contractual undiscounted cashflows.
As of December 31, 2011 Carrying amount Expected cash flows (*) Less than 1 year Between 1 and 5 years More than 5 years
(in million of EGP)
Liabilities
Liabilities to banks 4,993 5,461 3,193 2,268 -
Bonds 1,437 1,772 333 1,439 -
Shareholders loans 17,561 21,815 - 21,815 -
Other borrowings 251 254 127 127 -
Telecommunication license payable 1,152 1,459 586 610 263
Trade payables 4,452 4,452 4,452 - -
29,846 35,213 8,691 26,259 263
As of December 31, 2010 Carrying amount Expected cash flows (*) Less than 1 year Between 1 and 5 years More than 5 years
(in million of EGP)
Liabilities
Liabilities to banks 19,608 21,934 5,956 15,935 43
Bonds 7,668 9,391 754 8,637 -
Other borrowings 73 77 54 23 -
Telecommunication license payable 431 779 88 350 341
Trade payables 4,711 4,711 4,711 - -
32,491 36,892 11,563 24,945 384
* Expected cash flows are the gross contractual undiscounted cash flows including interest, charges and other fees.
The table below analysis the group’s derivative financial instruments into relevant maturity groupings based on the remaining period at the balance sheet date to the contractual maturity date. The amounts disclosed in the table are the contractual undiscounted cash flows.
As of December 31, 2011 Expected cash flows (*) Less than 1 year Between 1 and 5 years
(in million of EGP)
Cash outflow / (cash inflow)
Foreign exchange derivatives 471 29 442
Total 471 29 442

Orascom Telecom Holdings Annual Report 2011Orascom Telecom Holdings Annual Report 2011 121120
Secondary geographical segments
(in million of EGP) North Africa Middle East South Asia Other Unallocated*Discontinuing
Operations Total
2011
2010
Gross revenues 11,057 1,080 10,726 562 - (1,728) 21,697
11,828 4,558 8,941 1,446 - (5,927) 20,846
Intersegment revenues - (60) (18) (5) - - (83)
(3) (740) (15) - - 2 (756)
Net revenues 11,057 221 9,779 557 - - 21,614
11,825 3,818 8,926 1,446 - (5,925) 20,090
Operating income 4,348 51 1,231 248 186 (595) 5,469
4,394 728 941 (322) (441) (1,706) 3,594
Profit before Tax 4,305 72 2 (1,291) (1,580) (565) 943
4,247 613 (17) (379) (2,854) (1,592) 18
Profit/(Loss) for the year 1,854 (18) (316) (838) (1,187) 4,686 4,181
1,012 1,213 (71) (616) (2,813) 2,400 1,125
Total segment assets 20,113 269 19,170 (1,130) 9,390 - 47,812
19,934 3,432 19,040 2,696 8,803 - 53,905
Total capital expenditures 238 448 4,298 161 9 - 5,154
817 1,033 2,220 400 42 - 4,512
6- Assets and liabilities classified as held for sale and discontinued operations
The following provides a breakdown of discontinued operations for the years indicated:
(in million of EGP) 2011 2010
Spin off assets OTT Spin off assets OTT
Revenues 1,766 - 3,961 1,981
Expenses (1,176) - (3,331) (1,241)
Share of (Loss) profit form associates (16) - 231 -
Profit before tax from discontinued operations 574 - 861 740
Income Tax (26) - (170) (385)
Profit from discontinued operations 548 - 691 355
Gain from ceasing joint control - - 1,697 -
Gain from sale of OTT - 5,661 - -
Income tax on Profit from discontinued operations - (1,523) (343) -
Profit from discontinued operations 548 4,138 2,045 355
Notes to the consolidated financial statements for the year ended December 31, 2011
The following primary business segments have been identified:
• GSM covering the mobile telecommunications services activities of the Group, including the sale of pre-paid telephone cards, post-paid and monthly subscriptions packages, telephone packages and roaming included in this segment are ;
• Telecom services relating to the sale of handsets, including ring tones and other cell phone products and activities relating to the rental of portals to allow satellite roaming calls and value added service activities; and
• Internet and fixed line covering the internet and fixed telecommunications services of the Group.
The Group also reports geographical segments based on the geographical location of the legal entity controlling the operation, which is the same as the location of the major customers.
The following geographical segments have been identified:
• North Africa – comprising Algeria and Tunisia
• Middle East – comprising Egypt
• South Asia – comprising Pakistan and Bangladesh
• Others – comprising, North Korea, Central Africa, Burundi, Malta, Belgium, the United Kingdom and other countries
Primary business segments
(in million of EGP) GSM Telecom ServicesInternet & Fixed Line Unallocated*
Discontinued Operations Total
2011
2010
Gross revenues 22,657 663 105 - (1,728) 21,697
24,565 1,669 539 - (5,927) 20,846
Intersegment revenues (16) (65) (2) - - (83)
(5) (699) (54) - 2 (756)
Net revenues 22,641 598 103 - (1,728) 21,614
24,560 970 485 - (5,925) 20,090
Impairment of non -current assets (60) (3) (6) - 9 (60)
(538) (144) (8) (2) 150 (542)
Depreciation and amortization (4,571) (39) (67) (40) 123 (4,594)
(5,226) (28) (10) (21) 905 (4,380)
Operating income 4,682 (52) 106 138 595 5,469
5,745 (238) 234 (441) (1,706) 3,594
Profit before Tax 1,893 (21) 118 (1,612) 565 943
4,507 (278) 235 (2,854) (1,592) 18
Profit/(Loss) for the year 603 249 (12) (1,345) 4,686 4,181
1,639 (287) 186 (2,813) 2,400 1,125
Total segment assets 34,671 269 591 12,281 - 47,812
41,440 2,675 988 8,802 - 53,905
Total capital expenditures ** 4,632 455 54 13 - 5,154
3,826 600 44 42 - 4,512
Total segment liabilities 16,098 184 536 19,474 - 36,292
18,696 945 367 21,190 - 41,198
* Unallocated represents revenues and costs relating to activities provided centrally from headquarters to subsidiaries across the group. These activities include staff functions with group wide responsibilities such as internal audit, financial advisory, legal services, communications and investor relations. Unallocated assets and liabilities mainly include borrowings of the Company and deferred tax assets and liabilities.
** Segment capital expenditures is the total cost incurred during the period to acquire property and equipment and intangible assets other than goodwill.

Orascom Telecom Holdings Annual Report 2011Orascom Telecom Holdings Annual Report 2011 123122
7- Revenues
(in million of EGP) 2011 2010
Revenues from services
Telephony services 18,774 16,887
Interconnection traffic 2,303 2,055
International and national roaming 109 108
Other services 156 128
Total revenues from services 21,342 19,178
Total revenues from sale of goods 272 912
Total 21,614 20,090
8- Purchases and services
(in million of EGP) 2011 2010
Raw, ancillary and consumable materials and goods 74 63
Mobile Finish Good Purchases 602 1,129
Changes in inventory 15 14
Purchase of materials & merchandise for re-sale 3 13
Interconnection traffic 2,002 1,905
Customer acquisition costs 1,209 1,069
National and international roaming 54 61
Advertising and promotional services 549 486
Rental of civil and techinal sites 442 397
Rental of local network 216 199
Other leases and rentals 247 248
Maintenance costs 949 923
Utilities 814 762
Consulting and professional services 193 220
Bank and post office charges 2 1
Other service expenses 574 472
Telephony cost 1,585 1,483
Purchases and services 9,530 9,445
Notes to the consolidated financial statements for the year ended December 31, 2011
The following provides a breakdown of assets and liabilities held for sale:
(in million of EGP) 2011 2010
Property and equipment - 988
Intangible assets - 795
Deferred tax assets - 39
Other non-current financial assets - 40
Trade receivables - 267
Other current assets - 51
Cash and cash equivalents - 251
Assets held for sale - 2,431
Current and non-current borrowings - 245
Trade payables - 285
Other current liabilities - 432
Current income tax liabilities - 54
Deferred tax liabilities - 107
Liabilities held for sale - 1,123
As of December 31, 2011, there are no assets and liabilities held for sale, the following is the description of the assets and liabilities held for sale as of December 31, 2010 and discontinued operations for the years ended December 2011 and 2010:-
1. In 22, November 2010, the Company announced that it had entered into a share purchase agreement with Qatar Telecom Q.S.C., pursuant to which the Company would sell its entire shareholding in Orascom Tunisia Holdings and Carthage Consortium, the two companies through which the Company owns 50% of OTT for a total cash consideration of US$ 1.2 billion. The transaction was completed on January 2, 2011. In accordance with Egyptian accounting standard No. 32 the assets and liabilities held for sale and discontinued operations have been shown in specific captions in the consolidated balance sheet and the income statement effect has been shown as discontinued operation as this group represents a separate major line of business as the disposal of OTT represents a disposal of an important part of operating activities.
2.Spin Off Assets
As described in Note 37, during November and December 2011, the Company transferred its shareholdings in the Spin-Off assets to OTMT as a result of the Demerger. The results of operations relating to the Spin-Off assets have been classified as discontinued operations in 2011 and 2010.
The spin-off assets include the group’s investment in ECMS:
During 2010 France Telecom and the Company entered into a new and comprehensive agreement regarding Mobinil and ECMS which brought to an end all disputes in relation to their joint investment in Mobinil and ECMS. A revised shareholders’ agreement was implemented and became effective on July 14, 2010, as a result of which France Telecom will change its accounting method and will fully consolidate Mobinil in its consolidated financial statements. As a result of the amended shareholders agreement, the Company ceases to have joint control over ECMS, which becomes an associate. In accordance with EAS, the Company’s shares of ECMS results of operations are no longer proportionally consolidated but, from July 14, 2010 are consolidated using the equity method. On the date that ECMS became an associate. As ECMS is considered a single cash generating unit clearly distinguished for financial reporting, the income statement of ECMS until July 14, 2010 has been reclassified and shown as discontinued operations. The comparative income statement information for 2010 has also been reclassified to discontinued operations.
In consideration for the settlement of all disputes between the parties France Telecom paid a settlement fee of US$ 300 million (equivalent to EGP 1,717 million) on July 13, 2010. The Company also entered into a put option whereby the Company has the option to put its 34.6% interest in ECMS to France Telecom.
(i) During the period from September 15 to November 15, 2012.
(ii) During the period from September 15 through November 15, 2013.
(iii) Anytime until November 15, 2013 in a limited number of deadlock situations.
The strike price of the put option increases over time from EGP 221.7 as of June 30, 2010 to EGP 248.5 as of December 31, 2013. The Euro exchange rate that will be used to exercise the option is agreed to be 7.53 EGP / 1 Euro. As of 31 December 2010 The Company assumed the put option had zero value since the sell is not considered probable being the underlying asset a strategic investment.

Orascom Telecom Holdings Annual Report 2011Orascom Telecom Holdings Annual Report 2011 125124
11- Depreciation and amortization
(in million of EGP) 2011 2010
Depreciation of property and equipment:
-Cell Sites 3,665 3,521
-Commercial and industrial equipment 10 10
-Buildings 72 85
- Other 187 190
Amortization of intangible assets
-Licenses 636 554
-Other 24 20
Total 4,594 4,380
12- Impairment charges
Impairment charges amounting to EGP 60 million in 2011 mainly relate to the impairment of property and equipment and intangible assets held by Bangladesh amounting to EGP 57 million and the rest comes from PMCL amounting to EGP 3 million.
Impairment charges amounting to EGP 542 million in 2010 increased mainly relate to the impairment of TelecelGlobe Namibia for an amount of EGP 526 million due to uncertainty regarding future operations.
13- Gain (Loss) on disposal of non-current assets
The gain on the disposal of non-current assets amounting to EGP 345 million in 2011 including the gain recognized from disposal of PCOM (Namibia).
Notes to the consolidated financial statements for the year ended December 31, 2011
9- Other expenses
(in million of EGP) 2011 2010
Write-down of current receivables and liquid assets 103 106
Provisions 103 196
Annual contributions for licenses 183 163
Promotion and gifts 487 509
Other operating expenses 164 130
Total 1,040 1,104
10- Personnel costs
(in million of EGP) 2011 2010
Wages and salaries 949 861
Social security 50 42
Pension costs 108 29
Other personnel costs 340 256
Total 1,447 1,188
Personnel costs include Board of Directors remuneration of EGP 6 million in 2011 and in 2010 and share based compensation costs of EGP 18 million in both years.
The table below provides a breakdown of the number of employees (2010 employees’ numbers have been restated for the spin-off entities):
number of employees (in thousands) 2011 2010
Senior management 183 222
Middle management 1,107 902
Staff 11,689 11,754
Total 12,979 12,878
The table below provides a breakdown of the average number of employees (2010 employees number have been restated for the spin-off entities)
Average for the year ended December 31,
number of employees (in thousands) 2011 2010
Senior management 203 209
Middle management 1,005 900
Staff 11,722 11,576
Total 12,930 11,685

Orascom Telecom Holdings Annual Report 2011Orascom Telecom Holdings Annual Report 2011 127126
The following table provides selected financial information of the Group’s associates as of December 31.
(in million of EGP) 2011 2010
Current assets 548 407
Non-current assets 5,324 5,004
Current liabilities 1,263 576
Non-current liabilities 8,846 7,016
Operation revenue 1,225 778
Net loss (2,210) (1,370)
% shareholding 65.4% 65.4%
proportional share of net loss (1,445) (896)
Amortization of identifiable assets (23) (21)
Elimination of intercompanies transactions 664 114
(804) (803)
16- Impairment of financial assets
Impairment of financial assets in 2011 relates to settlement loss on the receivable from OTMT.
31 December 2011
(in million of EGP)
The balance related to the period from Oct, 1,2010 till Sept, 30,2011 339
The movement related to the period from Oct,1,2011 till Dec, 31, 2011 55
Trading receivable from Spin off assets 48
Other balances (10)
The gross of the due balance from Orascom Telecom Media & Technology 432
Net due balance from Orascom Telecom Media & Technology (after adjustment) (302)
130
During 2010 the credit agreements with Globalive were re-negotiated and the interest rate was reduced from Libor plus 18% to Libor plus 10.8%, to reflect market conditions. As a result of the renegotiation the outstanding receivable due from Globalive was re-measured at fair value. Following this re-measurement an impairment of EGP 102 million was recorded to reflect the fair value adjustment.
17- Income tax expense
(in million of EGP) 2011 2010
Current income tax expense 2,209 981
Deferred taxes (761) 312
Income tax expense 1,448 1,293
Notes to the consolidated financial statements for the year ended December 31, 2011
14- Net financing costs
(in million of EGP) 2011 2010
Dividends - 4
Interest Income - Deposits 87 84
Other Interest Income 389 215
Financial income 476 303
Interest Exp. - Banks (494) (866)
Interest Exp. - Suppliers (3) (21)
Interest on shareholders loan (868) -
Interest Cost - Bonds (553) (615)
Other financial expenses (19) (139)
Impairment loss of available for sale investments (42) -
Arrangement fee amortization - Banks (394) (287)
Arrangement fee amortization - Bonds (224) (117)
Loss from IR derivatives val. FVH (473) (379)
Discounting of provision (72) -
Fair value losses from derivatives no hedging (32) (133)
Financial expense (3,174) (2,557)
Foreign exchange (loss) (847) (374)
Fair value changes of FX derivative instruments (47) (43)
Net foreign exchange (loss) (894) (417)
Net financing cost (3,592) (2,671)
Financial income increased in 2011 mainly due to increased balance of bank deposits in OTA.
Interest expense on bank borrowings mainly represented in the debit interest and amortization of the arrangement costs on the syndication loan for an amount of US$ 2.5 billion, according to the refinancing plan dated May 16, 2011, the company has incurred some financing costs represented in the unamortized portion of the arrangement fees, settlement of a hedge liability and early settlement of some interest expenses (Note 37).
15- Share of loss of associates
Share of loss of associates includes the investment in Globalive Canada Investment Holdings Corp. and Globalive Canada Holdings Corp. (collectively “Globalive”). The Group holds a 65.4% investment in Globalive which comprises a combination of voting and non-voting rights. Considering direct and indirect interests, the Group holds 65.4% of the outstanding shares and directly holds 33.2% of the voting rights. The Group has significant influence over this investment and does not have control over the financial and operating policies of Globalive. Therefore the investment is equity accounted.

Orascom Telecom Holdings Annual Report 2011Orascom Telecom Holdings Annual Report 2011 129128
(in million of EGP)Land and Buildings Cell Sites
Computers, fixtures and other equipment
Assets Under Construction Total
Cost
As of January 1, 2010 942 36,934 1,916 4,578 44,370
Additions 98 1,248 242 2,719 4,307
Change in the scope of consolidation (356) (7,408) (656) (343) (8,763)
Assets held for sale (58) (1,695) (111) (183) (2,047)
Disposals (12) (200) (41) (28) (281)
Currency translation differences 20 1,019 32 146 1,217
Reclassifications 6 2,096 20 (2,122) -
As of December 31, 2010 640 31,994 1,402 4,767 38,803
Accumulated Depreciation and Impairment
As of January 1, 2010 380 15,101 1,182 181 16,844
Charge for the year 97 4,173 261 - 4,531
Change in the scope of consolidation (74) (3,535) (393) - (4,002)
Assets held for sale (21) (966) (72) - (1,059)
Disposals (8) (167) (36) (1) (212)
Impairment loss 3 310 6 31 350
Currency translation differences 10 575 31 25 641
As of December 31, 2010 387 15,491 979 236 17,093
Net book value as of December 31, 2010 253 16,503 423 4,531 21,710
Net book value as of December 31, 2009 562 21,833 734 4,397 27,526
Additions to property and equipment in 2011 mainly relate to cell site investments and assets under construction relating to new base stations, predominantly in GSM companies in Pakistan, Bangladesh and Algeria. Those investments are mainly due to the expansion of the business, increased capacity and the change in GSM technology.
Depreciation charged during the year ended December 31, 2011 includes EGP 97 million relating to the discontinued operations (See Note 6 for further details).
Change in the scope of consolidation in 2011 relates to the property and equipment of the Spin-Off Assets and Powercom.
Impairment losses in 2011 relate to the impairment of plant and equipment in Bangladesh. Impairment losses in 2010 relate to the full impairment of property and equipment of Powercom due to its financial conditions.
Property and equipment pledged as security for bank borrowings amount to EGP 6.6 billion as of December 31, 2011 and primarily relate to securities for borrowings of PMCL.
19- Intangible assets
(in million of EGP) Licenses Goodwill Others Total
Cost
As of January 1, 2011 6,587 5,874 1,581 14,042
Additions 1,929 - 30 1,959
Change in the scope of consolidation (601) (295) (58) (954)
Reclassifications - - (43) (43)
Currency translation differences (80) 119 7 46
As of December 31, 2011 7,835 5,698 1,517 15,050
Notes to the consolidated financial statements for the year ended December 31, 2011
Current income tax receivables and liabilities in the consolidated balance sheet are as follows:
(in million of EGP) 2011 2010
Current income tax assets 598 486
Current and non current income tax liabilities (2,028) (857)
The tax on the Group’s profit before tax differs from the theoretical amount that would arise using the weighted average tax rate applicable to profits of the consolidated entities as follows:
(in million of EGP) 2011 2010
Profit before income tax 943 18
Tax calculated at Company’s income tax rate 234 4
Tax calculated at subsidiaries income tax rate (703) 453
Theoretical income tax for the year (469) 457
Permanent differences 1,195 126
Unrecognized deferred tax for tax losses 479 355
Reversal of unused deferred tax assets 135 192
Minimum tax expenses 87 62
Adjustments in respect of prior years 22 88
Other tax differences (1) 13
Income tax for the year 1,448 1,293
18- Property and equipment
(in million of EGP) Land and Buildings Cell SitesComputers, fixtures and
other equipmentAssets Under Construction Total
Cost
As of January 1, 2011 640 31,994 1,402 4,767 38,803
Additions 34 432 159 2,900 3,525
Change in the scope of consolidation (48) (1,315) (97) (2,305) (3,765)
Disposals (34) (98) (41) (197) (370)
Currency translation differences 5 (699) (25) (5) (724)
Reclassifications - 2,188 38 (2,358) (132)
As of December 31, 2011 597 32,502 1,436 2,802 37,337
Accumulated Depreciation and Impairment
As of January 1, 2011 387 15,491 979 236 17,093
Charge for the year 73 3,753 207 (7) 4,026
Change in the scope of consolidation (17) (662) (70) (22) (771)
Disposals (27) (30) (27) - (84)
Impairment loss - 56 - 10 66
Currency translation differences (3) (300) (20) (5) (328)
Reclassifications (3) (27) - (2) (32)
As of December 31, 2011 410 18,281 1,069 210 19,970
Net book value as of December 31, 2011 187 14,221 367 2,592 17,367
Net book value as of December 31, 2010 253 16,503 423 4,531 21,710

Orascom Telecom Holdings Annual Report 2011Orascom Telecom Holdings Annual Report 2011 131130
Impairment tests for goodwill
Goodwill is allocated to the individual Cash Generating Unit (CGU) which reflects the minimum level at which the units are monitored for management control purposes.
The carrying amount as of December 31, 2011 was subject to an impairment test to compare the carrying amount with value in use and the recoverable amount. During 2011 no impairments were identified. In 2010, the goodwill of Algeria Win Call Eurl, allocated within the Algeria segment, was impaired prior to performing this test.
Additionally the goodwill of Powercom, allocated within the Central and South Africa segment, was fully impaired due to uncertainties regarding the future operations of this entity. Value in use was determined by discounting the expected cash flows, resulting from business plans approved by the respective Board of Directors, using the post-tax weighted average cost of capital (WACC) as the discount rate.
The following table provides an analysis of goodwill by segment:
2011
Algeria Pakistan Bangladesh Central and South Africa and other Total
GSM 2,925 1,600 102 401 5,028
Telecom Services - - - 6 6
2,925 1,600 102 407 5,034
2010
Algeria Pakistan Bangladesh Central and South Africa and other Total
GSM 2,925 1,542 66 388 4,921
Telecom Services - 5 - 6 11
Internet & Fixed Line - - - 32 32
2,925 1,547 66 426 4,964
20-Other financial assets
2011 2010
(in million of EGP) Non-current Current Total Non-current Current Total
Financial receivables 5,835 312 6,147 5,179 18 5,197
Derivative financial instruments 342 24 366 417 62 479
Deposits 8 962 970 367 19 386
Financial assets held for trading - 25 25 - 120 120
Financial assets available for sale 14 61 75 65 47 112
6,199 1,384 7,583 6,028 266 6,294
Notes to the consolidated financial statements for the year ended December 31, 2011
Accumulated Amortization
As of January 1, 2011 3,512 910 1,035 5,457
Amortization for the year 661 3 23 687
Change in the scope of consolidation (168) (258) (51) (477)
Reclassifications (1) 3 - 2
Currency translation differences 24 6 3 33
As of December 31, 2011 4,028 664 1,010 5,702
Net book value as of December 31, 2011 3,807 5,034 507 9,348
Net book value as of December 31, 2010 3,075 4,964 546 8,585
(in million of EGP) Licenses Goodwill Others Total
Cost
As of January 1, 2010 10,175 6,948 1,575 18,698
Additions 170 - 35 205
Change in the scope of consolidation (2,261) (970) - (3,231)
Reclassification to assets held for sale (1,550) (175) (19) (1,744)
Disposals (182) - (3) (185)
Currency translation differences 235 71 (7) 299
As of December 31, 2010 6,587 5,874 1,581 14,042
Amortization and impairment losses
As of January 1, 2010 4,571 883 982 6,436
Amortization 728 - 21 749
Change in the scope of consolidation (876) (174) - (1,050)
Reclassification to assets held for sale (948) (1) - (949)
Disposals (181) - - (181)
Impairment Loss 76 238 28 342
Currency translation differences 142 (36) 4 110
As of December 31, 2010 3,512 910 1,035 5,457
Net book value as of December 31, 2010 3,075 4,964 546 8,585
Net book value as of December 31, 2009 5,604 6,065 593 12,262
Additions to intangible assets in 2011 primarily relate to GSM license renewal in Bangladesh and Algeria.
Intangible assets were pledged as security for bank borrowings amounted to EGP 6.6 billion primarily relate to securities for borrowings of PMCL.
Amortization charged during the year ended December 31, 2011 includes EGP 22 million relating to the discontinued operations (See note 6 for further details).
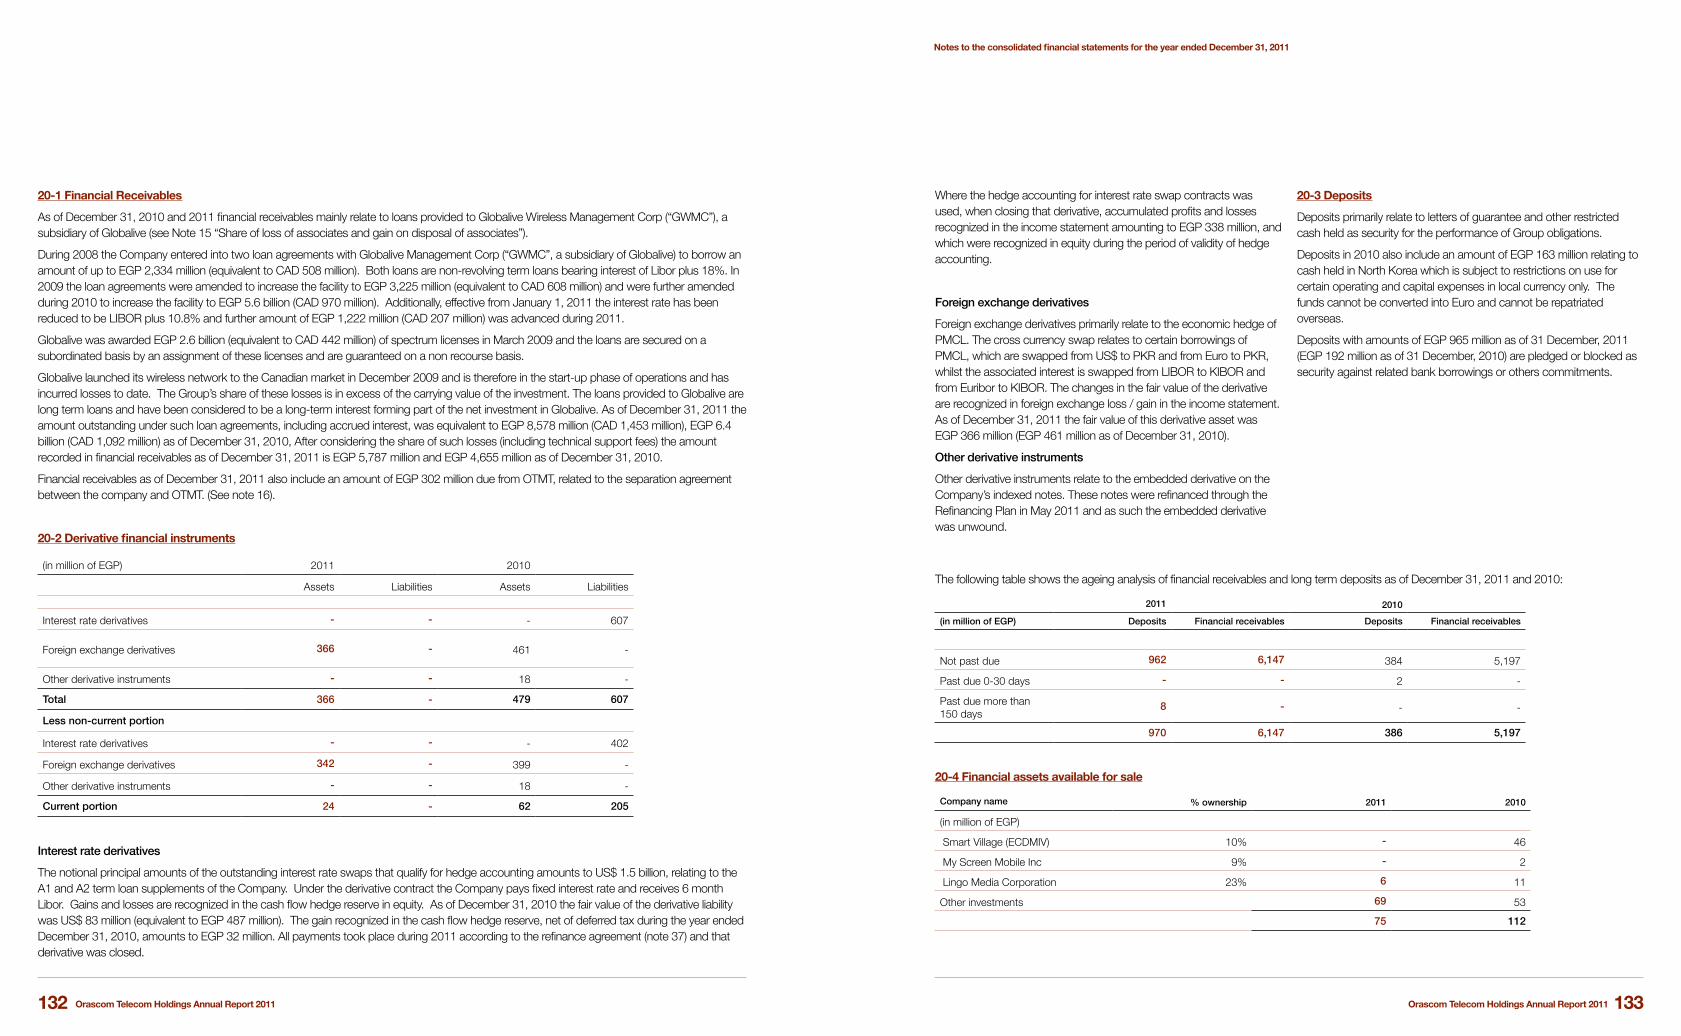
Orascom Telecom Holdings Annual Report 2011Orascom Telecom Holdings Annual Report 2011 133132
Where the hedge accounting for interest rate swap contracts was used, when closing that derivative, accumulated profits and losses recognized in the income statement amounting to EGP 338 million, and which were recognized in equity during the period of validity of hedge accounting.
Foreign exchange derivatives
Foreign exchange derivatives primarily relate to the economic hedge of PMCL. The cross currency swap relates to certain borrowings of PMCL, which are swapped from US$ to PKR and from Euro to PKR, whilst the associated interest is swapped from LIBOR to KIBOR and from Euribor to KIBOR. The changes in the fair value of the derivative are recognized in foreign exchange loss / gain in the income statement. As of December 31, 2011 the fair value of this derivative asset was EGP 366 million (EGP 461 million as of December 31, 2010).
Other derivative instruments
Other derivative instruments relate to the embedded derivative on the Company’s indexed notes. These notes were refinanced through the Refinancing Plan in May 2011 and as such the embedded derivative was unwound.
20-3 Deposits
Deposits primarily relate to letters of guarantee and other restricted cash held as security for the performance of Group obligations.
Deposits in 2010 also include an amount of EGP 163 million relating to cash held in North Korea which is subject to restrictions on use for certain operating and capital expenses in local currency only. The funds cannot be converted into Euro and cannot be repatriated overseas.
Deposits with amounts of EGP 965 million as of 31 December, 2011 (EGP 192 million as of 31 December, 2010) are pledged or blocked as security against related bank borrowings or others commitments.
The following table shows the ageing analysis of financial receivables and long term deposits as of December 31, 2011 and 2010:
2011 2010
(in million of EGP) Deposits Financial receivables Deposits Financial receivables
Not past due 962 6,147 384 5,197
Past due 0-30 days - - 2 -
Past due more than 150 days
8 - - -
970 6,147 386 5,197
20-4 Financial assets available for sale
Company name % ownership 2011 2010
(in million of EGP)
Smart Village (ECDMIV) 10% - 46
My Screen Mobile Inc 9% - 2
Lingo Media Corporation 23% 6 11
Other investments 69 53
75 112
Notes to the consolidated financial statements for the year ended December 31, 2011
20-1 Financial Receivables
As of December 31, 2010 and 2011 financial receivables mainly relate to loans provided to Globalive Wireless Management Corp (“GWMC”), a subsidiary of Globalive (see Note 15 “Share of loss of associates and gain on disposal of associates”).
During 2008 the Company entered into two loan agreements with Globalive Management Corp (“GWMC”, a subsidiary of Globalive) to borrow an amount of up to EGP 2,334 million (equivalent to CAD 508 million). Both loans are non-revolving term loans bearing interest of Libor plus 18%. In 2009 the loan agreements were amended to increase the facility to EGP 3,225 million (equivalent to CAD 608 million) and were further amended during 2010 to increase the facility to EGP 5.6 billion (CAD 970 million). Additionally, effective from January 1, 2011 the interest rate has been reduced to be LIBOR plus 10.8% and further amount of EGP 1,222 million (CAD 207 million) was advanced during 2011.
Globalive was awarded EGP 2.6 billion (equivalent to CAD 442 million) of spectrum licenses in March 2009 and the loans are secured on a subordinated basis by an assignment of these licenses and are guaranteed on a non recourse basis.
Globalive launched its wireless network to the Canadian market in December 2009 and is therefore in the start-up phase of operations and has incurred losses to date. The Group’s share of these losses is in excess of the carrying value of the investment. The loans provided to Globalive are long term loans and have been considered to be a long-term interest forming part of the net investment in Globalive. As of December 31, 2011 the amount outstanding under such loan agreements, including accrued interest, was equivalent to EGP 8,578 million (CAD 1,453 million), EGP 6.4 billion (CAD 1,092 million) as of December 31, 2010, After considering the share of such losses (including technical support fees) the amount recorded in financial receivables as of December 31, 2011 is EGP 5,787 million and EGP 4,655 million as of December 31, 2010.
Financial receivables as of December 31, 2011 also include an amount of EGP 302 million due from OTMT, related to the separation agreement between the company and OTMT. (See note 16).
20-2 Derivative financial instruments
(in million of EGP) 2011 2010
Assets Liabilities Assets Liabilities
Interest rate derivatives - - - 607
Foreign exchange derivatives 366 - 461 -
Other derivative instruments - - 18 -
Total 366 - 479 607
Less non-current portion
Interest rate derivatives - - - 402
Foreign exchange derivatives 342 - 399 -
Other derivative instruments - - 18 -
Current portion 24 - 62 205
Interest rate derivatives
The notional principal amounts of the outstanding interest rate swaps that qualify for hedge accounting amounts to US$ 1.5 billion, relating to the A1 and A2 term loan supplements of the Company. Under the derivative contract the Company pays fixed interest rate and receives 6 month Libor. Gains and losses are recognized in the cash flow hedge reserve in equity. As of December 31, 2010 the fair value of the derivative liability was US$ 83 million (equivalent to EGP 487 million). The gain recognized in the cash flow hedge reserve, net of deferred tax during the year ended December 31, 2010, amounts to EGP 32 million. All payments took place during 2011 according to the refinance agreement (note 37) and that derivative was closed.

Orascom Telecom Holdings Annual Report 2011Orascom Telecom Holdings Annual Report 2011 135134
The movement of deferred tax assets and liabilities during the year, without taking into consideration any offsetting is provided in the tables below:
Deferred tax assets Tax lossesAccrued revenue
Depreciation and mortization
Impairment of assets Fair value Other Total
(in million of EGP)
As of January 1, 2011 1,069 269 40 28 90 20 1,516
Charged / (credited) to the income statement
(160) 28 (10) - 64 21 (57)
Charged directly to equity - - - - (92) - (92)
Change in scope of consolidation - - - - - (27) (27)
Exchange differences (4) 6 - - - (14) (12)
As of December 31, 2011 905 303 30 28 62 - 1,328
Deferred tax liabilities Depreciation and amortization Unremitted earnings Fair value Other Total
(in million of EGP)
As of January 1, 2011 1,421 612 122 30 2,185
Charged / (credited) to the income statement
(179) (617) (16) (6) (818)
Exchange differences - 4 (1) (1) 2
Change in scope of consolidation (3) - - - (3)
As of December 31, 2011 1,239 (1) 105 23 1,366
The following table provides a breakdown by estimated recoverability of recognized deferred tax assets and liabilities:
Deferred tax liabilities Deferred tax assets
(in million of EGP) 2011 2010 2011 2010
within 1 year 7 293 45 57
within 1 - 5 years 1,087 1,693 1,096 1,421
after 5 years 272 468 187 -
Total 1,366 2,454 1,328 1,478
22- Trade receivable
(in million of EGP) 2011 2010
Receivables due from customers 1,312 992
Receivables due from telephone operators 526 523
Receivables due from authorized dealers 31 55
Other trade receivables 64 561
Allowance for doubtful receivables (696) (628)
Total 1,237 1,503
Notes to the consolidated financial statements for the year ended December 31, 2011
My Screen Mobile Inc
In May 2008, the Company concluded a “Restricted Stock Purchase Agreement” with My Screen Mobile Inc, an entity specializing in the delivery of advertising to mobile phones, to acquire 12.5 million shares which represent approximately 9% of the total share capital and existing voting rights. Additionally, the Company purchased share warrants to acquire up to 20 million shares at an exercise price of US$ 2 per share. The warrants can be exercised from the date of the agreement until May 23, 2012. The total purchase price of the shares and warrants was US$ 10 million. Upon exercise of the warrants, the Company would hold approximately 20% of the existing and potential voting rights. Based on an assessment of the potential ownership percentage and other contractual rights, management does not consider that it has significant influence over the company. As of December 31, 2011 the carrying value of the investment is Zero.
Lingo Media Corporation
In August 2008, the Company entered into a subscription agreement to acquire 2,857,143 common shares of Lingo Media Corporation, a media entity focusing on online advertising. The investment represents approximately 23% of the total share capital and existing voting rights. The Company also purchased share warrants to acquire up to 2,142,857 shares of this entity. The warrants can be exercised from the date of the agreement for a period of two years, at an increasing price from US$4 up to US$8. The total purchase price of the shares and warrants was US$ 5 million. The management does not consider that it has significant influence over the company as the company has only 34% of the voting power. Therefore, the investment has been recorded as a financial asset available for sale and measured at fair value. As of December 31, 2011, the fair value of the investment amounted to EGP 6 million. The warrants expired, unexercised, during 2010.
Smart Village
The investment in Smart Village was disposed as part of the Demerger.
Other Investments
Other investments mainly relate to government treasury bills and investment bonds purchased from PMCL.
21- Deferred taxes
Deferred income tax assets and liabilities are offset when there is a legally enforceable right to offset current tax assets and liabilities and when the deferred income tax assets and liabilities relate to income taxes due to the same tax authority.
The following table provides a reconciliation of deferred tax assets and liabilities of the Group to the amounts included in the face of the balance sheet.
(in million of EGP) 2011 2010
Deferred tax liabilities, gross 1,366 2,185
Deferred tax assets offset (937) (1,099)
Deferred tax liabilities 429 1,086
Deferred tax assets, gross 1,328 1,516
Deferred tax liabilities offset (937) (1,099)
Deferred tax assets 391 417
The movement in the deferred income tax account is as follows:
2011 2010
(in million of EGP)
As of January 1, 669 537
Exchange differences 15 31
Change in scope 23 (322)
Held for sale - (68)
Income statement charge (761) 489
Tax charged directly to equity 92 2
As of December 31, 38 669
Deferred tax assets on tax losses carry forwards mainly refer to income tax loss carry forwards of the Group’s subsidiaries in Pakistan with no expiry date.
No deferred tax assets were recognized on income tax loss carryforwards for some foreign subsidiaries, mainly Orascom Telecom Bangladesh Limited (“OTB”) and CAT, as it is currently not probable that taxable profit will be available in the near future against which such tax loss carryforwards might be utilized.
Generally the Group does not recognize deferred tax assets for temporary differences related to accruals for provisions, due to uncertainties in connection with the tax treatment of such expenses, as they might be challenged by local tax authorities.
No liability has been recognized in respect of temporary differences associated with investments in subsidiaries, branches and associates and interests in joint ventures, where the Group is in a position to control the timing of the reversal of the temporary differences and it is probable that such differences will not reverse in the foreseeable future.

Orascom Telecom Holdings Annual Report 2011Orascom Telecom Holdings Annual Report 2011 137136
The following table shows the movement in the allowance for other current assets:
(in million of EGP) 2011 2010
At January 1 192 272
Exchange differences 6 7
Additions (allowances recognized as an expense) 22 9
Reclassifications (17) (90)
Used - (6)
At December 31, 203 192
24- Cash and cash equivalents
(in million of EGP) 2011 2010
Bank accounts and Deposits 6,107 4,767
Cash on hand 5 17
Total 6,112 4,784
Cash and cash equivalents at December 31, 2011 includes EGP 5.4 billion (EGP 2 billion as of December 31, 2010) held in subsidiaries which have regulatory restrictions, contractual restrictions or operate in countries where exchange controls and other legal restrictions apply and are therefore not available for general use by the Company.
25- Owners Equity
25-1 Share Capital
Authorized and issued share capital
As of December 31, 2010 the issued and paid up share capital amounted to L.E. 5,245 million, comprising 5,245,690,620 shares of a nominal value of L.E. 1 per share.
The shareholders voted an increase in OTH’s authorized share capital from L.E. 7.5 billions to L.E. 14.0 billion during the April 14, 2011 general meeting, with the issued and paid-in capital remaining unchanged. Any future issuances relating to the portion of the Company’s authorized share capital being increased pursuant to this resolution will only be undertaken in order to repay debt, will offer customary preemptive rights to all shareholders, and will be issued at fair market value rather than par value.
As previously explained, the Demerger was implemented by effectively partitioning the Company into two separate companies, OTH and OTMT, in accordance with the demerger guidelines of the Egyptian Financial Supervisory Authority as per decree no. 124 of the year 2010 and the related tax laws. The Demerger resulted in the reduction of the issued capital of the Company via a decrease in the nominal value per share. As a result, the aggregate nominal value of shares issued by OTH as of December 31, 2011 is L.E. 3,043 million divided into 5,245,690,620 shares each having a par value of L.E. 0.58 (see note 37).
25-2 Dividends
No dividends were distributed during 2010 or 2011.
Notes to the consolidated financial statements for the year ended December 31, 2011
The following table shows the movement in the allowance for doubtful receivables
2011 2010
(in million of EGP)
At January 1 628 464
Exchange differences (25) 34
Additions (allowances recognized as an expense) 83 155
Change in scope of consolidation 6 (47)
Reclassification of assets held for sale - (24)
Use (15) (25)
Reversal - (19)
Reclassifications 19 90
At December 31, 696 628
The following table shows the ageing analysis of trade receivables as of December 31, 2011 and 2010, net of the relevant provision for doubtful receivables:
2011 2010
(in million of EGP)
Not past due 260 590
Past due 0-30 days 530 542
Past due 31-120 days 86 173
Past due 121 - 150 days 182 83
Past due more than 150 days 179 115
Trade receivables 1,237 1,503
The maximum exposure to credit risk at the reporting date is the carrying value of the receivable. The Group does not hold any collateral as security.
23- Other current assets2011 2010
(in million of EGP)
Prepaid expenses 408 473
Advances to suppliers 39 118
Receivables due from tax authority 4,336 4,345
Other receivables 398 507
Allowance for doubtful current assets (203) (192)
Total 4,978 5,251

Orascom Telecom Holdings Annual Report 2011Orascom Telecom Holdings Annual Report 2011 139138
The decrease in bonds relates to the refinancing of the Equity Linked Notes and the OTF High Yield Notes through the Refinancing Plan.
The remaining Bonds as of December 31, 2011 relate to Pakistan Mobile Communications Limited and Orascom Telecom Bangladesh Limited.
Derivatives
For further details of the derivative liabilities see Note 20 “Other financial assets”. The interest rate derivatives were unwound as part of the Refinancing Plan and therefore there were no derivative liabilities as of December 31, 2011.
Other Borrowings
Other borrowings mainly include promissory notes, as well as loans granted by other shareholders in the group companies.
The following is the statement of borrowing in different currencies and derivatives for dealing with currency risk.
Currency Information of Borrowings
(in million of EGP) US$ EuroEgyptian
PoundPakistan
RupeeBangladeshi
TakaAlgerian
Dinar Others Total
As of December 31, 2011
Total borrowings by currency of issue 19,858 393 164 2,410 1,338 13 66 24,242
Notional amount of currency derivatives (866) (393) - 1,259 - - - -
Borrowings after derivative effect 18,992 - 164 3,669 1,338 13 66 24,242
of which (after derivative effect):
floating rate borrowings 1,430 - - 3,669 1,335 13 - 6,447
fixed rate borrowings 17,562 - 164 - 3 - 66 17,795
As of December 31, 2010
Total borrowings by currency of issue 22,609 939 32 2,924 1,093 7 351 27,955
Notional amount of currency derivatives (935) (924) - 1,859 - - - -
Borrowings after derivative effect 21,674 15 32 4,783 1,093 7 351 27,955
of which (after derivative effect):
floating rate borrowings 5,325 15 1 4,783 1,083 7 - 11,214
fixed rate borrowings 16,349 - 31 - 10 - 351 16,741
Financial liabilities include secured liabilities of EGP 4.5 Billion as of December 31, 2011 and EGP 22 Billion as of December 31, 2010. In general, the financial liabilities are secured on property and equipment of the relevant subsidiary, pledged shares and receivables.
Notes to the consolidated financial statements for the year ended December 31, 2011
26- Borrowings
(in million of EGP) within one year 1-2 years 2-3 years 3-4 years 4-5 years after 5 years Total
As of December 31, 2011
As of December 31, 2010
Liabilities to banks 2,989 1,192 474 179 159 - 4,993
4,840 5,109 9,107 447 64 41 19,608
Bonds 183 134 1,120 - - - 1,437
346 182 6,435 705 - - 7,668
Derivative instruments - - - - - - -
402 183 21 - - - 606
Shareholders loan - - - 1,462 16,099 - 17,561
- - - - - - -
Other borrowings 97 129 25 - - - 251
52 2 19 - - - 73
Total as of December 31, 2011 3,269 1,455 1,619 1,641 16,258 - 24,242
Total as of December 31, 2010 5,640 5,476 15,582 1,152 64 41 27,955
Refinancing Plan
Certain of the Company’s financial liabilities included mandatory repayment clauses in the event of a change in control and therefore became repayable as a result of the VimpelCom Transaction. In addition, other borrowings were secured by, among others, the Spin-Off Assets. As a result of the foregoing, the following debt obligations were refinanced:
• Senior secured facility with OTH as the borrower and a syndicate of international and Egyptian banks as the lenders, with a maximum principal amount of US$ 2,500 million, under an agreement dated February 27, 2006, as amended, with Deutsche Bank A.G., London Branch, as security agent (the “Senior Facility”);
• Floating rate secured equity linked notes due 2013 issued by Orascom Telecom Oscar S.A., in the original principal amount of approximately US$ 230,013 million, under a trust indenture dated December 5, 2008, with Natixis Corporate Solutions Limited as trustee, and guaranteed by OTH, as amended (the “Equity Linked Notes”);
• Series of senior notes due 2014 in the original aggregate principal amount of US$ 750 million, issued by Orascom Telecom Finance S.C.A., under a Trust Indenture dated February 8, 2007, with The Bank of New York as trustee, and guaranteed by OTH, as amended (the “OTF High Yield Notes”); and
• Derivative contracts to hedge interest rate risk under the Senior Facility, issued by OTH (the “Hedging Transactions”).
As a result of the foregoing the amounts outstanding under the Senior Facility, the Equity Linked Notes, the OTH High Yield Notes and the Hedging Transactions have been refinanced by the shareholders loans from VimpelCom, which as of December 31, 2011 amounted to EGP 17,561 (US$ 2,912 million).
Liabilities to banks
Appendix A includes a detailed analysis of liabilities to banks as of December 31, 2011.
The decrease in borrowings is mainly attributable to the normal scheduled repayments of borrowing facilities, in accordance with the refinance agreements.
Bonds
Appendix B includes a detailed analysis of Bonds as of December 31, 2011.

Orascom Telecom Holdings Annual Report 2011Orascom Telecom Holdings Annual Report 2011 141140
(in million of EGP) 2011 2010
(Loss) attributable to equity holders of the Company continuing operations (505) (1,275)
Profit from discontinued operations attributable to equity holders of the Company 4,686 2,400
4,181 1,125
Weighted average number of shares (in millions of shares) 5231 5074
Earnings per share – basic (in EGP) 0.80 0.22
31- Interest in joint ventures
As of December 31, 2011 the Group had joint control in the following joint ventures.
Joint venture Shareholding Country of domiciliation
Consortium Algerian Telecommunication S.P.A. 50% Algeria
International Consortium Telecommunication Limited company 50% United Kingdom
Consortium Algerian Telecommunication S.P.A. (CAT)
CAT was formerly a landline operator in Algeria which ceased operations during the period. The current intention of the management of CAT is to liquidate this company. Therefore the Group has fully written down all assets relating to this business.
32- Commitments
The commitments as of December 31, 2011 and 2010 are provided in the table below:
(in million of EGP) 2011 2010
Intangible assets - 136
Tangible assets 541 428
Total 541 564
Commitments for purchase of property and equipment mainly relate to the purchase of tools related to PMCL and Bangladesh capital commitments.
The following table provides the future aggregate minimum lease payments under non-cancellable operating leases:
2011 2010
Within one year 21 83
Between 1-5 years 405 81
After 5 years 492 417
918 581
33- Share based compensation
The Company introduced in 2003 an Executive Share Option Plan (ESOP) and since then the Company used treasury shares bought from the market to cover the plan. The Board of Directors of the Company has appointed a Committee that can grant GDR options or GDRs to employees of the Company and its subsidiaries through Orascom Telecom ESOP Limited., Malta, a wholly owned subsidiary. Awards under the ESOP were generally reserved for employees at a senior management level and above that have spent at least one full year of services in the Company and that have a satisfactory performance according to their appraisal reports.
Notes to the consolidated financial statements for the year ended December 31, 2011
27- Other current liabilities
2011 2010
Current Non-current Total Current Non-current Total
(in million of EGP)
Telecommunication license payable 498 654 1,152 81 431 512
*Prepaid Traffic and deferred income 834 - 834 1,095 - 1,095
Due to local authorities 1,046 - 1,046 1,677 - 1,677
Personnel payables 357 - 357 395 16 411
Other liabilities 786 237 1,023 1,069 200 1,269
Total 3,521 891 4,412 4,317 647 4,964
The increase in telecommunication license payable is mainly related to the renewal of the license of Orascom Telecom Bangladesh. The license was renewed in September 2011 for a further 15 years and in accordance with the agreement the fee of Taka 19.8 billion is payable over three years.
28- Trade payables
2011 2010
(in million of EGP)
Fixed assets payables 2,389 2,209
Trade payables due to suppliers 849 880
Trade payables to telephone operators 450 564
Other trade payables 764 1,058
Total 4,452 4,711
Trade payables are all due within one year.
29- Provisions
The provisions as of December 31, 2011 represents the provisions that have been made in Orascom Telecom Holding amounted to EGP 148 million to meet expected claims and EGP 272 million in Banglalink to meet the value added tax claims and EGP 82 million in Ring group to meet expected claims and the end of service benefits for some employees . While the long term provisions represents mainly the removal of asset allocations in Pakistan and Bangladesh.
30- Earnings per share
Basic earnings per share is calculated by dividing the profit attributable to equity holders of the Company by the weighted average number of ordinary shares outstanding during the year, excluding ordinary shares purchased by the Company and held as treasury shares or for the purposes of the share based compensation.
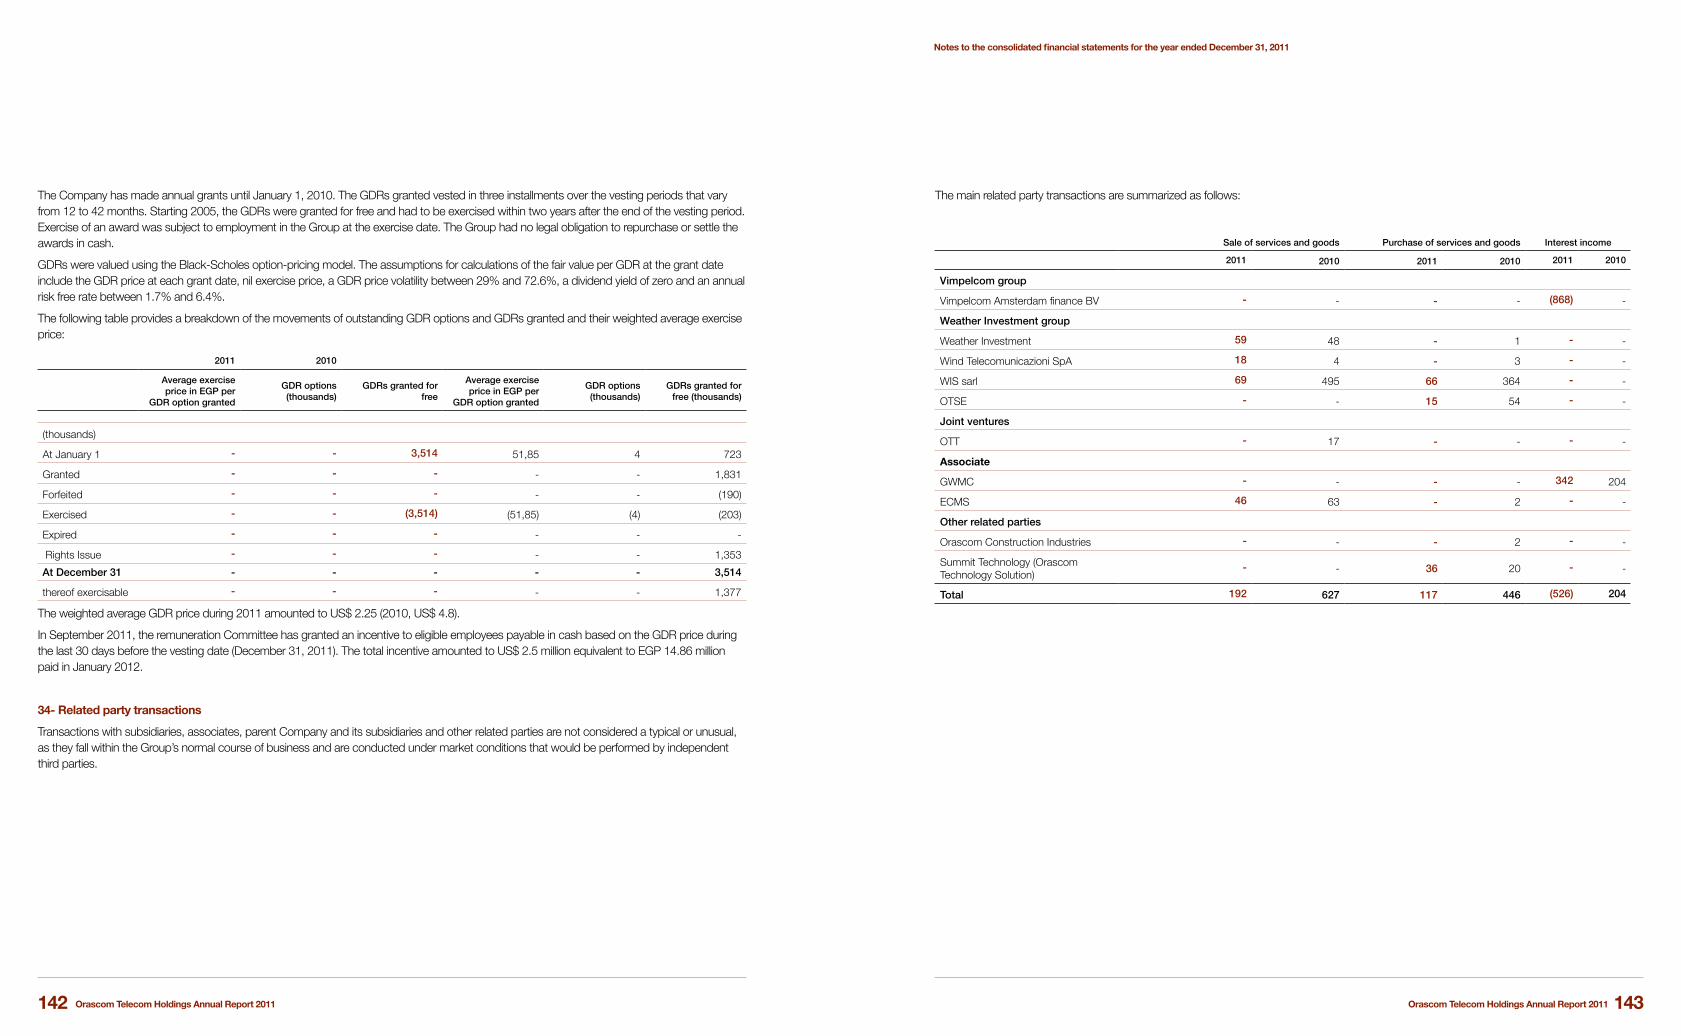
Orascom Telecom Holdings Annual Report 2011Orascom Telecom Holdings Annual Report 2011 143142
The main related party transactions are summarized as follows:
Sale of services and goods Purchase of services and goods Interest income
2011 2010 2011 2010 2011 2010
Vimpelcom group
Vimpelcom Amsterdam finance BV - - - - (868) -
Weather Investment group
Weather Investment 59 48 - 1 - -
Wind Telecomunicazioni SpA 18 4 - 3 - -
WIS sarl 69 495 66 364 - -
OTSE - - 15 54 - -
Joint ventures
OTT - 17 - - - -
Associate
GWMC - - - - 342 204
ECMS 46 63 - 2 - -
Other related parties
Orascom Construction Industries - - - 2 - -
Summit Technology (Orascom Technology Solution)
- - 36 20 - -
Total 192 627 117 446 (526) 204
Notes to the consolidated financial statements for the year ended December 31, 2011
The Company has made annual grants until January 1, 2010. The GDRs granted vested in three installments over the vesting periods that vary from 12 to 42 months. Starting 2005, the GDRs were granted for free and had to be exercised within two years after the end of the vesting period. Exercise of an award was subject to employment in the Group at the exercise date. The Group had no legal obligation to repurchase or settle the awards in cash.
GDRs were valued using the Black-Scholes option-pricing model. The assumptions for calculations of the fair value per GDR at the grant date include the GDR price at each grant date, nil exercise price, a GDR price volatility between 29% and 72.6%, a dividend yield of zero and an annual risk free rate between 1.7% and 6.4%.
The following table provides a breakdown of the movements of outstanding GDR options and GDRs granted and their weighted average exercise price:
2011 2010
Average exercise price in EGP per
GDR option granted
GDR options (thousands)
GDRs granted for free
Average exercise price in EGP per
GDR option granted
GDR options (thousands)
GDRs granted for free (thousands)
(thousands)
At January 1 - - 3,514 51,85 4 723
Granted - - - - - 1,831
Forfeited - - - - - (190)
Exercised - - (3,514) (51,85) (4) (203)
Expired - - - - - -
Rights Issue - - - - - 1,353
At December 31 - - - - - 3,514
thereof exercisable - - - - - 1,377
The weighted average GDR price during 2011 amounted to US$ 2.25 (2010, US$ 4.8).
In September 2011, the remuneration Committee has granted an incentive to eligible employees payable in cash based on the GDR price during the last 30 days before the vesting date (December 31, 2011). The total incentive amounted to US$ 2.5 million equivalent to EGP 14.86 million paid in January 2012.
34- Related party transactions
Transactions with subsidiaries, associates, parent Company and its subsidiaries and other related parties are not considered a typical or unusual, as they fall within the Group’s normal course of business and are conducted under market conditions that would be performed by independent third parties.
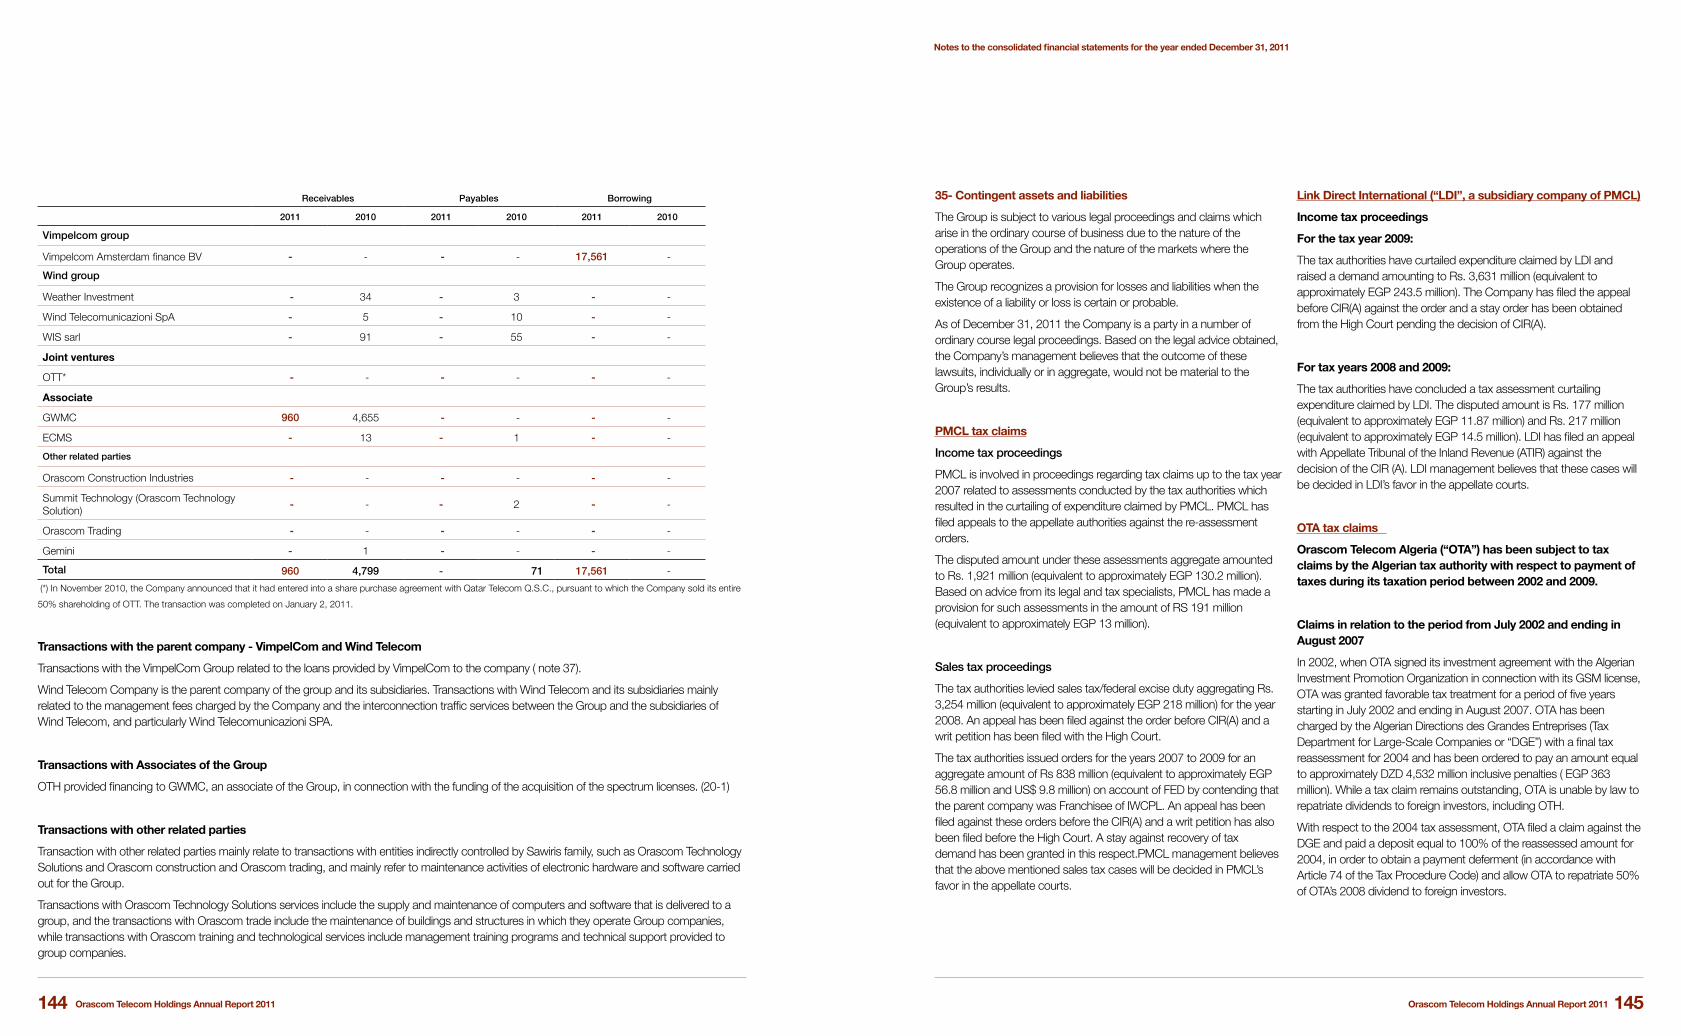
Orascom Telecom Holdings Annual Report 2011Orascom Telecom Holdings Annual Report 2011 145144
35- Contingent assets and liabilities
The Group is subject to various legal proceedings and claims which arise in the ordinary course of business due to the nature of the operations of the Group and the nature of the markets where the Group operates.
The Group recognizes a provision for losses and liabilities when the existence of a liability or loss is certain or probable.
As of December 31, 2011 the Company is a party in a number of ordinary course legal proceedings. Based on the legal advice obtained, the Company’s management believes that the outcome of these lawsuits, individually or in aggregate, would not be material to the Group’s results.
PMCL tax claims
Income tax proceedings
PMCL is involved in proceedings regarding tax claims up to the tax year 2007 related to assessments conducted by the tax authorities which resulted in the curtailing of expenditure claimed by PMCL. PMCL has filed appeals to the appellate authorities against the re-assessment orders.
The disputed amount under these assessments aggregate amounted to Rs. 1,921 million (equivalent to approximately EGP 130.2 million). Based on advice from its legal and tax specialists, PMCL has made a provision for such assessments in the amount of RS 191 million (equivalent to approximately EGP 13 million).
Sales tax proceedings
The tax authorities levied sales tax/federal excise duty aggregating Rs. 3,254 million (equivalent to approximately EGP 218 million) for the year 2008. An appeal has been filed against the order before CIR(A) and a writ petition has been filed with the High Court.
The tax authorities issued orders for the years 2007 to 2009 for an aggregate amount of Rs 838 million (equivalent to approximately EGP 56.8 million and US$ 9.8 million) on account of FED by contending that the parent company was Franchisee of IWCPL. An appeal has been filed against these orders before the CIR(A) and a writ petition has also been filed before the High Court. A stay against recovery of tax demand has been granted in this respect.PMCL management believes that the above mentioned sales tax cases will be decided in PMCL’s favor in the appellate courts.
Link Direct International (“LDI”, a subsidiary company of PMCL)
Income tax proceedings
For the tax year 2009:
The tax authorities have curtailed expenditure claimed by LDI and raised a demand amounting to Rs. 3,631 million (equivalent to approximately EGP 243.5 million). The Company has filed the appeal before CIR(A) against the order and a stay order has been obtained from the High Court pending the decision of CIR(A).
For tax years 2008 and 2009:
The tax authorities have concluded a tax assessment curtailing expenditure claimed by LDI. The disputed amount is Rs. 177 million (equivalent to approximately EGP 11.87 million) and Rs. 217 million (equivalent to approximately EGP 14.5 million). LDI has filed an appeal with Appellate Tribunal of the Inland Revenue (ATIR) against the decision of the CIR (A). LDI management believes that these cases will be decided in LDI’s favor in the appellate courts.
OTA tax claims
Orascom Telecom Algeria (“OTA”) has been subject to tax claims by the Algerian tax authority with respect to payment of taxes during its taxation period between 2002 and 2009.
Claims in relation to the period from July 2002 and ending in August 2007
In 2002, when OTA signed its investment agreement with the Algerian Investment Promotion Organization in connection with its GSM license, OTA was granted favorable tax treatment for a period of five years starting in July 2002 and ending in August 2007. OTA has been charged by the Algerian Directions des Grandes Entreprises (Tax Department for Large-Scale Companies or “DGE”) with a final tax reassessment for 2004 and has been ordered to pay an amount equal to approximately DZD 4,532 million inclusive penalties ( EGP 363 million). While a tax claim remains outstanding, OTA is unable by law to repatriate dividends to foreign investors, including OTH.
With respect to the 2004 tax assessment, OTA filed a claim against the DGE and paid a deposit equal to 100% of the reassessed amount for 2004, in order to obtain a payment deferment (in accordance with Article 74 of the Tax Procedure Code) and allow OTA to repatriate 50% of OTA’s 2008 dividend to foreign investors.
Notes to the consolidated financial statements for the year ended December 31, 2011
Receivables Payables Borrowing
2011 2010 2011 2010 2011 2010
Vimpelcom group
Vimpelcom Amsterdam finance BV - - - - 17,561 -
Wind group
Weather Investment - 34 - 3 - -
Wind Telecomunicazioni SpA - 5 - 10 - -
WIS sarl - 91 - 55 - -
Joint ventures
OTT* - - - - - -
Associate
GWMC 960 4,655 - - - -
ECMS - 13 - 1 - -
Other related parties
Orascom Construction Industries - - - - - -
Summit Technology (Orascom Technology Solution)
- - - 2 - -
Orascom Trading - - - - - -
Gemini - 1 - - - -
Total 960 4,799 - 71 17,561 -
(*) In November 2010, the Company announced that it had entered into a share purchase agreement with Qatar Telecom Q.S.C., pursuant to which the Company sold its entire
50% shareholding of OTT. The transaction was completed on January 2, 2011.
Transactions with the parent company - VimpelCom and Wind Telecom
Transactions with the VimpelCom Group related to the loans provided by VimpelCom to the company ( note 37).
Wind Telecom Company is the parent company of the group and its subsidiaries. Transactions with Wind Telecom and its subsidiaries mainly related to the management fees charged by the Company and the interconnection traffic services between the Group and the subsidiaries of Wind Telecom, and particularly Wind Telecomunicazioni SPA.
Transactions with Associates of the Group
OTH provided financing to GWMC, an associate of the Group, in connection with the funding of the acquisition of the spectrum licenses. (20-1)
Transactions with other related parties
Transaction with other related parties mainly relate to transactions with entities indirectly controlled by Sawiris family, such as Orascom Technology Solutions and Orascom construction and Orascom trading, and mainly refer to maintenance activities of electronic hardware and software carried out for the Group.
Transactions with Orascom Technology Solutions services include the supply and maintenance of computers and software that is delivered to a group, and the transactions with Orascom trade include the maintenance of buildings and structures in which they operate Group companies, while transactions with Orascom training and technological services include management training programs and technical support provided to group companies.

Orascom Telecom Holdings Annual Report 2011Orascom Telecom Holdings Annual Report 2011 147146
by the Algerian authorities alleging breaches of foreign exchange regulations.OTA maintains that OTA and its senior executives have acted in compliance with the law and OTA is taking the necessary steps to file an appeal. The lodging of the appeal will provisionally suspend the judgment. OTH legal counsel is of the opinion that this decision is not based on the application of Algerian law, and further, the decision of the court should be overturned on appeal. Since OTA and its senior executive have not committed any violation of foreign exchange legislation.
Pioneer Investment Ltd
The Jordanian tax dispute related to Fastlink Company
The Jordanian Tax Authority claims for JD 49.2 million, equivalent to EGP 418 million income tax against Pioneer Investment Co., Ltd. in connection with the sale of Fastlink (Jordan Mobile Telecommunication Services) in 2002 to MTC by Pioneer Investment Ltd a wholly owned subsidiary of OTH.
The court has issued a final ruling against the Jordanian Pioneer Investment Co., Ltd. on May 19, 2011 confirming the assessment by the Jordanian Tax Authority. No further appeals are available to Pioneer Investment Ltd. Pioneer Investment Ltd has no business operations or assets in Jordan and is a limited liability company with shareholders liability limited to the capital of the company.
Orascom Telecom Iraq Disposal Warranties
Orascom Telecom Iraq upon the disposal of its investment in (Iraqna for Mobile Services-subsidiary) the company provided warranty to the purchaser of the investment. This warranty, which in respect of tax covenant claims, of which no more than US$ 60 million equivalent to EGP 362M shall be payable in relation to tax covenant claim.
Ring Algeria
During 2009 Ring received tax claims amounting to US$ 46 million equivalent to EGP 277M relating to the tax period 2005/2008 for its subsidiaries in Algeria.
Management has not made any provision as liquidation of this company is in process.
Telecel Globe Group
Telecel CAR
On August 2009, Telecom Minister sent a letter announcing the revaluation of Telecel CAR license, featuring a complement amount of one billion XAF (equivalent to US$ 2 million and EGP 11.8 million).
Telecel did not pay this amount and no provision has been booked.
One year later, by letters dated 22nd of July 2010, Telecel requested the offset- of the fore coming license complement amount - with receivables due by SOCATEL and the Government , 712 million XAF off the License complement of 1B XAF.
The request was repeated by Telecel on the 28th of July 2010 and accepted by Telecom Minister on the same day.
On the 26th of July 2010, the Government issued a pre contract called “memorandum” fixing the terms and conditions of the license revaluation.
According to the memorandum, the license complement has to be paid as per 400 Million XAF in cash and 712 Million XAF by compensation with Socatel and government debt, which virtually upgraded the amount of the License to XAF 1.012 billion instead of XAF 1billion.
The License amendment including those arrangements was finally agreed and issued on the 27th of September 2010.
Telecel Burundi
In January 2010, Telecel Burundi has received a primary assessment from the tax administration amounted to US$ 11 million (equivalent to EGP 66 million).
The company has appealed and made a provision amounted to US$ 7 million (equivalent to EGP 42 million).
In August 2010, a settlement between Telecel Burundi and the local taxes authority was signed on which Telecel Burundi agreed to pay US$ 3.1 million (equivalent to EGP 11.4 million) while the amount actually paid was US$ 1.9 million (equivalent to EGP 11.4 million) as of September 30, 2010, in order to resolve all outstanding issues for fiscal years 2008 and 2009.
LETTERS OF CREDIT AND GUARANTEE
The Group has provided guarantees and letters of credit in the ordinary course of business of the Group’s activities.
Guarantees include the following:
Guarantee provided by Orascom Telecom Bangladesh in favor of Ministry of Post & Telecommunication, the Chief Controller of Exports and Imports and Power development board existed of Taka 92 million equivalent to EGP 7.8 million.
Guarantee provided by Orascom Telecom Holding in favor of the Lebanon Ministry of Wired and Wireless Telecommunications to pay any dues amounted to $ 30 million equivalent to EGP 181million.
Notes to the consolidated financial statements for the year ended December 31, 2011
In November 2009, OTA received a further final tax reassessment for the years 2005 through 2007 from the DGE ordering it to pay an amount equal to approximately DZD 50,310 million, including penalties (equivalent to approximately EGP 4,028 million). The DGE has alleged that (i) OTA did not keep proper manual accounts during these years not withstanding that OTA’s accounts were fully audited and approved by both OTA’s international auditors and its local statutory auditors, which accounts for 78% of the tax claim, and (ii) OTA failed to deduct certain expenses such as management and bad debt expenses and therefore understated the taxable income.
In Algeria the tax authorities are able to raise additional tax assessments for four years after the end of the relevant tax period. However, once a preliminary tax claim is received by a company the four year statute of limitation is no longer valid. OTA has received the final tax assessment for the years 2004, 2005, 2006 and 2007. OTA filed a tax claim objection (tax appeal) on the 2004 as well as 2005, 2006 and 2007 final tax assessments at DGE.
On March 7, 2010 OTA received a rejection on its submitted administrative appeal filed on December 27, 2009 against the notice of reassessment dated 16 November 2009 received from the DGE in respect of the tax years 2005, 2006 and 2007. OTA’s administrative appeal in relation to the 2004 tax reassessment has also been rejected. On April 4, 2010, OTA filed appeals before the Algerian Administrative Court (“Tribunal Administratif”) against 2004-2007 tax assessments.
Tax claims in relation to the 2008 and 2009 tax years
On September 30, 2010, OTH announced that OTA has received a preliminary tax notification from the DGE in respect of the years 2008 and 2009, in which said department has re-assessed taxes alleged to be owed by OTA in the amount of approximately DZD 17,064 million (approximately EGP 1,366 million), despite the fact that OTA has already paid the taxes due for these years.
The tax audit for these years was initiated in early 2010 following the tax filing for 2009. This reassessment was based primarily on the unfounded allegation that OTA did not keep proper accounts for the years 2008 and 2009 notwithstanding that OTA’s accounts were fully audited.
OTA received a final tax notification from the DGE in respect of the years 2008 and 2009 in December 2010 which was appealed in January 2011 before DGE. On April 10, 2011, OTA received the rejection of its appeal before the DGE.
On August 17, 2011, OTA decided to exercise the option of filing an appeal of the 2008-2009 tax claim before the Commission de Recourse before bringing the matter before the Court.
Without prejudice to their rights under the Investment Agreement,
applicable bilateral investment treaty and applicable laws, OTA have paid all claimed amounts and penalties totaling DZD 71,906 million (approximately EGP 5,757 million) as at December, 2011 under protest.
Management views the amounts paid to the DGE as uncertain tax positions and have accounted for them using a two step approach in accordance with EAS (24). In recording the receivable management have considered the technical merits of the assessments, including input in the form of a technical report prepared by an independent external expert, and management believe that the tax assessments are unjustified.
Under the Investment Agreement as well as the applicable bilateral treaty management have the option to pursue this matter under international arbitration. Although there are significant risks involved in this case, management expects that amounts paid will ultimately be recoverable. Accordingly, the Company has made an appropriate provision to reflect the possibility of not recovering the full amount.
Other contingent liabilities
A. SIM Card Users
In 2010, the Algerian government issued a new finance law, where in case of failure to identify the SIM card user, a penalty amounting to DZD 100 thousand (equivalent to EGP 8 thousands) for each unidentified SIM is paid for the first year and increase to DZD 150 thousand (equivalent to EGP 12 thousand ) for the second year. OTA is currently working on a special project to identify all users. Although the exposure cannot currently be estimated, it is not expected to have a material impact on the financial statements.
B. Central Bank of Algeria Case
Orascom Telecom Algeria filed a petition against the Central Bank of Algeria’s injunction restraining all Algerian banks from making any transfers abroad in foreign currency to OTA’s suppliers, and putting on hold any custom clearance of imported goods. On June 13, 2010, this petition was rejected by the Algerian Civil Court for lack of Jurisdiction. OTA also filed a new petition before the Algerian administrative court (State Council) on June 24, 2010. During September 2010, the Central Bank of Algeria verbally presented a complaint against OTA for not respecting the ban on foreign trade transaction. This complaint is under investigation by the Algerian Authority.
On March 28, 2012, the Algerian Court of first instance handed down a judgment against OTA, and a member of OTA’s senior executive team in connection with the so-called “Bank of Algeria” case. The judgment consists of the fines of DZD 99 billion (US$ 1.3 billion) including a criminal sentence against a member of OTA’s senior executive team. The judgment relates to a previously disclosed claim brought in 2010
Orascom Telecom Holdings Annual Report 2011Orascom Telecom Holdings Annual Report 2011 149148
Orascom Telecom, Media and Technology Holding S.A.E. that will be incorporated at the time of spin-off. Orascom Telecom, Media and Technology Holding will own some of the company’s assets that are not intended to be included in the group Vimpelcom - Wind Telecom, and those assets include Orascom’s share in ECMS S.A.E. (Egypt) and CheoTechnology Company (“Koryolink”) (North Korea) and Orascom Telecom Ventures S.A.E. (IN Touch previously) and some other investments in the areas of media and Technology including the origins of submarine cables.
Demerge and Spin off Assets
On October 23rd, 2011, Orascom Telecom Holding S.A.E. shareholders approved all the items on the Extraordinary General Assembly Meeting. Shareholder’s approved the following significant resolutions among others:
• The Assembly resolved to ratify the adjustments in the company’s plan of the detailed split of assets as detailed in the revised proforma financial statements which was ratifies by the Extraordinary General Assembly Meeting dated 14 April 2011 according to the report prepared by GAFI in relation to the evaluation of the company into two holding companies whereby the company will survive as Orascom Telecom Holding S.A.E (the old Demerged Company”) and reduce its issued capital through the decrease of the par value of its shares while as a result of the split a new holding company named “OrascomTelecom Media and Technology Holding S.A.E” will be formed (the “New Demerged Company”) on the basis of the book value according to the financial statements of 30/9/2010 in accordance with the amendments introduced by the report prepared by Gafi in relation to the evaluation of the company.
• The issued capital of the company will be EGP 3,042,500,560 divided into 5,245,690,620 shares having a nominal value of EGP 0.58 and allocating the balance ( amounting to EGP 2,573,499,440) to the remaining shareholders’ equity referred to in the GAFI report (EGP 5,616 million) and as presented into the meeting.
• The assembly resolved to authorize the chairman of the company to undertake all necessary actions, including but not limited to, to execute sale and purchase agreements in relation to such shares and all necessary procedure to execute the sale and to execute guarantees on behalf of the company to modify the internal owner structure of certain assets of the New Demerged Company set out under the plan of the detailed split of assets as ratified by the Extraordinary General Assembly Meeting dated 14 April 2011.
• To adopt 30/09/2010 as the reference date for the demerger and 21/11/2011 as the suggested execution date of the demerger
• To amend articles 6 and 7 of the articles of incorporation of the company to reflect the amendment of the authorized capital of the company to be EGP fourteen billion and its issued capital to be EGP 3,042,500,560 divided into 5,245,690,620 shares of nominal value of EGP 0.58 each. The reduction of the issue capital shall take place through the decrease of the par value of the shares of the Company against the insurance of the shares in the New Demerged Company free from any payment, representing the reduction in the issued capital of the company.
In particular, as a result of the Demerger, during November and December 2011, ownership of the following Spin-Off Assets was transferred from the Company to OTMT:
• 28.755% ownership stake in Mobinil for Telecommunications S.A.E.
• 20.00% ownership stake in the Egyptian Company for Mobile Services
• 75% ownership stake in CHEO Technology Joint Venture Company, together with all other assets and businesses located in North Korea
• 95% ownership in Orabank NK
• 100% direct and indirectly held ownership stake in Middle East and North Africa for Sea Cables
• 51% ownership stake in Trans World Associate (Private) Limited (Pakistan)
• 100% ownership of Med Cable Limited (UK)
• 99.99% ownership stake in Intouch Communications Services S.A.E. (a/k/a OT Ventures Internet portals and other ventures in Egypt including Link Development, ARPU+ and LINKonLine) and
• 1% ownership stake in ARPU for Telecommunications Services S.A.E.
The Demerger was performed based on the book value of the Spin-Off Assets, taking into consideration the terms and conditions of a separation agreement in addition to this Orascom telecom holding must compensate OTMT with specific revenues related to spin-off assets.
A decrease in the total shareholders’ equity amounting to EGP 5,807 million including a decrease in capital amounting to EGP 2,203 million resulted from spin-off agreement.
Since spin-off agreement took place before balance sheet date so all results of operations relating to the Spin-Off Assets have been classified as discontinued operations in 2011.
Notes to the consolidated financial statements for the year ended December 31, 2011
36- VimpelCom Transaction
VimpelCom Ltd. (“VimpelCom”) and Wind Telecom S.p.A. (“Wind Telecom” formerly, Weather Investments S.p.A.) announced in October 2010 that they had signed an agreement to combine the two groups (the “Transaction”). At the closing of the Transaction, vimpelcom Ltd will own, through Wind Telecom, 51.7% of Orascom Telecom Holding S.A.E. (“Orascom Telecom”) and 100% of Wind Telecomunicazioni S.p.A. (“Wind Italy”). Under the terms of the Transaction, Wind Telecom’s shareholders will contribute to Vimpelcom their shares in Wind Telecom in exchange for a consideration consisting of 325,639,827 newly issued vimpelcom common shares, US$1.8 billion in cash and certain assets that will be demerged from Orascom Telecom and from Wind Italy. The Wind Telecom interests in these assets, which principally comprise Orascom Telecom’s investments in Egypt and North Korea, will be transferred to the current Wind Telecom shareholders. Wind Hellas Telecommunications S.A. in Greece is entirely excluded from the Transaction.
On March 17, 2011 it was announced that the majority of VimpelCom shareholders had voted in favour of the issuance of VimpelCom common shares and convertible preferred shares and the increase of VimpelCom’s authorized share capital needed to complete the combination. Following this favourable outcome, the management teams of VimpelCom and Wind Telecom will proceed in satisfying the conditions precedent for the completion of the Transaction, which is expected to take place in the first half of 2011.
On March 29, 2011 the Company announced that it has obtained the consent of the Egyptian Financial Supervisory Authority’s to convene its Ordinary General Meeting and Extraordinary General Meeting on April 14, 2011 to vote on certain resolutions related to the previously announced expected combination of Wind Telecom S.p.A. with VimpelCom Ltd. Subsequently and on Subsequently, on April 14, 2011 the Extraordinary general Assembly Meeting approved all the resolution that were voted in both the Ordinary General Meeting and Extraordinary General Meeting.
The resolutions are as follows:
Refinancing Plan
The approval of a refinancing plan to repay the Company’s outstanding secured and high yield debt together with certain derivative transactions for an amount of approximately US$ 2.7 billion.
The refinancing plan will be entered into as a related party transaction with VimpelCom (or one of its affiliates) following the closing of VimpelCom’s combination with Wind Telecom, and under which VimpelCom would provide the funding to refinance the Company’s secured and high-yield debt, together with certain derivative transactions. The combination of Wind Telecom and VimpelCom
triggers the refinancing of the senior secured credit facility and equity linked notes. In addition, the refinancing of the high yield notes will facilitate the execution of the demerger.
Demerger Plan
The approval of the planned demerger from OTH of Orascom Telecom Media and Technology Holding S.A.E. (“OTMT”) a company to be formed at the time of the demerger. OTMT will hold certain assets of OTH that are not intended to form part of the VimpelCom –Wind Telecom group going forward, including OTH’s interests in Egyptian Company for Mobile Services, CHEO Technology Joint Venture in North Korea, Orascom Telecom Ventures S.A.E. (formerly Intouch Communications Services S.A.E.) as well as other investments in the media and technology sectors, including undersea cable assets.
The split of OTH into two separate companies will be conducted by the way of a demerger of OTMT and will result in existing shareholders of OTH holding the same percentage interest in OTMT as they hold in OTH as of the record date of the demerger.
Following the effectiveness of the demerger and consummation of the VimpelCom-Wind Telecom transaction, Wind Telecom’s then owned 51.7% indirect stake in OTMT will be transferred to Weather Investments II Sàrl. (“Weather II”), the current main shareholder of Wind Telecom, as part of the consideration for the VimpelCom-Wind Telecom transaction.
Weather II has notified OTH that it intends to cause OTMT, following the completion of the demerger and the listing of OTMT shares on the Egyptian Stock Exchange, to launch a voluntary tender offer to buy back all of OTMT’s issued shares at fair market value (the “Buyback Tender Offer”). An independent financial advisor registered with EFSA will be appointed to give a view on the fairness of the valuation of the cash or other consideration offered to OTMT shareholders. Any Buyback Tender Offer will comply with all applicable legal requirements.
On April 14, 2011 Orascom Telecom Holding announced the approval of shareholders of the company to all decisions contained in the meeting agenda of the regular and extraordinary General Assembly meetings held on that date, of which the following decisions:
1 - To approve the refinancing plan to refinance the debts of the company’s existing secured debts and high-yielding as well as some derivatives contracts to reduce the risk of a total amount up to the equivalent of US$ 2.7 billion.
2 - Increasing the authorized capital of Orascom Telecom Holding to EGP 14 billion (with the retention of the issued and paid share capital as they are).
3 - To approve the plan of spin-off of the company that will result in
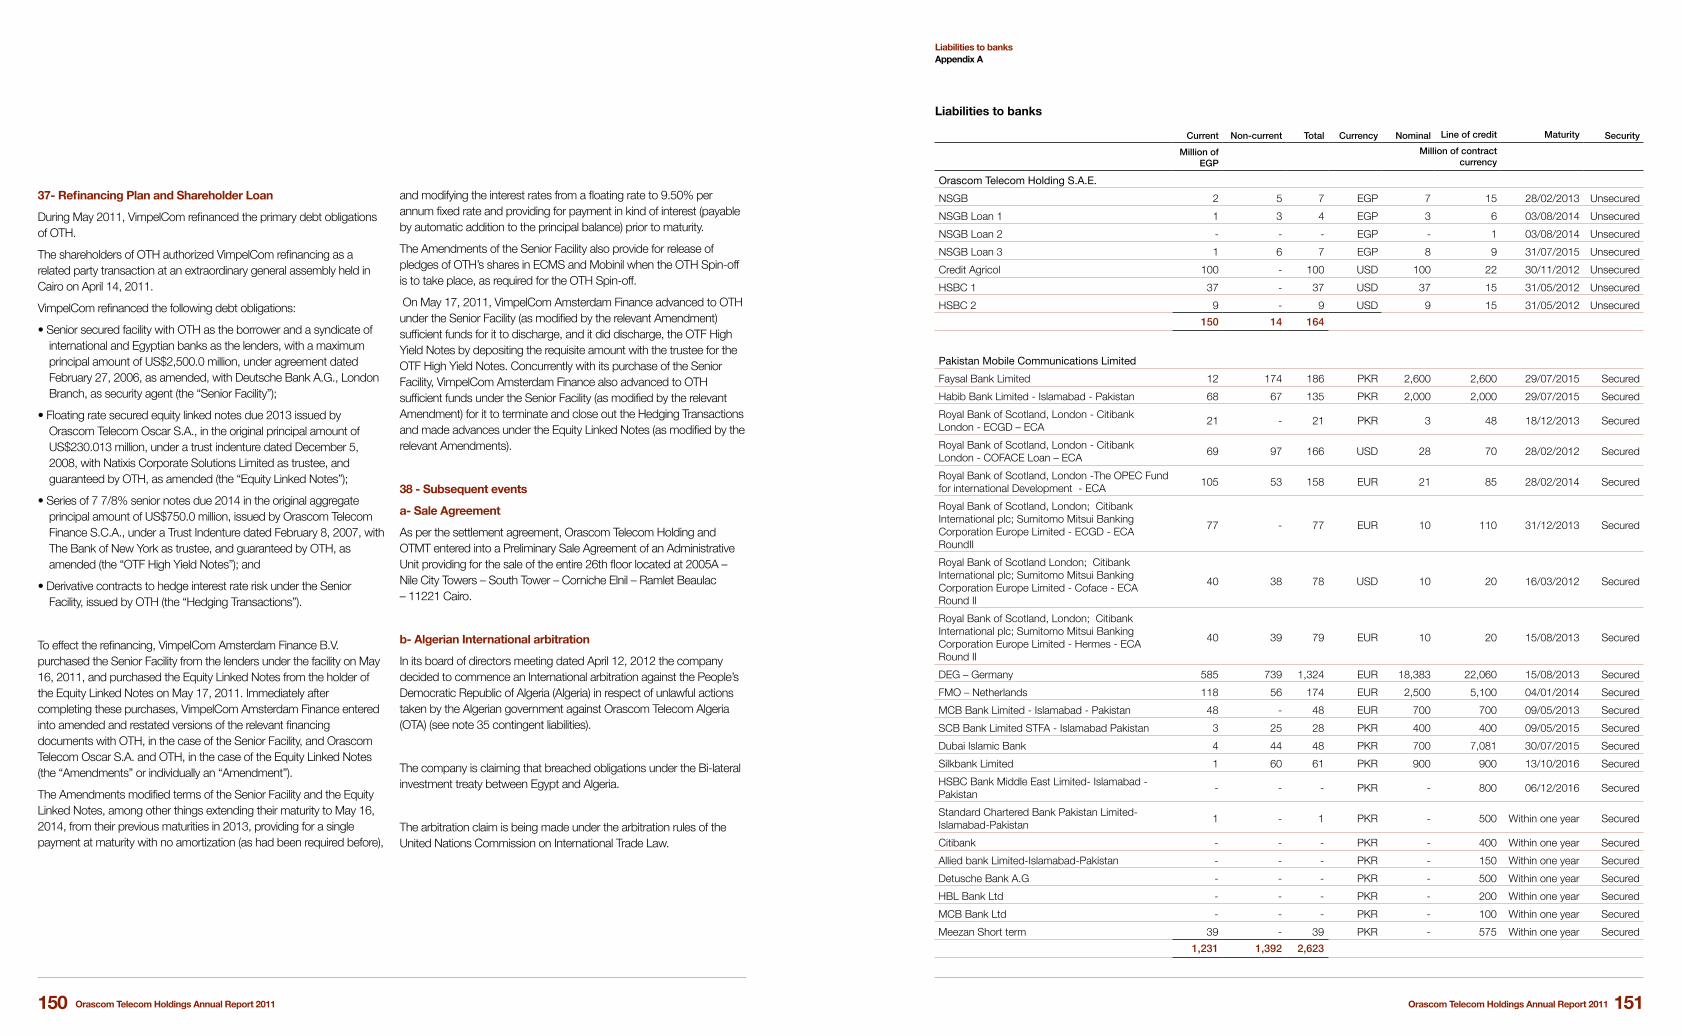
Orascom Telecom Holdings Annual Report 2011Orascom Telecom Holdings Annual Report 2011 151150
Liabilities to banks
Current Non-current Total Currency Nominal Line of credit Maturity Security
Million of EGP
Million of contract currency
Orascom Telecom Holding S.A.E.
NSGB 2 5 7 EGP 7 15 28/02/2013 Unsecured
NSGB Loan 1 1 3 4 EGP 3 6 03/08/2014 Unsecured
NSGB Loan 2 - - - EGP - 1 03/08/2014 Unsecured
NSGB Loan 3 1 6 7 EGP 8 9 31/07/2015 Unsecured
Credit Agricol 100 - 100 USD 100 22 30/11/2012 Unsecured
HSBC 1 37 - 37 USD 37 15 31/05/2012 Unsecured
HSBC 2 9 - 9 USD 9 15 31/05/2012 Unsecured
150 14 164
Pakistan Mobile Communications Limited
Faysal Bank Limited 12 174 186 PKR 2,600 2,600 29/07/2015 Secured
Habib Bank Limited - Islamabad - Pakistan 68 67 135 PKR 2,000 2,000 29/07/2015 Secured
Royal Bank of Scotland, London - Citibank London - ECGD – ECA
21 - 21 PKR 3 48 18/12/2013 Secured
Royal Bank of Scotland, London - Citibank London - COFACE Loan – ECA
69 97 166 USD 28 70 28/02/2012 Secured
Royal Bank of Scotland, London -The OPEC Fund for international Development - ECA
105 53 158 EUR 21 85 28/02/2014 Secured
Royal Bank of Scotland, London; Citibank International plc; Sumitomo Mitsui Banking Corporation Europe Limited - ECGD - ECA RoundII
77 - 77 EUR 10 110 31/12/2013 Secured
Royal Bank of Scotland London; Citibank International plc; Sumitomo Mitsui Banking Corporation Europe Limited - Coface - ECA Round II
40 38 78 USD 10 20 16/03/2012 Secured
Royal Bank of Scotland, London; Citibank International plc; Sumitomo Mitsui Banking Corporation Europe Limited - Hermes - ECA Round II
40 39 79 EUR 10 20 15/08/2013 Secured
DEG – Germany 585 739 1,324 EUR 18,383 22,060 15/08/2013 Secured
FMO – Netherlands 118 56 174 EUR 2,500 5,100 04/01/2014 Secured
MCB Bank Limited - Islamabad - Pakistan 48 - 48 EUR 700 700 09/05/2013 Secured
SCB Bank Limited STFA - Islamabad Pakistan 3 25 28 PKR 400 400 09/05/2015 Secured
Dubai Islamic Bank 4 44 48 PKR 700 7,081 30/07/2015 Secured
Silkbank Limited 1 60 61 PKR 900 900 13/10/2016 Secured
HSBC Bank Middle East Limited- Islamabad - Pakistan
- - - PKR - 800 06/12/2016 Secured
Standard Chartered Bank Pakistan Limited-Islamabad-Pakistan
1 - 1 PKR - 500 Within one year Secured
Citibank - - - PKR - 400 Within one year Secured
Allied bank Limited-Islamabad-Pakistan - - - PKR - 150 Within one year Secured
Detusche Bank A.G - - - PKR - 500 Within one year Secured
HBL Bank Ltd - - - PKR - 200 Within one year Secured
MCB Bank Ltd - - - PKR - 100 Within one year Secured
Meezan Short term 39 - 39 PKR - 575 Within one year Secured
1,231 1,392 2,623
Liabilities to banksAppendix A
37- Refinancing Plan and Shareholder Loan
During May 2011, VimpelCom refinanced the primary debt obligations of OTH.
The shareholders of OTH authorized VimpelCom refinancing as a related party transaction at an extraordinary general assembly held in Cairo on April 14, 2011.
VimpelCom refinanced the following debt obligations:
• Senior secured facility with OTH as the borrower and a syndicate of international and Egyptian banks as the lenders, with a maximum principal amount of US$2,500.0 million, under agreement dated February 27, 2006, as amended, with Deutsche Bank A.G., London Branch, as security agent (the “Senior Facility”);
• Floating rate secured equity linked notes due 2013 issued by Orascom Telecom Oscar S.A., in the original principal amount of US$230.013 million, under a trust indenture dated December 5, 2008, with Natixis Corporate Solutions Limited as trustee, and guaranteed by OTH, as amended (the “Equity Linked Notes”);
• Series of 7 7/8% senior notes due 2014 in the original aggregate principal amount of US$750.0 million, issued by Orascom Telecom Finance S.C.A., under a Trust Indenture dated February 8, 2007, with The Bank of New York as trustee, and guaranteed by OTH, as amended (the “OTF High Yield Notes”); and
• Derivative contracts to hedge interest rate risk under the Senior Facility, issued by OTH (the “Hedging Transactions”).
To effect the refinancing, VimpelCom Amsterdam Finance B.V. purchased the Senior Facility from the lenders under the facility on May 16, 2011, and purchased the Equity Linked Notes from the holder of the Equity Linked Notes on May 17, 2011. Immediately after completing these purchases, VimpelCom Amsterdam Finance entered into amended and restated versions of the relevant financing documents with OTH, in the case of the Senior Facility, and Orascom Telecom Oscar S.A. and OTH, in the case of the Equity Linked Notes (the “Amendments” or individually an “Amendment”).
The Amendments modified terms of the Senior Facility and the Equity Linked Notes, among other things extending their maturity to May 16, 2014, from their previous maturities in 2013, providing for a single payment at maturity with no amortization (as had been required before),
and modifying the interest rates from a floating rate to 9.50% per annum fixed rate and providing for payment in kind of interest (payable by automatic addition to the principal balance) prior to maturity.
The Amendments of the Senior Facility also provide for release of pledges of OTH’s shares in ECMS and Mobinil when the OTH Spin-off is to take place, as required for the OTH Spin-off.
On May 17, 2011, VimpelCom Amsterdam Finance advanced to OTH under the Senior Facility (as modified by the relevant Amendment) sufficient funds for it to discharge, and it did discharge, the OTF High Yield Notes by depositing the requisite amount with the trustee for the OTF High Yield Notes. Concurrently with its purchase of the Senior Facility, VimpelCom Amsterdam Finance also advanced to OTH sufficient funds under the Senior Facility (as modified by the relevant Amendment) for it to terminate and close out the Hedging Transactions and made advances under the Equity Linked Notes (as modified by the relevant Amendments).
38 - Subsequent events
a- Sale Agreement
As per the settlement agreement, Orascom Telecom Holding and OTMT entered into a Preliminary Sale Agreement of an Administrative Unit providing for the sale of the entire 26th floor located at 2005A – Nile City Towers – South Tower – Corniche Elnil – Ramlet Beaulac – 11221 Cairo.
b- Algerian International arbitration
In its board of directors meeting dated April 12, 2012 the company decided to commence an International arbitration against the People’s Democratic Republic of Algeria (Algeria) in respect of unlawful actions taken by the Algerian government against Orascom Telecom Algeria (OTA) (see note 35 contingent liabilities).
The company is claiming that breached obligations under the Bi-lateral investment treaty between Egypt and Algeria.
The arbitration claim is being made under the arbitration rules of the United Nations Commission on International Trade Law.

Orascom Telecom Holdings Annual Report 2011Orascom Telecom Holdings Annual Report 2011 153152
Liabilities to banks
Current Non-current Total Currency Nominal Line of credit Maturity Security
Million of EGPMillion of contract
currency
Orascom Telecom Algeria S.P.A.
Hermes loan 2006 281 - 281 USD 3,510 86 15/11/2012 Secured
281 - 281
Telecel Globe Limited
Banque de development des etats de l'afrique Central March 2007
7 14 21 XAF 4 2,464 30/06/2015 Secured
Ecobank CentrAfrique S.A 7 14 21 XAF 4 3,000 08/10/2014 Secured
Commercial Bank Centrafrique Sept 2007
1 - 1 XAF - 500 31/07/2012 Unsecured
Banque Populaire Maroco Centrafricaine
3 - 3 XAF - 934 28/02/2012 Secured
Ecobank CentrAfrique S.A - overdraft 7 - 7 XAF 1 - 12 months revolving Secured
Banque Populaire Maroco Centrafricaine - overdraft
5 - 5 XAF 1 - 12 months revolving Secured
Commercial Bank Centrafrique - overdraft
7 - 7 XAF 1 - 12 months revolving Secured
37 28 65
Total - liabilities to banks 2,988 2,004 4,992
Bonds
Current Non-current Total Currency Nominal Maturity Security
Million of EGP Million of contract currency
Pakistan Mobile Communications Limited
Royal Bank of Scotland and Deutsche Bank Securities Inc. (Euro Bond)
9 672 681 USD 250 13/11/2013 Unsecured
Pak Oman Investment Company Limited - Karachi - Pakistan (Trustee - Public Listed TFC)
74 36 110 PKR 2,714 31/05/2013 Secured
Allied Bank Limited - Karachi - Pakistan (2007) 4 242 246 PKR 4,257 28/10/2013 Unsecured
Orascom Telecom Bangladesh Limited
Senior Secured Bonds Due 2014 96 304 400 BDT 7,070 30/06/2014 Secured
Total Bonds 183 1,254 1,437
Financing from banks and bonds 3,171 3,258 6,429
Financing from other lenders 98 153 251
Vimpelcom new shareholder loan - 17,562 17,562
Total financial borrowings 3,269 20,973 24,242
Liabilities to banksAppendix A
Orascom Telecom Bangladesh Limited
Liabilities to banks
Current Non-current Total Currency Nominal Line of credit Maturity Security
Million of
EGPMillion of contract
currency
Hermes Facility 98 173 271 USD 46 120 07/01/2014 Secured
Commercial Bank USD 198 147 345 USD 57 130 08/01/2013 Secured
DFI Facility 44 67 111 USD 19 30 15/06/2014 Secured
BDT A Facility 23 - 23 BDT 315 2,520 30/06/2012 Secured
BDT B Facility 15 22 37 BDT 510 1,030 30/06/2014 Secured
Standard Chartered Bank, London 38 161 199 USD 36 50 30/09/2016 Secured
Commercial Bank of Ceylon 7 - 7 BDT 100 100 Renewal in process Unsecured
Citibank, N.A. 59 - 59 BDT 800 1,235 19/09/2012 Unsecured
Standard Chartered Bank 47 - 47 BDT 640 1,100 Renewal in process Unsecured
BRAC Bank Ltd. 44 - 44 BDT 600 750 28/10/2012 Unsecured
Eastern Bank Ltd. 96 - 96 BDT 1,300 1,500 31/05/2012 Unsecured
The City Bank 80 - 80 BDT 1,050 1,150 14/08/2012 Unsecured
Mutual Trust Bank Limited 55 - 55 BDT 746 750 30/11/2012 Unsecured
Premier Bank Limited 18 - 18 BDT 250 500 17/03/2012 Unsecured
Dutch Bangla Bank Limited 66 - 66 BDT 900 1,000 31/10/2012 Unsecured
Pubali Bank Limted 55 - 55 BDT 750 750 18/01/2012 Unsecured
One Bank Limited 26 - 26 BDT - 350 28/02/2012 Unsecured
IDLC 158 - 158 BDT - 2,145 18/11/2012 Unsecured
WCS Bank 162 - 162 BDT - 2,500 21/10/2012 Unsecured
1,289 570 1,859

Orascom Telecom Holdings Annual Report 2011Orascom Telecom Holdings Annual Report 2011 155154
Subsidiaries, joint ventures and associates
Country of domiciliation Shareholding (directly/indirectly) held by Orascom Telecom Holding
North Africa Algeria Orascom Telecom Algeria S.P.A. 96.81%
Algeria Data Base Management services Algeria 100.00%
Algeria Ring Algeria LLC 98.01%
Algeria Consortium Algerian Telecommunication S.P.A. 50.00%
Algeria Ring Algeria Services 97.02%
Tunisia Ring Tunisia 78.21%
Tunisia Ring Distribution Tunisia 77.43%
Tunisia Ring Retail Tunisia 76.65%
Middle east Dubai Global Entity for Telecom Trade –FZE 100.00%
Dubai Ring Dubai 96.53%
Iraq Ring Iraq 96.53%
Egypt Cortex Egypt 94.00%
Egypt Ring for Distributions 99.00%
Egypt Advanced Electronic Industries 96.52%
Egypt MMMS 98.80%
Egypt OTH for mobile phone investments 100.00%
Asia Bangladesh Orascom Telecom Bangladesh Limited 100.00%
Bangladesh Ring Bangladesh 98.98%
Pakistan Pakistan Mobile Communications Limited 100.00%
Pakistan Business & Communications 100.00%
Pakistan Link Direct International Limited 100.00%
Pakistan Ring Pakistan 94.59%
Pakistan Ring Pakistan Service 94.59%
Pakistan Link Pakistan Ltd. 99.99%
Pakistan LinkdotNet Pakistan 100.00%
Pakistan WWaseela Bank 100.00%
Central Africa Burundi U-Com Burundi S.A. 100.00%
Central Africa Telecel Centrafrique S.A. 100.00%
North America Canada Globalive Investment Holdings 47.60%
Canada Globalive Canada Holdings 65.40%
Canada Globalive Wireless Management 65.40%
Canada Gloablive Wireless LP (GELP) 65.40%
Canada Globalive Telecom Holdings 65.40%
Canada Orascom Telecom Holding (Canada) Limited 100.00%
Europe France Orascom Telecom Wireless Europe 100.00%
Luxembourg Orascom Luxembourg Sarl 100.00%
Luxembourg Orascom Luxembourg Finance SCA 100.00%
Luxembourg Orascom Telecom Sarl 100.00%
Luxembourg Orascom Telecom Finance SCA 100.00%
Luxembourg Orascom Telecom Acquisition 100.00%
Luxembourg Orascom Telecom One Sarl 100.00%
Luxembourg Orascom Telecom Oscar 100.00%
Malta Sawyer Limited 100.00%
Malta Orascom Telecom Eurasia Limited 100.00%
Malta Oratel International Inc plc 100.00%
Malta Moga Holding Limited 100.00%
Malta International Wireless Communications Pakistan Limited 100.00%
Malta TMGL 100.00%
Subsidiaries, joint ventures and associates
Country of domiciliation Shareholding (directly/indirectly) held by Orascom Telecom Holding
Malta Telecel International Limited 100.00%
Malta Orascom Iraq Holding 100.00%
Malta Orascom Telecom Iraq Corporation 100.00%
Malta Orascom Telecom Ventures Limited 100.00%
Malta Telecel Globe Limited 100.00%
Malta Orascom Telecom Holding (Malta) Canada Limited 100.00%
Malta Minimax Ventures 100.00%
Malta Financial Powers Plan Limited 100.00%
Malta Orascom Telecom ESOP Limited 100.00%
Malta Orascom for International Investment Holding 100.00%
Malta Data Base Management services Limited 100.00%
Malta Orascom Telecom CS 100.00%
Netherland Orascom Telecom Netherland 100.00%
Switzerland Telecel International S.A. Switzerland 100.00%
United Kingdom International Telecommunication Consortium Limited 50.00%

Independent Auditor Ernst & Young
Depository Bank Bank of New York Mellon
Ticker Symbol Egyptian Stock Exchange: ORTE.CA
London Stock Exchange: ORTEq.L
Requests for Corporate Information Orascom Telecom Holding S.A.E.
2005A, Nile City Towers- South Tower Corniche El Nile- Ramlet Beaulac, 11221
Cairo, Egypt
Investor Relations Mamdouh Abdel Wahab
Head of Investor Relations [email protected]
+20 (2) 2461 5050/51


