Online 2D-LC Characterization of Monoclonal Antibodies Using Protein A and Weak Cation Exchange Chromatography Analysis of mAbs Using 2D-LC with High-Resolution Sampling Application Note Author Sonja Schneider Agilent Technologies, Inc. Waldbronn, Germany Biotherapeutics and Biologics Abstract The characterization of biopharmaceuticals can be highly complex and extensive to evaluate all important quality attributes. Online 2D-LC analysis enables a combination of different analysis methods to monitor different parameters in one run. This Application Note shows a combination of protein A titer analysis in the first dimension followed by ion exchange chromatography for charge variant profiling. The setup using high-resolution sampling provides for highly precise analysis regarding retention time and area and enables time-saving and easy monitoring for process or quality control of monoclonal antibodies.
Transcript
Online 2D-LC Characterization of Monoclonal Antibodies Using Protein A and Weak Cation Exchange Chromatography Analysis of mAbs Using 2D-LC with High-Resolution Sampling
AbstractThe characterization of biopharmaceuticals can be highly complex and extensive to evaluate all important quality attributes. Online 2D-LC analysis enables a combination of different analysis methods to monitor different parameters in one run. This Application Note shows a combination of protein A titer analysis in the fi rst dimension followed by ion exchange chromatography for charge variant profi ling. The setup using high-resolution sampling provides for highly precise analysis regarding retention time and area and enables time-saving and easy monitoring for process or quality control of monoclonal antibodies.
2
ExperimentalInstrumentationThe Agilent 1290 Infi nity II 2D-LC Solution was comprised of the following modules:
• 2x Agilent 1290 Infi nity Valve Drives (G1170A) with 2x multiple heart-cutting valves (G4242-64000) equipped with 40-μL loops
• 2x Agilent 1290 Infi nity II Diode Array Detectors (G7117B) with 10-mm Max-Light cartridge cells (G4212-60008)
Columns• Agilent Bio-Monolith Column
Protein A (p/n 5069-3639)
• Agilent Bio mAb, NP5, PK Guard, nonporous, 2.1 x 50 mm, 5 µm, PEEK (p/n 5190-2412)
SoftwareAgilent OpenLAB CDS ChemStation Edition software, version C.01.07 [27] with Agilent 1290 Infi nity 2D-LC s oftware, version A.01.03
In addition to the two classical 2D-LC modes: (multiple) heart-cutting and comprehensive 2D-LC, acting complementary to each other, high-resolution sampling 2D-LC combines advantages of both heart-cutting and comprehensive 2D-LC. Up to 10 consecutive cuts can be defi ned for the fi rst dimension with the same valve setup that is also used for multiple heart-cutting 2D-LC. High-resolution sampling can be helpful, especially in biochromatography such as affi nity chromatography SEC or IEX, by enabling the analysis of larger areas of interest or broad unresolved peaks in the fi rst dimension. It retains the resolution gained in the fi rst dimension, and allows long runs in the second dimension. As an alternative, 2D-LC users have cut large peaks in a single large loop instead of multiple small sample loops, leading to several disadvantages such as the loss of the 1D resolution and overloading of the second-dimension column4.
If desired, high-resolution sampling also delivers precise and reproducible 2D-LC quantifi cation due to the option of transferring the entire 1D peak area to the second dimension. The Agilent 2D-LC software automatically groups consecutive cuts, and sums the peak areas of all compounds with similar retention in the second dimension.
This Application Note shows the combination of titer analyses using protein A affi nity chromatography in combination with weak cation exchange (WCX) to check for coeluting impurities, and for subsequent charge variant profi ling for an mAb.
IntroductionTo ensure their safety and effi cacy from triggering unpredictable immunogenic responses, detailed and in-depth characterization of biopharmaceuticals is of extreme importance. Different parameters must be monitored during various stages in the development and production of the product. In the early phases of process development especially, an enormous number of samples need to be screened. Those extensive studies include important quality attributes such as titer analysis, aggregation studies, charge variant and glycan profi ling, peptide mapping, and many others. Due to the extent and complexity of the used methods, full characterization of biopharmaceuticals is an elaborative, time-consuming, and cost-intensive business.
The fi rst step in the purifi cation of monoclonal antibodies (mAbs) is generally protein A or G affi nity chromatography. Protein A is a surface protein originally isolated from the bacterium Staphylococcus aureus, with a size of 56 kDa. Protein A binds to other immunoglobulin (Ig) G variants, with a high affi nity to human IgG1. This is the most common and accepted technique for antibody purifi cation1. Using this type of purifi cation usually results in a purity over 95 %. The purifi cation effi ciency is often verifi ed with subsequent size exclusion (SEC) or ion exchange (IEX) chromatography.
The Agilent 1290 Infi nity 2D-LC solution enables the online combination of two analysis types. Using multiple heart-cutting or high-resolution sampling 2D-LC, heart-cuts from the fi rst dimension are stored in the 40-µL loops of two 6-position/14-port valves, for additional and expanding analysis in the second dimension2,3. With this setup, different analyses that are of utmost importance in the characterization of biopharmaceuticals can be combined. Different combinations are possible, such as aggregation studies using SEC with charge profi ling using IEX, or titer analysis using protein A affi nity chromatography with SEC or IEX.
3
Solvents and samplesAll solvents used were LC grade. Fresh ultrapure water was obtained from a Milli-Q Integral system equipped with a 0.22-μm membrane point-of-use cartridge (Millipak). Phosphate buffered saline (PBS), acetic acid, ammonium formate, E. coli cells, and the CelLytic B Plus Kit were purchased from Sigma-Aldrich, St. Louis, MO, USA.
A monoclonal antibody solution was injected as pure solution in PBS (10 mg/mL) and, as well, injected after dilution into E. coli lysate (200 µL of the mAb solution was spiked into 1 mL of E. coli lysate). The samples were fi ltered using an Agilent Captiva Premium Syringe Filter, regenerated cellulose membrane, 15 mm diameter, 0.45-µm pore size (p/n 5190-5109).
Chromatographic conditionsTable 1. Chromatographic conditions for high-resolution sampling 2D-LC analysis using protein A and WCX.
Parameter ValueFirst-dimension parameters1D column Agilent Bio-Monolith Column Protein A1D mobile phase A) PBS, pH 7.2
Injection volume 2 μL (pure mAb) and 10 μL (mAb spiked in E. coli)Second-dimension parametersMode High-resolution sampling2D column Agilent Bio mAb2D mobile phase A) 20 mM ammonium formate, pH 6.2
B) 500 mM ammonium formate, pH 6.22D gradient stop time 6 minutes2D cycle time 10 minutes2D fl ow rate 0.5 mL/min2D gradient 0.00 minutes – 5 %B
5 minutes – 35 %B6 minutes – 40 %B
Injection volume 2 μL (pure mAb) and 10 μL (mAb spiked in E. coli)Thermostat autosampler 6 °CColumn temperature Room temperatureDADs 280 nm, 4 nm, Ref. 360 nm, 100 nmPeak widths 0.025 minutes (0.5 second response time) (10 Hz)
4
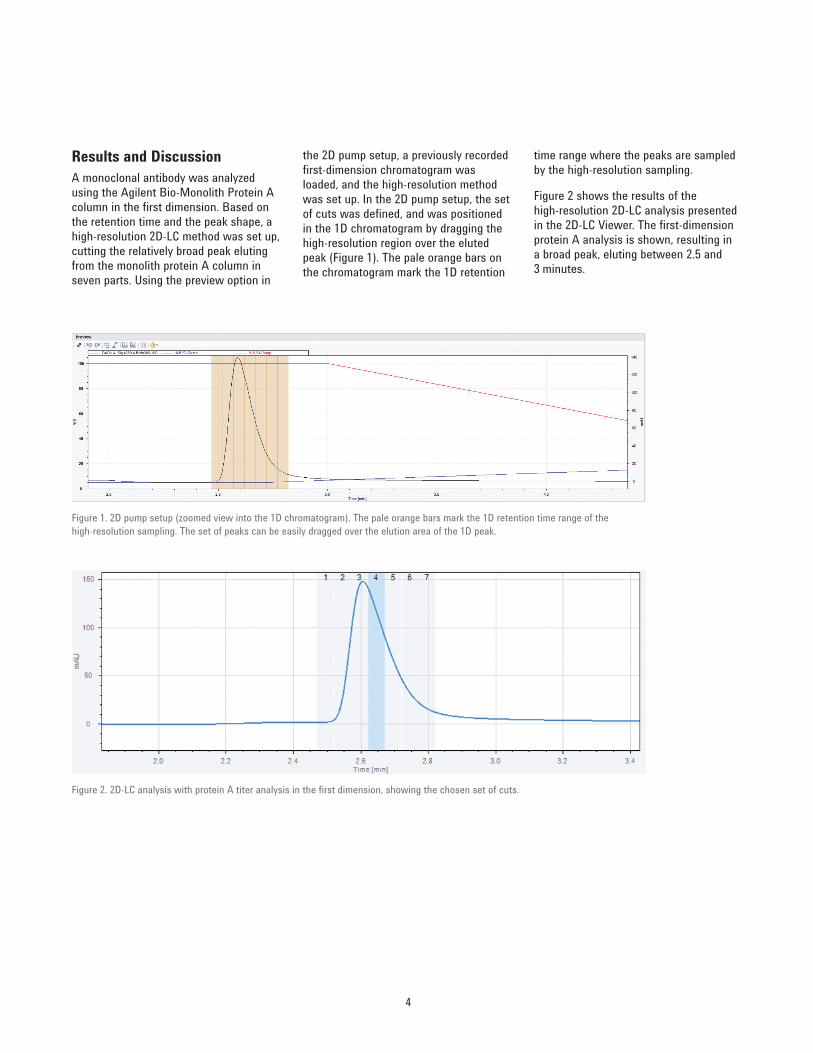
time range where the peaks are sampled by the high-resolution sampling.
Figure 2 shows the results of the high-resolution 2D-LC analysis presented in the 2D-LC Viewer. The fi rst-dimension protein A analysis is shown, resulting in a broad peak, eluting between 2.5 and 3 minutes.
the 2D pump setup, a previously recorded fi rst-dimension chromatogram was loaded, and the high-resolution method was set up. In the 2D pump setup, the set of cuts was defi ned, and was positioned in the 1D chromatogram by dragging the high-resolution region over the eluted peak (Figure 1). The pale orange bars on the chromatogram mark the 1D retention
Results and DiscussionA monoclonal antibody was analyzed using the Agilent Bio-Monolith Protein A column in the fi rst dimension. Based on the retention time and the peak shape, a high-resolution 2D-LC method was set up, cutting the relatively broad peak eluting from the monolith protein A column in seven parts. Using the preview option in
Figure 1. 2D pump setup (zoomed view into the 1D chromatogram). The pale orange bars mark the 1D retention time range of the high-resolution sampling. The set of peaks can be easily dragged over the elution area of the 1D peak.
Figure 2. 2D-LC analysis with protein A titer analysis in the fi rst dimension, showing the chosen set of cuts.
5
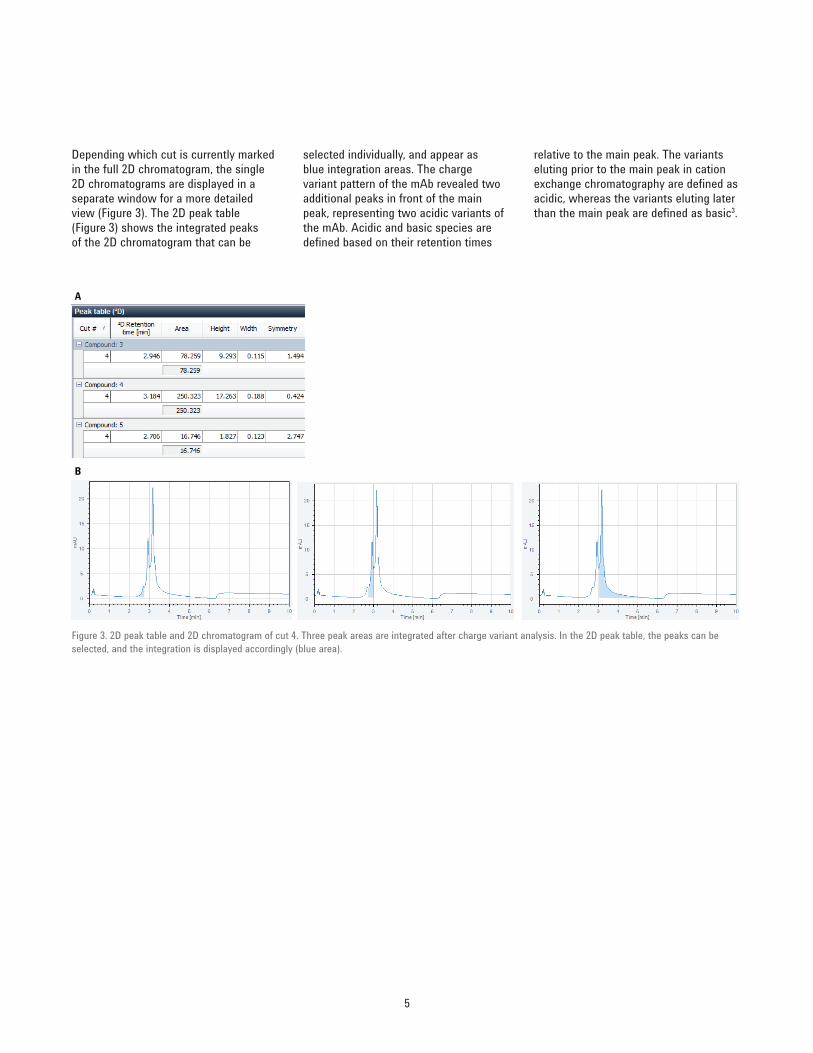
relative to the main peak. The variants eluting prior to the main peak in cation exchange chromatography are defi ned as acidic, whereas the variants eluting later than the main peak are defi ned as basic3.
selected individually, and appear as blue integration areas. The charge variant pattern of the mAb revealed two additional peaks in front of the main peak, representing two acidic variants of the mAb. Acidic and basic species are defi ned based on their retention times
Depending which cut is currently marked in the full 2D chromatogram, the single 2D chromatograms are displayed in a separate window for a more detailed view (Figure 3). The 2D peak table (Figure 3) shows the integrated peaks of the 2D chromatogram that can be
Figure 3. 2D peak table and 2D chromatogram of cut 4. Three peak areas are integrated after charge variant analysis. In the 2D peak table, the peaks can be selected, and the integration is displayed accordingly (blue area).
A
B
6
For the fi rst dimension, the retention time and area precision was excellent, with 0.08 and 0.8 %, respectively. The second-dimension precision for retention time and area was also good, with < 0.25 and < 1.5 %, respectively.
two acidic variants (compounds 3 and 5). Cut 4 was evaluated, representing the complete set of cuts. Figure 4 shows an overlay of six consecutive runs in the 2D-LC Viewer for the fi rst and second dimension together with the precision values for retention time and peak area.
Precision of retention time and area was determined in the fi rst and second dimension for six consecutive injections of the mAb. In the fi rst dimension, only one peak was evaluated, whereas three peaks were determined in the second dimension: 1 main (compound 4) and
Figure 4. Overlay of six consecutive 2D-LC runs.
1D mAb peak after protein A monolithRSD RT (%) RSD area (%)0.08 0.8
acidic variants and one main peak for the mAb. The high-resolution 2D-LC method was evaluated for retention time and area precision for six consecutive runs, revealing highly precise chromatographic performance for the fi rst and second dimension. In addition, a process control sample was mimicked by spiking the mAb sample into an E. coli lysate as a cell lysate surrogate. The elution from the fi rst-dimension protein A monolith as well as the charge profi ling in the second dimension were found to be comparable to the purely injected mAb, with no coeluting impurities under the protein A peak.
ConclusionProtein A titer analysis and weak cation exchange chromatography for charge variant analysis were combined using the Agilent 1290 Infi nity 2D-LC solution for the analysis of mAbs. Due to the elution profi le and peak shape of mAb after protein A analysis, resulting in one relatively broad peak, a high-resolution 2D-LC method was set up. A set of seven cuts was defi ned over the peak from the fi rst dimension. The seven cuts were analyzed for coeluting impurities, and the mAb charge variant pattern in the second dimension revealed no coelution, but two
Mimicking a cell lysate mAb process control sample, the used mAb was spiked into an E. coli lysate, fi ltered, and injected into the 2D-LC system to check for coeluting impurites. Figure 5 shows both the 1D and 2D chromatograms in the 2D-LC viewer. The E. coli lysate is not retained on the protein A monolith and elutes with the dead time at the beginning of the chromatogram. The mAb is retained on the column, and elutes between 2.5 and 3 minutes (same as in Figure 2). The charge pattern was found to be identical to the pattern found in the purely injected mAb.
Figure 5. 2D-LC chromatograms of the mAb spiked into the E. coli lysate. The 1D chromatogram shows the protein A analysis with the E. coli lysate fl ow-through at the beginning of the chromatogram, and the mAb eluting between 2.5 and 3 minutes. The charge variant analyses are displayed in the full 2D signal (bottom left) as well as the single 2D chromatograms (bottom right).
E.coli lysatefl ow-through
mAB
www.agilent.com/chem
For Research Use Only. Not for use in diagnostic procedures.
This information is subject to change without notice.