Online Appendix to Foreign Competition and Domestic Innovation: Evidence from U.S. Patents David Autor MIT and NBER David Dorn University of Zurich and CEPR Gordon H. Hanson UC San Diego and NBER Gary Pisano Harvard University Pian Shu Georgia Institute of Technology January 2019
Transcript
Online Appendix to Foreign Competition and DomesticInnovation:
Evidence from U.S. Patents
David AutorMIT and NBER
David DornUniversity of Zurich and CEPR
Gordon H. HansonUC San Diego and NBER
Gary PisanoHarvard University
Pian ShuGeorgia Institute of Technology
January 2019
A Matching Patent Assignees to Firms
A key challenge in matching patents to firm-level data is that inconsistencies in the spelling of firmnames on patents generate many false negative matches. Because patent applications leave it tothe applicant to state the name of the assignee, there is little uniformity in how company namesappear. This non-uniformity of assignee names, combined with the lack of a unique firm identifierin the patent data, makes it challenging to group patents belonging to the same firm. IBM, forinstance, has over 140 different name spellings on its patents, comprising both abbreviations andmisspellings of the official firm name (see Table A1). Traditional methods of patent-to-firm matchingemployed by prior work, most notably the NBER Patent Data Project (NBER-PDP), accommodatesome of these name variations by standardizing commonly used words in firm names, e.g., changing“Corp” to “Corporation” and “Ltd” to “Limited” (Bessen, 2009). This simple string standardization,however, does not account for customized abbreviations of firm names, and thus fails to link “IBM”to “International Business Machines”. Moreover, the data contain dozens of entries for assigneessuch as “International Business Machine” and “International Business Machiens”, which are verylikely misspellings of the IBM name. Here, standardization is intractable as none of these namesis an officially recognized spelling of IBM. The researcher is then faced with the unpalatable choiceof either throwing away observations for unmatched patents or making manual corrections to firmnames for hundreds of thousands of records. The NBER Patent Data Project employs extensivemanual inspection in addition to string standardization to match between the patent data andCompustat, but its coverage of patents ends with patents granted by 2006.1
We develop a four-step procedure to match the U.S. Patent and Inventor Database (whichcovers patents granted by March 2013) to Compustat.2 First, following NBER-PDP, we capitalizeall letters, remove punctuation and accent marks, and standardize commonly used words (e.g.,Corp./Corporation) in firm names both in the patent and Compustat data. This allows us toperform an initial matching based on cleaned name strings.3 Next, we conduct an internet searchfor each firm name that we observe either in the patent or Compustat data (entered in quotationmarks and clean of punctuation and accents) using the Bing Web Search API. Based on the topfive URLs collected from Bing.com in March 2016, we consider a patent assignee and a Compustatfirm to be a match if the top search results for the patent assignee contain the company websitelisted in Compustat (e.g., ibm.com). We also consider them a match if the top five search resultsfor the patent assignee and those for the Compustat firm share at least two URLs in common.Since internet search engines function as repositories of information on common spelling variationsof company names, matching based on search results substantially reduces the need for manual
1More recent studies have developed supervised approaches to disambiguate patent assignees (Ventura et al., 2015;Morrison et al., 2017; Balsmeier et al., 2018). Their algorithms group different spellings of assignee names based onassignee locations and/or similarity scores from fuzzy string match, but they do not match patent data to Compustator other firm-level data.
2The patent data are available at https://github.com/funginstitute/downloads and described in Li et al. (2014).3In rare cases, the same patent assignee can be matched to multiple Compustat firm records, which is usually due
to the same firm having multiple listings in Compustat. We apply tiebreakers based on the availability of segmentsales data, historical industry affiliation, and R&D spending data.
2
inspection and corrections. In the final two steps of our matching procedure, we append to our datathe matching from NBER-PDP between assignees and Compustat firms that our method has failedto capture, and then manually match ourselves the few large assignees that remained unmatchedafter the previous procedures.
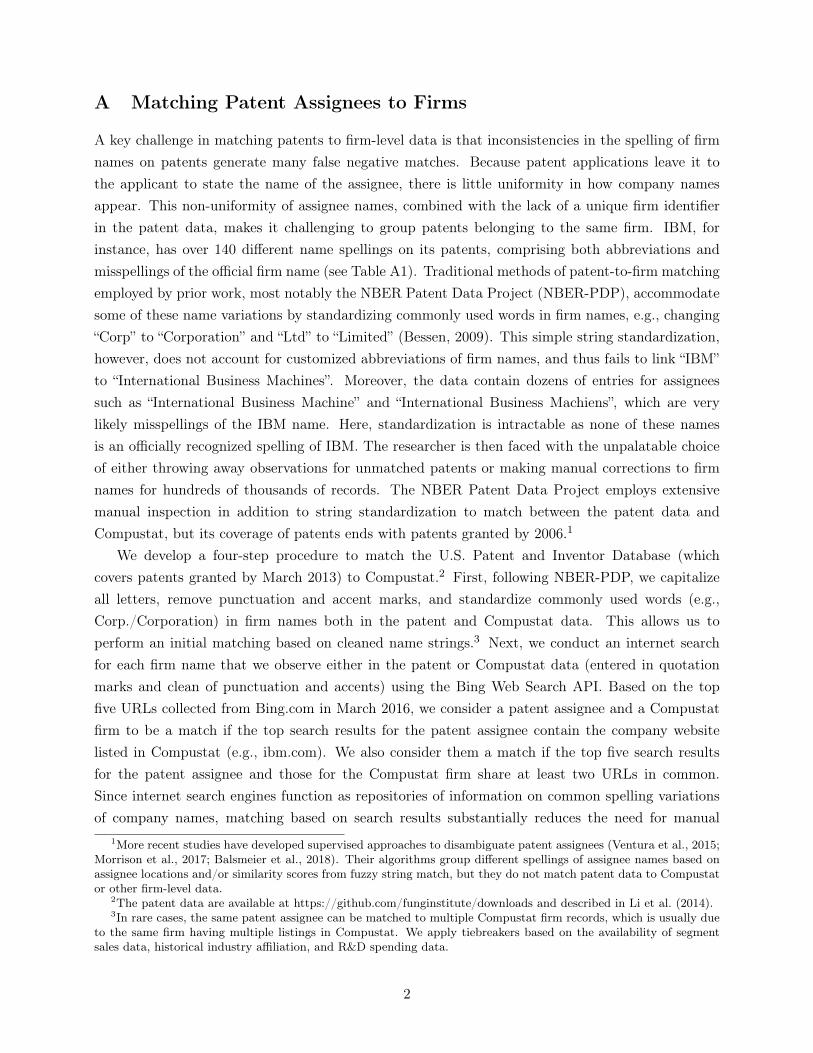
Although our empirical analysis focuses on patents with application years 1975, 1983, 1991,1999, and 2007, we have executed our readily scalable matching algorithm for all patents grantedfrom January 1975 to March 2013. Table A1 illustrates the outcome of our matching procedureusing IBM as a case study. It shows 71 firm names from patents that we identified as variations ofIBM. Each of these names appears on at least two patents in our data (column 1), while another76 variations of the IBM name that are not listed in the table appear on one patent each. Namematching alone successfully links only the two most frequent name variations of IBM, but missesthe many alternative (mis-)spellings, which are detected only by our web matching algorithm or themanual matching provided by NBER-PDP (column 2). For patents granted through 2006, our fullyautomated procedure achieves a similar success as the much more laborious matching by NBER-PDP. The web algorithm discovers 57 additional variations of the IBM name that appear on at leasttwo patents (indicated by ’web’ in column 2 of Table A1). While it misses four name variations thatwere matched to IBM by NBER-PDP (’nber-pdp’ of Table A1), it detects five name variations thatwere overlooked there (’X’ in column 3 of Table A1). Web matching additionally catches eight newname variations that appear on multiple patents which were granted after the coverage of NBER-PDP ends in 2006. A comparison between our IBM patent sample and the number of patents inthe company’s annual reports shows that our sample corresponds to between 99.5% and 100% ofIBM’s self-reported patent output in each year between 1994 and 2012. Our matching algorithmthus produces very few false negatives or false positives in the case of IBM.
3
Table A1: Patents matched to IBM by Autor, Dorn, Hanson, Pisano and Shu
(1) (2) (3)
Name variations that appear before 2006INTERNATIONAL BUSINESS MACHINES CORPORATION 74488 nameINTERNATIONAL BUSINESS MACHINES CORP 766 nameINTERNATIONAL BUSINESS MACHINE CORPORATION 90 webIBM CORPORATION 85 webINTERNATIONAL BUSINESS MACHINES 71 webINTERNATIONAL BUISNESS MACHINES CORPORATION 29 webINTERNATIONAL BUSINESS MACHINE CORP 27 webINTERNATIONAL BUSINESS MACHINES COPORATION 26 webINTERNATIONAL BUSINES MACHINES CORPORATION 19 webINTERNATIONAL BUSINESS MACHINES CORPORAITON 18 webINTERNATIONAL BUSINESS MACHIENS CORPORATION 15 webINTERNATIONAL BUSINESS MACHINES CORPORTION 15 webINTERNATIONAL BUSINESS MACHINES CORPROATION 14 webINTERNATIONAL BUSINESS MACHINES CORPORATIONS 12 webINTERNATIONAL BUSINESSS MACHINES CORPORATION 12 webINTERNATIONAL BUSINESS MACHINES INCORPORATED 12 nber-pdpINTERNATINAL BUSINESS MACHINES CORPORATION 11 webINTERNATIONAL BUSINESS MACHINES INC 11 webINTERNATIONAL BUSNIESS MACHINES CORPORATION 11 web XINTENATIONAL BUSINESS MACHINES CORPORATION 10 webINTERNATIOANL BUSINESS MACHINES CORPORATION 9 webINTERNATION BUSINESS MACHINES CORPORATION 9 webINTERNATIONL BUSINESS MACHINES CORPORATION 9 webINTERNATIONAL BUSINESS MACHINES COMPANY 8 webINTERNATIONAL BUSINESS MACHINESS CORPORATION 8 webINERNATIONAL BUSINESS MACHINES CORPORATION 7 webINTERNATIONAL BUSINESS MACINES CORPORATION 7 webINTERNATIONAL MACHINES CORPORATION 7 webINTERNAITONAL BUSINESS MACHINES CORPORATION 6 webINTERNATIONAL BUSINESS MACHINES CORPORATON 6 webINTERNATIONAL BUSSINESS MACHINES CORPORATION 6 webINTERNTIONAL BUSINESS MACHINES CORPORATION 6 webINTERNATIOAL BUSINESS MACHINES CORPORATION 5 webINTERNATIONAL BUINESS MACHINES CORPORATION 5 webINTERNATIONAL BUSINESS MACHINES COPRORATION 5 webINTERNATIONAL BUSINESS MACHINES INCORPORATION 5 nber-pdpIBM JAPAN LTD 4 web XINTERNATIONAL BUSINESS MACHINCES CORPORATION 4 webINTERNATIONAL BUSINESS MACHINES CORPORAION 4 web XINTERNATIONAL BUSINESS MACHINES CORPORARTION 4 webINTERNATIONAL BUSINESS MAHINES CORPORATION 4 webINTERNATONAL BUSINESS MACHINES CORPORATION 4 webIBM 3 webINTERANTIONAL BUSINESS MACHINES CORPORATION 3 webINTERNATIOANAL BUSINESS MACHINES CORPORATION 3 webINTERNATIONAL BUSIENSS MACHINES CORPORATION 3 webINTERNATIONAL BUSINESS MACHINES CORPORATIION 3 webINTERNATIONAL BUSINESS MACHINES CORPORATIOIN 3 webINTERNATIONAL BUSINESS MACHINES CORPORATOIN 3 webINTERNATIONAL BUSINESS MACHNIES CORPORATION 3 webINTERNATIONAL BUSINESS MAHCINES CORPORATION 3 webINTERNATIONAL BUSINSS MACHINES CORPORATION 3 webINTERNATIIONAL BUSINESS MACHINES CORPORATION 2 webINTERNATIONAL BUISINESS MACHINES CORPORATION 2 web XINTERNATIONAL BUSINESS MACHINES COPROATION 2 webINTERNATIONAL BUSINESS MACHINES COROPORATION 2 webINTERNATIONAL BUSINESS MACHINES CORPOATION 2 webINTERNATIONAL BUSINESS MACHINES CORPORATIN 2 webINTERNATIONAL BUSINESS MACHNINES CORPORATION 2 webINTERNATIONAL BUSNINESS MACHINES CORPORATION 2 web XLNTERNATIONAL BUSINESS MACHINES CORPORATION 2 webINFORMATION BUSINESS MACHINES CORPORATION 2 nber-pdpINTELLECTUAL BUSINESS MACHINES CORPORATION 2 nber-pdp
Name variations that appear only after 2006INTERNATIONAL BSUINESS MACHINES CORPORATION 4 web XINTERNATIONANL BUSINESS MACHINES CORPORATION 3 web XINNTERNATIONAL BUSINESS MACHINES CORPORATION 2 web XINTERNATIONA BUSINESS MACHINES CORPORATION 2 web XINTERNATIONAL BUSINESS MACHINES CORPOARTION 2 web XINTERNATIONAL BUSINESS MACHINES CORPORATIONAL 2 web XINTERNATIONAL BUSINESS MACHINES CORPRATION 2 web XINTRANATIONAL BUSINESS MACHINES CORPORATION 2 web X
Note: In each Year 1994-2012, the number of patents that we attribute to IBM corresponds to 99.5%-100% of the patent total that IBM reports in its company statements.
Notes: The table comprises all primary assignees with at least two corporate patents granted during 1975-2013 which we match to IBM using the method indicated in column 2. 2006 marks the end of NBER-PDP coverage. IBM has 76 additional name variations that are not shown in this table, each appearing on just one patent in our data. NBER-PDP matches 50 of these assignees, while ADHPS web search algorithm matches 67. The listed assignee names have been subject to minimal cleaning, including standardizing cases, removing of accents, and cleaning of non-alphabetic and non-numeric characters.
Table A1. Patents matched to IBM by Autor, Dorn, Hanson, Pisano and Shu
Assignee Name
Number of Patents
Source of Match in ADHPS
Not Matched by NBER-PDP
4
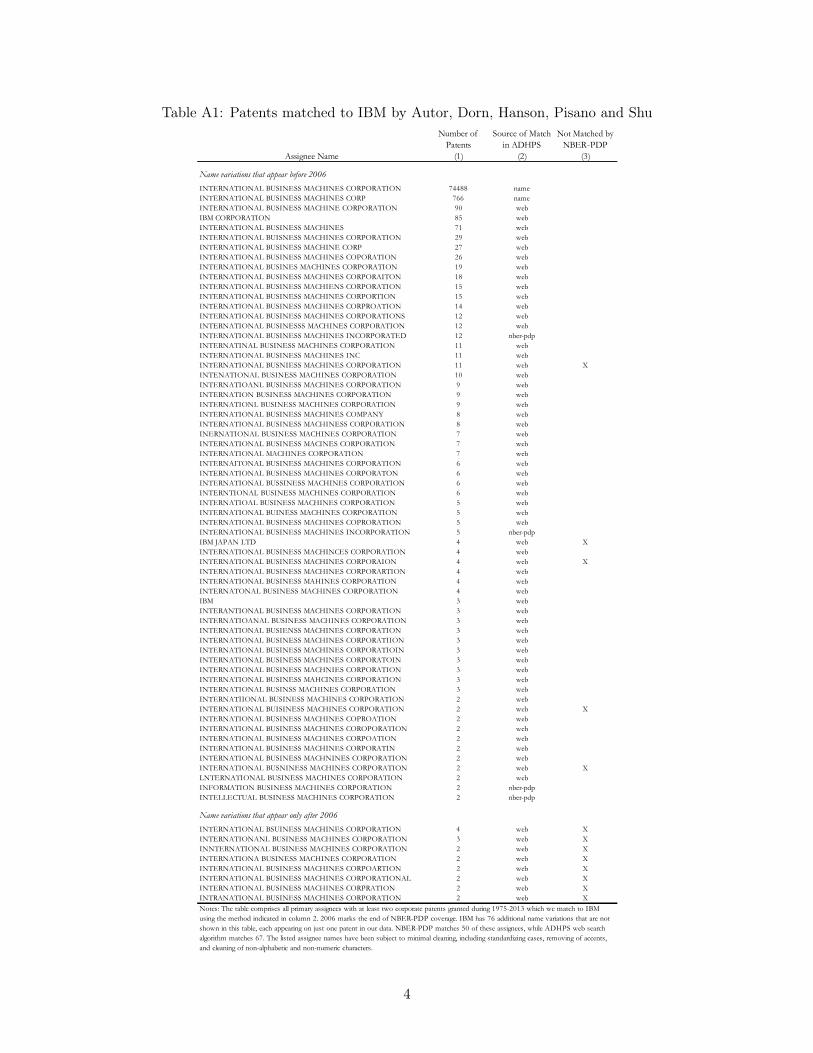
Table A2 shows the construction of our patent analysis sample, which begins with patents withcorporate assignees, US-based primary inventors, and application years 1975, 1983, 1991, 1999, and2007. We consider corporate assignees to be those that categorize themselves as corporations onpatents and whose names indicate that they are not universities, institutions, hospitals, or govern-ment agencies.4 Across all five application years, our procedure matches 171,838 of the 239,110patents in the starting sample and thus achieves a matching rate of 72% (columns 1-3). It exceedsthe matching rate of NBER-PDP by five percentage points in the three earliest years, and by tenpercentage points in 1999 (columns 4-5). The success of web matching alone is quite stable overtime, and links nearly two thirds of each year’s corporate patents to Compustat firms (columns 6-7).The final four columns of Table A2 indicate the composition of matching methods that we use forthe construction of the matched sample reported in column 2. In any given application year, around90% of the matched patents come from name matching and web matching (columns 8 and 9). Webmatching becomes increasingly useful (and name matching increasingly limited) over time as morefirms patent and more spelling variations occur.5 Among patents matched by both name matchingand web matching, 92% are matched to the same Compustat listing, suggesting that the automatedalgorithm significantly improves efficiency without substantially sacrificing accuracy.6
Table A2: Matching Patent Data to Compustat Data
ADHPS % Matched NBER-PDP % Matched ADHPS Web % Matched Name Web NBER-PDP Manual(1) (2) (3) (4) (5) (6) (7) (8) (9) (10) (11)
All Five Years 239,110 171,838 72% 109,824 46% 152,445 64% 70% 20% 7% 3%
All Corporate Patents
Notes: Column 1 reports the number of patents with corporate assignees and US-based primary inventors by application year. Columns 2 and 3 indicate the number and percentage of these patents that we match to Compustat firms in our final sample. Columns 4 and 5 indicate the number and percentage of patents that NBER-PDP matches. Columns 6 and 7 indicate the number and percentage of patents that can be matched to Compustat by the ADHPS web match algorithm (regardless of whether a name match exists). Columns 8-11 report the share of patents from the ADHPS sample in column 2 that are matched to Compustat in each of our four sequential steps: matching based on name strings (column 8), matching based on the ADHPS web search algorithm (column 9), matching based on assignee name-firm links in NBER-PDP (column 10), and matching based on our own manual searches (column 11).
Source of Match in ADHPSAlternative Assignment of Patents to Compustat Firms
Our Compustat data cover public firms that were listed on the North American stock marketsbetween 1950 and 2014. To match a firm to its patents, we do not require it to be included inCompustat in the year of patent application. If a private company applies for a patent before goingpublic, we are able to determine an industry affiliation for the firm using the industry assignation inCompustat after its listing. To this end, our baseline analysis assigns firms to industries using the
4We identify universities, institutions, hospitals and government agencies using key words in assignee names fol-lowing the NBER Patent Data Project.
5Our final sample of patents with application year 1975 includes 75% of all corporate patents (column 3 of TableA2), of which 78% were matched through an exact correspondence of the company name used on patents and inCompustat records (column 8). We are thus able to link 59% (=75%*78%) of all corporate patents from 1975 vianame matching. This percentage of corporate patents with successful name matching falls to 44% (=70%*63%) bythe application year 2007.
6Among patents that have no simple name matches but are matched by both NBER-PDP’s manual correctionsand our web search algorithm, 84% are matched to the same listing. The remaining 16% are mismatched either bythe web algorithm or by NBER-PDP.
5
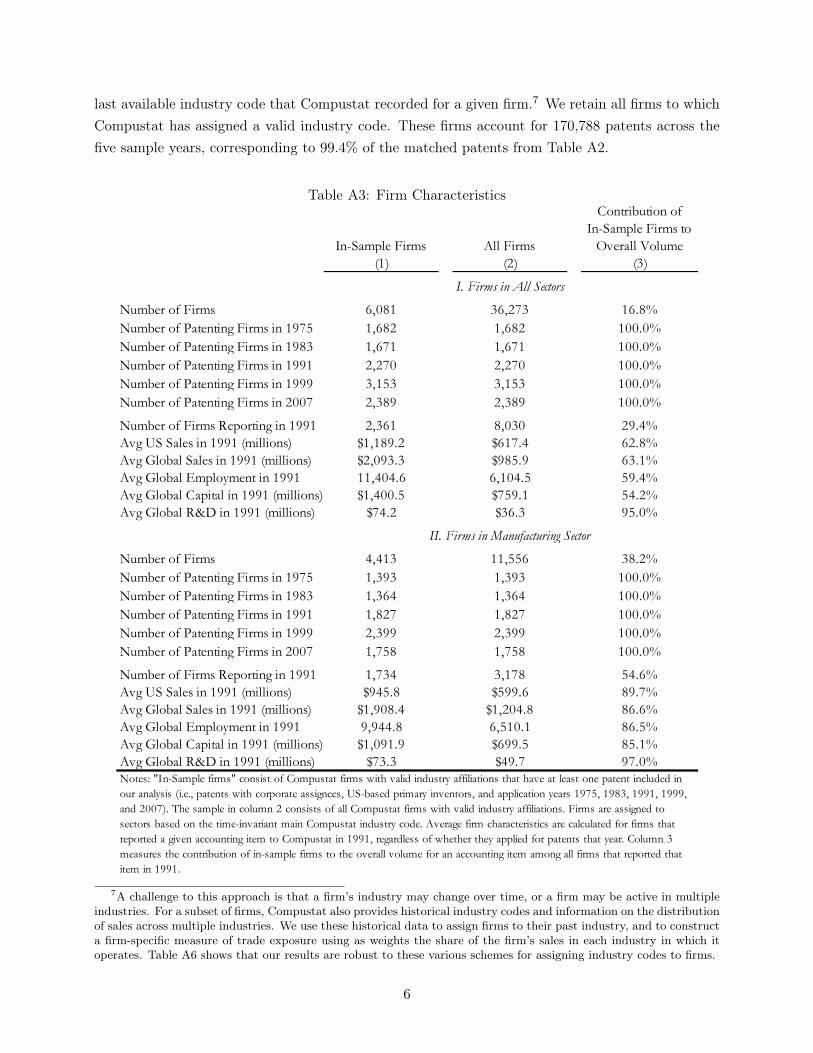
last available industry code that Compustat recorded for a given firm.7 We retain all firms to whichCompustat has assigned a valid industry code. These firms account for 170,788 patents across thefive sample years, corresponding to 99.4% of the matched patents from Table A2.
Table A3: Firm Characteristics
(1) (2) (3)
Number of Firms 6,081 36,273 16.8%Number of Patenting Firms in 1975 1,682 1,682 100.0%Number of Patenting Firms in 1983 1,671 1,671 100.0%Number of Patenting Firms in 1991 2,270 2,270 100.0%Number of Patenting Firms in 1999 3,153 3,153 100.0%Number of Patenting Firms in 2007 2,389 2,389 100.0%
Number of Firms Reporting in 1991 2,361 8,030 29.4%Avg US Sales in 1991 (millions) $1,189.2 $617.4 62.8%Avg Global Sales in 1991 (millions) $2,093.3 $985.9 63.1%Avg Global Employment in 1991 11,404.6 6,104.5 59.4%Avg Global Capital in 1991 (millions) $1,400.5 $759.1 54.2%Avg Global R&D in 1991 (millions) $74.2 $36.3 95.0%
Number of Firms 4,413 11,556 38.2%Number of Patenting Firms in 1975 1,393 1,393 100.0%Number of Patenting Firms in 1983 1,364 1,364 100.0%Number of Patenting Firms in 1991 1,827 1,827 100.0%Number of Patenting Firms in 1999 2,399 2,399 100.0%Number of Patenting Firms in 2007 1,758 1,758 100.0%
Number of Firms Reporting in 1991 1,734 3,178 54.6%Avg US Sales in 1991 (millions) $945.8 $599.6 89.7%Avg Global Sales in 1991 (millions) $1,908.4 $1,204.8 86.6%Avg Global Employment in 1991 9,944.8 6,510.1 86.5%Avg Global Capital in 1991 (millions) $1,091.9 $699.5 85.1%Avg Global R&D in 1991 (millions) $73.3 $49.7 97.0%
II. Firms in Manufacturing Sector
Notes: "In-Sample firms" consist of Compustat firms with valid industry affiliations that have at least one patent included in our analysis (i.e., patents with corporate assignees, US-based primary inventors, and application years 1975, 1983, 1991, 1999, and 2007). The sample in column 2 consists of all Compustat firms with valid industry affiliations. Firms are assigned to sectors based on the time-invariant main Compustat industry code. Average firm characteristics are calculated for firms that reported a given accounting item to Compustat in 1991, regardless of whether they applied for patents that year. Column 3 measures the contribution of in-sample firms to the overall volume for an accounting item among all firms that reported that item in 1991.
Table A3. Firm Characteristics
In-Sample Firms All Firms
Contribution of In-Sample Firms to
Overall Volume
I. Firms in All Sectors
7A challenge to this approach is that a firm’s industry may change over time, or a firm may be active in multipleindustries. For a subset of firms, Compustat also provides historical industry codes and information on the distributionof sales across multiple industries. We use these historical data to assign firms to their past industry, and to constructa firm-specific measure of trade exposure using as weights the share of the firm’s sales in each industry in which itoperates. Table A6 shows that our results are robust to these various schemes for assigning industry codes to firms.
6
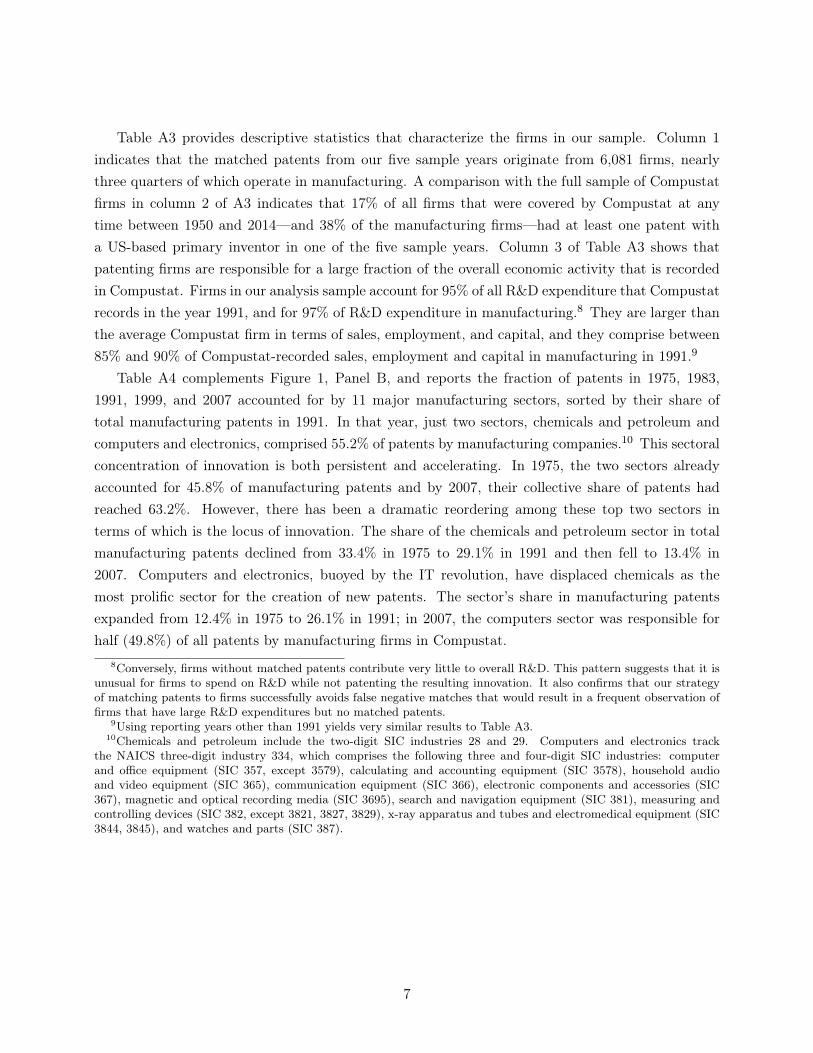
Table A3 provides descriptive statistics that characterize the firms in our sample. Column 1indicates that the matched patents from our five sample years originate from 6,081 firms, nearlythree quarters of which operate in manufacturing. A comparison with the full sample of Compustatfirms in column 2 of A3 indicates that 17% of all firms that were covered by Compustat at anytime between 1950 and 2014—and 38% of the manufacturing firms—had at least one patent witha US-based primary inventor in one of the five sample years. Column 3 of Table A3 shows thatpatenting firms are responsible for a large fraction of the overall economic activity that is recordedin Compustat. Firms in our analysis sample account for 95% of all R&D expenditure that Compustatrecords in the year 1991, and for 97% of R&D expenditure in manufacturing.8 They are larger thanthe average Compustat firm in terms of sales, employment, and capital, and they comprise between85% and 90% of Compustat-recorded sales, employment and capital in manufacturing in 1991.9
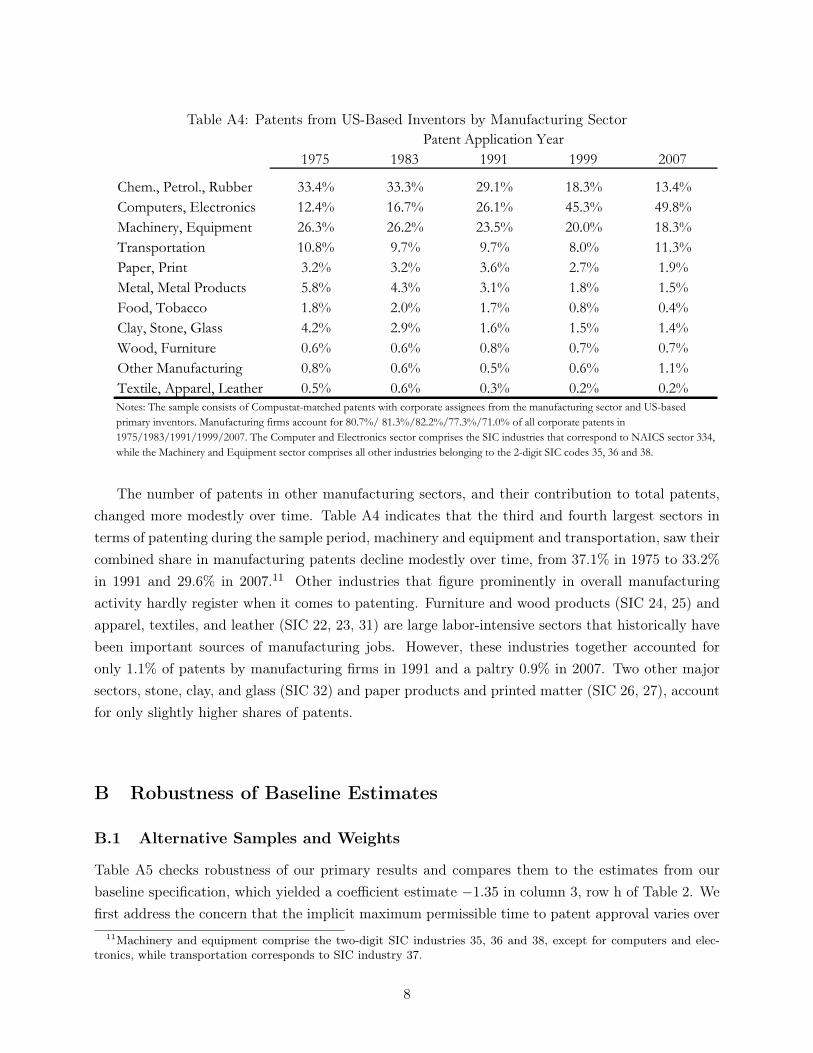
Table A4 complements Figure 1, Panel B, and reports the fraction of patents in 1975, 1983,1991, 1999, and 2007 accounted for by 11 major manufacturing sectors, sorted by their share oftotal manufacturing patents in 1991. In that year, just two sectors, chemicals and petroleum andcomputers and electronics, comprised 55.2% of patents by manufacturing companies.10 This sectoralconcentration of innovation is both persistent and accelerating. In 1975, the two sectors alreadyaccounted for 45.8% of manufacturing patents and by 2007, their collective share of patents hadreached 63.2%. However, there has been a dramatic reordering among these top two sectors interms of which is the locus of innovation. The share of the chemicals and petroleum sector in totalmanufacturing patents declined from 33.4% in 1975 to 29.1% in 1991 and then fell to 13.4% in2007. Computers and electronics, buoyed by the IT revolution, have displaced chemicals as themost prolific sector for the creation of new patents. The sector’s share in manufacturing patentsexpanded from 12.4% in 1975 to 26.1% in 1991; in 2007, the computers sector was responsible forhalf (49.8%) of all patents by manufacturing firms in Compustat.
8Conversely, firms without matched patents contribute very little to overall R&D. This pattern suggests that it isunusual for firms to spend on R&D while not patenting the resulting innovation. It also confirms that our strategyof matching patents to firms successfully avoids false negative matches that would result in a frequent observation offirms that have large R&D expenditures but no matched patents.
9Using reporting years other than 1991 yields very similar results to Table A3.10Chemicals and petroleum include the two-digit SIC industries 28 and 29. Computers and electronics track
the NAICS three-digit industry 334, which comprises the following three and four-digit SIC industries: computerand office equipment (SIC 357, except 3579), calculating and accounting equipment (SIC 3578), household audioand video equipment (SIC 365), communication equipment (SIC 366), electronic components and accessories (SIC367), magnetic and optical recording media (SIC 3695), search and navigation equipment (SIC 381), measuring andcontrolling devices (SIC 382, except 3821, 3827, 3829), x-ray apparatus and tubes and electromedical equipment (SIC3844, 3845), and watches and parts (SIC 387).
7
Table A4: Patents from US-Based Inventors by Manufacturing SectorPatent Application Year
Table A4. Distribution of Patents across Manufacturing Sectors
Notes: The sample consists of Compustat-matched patents with corporate assignees from the manufacturing sector and US-based primary inventors. Manufacturing firms account for 80.7%/ 81.3%/82.2%/77.3%/71.0% of all corporate patents in 1975/1983/1991/1999/2007. The Computer and Electronics sector comprises the SIC industries that correspond to NAICS sector 334, while the Machinery and Equipment sector comprises all other industries belonging to the 2-digit SIC codes 35, 36 and 38.
The number of patents in other manufacturing sectors, and their contribution to total patents,changed more modestly over time. Table A4 indicates that the third and fourth largest sectors interms of patenting during the sample period, machinery and equipment and transportation, saw theircombined share in manufacturing patents decline modestly over time, from 37.1% in 1975 to 33.2%in 1991 and 29.6% in 2007.11 Other industries that figure prominently in overall manufacturingactivity hardly register when it comes to patenting. Furniture and wood products (SIC 24, 25) andapparel, textiles, and leather (SIC 22, 23, 31) are large labor-intensive sectors that historically havebeen important sources of manufacturing jobs. However, these industries together accounted foronly 1.1% of patents by manufacturing firms in 1991 and a paltry 0.9% in 2007. Two other majorsectors, stone, clay, and glass (SIC 32) and paper products and printed matter (SIC 26, 27), accountfor only slightly higher shares of patents.
B Robustness of Baseline Estimates
B.1 Alternative Samples and Weights
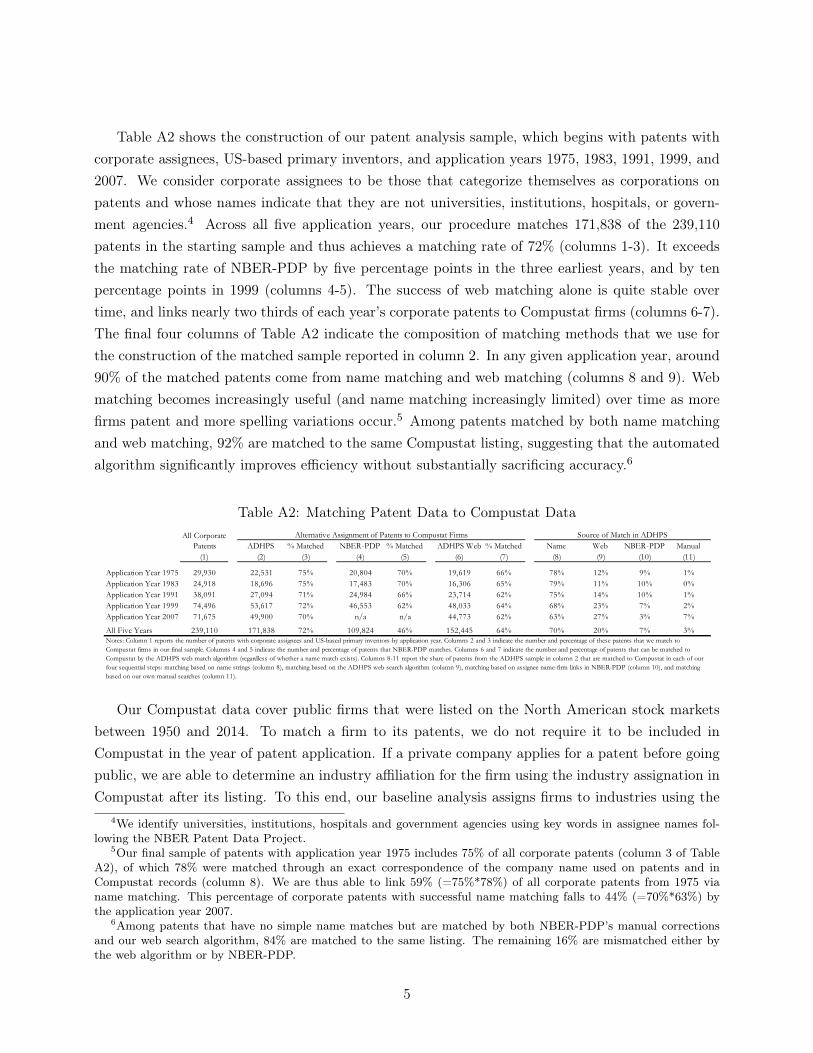
Table A5 checks robustness of our primary results and compares them to the estimates from ourbaseline specification, which yielded a coefficient estimate −1.35 in column 3, row h of Table 2. Wefirst address the concern that the implicit maximum permissible time to patent approval varies over
11Machinery and equipment comprise the two-digit SIC industries 35, 36 and 38, except for computers and elec-tronics, while transportation corresponds to SIC industry 37.
8
the sample period (i.e., we observe patents with application dates between 1991 and 2007, whichwere granted by 2013). Whereas for the first year in the sample, we observe patents granted within22 years of the application date, for the last year in the sample, we see only patents granted withinsix years of the application date. In column 1 of Table A5, we examine the robustness of our resultsto imposing a uniform time to approval for all patents considered in the analysis. We restrict thesample to patents granted within six years of the time of application. Because the vast majority ofpatents are granted within a few years after an application is submitted, the impact of this restrictionon the sample size is small. The number of firm-years included in the analysis falls from 8, 271 inour baseline specification in column 1 to 8, 167 in column 1, and the number of patents used forthe analysis declines from 129,585 to 127,654. The coefficient estimate on import penetration withthe six-year patent approval restriction (−1.37) is nearly identical to that in the baseline (−1.35),suggesting that right censoring in patent approval times is of little consequence for the results.
Given the importance of innovations in computer applications and in chemical processes forpatenting by manufacturing firms, it is natural to wonder whether our results are sensitive to in-cluding patents in these technology fields in the analysis. In Table 2, we have already explored suchsensitivity by incorporating controls for the technology mix of patenting by the firm, as measured bythe average shares of firm patents that fall into the six primary technology classes that are indicatedon patents (chemical; electrical and electronic; computers and communication; mechanical; drugsand medical; other). The results in Table 2 reveal that after adding controls for the firm’s broadsector of activity, controlling for the technology mix of the firm’s patents has little extra effect. Incolumns 2 and 3 of Table A5, we take the further step of dropping all patents with the primarytechnology class in computers and communications or in chemicals, drugs and medical. Under eitherrestriction, the change in firm patents is thus calculated over new innovations in the remaining tech-nology classes. These exclusions result in larger point estimates for the negative impact of greatertrade exposure on the firm-level change in patenting, with coefficient values rising from −1.35 inthe baseline specification to −1.83 when computer and communication patents are excluded and to−1.52 when chemical and pharmaceutical patents are excluded, with little effect on precision. Theresponsiveness of patenting to import competition thus appears to be slightly greater, rather thansmaller, outside of the dominant technological areas for manufacturing innovation.
9
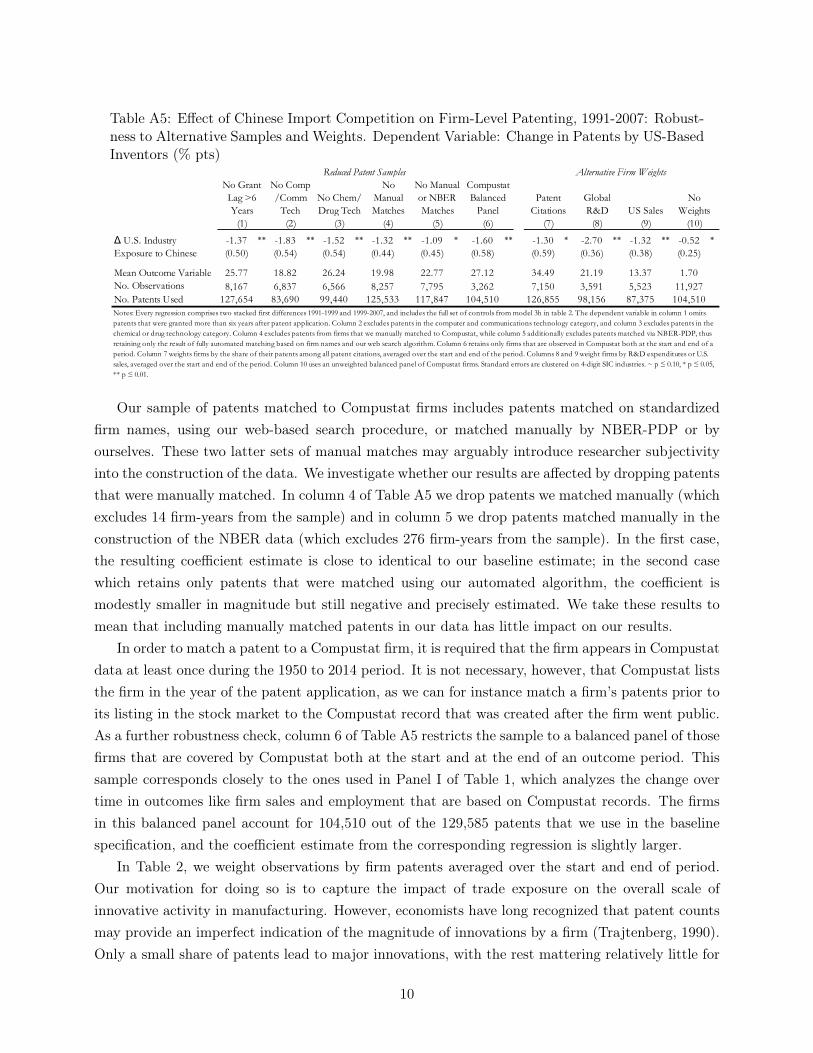
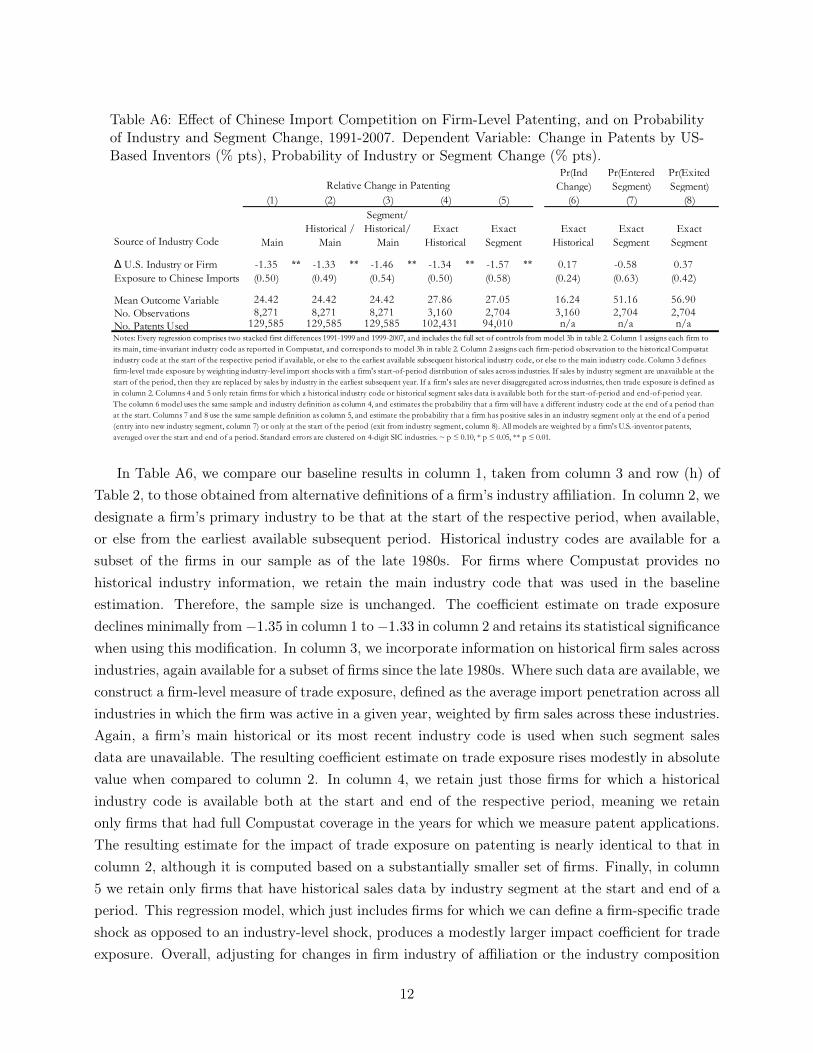
Table A5: Effect of Chinese Import Competition on Firm-Level Patenting, 1991-2007: Robust-ness to Alternative Samples and Weights. Dependent Variable: Change in Patents by US-BasedInventors (% pts)
Mean Outcome Variable 25.77 18.82 26.24 19.98 22.77 27.12 34.49 21.19 13.37 1.70No. Observations 8,167 6,837 6,566 8,257 7,795 3,262 7,150 3,591 5,523 11,927No. Patents Used 127,654 83,690 99,440 125,533 117,847 104,510 126,855 98,156 87,375 104,510Notes: Every regression comprises two stacked first differences 1991-1999 and 1999-2007, and includes the full set of controls from model 3h in table 2. The dependent variable in column 1 omits patents that were granted more than six years after patent application. Column 2 excludes patents in the computer and communications technology category, and column 3 excludes patents in the chemical or drug technology category. Column 4 excludes patents from firms that we manually matched to Compustat, while column 5 additionally excludes patents matched via NBER-PDP, thus retaining only the result of fully automated matching based on firm names and our web search algorithm. Column 6 retains only firms that are observed in Compustat both at the start and end of a period. Column 7 weights firms by the share of their patents among all patent citations, averaged over the start and end of the period. Columns 8 and 9 weight firms by R&D expenditures or U.S. sales, averaged over the start and end of the period. Column 10 uses an unweighted balanced panel of Compustat firms. Standard errors are clustered on 4-digit SIC industries. ~ p ≤ 0.10, * p ≤ 0.05, ** p ≤ 0.01.
US SalesNo
Weights(9) (10)(6)
Patent Citations
(7)
Global R&D
(8)
Δ U.S. Industry Exposure to Chinese
Reduced Patent Samples Alternative Firm WeightsNo Grant Lag >6 Years
(1)
No Comp /Comm
Tech(2)
No Chem/ Drug Tech
(3)
No Manual Matches
(4)
No Manual or NBER Matches
(5)
Compustat Balanced
Panel
Our sample of patents matched to Compustat firms includes patents matched on standardizedfirm names, using our web-based search procedure, or matched manually by NBER-PDP or byourselves. These two latter sets of manual matches may arguably introduce researcher subjectivityinto the construction of the data. We investigate whether our results are affected by dropping patentsthat were manually matched. In column 4 of Table A5 we drop patents we matched manually (whichexcludes 14 firm-years from the sample) and in column 5 we drop patents matched manually in theconstruction of the NBER data (which excludes 276 firm-years from the sample). In the first case,the resulting coefficient estimate is close to identical to our baseline estimate; in the second casewhich retains only patents that were matched using our automated algorithm, the coefficient ismodestly smaller in magnitude but still negative and precisely estimated. We take these results tomean that including manually matched patents in our data has little impact on our results.
In order to match a patent to a Compustat firm, it is required that the firm appears in Compustatdata at least once during the 1950 to 2014 period. It is not necessary, however, that Compustat liststhe firm in the year of the patent application, as we can for instance match a firm’s patents prior toits listing in the stock market to the Compustat record that was created after the firm went public.As a further robustness check, column 6 of Table A5 restricts the sample to a balanced panel of thosefirms that are covered by Compustat both at the start and at the end of an outcome period. Thissample corresponds closely to the ones used in Panel I of Table 1, which analyzes the change overtime in outcomes like firm sales and employment that are based on Compustat records. The firmsin this balanced panel account for 104,510 out of the 129,585 patents that we use in the baselinespecification, and the coefficient estimate from the corresponding regression is slightly larger.
In Table 2, we weight observations by firm patents averaged over the start and end of period.Our motivation for doing so is to capture the impact of trade exposure on the overall scale ofinnovative activity in manufacturing. However, economists have long recognized that patent countsmay provide an imperfect indication of the magnitude of innovations by a firm (Trajtenberg, 1990).Only a small share of patents lead to major innovations, with the rest mattering relatively little for
10
firm profitability. Citations of a patent in subsequent patent applicants is a commonly used metricof the importance of an innovation (Jaffe and Trajtenberg, 2002).
With this reasoning in mind, column 7 of Table A5 reports estimates where we weight observa-tions by the total number of subsequent citations to each firm’s start-of-period and end-of-periodpatents. Relative to the baseline result, citation weighting produces a very similar estimated impactof trade exposure on firm patenting (−1.30). An alternative measure of a firm’s innovative heftis its total spending on R&D. Because R&D is an input to innovation rather than an output, itmay imperfectly reflect a firm’s contribution to technological progress. Still, it offers an intuitivemeasure of a firm’s attempts to advance technology frontier. Moreover, weighting by firm globalR&D spending extends the sample to include firms for which we observe positive R&D spendingbut no patents in the sample period, although we loose a larger number of firms for which we ob-serve patents but not R&D. The resulting regression estimate in column 8 of Table A5 indicates alarger and highly significant negative impact of trade exposure on firm patenting (−2.70). Theseweighting schemes based on patents, patent citations or R&D expenditure allocate greater weightto firms whose contribution to U.S. innovation is larger. In column 9 of Table A5, we instead weightfirm observations by their sales in the U.S. market, which yields an estimate (−1.32), which is veryclose to the baseline effect in the patent-weighted sample. Finally, column 10 of Table A5 considersan unweighted balanced panel of Compustat firms which also comprises non-innovative firms thatneither patent nor report R&D spending in a given time period, and that would hence have a zeroweight in the previous specifications that weight firms according to their innovative activity. Theestimated impact of import penetration on patenting in the unweighted firm sample is smaller inmagnitude (−0.52) than in the baseline specification, but remains significantly negative (t-statistic2.1).
B.2 Alternative Industry Classifications
In the sample used for the estimation results in Table 2, we classify firms according to their mainindustry code, as reported in Compustat. This code generally corresponds to industry affiliationduring the most recent period. It is however possible that firms change their primary industriesin response to trade shocks. Bernard et al. (2006) find evidence of such movements at the level ofU.S. manufacturing plants during the 1980s and early 1990s. Among plants that survive from oneperiod to the next, those that are exposed to larger increases in import competition are more likelyto change their initial industry of affiliation. Our sample, however, is comprised of firms, not plants,where any one firm may own dozens of manufacturing establishments. Inducing changes in primaryindustry affiliation at the firm level is likely to require a much stronger impetus than at the plantlevel. We proceed to examine whether our results are sensitive to changes in how we define a firm’sprimary industry.
11
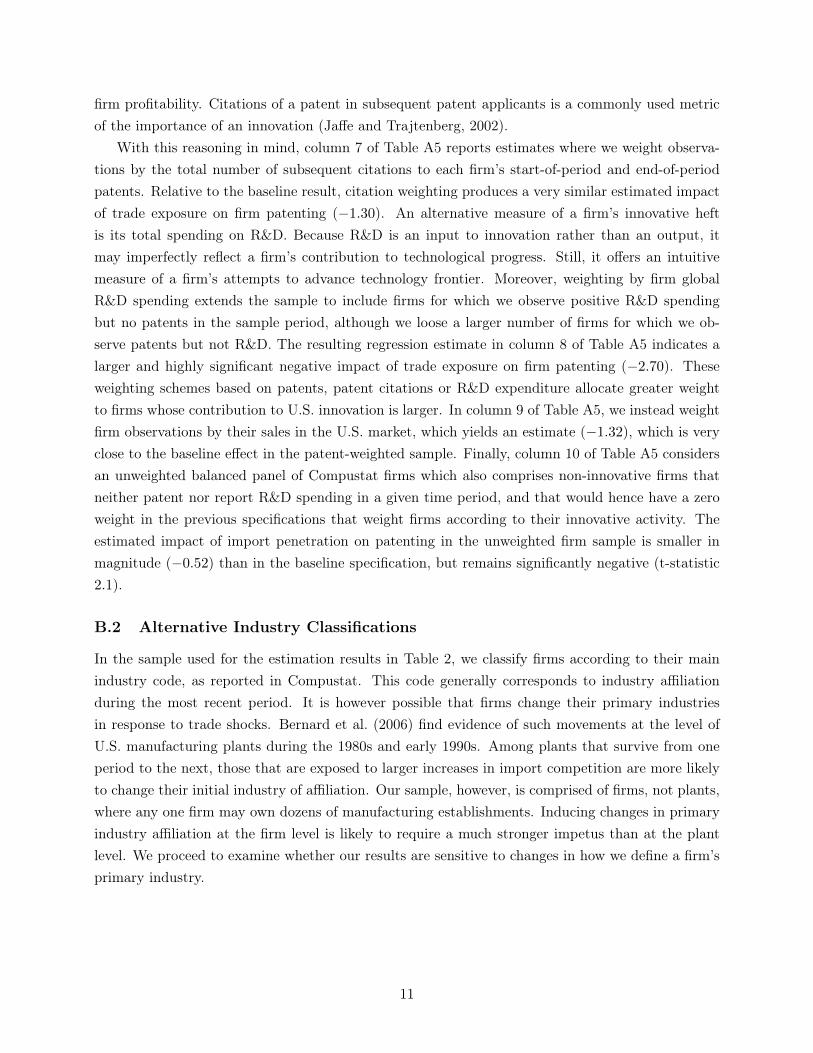
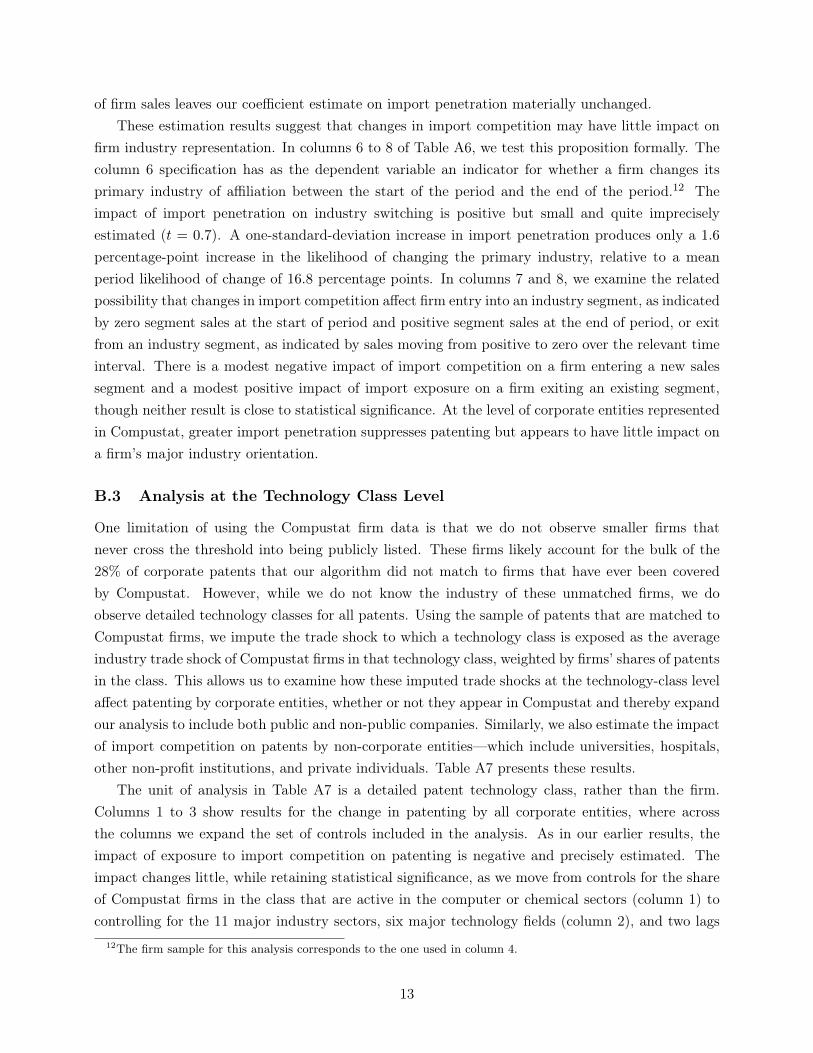
Table A6: Effect of Chinese Import Competition on Firm-Level Patenting, and on Probabilityof Industry and Segment Change, 1991-2007. Dependent Variable: Change in Patents by US-Based Inventors (% pts), Probability of Industry or Segment Change (% pts).
Notes: Every regression comprises two stacked first differences 1991-1999 and 1999-2007, and includes the full set of controls from model 3h in table 2. Column 1 assigns each firm to its main, time-invariant industry code as reported in Compustat, and corresponds to model 3h in table 2. Column 2 assigns each firm-period observation to the historical Compustat industry code at the start of the respective period if available, or else to the earliest available subsequent historical industry code, or else to the main industry code. Column 3 defines firm-level trade exposure by weighting industry-level import shocks with a firm's start-of-period distribution of sales across industries. If sales by industry segment are unavailable at the start of the period, then they are replaced by sales by industry in the earliest subsequent year. If a firm's sales are never disaggregated across industries, then trade exposure is defined as in column 2. Columns 4 and 5 only retain firms for which a historical industry code or historical segment sales data is available both for the start-of-period and end-of-period year. The column 6 model uses the same sample and industry definition as column 4, and estimates the probability that a firm will have a different industry code at the end of a period than at the start. Columns 7 and 8 use the same sample definition as column 5, and estimate the probability that a firm has positive sales in an industry segment only at the end of a period (entry into new industry segment, column 7) or only at the start of the period (exit from industry segment, column 8). All models are weighted by a firm's U.S.-inventor patents, averaged over the start and end of a period. Standard errors are clustered on 4-digit SIC industries. ~ p ≤ 0.10, * p ≤ 0.05, ** p ≤ 0.01.
Δ U.S. Industry or Firm Exposure to Chinese Imports
(1)
Exact Historical
Exact Segment
Exact Segment
(2) (3) (4) (5) (6)
MainHistorical /
Main
Segment/ Historical/
MainExact
Historical
In Table A6, we compare our baseline results in column 1, taken from column 3 and row (h) ofTable 2, to those obtained from alternative definitions of a firm’s industry affiliation. In column 2, wedesignate a firm’s primary industry to be that at the start of the respective period, when available,or else from the earliest available subsequent period. Historical industry codes are available for asubset of the firms in our sample as of the late 1980s. For firms where Compustat provides nohistorical industry information, we retain the main industry code that was used in the baselineestimation. Therefore, the sample size is unchanged. The coefficient estimate on trade exposuredeclines minimally from−1.35 in column 1 to−1.33 in column 2 and retains its statistical significancewhen using this modification. In column 3, we incorporate information on historical firm sales acrossindustries, again available for a subset of firms since the late 1980s. Where such data are available, weconstruct a firm-level measure of trade exposure, defined as the average import penetration across allindustries in which the firm was active in a given year, weighted by firm sales across these industries.Again, a firm’s main historical or its most recent industry code is used when such segment salesdata are unavailable. The resulting coefficient estimate on trade exposure rises modestly in absolutevalue when compared to column 2. In column 4, we retain just those firms for which a historicalindustry code is available both at the start and end of the respective period, meaning we retainonly firms that had full Compustat coverage in the years for which we measure patent applications.The resulting estimate for the impact of trade exposure on patenting is nearly identical to that incolumn 2, although it is computed based on a substantially smaller set of firms. Finally, in column5 we retain only firms that have historical sales data by industry segment at the start and end of aperiod. This regression model, which just includes firms for which we can define a firm-specific tradeshock as opposed to an industry-level shock, produces a modestly larger impact coefficient for tradeexposure. Overall, adjusting for changes in firm industry of affiliation or the industry composition
12
of firm sales leaves our coefficient estimate on import penetration materially unchanged.These estimation results suggest that changes in import competition may have little impact on
firm industry representation. In columns 6 to 8 of Table A6, we test this proposition formally. Thecolumn 6 specification has as the dependent variable an indicator for whether a firm changes itsprimary industry of affiliation between the start of the period and the end of the period.12 Theimpact of import penetration on industry switching is positive but small and quite impreciselyestimated (t = 0.7). A one-standard-deviation increase in import penetration produces only a 1.6
percentage-point increase in the likelihood of changing the primary industry, relative to a meanperiod likelihood of change of 16.8 percentage points. In columns 7 and 8, we examine the relatedpossibility that changes in import competition affect firm entry into an industry segment, as indicatedby zero segment sales at the start of period and positive segment sales at the end of period, or exitfrom an industry segment, as indicated by sales moving from positive to zero over the relevant timeinterval. There is a modest negative impact of import competition on a firm entering a new salessegment and a modest positive impact of import exposure on a firm exiting an existing segment,though neither result is close to statistical significance. At the level of corporate entities representedin Compustat, greater import penetration suppresses patenting but appears to have little impact ona firm’s major industry orientation.
B.3 Analysis at the Technology Class Level
One limitation of using the Compustat firm data is that we do not observe smaller firms thatnever cross the threshold into being publicly listed. These firms likely account for the bulk of the28% of corporate patents that our algorithm did not match to firms that have ever been coveredby Compustat. However, while we do not know the industry of these unmatched firms, we doobserve detailed technology classes for all patents. Using the sample of patents that are matched toCompustat firms, we impute the trade shock to which a technology class is exposed as the averageindustry trade shock of Compustat firms in that technology class, weighted by firms’ shares of patentsin the class. This allows us to examine how these imputed trade shocks at the technology-class levelaffect patenting by corporate entities, whether or not they appear in Compustat and thereby expandour analysis to include both public and non-public companies. Similarly, we also estimate the impactof import competition on patents by non-corporate entities—which include universities, hospitals,other non-profit institutions, and private individuals. Table A7 presents these results.
The unit of analysis in Table A7 is a detailed patent technology class, rather than the firm.Columns 1 to 3 show results for the change in patenting by all corporate entities, where acrossthe columns we expand the set of controls included in the analysis. As in our earlier results, theimpact of exposure to import competition on patenting is negative and precisely estimated. Theimpact changes little, while retaining statistical significance, as we move from controls for the shareof Compustat firms in the class that are active in the computer or chemical sectors (column 1) tocontrolling for the 11 major industry sectors, six major technology fields (column 2), and two lags
12The firm sample for this analysis corresponds to the one used in column 4.
13
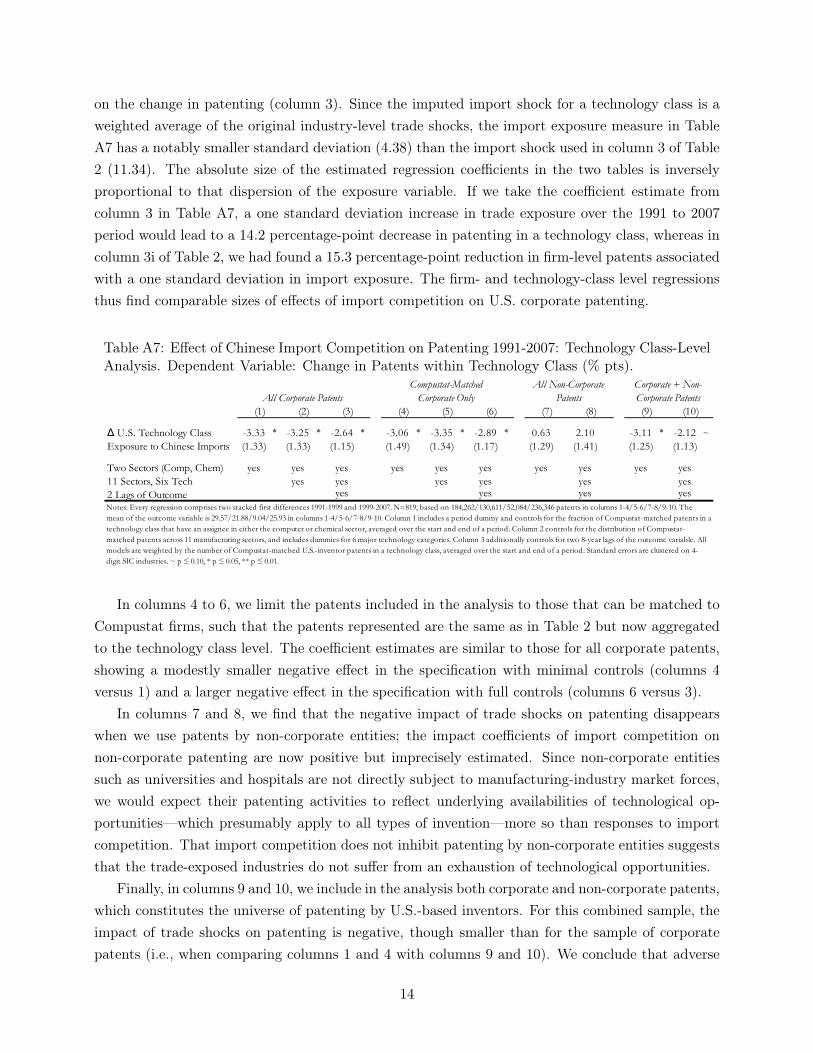
on the change in patenting (column 3). Since the imputed import shock for a technology class is aweighted average of the original industry-level trade shocks, the import exposure measure in TableA7 has a notably smaller standard deviation (4.38) than the import shock used in column 3 of Table2 (11.34). The absolute size of the estimated regression coefficients in the two tables is inverselyproportional to that dispersion of the exposure variable. If we take the coefficient estimate fromcolumn 3 in Table A7, a one standard deviation increase in trade exposure over the 1991 to 2007period would lead to a 14.2 percentage-point decrease in patenting in a technology class, whereas incolumn 3i of Table 2, we had found a 15.3 percentage-point reduction in firm-level patents associatedwith a one standard deviation in import exposure. The firm- and technology-class level regressionsthus find comparable sizes of effects of import competition on U.S. corporate patenting.
Table A7: Effect of Chinese Import Competition on Patenting 1991-2007: Technology Class-LevelAnalysis. Dependent Variable: Change in Patents within Technology Class (% pts).
Two Sectors (Comp, Chem) yes yes yes yes yes yes yes yes yes yes11 Sectors, Six Tech yes yes yes yes yes yes2 Lags of Outcome yes yes yes yes
Corporate + Non-Corporate Patents
(9) (10)
Δ U.S. Technology Class Exposure to Chinese Imports
Notes: Every regression comprises two stacked first differences 1991-1999 and 1999-2007. N=819, based on 184,262/130,611/52,084/236,346 patents in columns 1-4/5-6/7-8/9-10. The mean of the outcome variable is 29.57/21.88/9.04/25.93 in columns 1-4/5-6/7-8/9-10. Column 1 includes a period dummy and controls for the fraction of Compustat-matched patents in a technology class that have an assignee in either the computer or chemical sector, averaged over the start and end of a period. Column 2 controls for the distribution of Compustat-matched patents across 11 manufacturing sectors, and includes dummies for 6 major technology categories. Column 3 additionally controls for two 8-year lags of the outcome variable. All models are weighted by the number of Compustat-matched U.S.-inventor patents in a technology class, averaged over the start and end of a period. Standard errors are clustered on 4-digit SIC industries. ~ p ≤ 0.10, * p ≤ 0.05, ** p ≤ 0.01.
(1) (2) (3)All Corporate Patents
Compustat-Matched Corporate Only
(4) (5) (6)
All Non-Corporate Patents
(7) (8)
In columns 4 to 6, we limit the patents included in the analysis to those that can be matched toCompustat firms, such that the patents represented are the same as in Table 2 but now aggregatedto the technology class level. The coefficient estimates are similar to those for all corporate patents,showing a modestly smaller negative effect in the specification with minimal controls (columns 4versus 1) and a larger negative effect in the specification with full controls (columns 6 versus 3).
In columns 7 and 8, we find that the negative impact of trade shocks on patenting disappearswhen we use patents by non-corporate entities; the impact coefficients of import competition onnon-corporate patenting are now positive but imprecisely estimated. Since non-corporate entitiessuch as universities and hospitals are not directly subject to manufacturing-industry market forces,we would expect their patenting activities to reflect underlying availabilities of technological op-portunities—which presumably apply to all types of invention—more so than responses to importcompetition. That import competition does not inhibit patenting by non-corporate entities suggeststhat the trade-exposed industries do not suffer from an exhaustion of technological opportunities.
Finally, in columns 9 and 10, we include in the analysis both corporate and non-corporate patents,which constitutes the universe of patenting by U.S.-based inventors. For this combined sample, theimpact of trade shocks on patenting is negative, though smaller than for the sample of corporatepatents (i.e., when comparing columns 1 and 4 with columns 9 and 10). We conclude that adverse
14
trade shocks reduce in patenting for all types of corporate entities, whether or not these firms arepublicly listed, but has no such effect on non-corporate entities.
B.4 Heterogeneity by Inventor and Firm Locations
Many of the companies listed in Compustat are multinational enterprises with subsidiaries locatedaround the world. Most are owned by parent companies headquartered in the U.S., though some areowned by parent companies located abroad.13 Through offshoring, multinational companies haverelocated a substantial share of their U.S. manufacturing employment to their subsidiaries or toarms-length contractors located in other countries (Harrison and McMillan, 2011). In Table A8,we examine whether greater import competition may have had differential effects on innovation athome versus innovation abroad in a manner analogous to the impacts of trade on the global locationof employment engaged in production.
The data allow us to track the location of innovation via the address of the lead inventor listedin the patent application. In its worldwide operations, IBM, for instance, has 12 R&D labs locatedin 10 different countries.14 Presumably, patents created in one of IBM’s three U.S.-based labs wouldlist the lead inventor as being located domestically, whereas patents created in one of IBM’s labs inAustralia, Israel, or Switzerland would list the lead inventor as being located abroad. To review thesample definitions used in the analysis so far, our baseline specification includes all Compustat firms,whether or not the firm’s parent company is U.S. owned. It also restricts patents to those whoselead inventor has a U.S. address, and thus captures innovation within the U.S. In what follows,we differentiate between firms that are owned by a U.S. parent company versus a foreign parentcompany and expand the sample to include patents created by inventors located abroad.
Column 1 of Table A8 repeats our main specification from model 3h in Table 2, which comprisesall firms with patents by U.S.-based primary inventors. We next split that sample into firms whoseheadquarters are in the U.S. and firms that are based abroad. U.S. firms account for the a largemajority of corporate patents by U.S. inventors, and the impact of import competition on theirpatent output is similar to the baseline estimate (−1.17, column 2). The innovation by foreigncompanies is covered in our data only to a limited extent, namely for foreign firms that both patenttheir innovations in the U.S. and have a listing at a U.S. stock market. For this select sample offoreign firms, there is again a negative impact of Chinese import competition on the patent outputby their U.S.-based inventors (−2.23, column 3).
13All firms in Compustat are publicly listed in the U.S., whereas some have parent firms located in the U.S. andothers have parent firms located in other countries.
14See https://www.research.ibm.com/labs/.
15
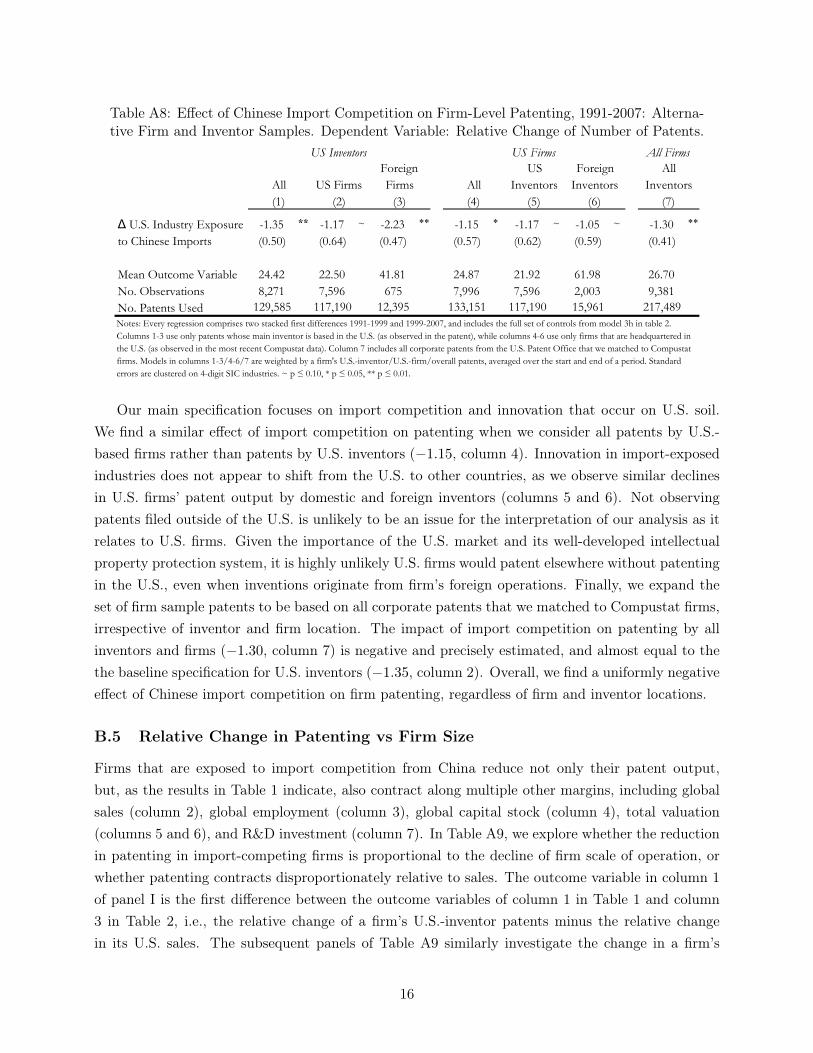
Table A8: Effect of Chinese Import Competition on Firm-Level Patenting, 1991-2007: Alterna-tive Firm and Inventor Samples. Dependent Variable: Relative Change of Number of Patents.
Table A8. Effect of Chinese Import Competition on Firm-Level Patenting, 1991-2007: Alternative Firm and Inventor Samples. Dependent Variable: Relative Change of Number of Patents.
Notes: Every regression comprises two stacked first differences 1991-1999 and 1999-2007, and includes the full set of controls from model 3h in table 2. Columns 1-3 use only patents whose main inventor is based in the U.S. (as observed in the patent), while columns 4-6 use only firms that are headquartered in the U.S. (as observed in the most recent Compustat data). Column 7 includes all corporate patents from the U.S. Patent Office that we matched to Compustat firms. Models in columns 1-3/4-6/7 are weighted by a firm's U.S.-inventor/U.S.-firm/overall patents, averaged over the start and end of a period. Standard errors are clustered on 4-digit SIC industries. ~ p ≤ 0.10, * p ≤ 0.05, ** p ≤ 0.01.
Δ U.S. Industry Exposure to Chinese Imports
All(1)
US FirmsAll
Inventors
All Firms
(7)
US Firms
(2)
Foreign Firms
(3)All(4)
Our main specification focuses on import competition and innovation that occur on U.S. soil.We find a similar effect of import competition on patenting when we consider all patents by U.S.-based firms rather than patents by U.S. inventors (−1.15, column 4). Innovation in import-exposedindustries does not appear to shift from the U.S. to other countries, as we observe similar declinesin U.S. firms’ patent output by domestic and foreign inventors (columns 5 and 6). Not observingpatents filed outside of the U.S. is unlikely to be an issue for the interpretation of our analysis as itrelates to U.S. firms. Given the importance of the U.S. market and its well-developed intellectualproperty protection system, it is highly unlikely U.S. firms would patent elsewhere without patentingin the U.S., even when inventions originate from firm’s foreign operations. Finally, we expand theset of firm sample patents to be based on all corporate patents that we matched to Compustat firms,irrespective of inventor and firm location. The impact of import competition on patenting by allinventors and firms (−1.30, column 7) is negative and precisely estimated, and almost equal to thethe baseline specification for U.S. inventors (−1.35, column 2). Overall, we find a uniformly negativeeffect of Chinese import competition on firm patenting, regardless of firm and inventor locations.
B.5 Relative Change in Patenting vs Firm Size
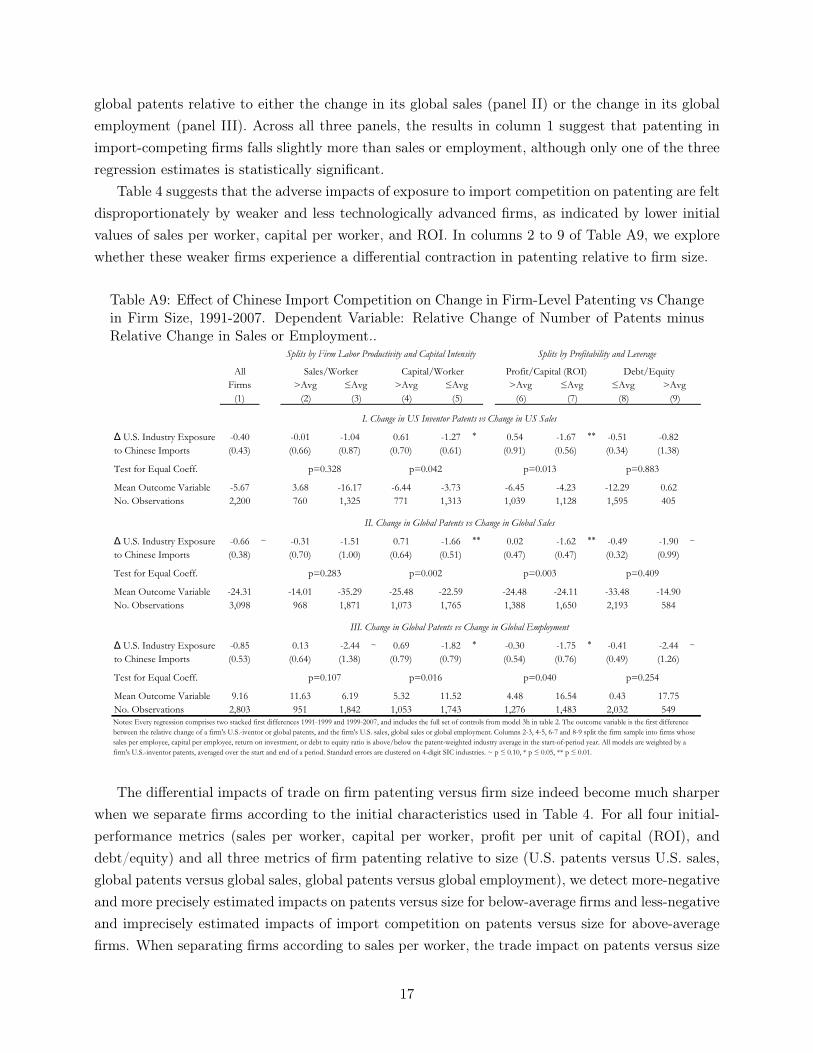
Firms that are exposed to import competition from China reduce not only their patent output,but, as the results in Table 1 indicate, also contract along multiple other margins, including globalsales (column 2), global employment (column 3), global capital stock (column 4), total valuation(columns 5 and 6), and R&D investment (column 7). In Table A9, we explore whether the reductionin patenting in import-competing firms is proportional to the decline of firm scale of operation, orwhether patenting contracts disproportionately relative to sales. The outcome variable in column 1of panel I is the first difference between the outcome variables of column 1 in Table 1 and column3 in Table 2, i.e., the relative change of a firm’s U.S.-inventor patents minus the relative changein its U.S. sales. The subsequent panels of Table A9 similarly investigate the change in a firm’s
16
global patents relative to either the change in its global sales (panel II) or the change in its globalemployment (panel III). Across all three panels, the results in column 1 suggest that patenting inimport-competing firms falls slightly more than sales or employment, although only one of the threeregression estimates is statistically significant.
Table 4 suggests that the adverse impacts of exposure to import competition on patenting are feltdisproportionately by weaker and less technologically advanced firms, as indicated by lower initialvalues of sales per worker, capital per worker, and ROI. In columns 2 to 9 of Table A9, we explorewhether these weaker firms experience a differential contraction in patenting relative to firm size.
Table A9: Effect of Chinese Import Competition on Change in Firm-Level Patenting vs Changein Firm Size, 1991-2007. Dependent Variable: Relative Change of Number of Patents minusRelative Change in Sales or Employment..
I. Change in US Inventor Patents vs Change in US Sales
II. Change in Global Patents vs Change in Global Sales
III. Change in Global Patents vs Change in Global Employment
Δ U.S. Industry Exposure to Chinese Imports
Notes: Every regression comprises two stacked first differences 1991-1999 and 1999-2007, and includes the full set of controls from model 3h in table 2. The outcome variable is the first difference between the relative change of a firm's U.S.-iventor or global patents, and the firm's U.S. sales, global sales or global employment. Columns 2-3, 4-5, 6-7 and 8-9 split the firm sample into firms whose sales per employee, capital per employee, return on investment, or debt to equity ratio is above/below the patent-weighted industry average in the start-of-period year. All models are weighted by a firm's U.S.-inventor patents, averaged over the start and end of a period. Standard errors are clustered on 4-digit SIC industries. ~ p ≤ 0.10, * p ≤ 0.05, ** p ≤ 0.01.
Δ U.S. Industry Exposure to Chinese Imports
Δ U.S. Industry Exposure to Chinese Imports
p=0.328 p=0.042 p=0.013 p=0.883
p=0.409p=0.003p=0.002p=0.283
p=0.107
(6) (7) (8) (9)>Avg ≤Avg >Avg ≤Avg >Avg ≤Avg
p=0.016 p=0.040 p=0.254
Splits by Firm Labor Productivity and Capital Intensity Splits by Profitability and Leverage
The differential impacts of trade on firm patenting versus firm size indeed become much sharperwhen we separate firms according to the initial characteristics used in Table 4. For all four initial-performance metrics (sales per worker, capital per worker, profit per unit of capital (ROI), anddebt/equity) and all three metrics of firm patenting relative to size (U.S. patents versus U.S. sales,global patents versus global sales, global patents versus global employment), we detect more-negativeand more precisely estimated impacts on patents versus size for below-average firms and less-negativeand imprecisely estimated impacts of import competition on patents versus size for above-averagefirms. When separating firms according to sales per worker, the trade impact on patents versus size
17
is negative for below-average firms under all three patent-size metrics but is marginally significantonly for global patents versus global employment in column 3, panel III (β = −2.44, t = −1.8).However, when examine below-average firms based on capital per worker (column 5) or ROI (column7), the impact of import competition is negative and statistically significant for all three measuresof patents versus size. The patent-size relative impacts tend to be a bit larger in absolute value forglobal patents versus global employment—as seen in column 5, panel III (β = −1.82, t = −2.3) andcolumn 7, panel III (β = −1.75, t = −2.3)—and a bit smaller in absolute value for U.S. patentsversus U.S. sales—as seen in column 5, panel I (β = −1.27, t = −2.1) and column 7, panel I(β = −1.67, t = −3.0). Overall, we interpret these results as strong evidence that for initially less-capital-intensive and lower-profit firms, import competition reduces patenting above and beyond itsdepressive effects on firm scale.
References
Balsmeier, Benjamin, Mohamad Assaf, Tyler Chesebro, Gabe Fierro, Kevin Johnson,Scott Johnson, Guan-Cheng Li, Sonja Lück, Doug O’Reagan, Bill Yeh et al., “Machinelearning and natural language processing on the patent corpus: Data, tools, and new measures,”Journal of Economics & Management Strategy, 2018, 27 (3), 535–553.
Bernard, Andrew B., J. Bradford Jensen, and Peter K. Schott, “Survival of the best fit:Exposure to low-wage countries and the (uneven) growth of U.S. manufacturing plants,” Journalof International Economics, January 2006, 68 (1), 219–237.
Bessen, James, “NBER PDP Project User Documentation: Matching Patent Data to CompustatFirms,” 2009.
Harrison, Ann and Margaret McMillan, “Offshoring jobs? Multinationals and US manufac-turing employment,” Review of Economics and Statistics, 2011, 93 (3), 857–875.
Jaffe, Adam B. and Manuel Trajtenberg, Patents, citations, and innovations: A window onthe knowledge economy, MIT press, 2002.
Li, Guan-Cheng, Ronald Lai, Alexander D’Amour, David M. Doolin, Ye Sun, Vetle I.Torvik, Amy Z. Yu, and Lee Fleming, “Disambiguation and co-authorship networks of theU.S. patent inventor database (1975-2010),” Research Policy, July 2014, 43 (6), 941–955.
Morrison, Greg, Massimo Riccaboni, and Fabio Pammolli, “Disambiguation of patent in-ventors and assignees using high-resolution geolocation data,” Scientific data, 2017, 4, 170064.
Trajtenberg, Manuel, “A penny for your quotes: patent citations and the value of innovations,”The Rand Journal of Economics, 1990, pp. 172–187.
18
Ventura, Samuel L, Rebecca Nugent, and Erica RH Fuchs, “Seeing the non-stars:(some)sources of bias in past disambiguation approaches and a new public tool leveraging labeledrecords,” Research Policy, 2015, 44 (9), 1672–1701.