Online Data, Fixed Effects and the Construction of High-Frequency Price Indexes Jan de Haan* and Rens Hendriks** * Statistics Netherlands / Delft University of Technology ** Statistics Netherlands EMG Workshop 2013
Transcript
Online Data, Fixed Effects and the Construction of High-Frequency Price Indexes
Jan de Haan* and Rens Hendriks**
* Statistics Netherlands / Delft University of Technology ** Statistics Netherlands
EMG Workshop 2013
2
Aims of the paper
• Explain why the multilateral Time-Product Dummy index (TPD index) differs from its chained matched-model counterpart.
• Show that the multilateral TPD or ‘fixed effects’ method does not produce quality-adjusted price indexes.
• Investigate whether the TPD method is useful for estimating high-frequency price indexes from online data (for goods where quality change is not a major concern).
3
Outline
• Background
• Time dummy hedonic price indexes
• Time-product dummy indexes
• Unmatched items and the time-product dummy index
• A comparison with the GEKS-Jevons index
• Issues with daily online data and daily indexes
• Empirical results
• Conclusions
4
Background
• Possible use by Stats Netherlands of online prices obtained through web scraping
Efficiency reasons
Daily observations: high-frequency price indexes possible
However, no quantity information
• Choice of index number method
Diewert (2004): TPD method produces a matched-model index in the bilateral (two-period) case.
Aizcorbe, Corrado and Doms (2003): TPD produces quality-adjusted price index in the multilateral (many-period) case. This seems to good to be true.
5
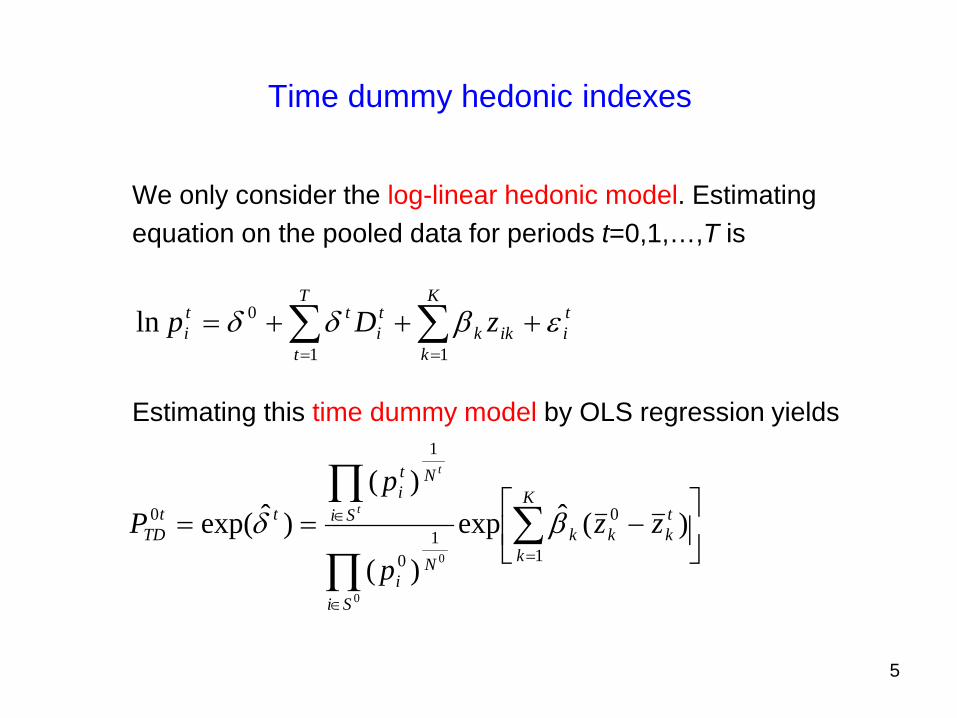
Time dummy hedonic indexes
We only consider the log-linear hedonic model. Estimating equation on the pooled data for periods t=0,1,…,T is
Estimating this time dummy model by OLS regression yields
tiik
K
kk
T
t
ti
tti zDp εβδδ +++= ∑∑
== 11
0ln
−== ∑
∏
∏=
∈
∈K
k
tkkk
Si
Ni
Si
Nti
ttTD zz
p
pP
t
t
1
01
0
1
0 )(ˆexp)(
)()ˆexp(
0
0
βδ
6
Time dummy hedonic indexes
In words: the time dummy index can be written as the product of the ratio of geometric mean prices and a quality-adjustment factor.
This exponential factor depends on the changes over time of the average characteristics.
The time dummy index is transitive and can be written as a chain index:
−= ∑∏
∏
∏=
−
=
∈
−
∈
−
−
K
kkkk
t
Si
Ni
Si
Ni
tTD zz
p
pP
1
1
11
1
1
0 )(ˆexp)(
)(
1
1
ττ
τ τ
τ
β
τ
τ
τ
τ
7
Time-product dummy (TPD) indexes
Characteristics and their parameters are assumed constant over time in the time dummy model.
No characteristics available: replace unobservable hedonic effects by item-specific fixed values .
Fixed effects or time-product dummy model
Counterpart of Country-Product Dummy (CPD) model for cross-country comparisons
∑ =
K
k ikk z1β iγ
ti
N
iii
T
t
ti
tti DDp εγδα +++= ∑∑
−
==
1
11ln
8
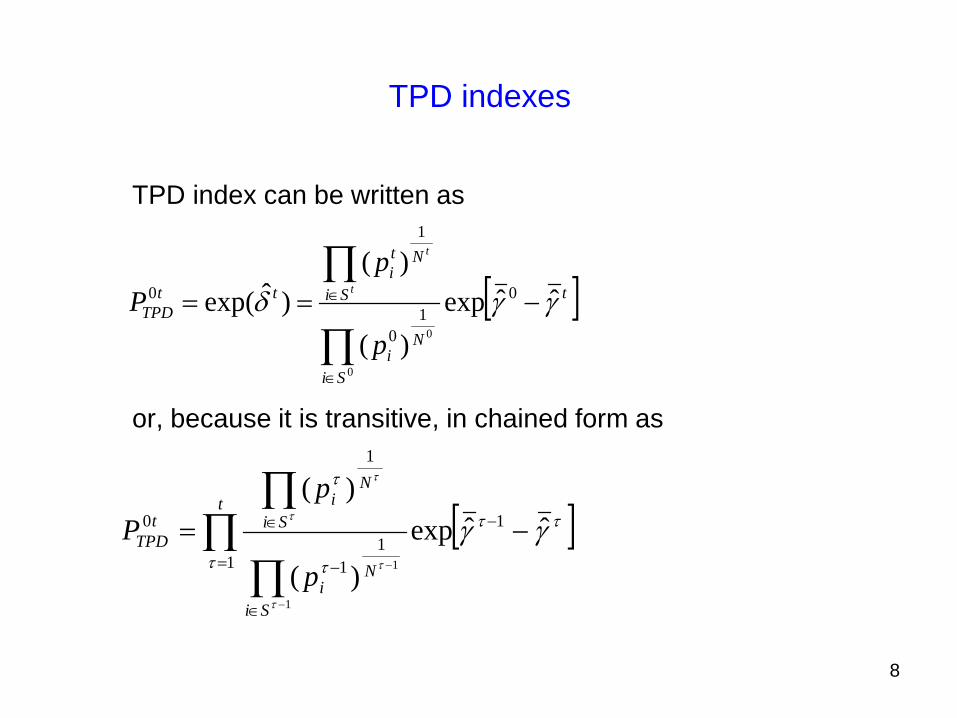
TPD indexes
TPD index can be written as
or, because it is transitive, in chained form as
[ ]t
Si
Ni
Si
Nti
ttTPD
p
pP t
t
γγδ ˆˆexp)(
)()ˆexp( 0
10
1
0
0
0
−==
∏
∏
∈
∈
[ ]ττ
τ τ
τ
γγ
τ
τ
τ
τ
ˆˆexp)(
)(1
11
1
1
0
1
1
−= −
=
∈
−
∈∏∏
∏
−
−
t
Si
Ni
Si
Ni
tTPD
p
pP
9
Unmatched items and the TPD index
How are unmatched items treated in the TPD index?
Chain link of TPD index can be written as the product of the adjacent-period matched-model Jevons index and the effects of new items and disappearing items:
ttD
ttM
ttM
ttD
ttD
ttN
ttM
ttM
ttM
ttN
ttN
ttM
f
Si
N
i
ti
Si
N
i
ti
f
Si
Si
N
i
ti
Si
N
i
ti
N
ti
ti
tTPD
tTPD
p
p
p
p
pp
PP
,1
,1
,1
,1
,1
,1
,1
,1
,1
,1
,1
,1
11
11
1
1
1
11,0
0
)ˆexp(
)ˆexp(
)ˆexp(
)ˆexp(
−
−
−
−
−
−
−
−
−
−
−
−
−
∈
−
∈
−
∈
∈
∈
−−
=
∏
∏∏
∏
∏
γ
γ
γ
γ
10
Unmatched items and the TPD index
Take clothing, for example. Prices typically decline over time, so a chained-matched model index will have a downward trend.
If TPD method would work, i.e. if fixed effects approximate hedonic effects well, then the unmatched items are likely to counter this downward trend – average quality-adjusted prices of new (disappearing) items likely above (below) average quality-adjusted prices of matched items.
But does the TPD method really account for new and disappearing items?
11
Unmatched items and the TPD index
No, it doesn’t.
• Items which are observed only once during the whole sample period – are zeroed out: they are effectively dropped from the estimation.
• Thus, it still is a matched-model approach and does not adjust for quality change, even though ….
• …. theTPD index differs from the chained matched model Jevons as items which are ‘new’ or ‘disappearing’ in period-on-period comparisons are often observed multiple times during the sample period.
12
A comparison with the GEKS-Jevons index
Ivancic, Diewert and Fox (2011) and others adapted the GEKS method for making transitive price comparisons across countries to price comparisons across time.
and are bilateral price indexes between 0 and l, and l and t; l (l=0,…,T) is the link period.
Online data: no quantity information. Use of bilateral Jevons indexes (rather than Fisher indexes).
( )∏=
+×=T
l
TltltGEKS PPP
0
11
00
lP 0 ltP
13
A comparison with the GEKS-Jevons index
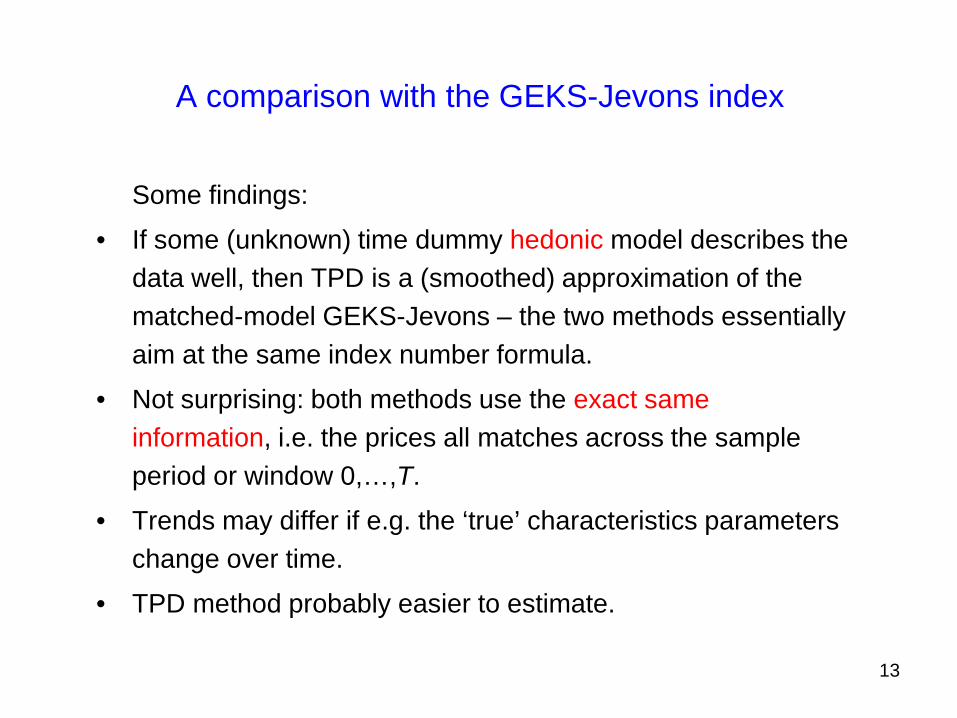
Some findings:
• If some (unknown) time dummy hedonic model describes the data well, then TPD is a (smoothed) approximation of the matched-model GEKS-Jevons – the two methods essentially aim at the same index number formula.
• Not surprising: both methods use the exact same information, i.e. the prices all matches across the sample period or window 0,…,T.
• Trends may differ if e.g. the ‘true’ characteristics parameters change over time.
• TPD method probably easier to estimate.
14
Issues with daily online data and daily indexes
Rolling window approach can overcome revisions problem.
Window length: no longer than maximum period items are offered for sale. Depends on
• type of product;
• market circumstances;
• policy of assigning and changing item identifiers.
In practice: items identified by article numbers (EANs in scanner data) or web IDs (online data).
These identifiers may be too detailed – similar items having different IDs.
15
Issues with daily online data and daily indexes
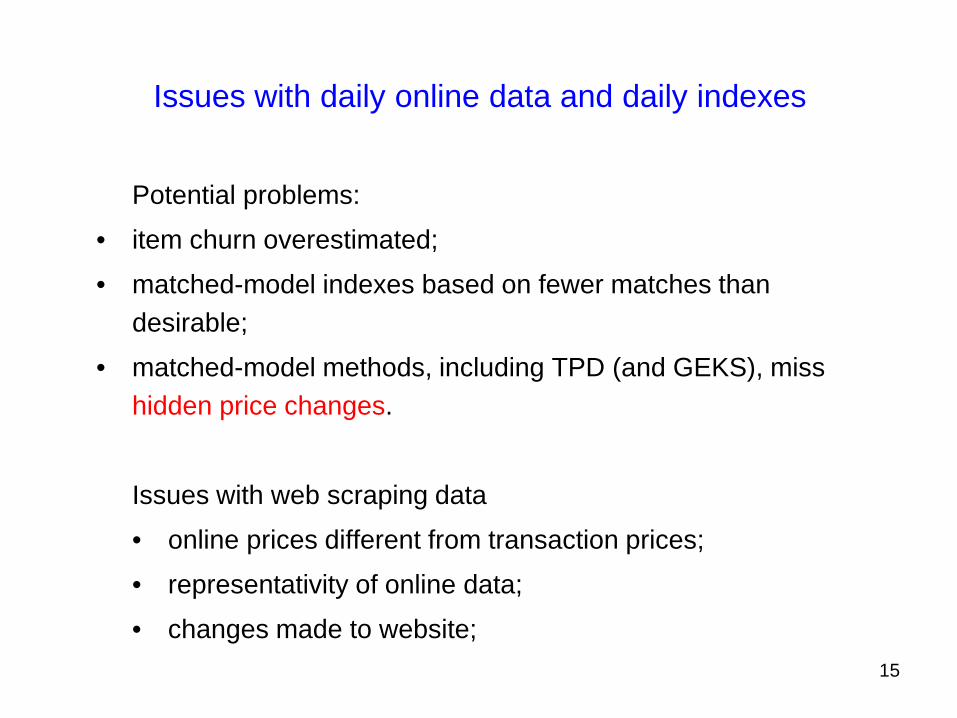
Potential problems:
• item churn overestimated;
• matched-model indexes based on fewer matches than desirable;
• matched-model methods, including TPD (and GEKS), miss hidden price changes.
Issues with web scraping data
• online prices different from transaction prices;
• representativity of online data;
• changes made to website;
16
Issues with daily online data and daily indexes
• treatment of sales versus regular prices - daily ‘trajectory’ in offer prices does not necessarily reflect correct trend from the average consumer’s point of view due to promotional sales;
• volatility of daily price indexes;
• monthly unit values not possible with online data.
Note: scanner data might not be an ideal source for online purchases, particularly on clothing.
Potential problem: registration of goods which are returned by customers.
17
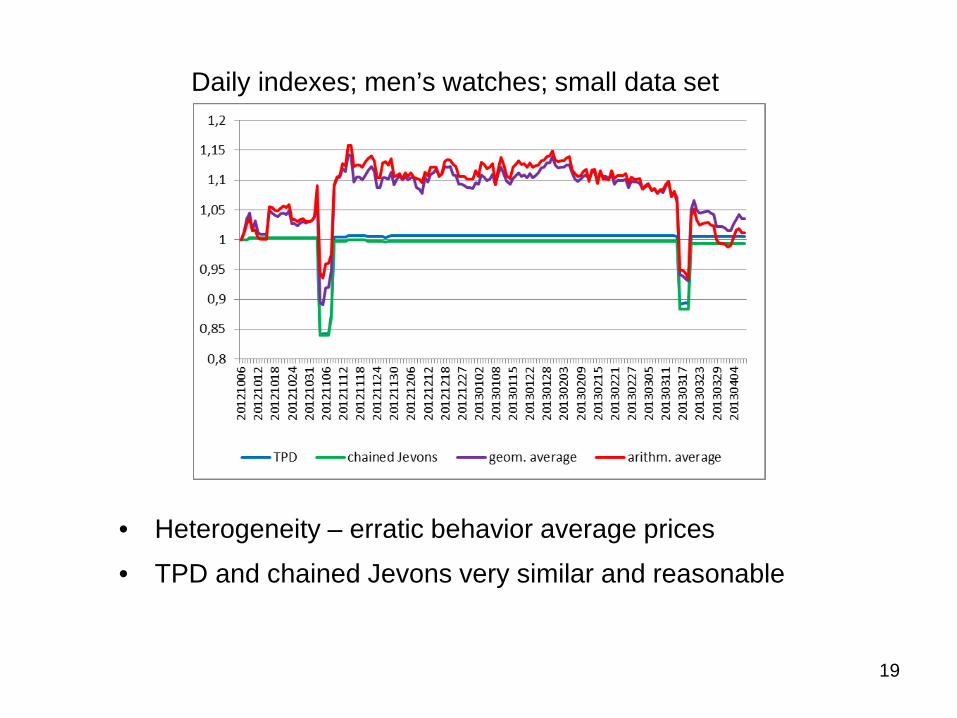
Empirical results
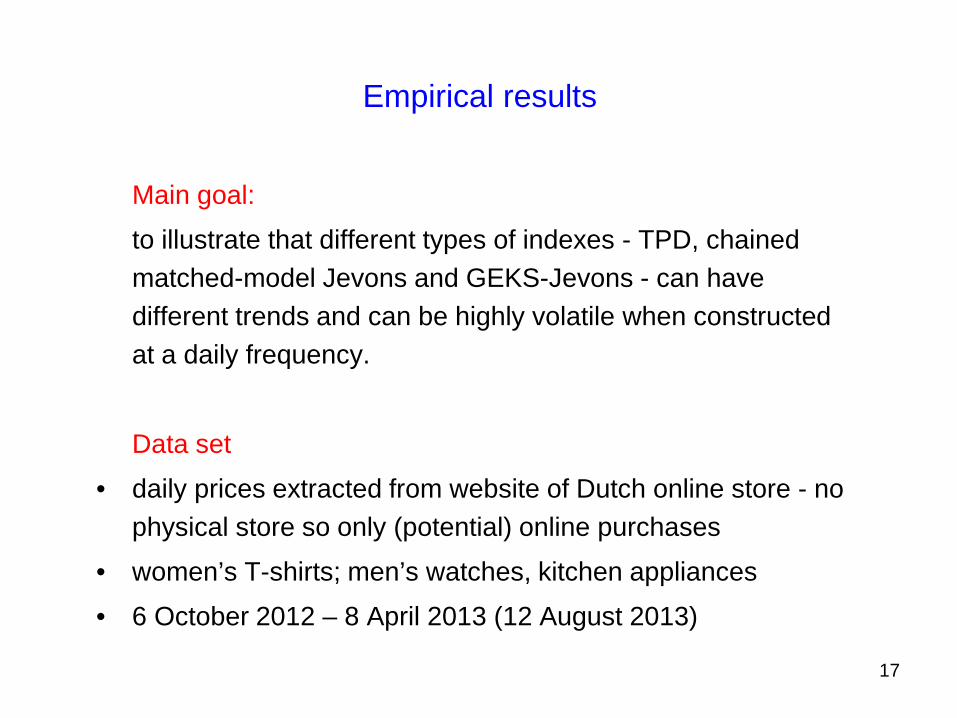
Main goal:
to illustrate that different types of indexes - TPD, chained matched-model Jevons and GEKS-Jevons - can have different trends and can be highly volatile when constructed at a daily frequency.
Data set
• daily prices extracted from website of Dutch online store - no physical store so only (potential) online purchases


![[Minor CrossMedia] Hot Or Not Ebooks Rens](https://static.documents.pub/doc/80x56/558e4da31a28ab13318b4616/minor-crossmedia-hot-or-not-ebooks-rens.jpg)


