ONLINE RETAIL IN EMERGING MARKETS 2018 PUBLICATION DATE: AUGUST 2018 PAGE 2 GENERAL INFORMATION I PAGE 3 KEY FINDINGS I PAGE 4-16 TABLE OF CONTENTS I PAGE 17 REPORT-SPECIFIC SAMPLE CHARTS I PAGE 18 METHODOLOGY I PAGE 19 RELATED REPORTS I PAGE 20 CLIENTS I PAGE 21-22 FREQUENTLY ASKED QUESTIONS PAGE 23 ORDER FORM I PAGE 24 TERMS AND CONDITIONS
Transcript
ONLINE RETAIL IN EMERGING MARKETS 2018 PUBLICATION DATE: AUGUST 2018
PAGE 2 GENERAL INFORMATION I PAGE 3 KEY FINDINGS I PAGE 4-16 TABLE OF CONTENTS I PAGE 17 REPORT-SPECIFIC SAMPLE
CHARTS I PAGE 18 METHODOLOGY I PAGE 19 RELATED REPORTS I PAGE 20 CLIENTS I PAGE 21-22 FREQUENTLY ASKED QUESTIONS
PAGE 23 ORDER FORM I PAGE 24 TERMS AND CONDITIONS
2
2
PRODUCT DETAILS Title:
Type of Product:
Category:
Covered Regions:
Covered Countries:
Language:
Formats:
Number of Charts:
Online Retail in Emerging Markets 2018
Report
B2C E-Commerce
Africa, Asia-Pacific, Europe, Latin America, Middle East
Argentina, Brazil, China, Egypt, India, Indonesia, Israel, Mexico,
Nigeria, Poland, Russia, , Saudi Arabia, South Africa, Thailand, Turkey,
UAE
English
PDF & PowerPoint
274
PRICES* Single User License:
Site License:
Global Site License:
€ 3,450 (exc. VAT)
€ 5,175 (exc. VAT)
€ 6,900 (exc. VAT)
We occasionally offer a discount on selected reports as newer reports are published.
Please see the most up-to-date pricing on our website www.ystats.com.
QUESTIONS
ANSWERED
IN THIS REPORT
What are the top emerging B2C E-Commerce markets worldwide?
How fast are online retail sales growing in the emerging economies?
What is the projection for B2c E-Commerce market size in BRICs by 2025?
How do the preferences of online shoppers vary across the emerging markets?
Which factors need to be taken into account when expanding to the fast growing E-Commerce
markets such as in Southeast Asia?
SECONDARY MARKET
RESEARCH
Our reports are exclusively based on secondary market research. Our researchers derive
information and data from a variety of reliable published sources and compile the data into
understandable and easy-to-use formats.
ADVANTAGES Maximum Objectivity
Reliable Sources
Up-To-Date Analysis
Boardroom-Ready PowerPoint Presentations
Guidance For Strategic Company Decisions
ONLINE RETAIL IN EMERGING MARKETS 2018
EMERGING MARKETS DRIVE THE GROWTH OF ONLINE RETAIL SALES WORLDWIDE
Global online retail sales are rising at double-digit rates, with the emerging markets
across Asia, Eastern Europe, Latin America, the Middle East and Africa growing even faster.
According to one forecast cited in the yStats.com report, the global regions dominated by
emerging economies see significantly higher growth rates in B2C E-Commerce revenues
than the established online markets in North America and Western Europe.
The four leading emerging markets by online retail growth potential are China, India,
Russia and Brazil, together projected to generate more than USD 2 trillion of E-Commerce
sales by 2025. Other growth champions covered in the yStats.com report include the
countries of Southeast Asia, Mexico, Turkey, Egypt and others. In many of these and other
emerging economies the online retail market is in early stages of development, accounting
for only a small single-digit percentage of overall retail sales, signaling room for further
growth. China is the one exception with already a double-digit share of retail transacted
online.
The world’s largest E-Commerce companies, Amazon and Alibaba, intensify their
efforts to tap into the fast-growing online retail market in emerging economies. Amazon
acquired the Middle East’s leading E-Commerce platform Souq.com in 2017, while Alibaba
directed its investments into Southeast Asia. Multiple local players also benefit from the E-
Commerce boom in emerging markets, such as Flipkart in India, Wildberries in Russia, and
MercadoLibre in Latin America.
ONLINE RETAIL IN EMERGING MARKETS 2018
3
MANAGEMENT SUMMARY
GLOBAL DEVELOPMENTS
Global Retail E-Commerce (incl. B2C and C2C) Sales, in USD billion, and Share of Total Retail Sales, in %, 2016 -
2021f
Global Retail E-Commerce (incl. B2C and C2C) Shares of the Top 5 E-Commerce Markets, in %, 2017e & 2021f
Retail E-Commerce Sales Forecast in Selected Emerging Markets, incl. Brazil, China, India, Indonesia, Mexico,
Russia and Turkey, in USD billion, 2025f
Breakdown of Global B2C E-Commerce Sales by Regions, in %, 2017e
Global B2C E-Commerce Sales, in USD billion, B2C E-Commerce Share of Total Retail Sales, in %, and CAGR, in
%, by Region, 2011, 2016 & 2021f
Number of Internet Users, in millions, and Penetration, in % of Population, by Region and Worldwide, 2012-
2017e
Number of Online Shoppers Worldwide, in billions, and Penetration, in % of Internet Users, 2016 - 2021f
Online Shopper Penetration, in % of Internet Users, by Region, 2017e
Top 10 Countries Worldwide by Online Shopper Penetration, in % of Internet Users, incl. Countries in Asia, Q2
2017
Shopping Channels Used at Least Weekly, by In-Store, PC, Tablet and Mobile, in % of Global Online Shoppers,
2013 & 2018e
Global Retail M-Commerce Sales, in USD billion and Share of Retail E-Commerce Sales, in %, 2016 - 2021f
Top 10 Countries by Omnichannel Retail Development Index, on the Scale 1-100, 2017
Cross-Border Share of Global Retail E-Commerce Sales, in %, 2016 & 2022f
Share of Global Domestic and Cross-Border Online Purchases Made on Marketplaces, in %, August 2017
Payment Methods Preferred in E-Commerce, in % of Global Online Shoppers, Q1 2017
Delivery Options Preferred by Online Shoppers When Offered at No Extra Cost, in % Global Online Shoppers,
2017
Online Media Sources Used Regularly to Find Inspiration for Purchases, in % of Global Online Shoppers,
2018e
Reasons For Not Shopping Online, incl. Payment-Related, in % of Global Internet Users Who Do Not Shop
Online, Q1 2017
Ways Used by Online Shoppers to Decrease Online Security Risks, in % of Global Online Shoppers, 2017 &
2018e
Top 10 Online Retailers by Market Share, in % Global B2C E-Commerce Sales, 2016
Share of Online Shoppers Buying From Amazon, by Region and Worldwide, in % Online Shoppers, 2018e
Top 10 E-Commerce Sites, by Total Website Visits, in millions, incl. Top 5 Countries by Share of Visits, in %,
April 2018
ASIA-PACIFIC
3.1. CHINA
3.1.1. OVERVIEW
Overview of B2C E-Commerce Market and International Comparisons, May 2018
3.1.2. TRENDS
M-Commerce Sales, in CNY billion, and Share of Retail E-Commerce Sales, in %, 2015 – 2020f
2
4
1
ONLINE RETAIL IN EMERGING MARKETS 2018
TABLE OF CONTENTS (1 OF 13)
3
5
5
ASIA-PACIFIC (CONT.)
3.1. CHINA (CONT.)
3.1.2. TRENDS (CONT.)
Cross-Border Retail E-Commerce Imports, in USD billion, and Year-on-Year Change, in %, 2016 – 2021f
O2O Approaches Used in Shopping, in % of Urban Middle-Class Internet Users, January 2017
3.1.3. SALES & SHARES
Retail E-Commerce Sales, in USD billion, and CAGR, in %, by Four Comparative Estimates, 2016 – 2021f
Retail E-Commerce Sales, in CNY billion, and CAGR, in %, by Five Comparative Estimates, 2016 – 2020f
E-Commerce Share of Total Retail Sales, in %, by Six Comparative Estimates, 2016 - 2021f
3.1.4. USERS & SHOPPERS
Number of Internet Users, in millions, and Penetration, in % of Population, 2012 - 2017
Number of Online Shoppers, in millions, and Penetration, in % of Internet Users, 2012 - 2017
3.1.5. PRODUCTS
Top 5 Product Categories to Purchase Online, in % of Online Shoppers, March 2017
B2C E-Commerce Sales of Apparel, in CNY billion, and Year-on-Year Change, in %, Q1 2015 - Q2 2017
3.1.6. PAYMENT
Top Payment Methods Used Online, in % of Online Banking Users, 2017
3.1.7. DELIVERY
Reasons to Buy Products Outside Intended Purchases When Shopping Online, in % of Urban Middle-Class
Internet Users, January 2017
Problems Encountered When Shopping Online During a Peak Shopping Period of Sales Event, in % of Online
Shoppers, March 2017
3.1.8. PLAYERS
Top 5 Market Players by Share of B2C E-Commerce GMV, in %, H1 2017
Breakdown of B2C E-Commerce GMV by Market Players, in %, Q4 2016, Q1 2017, Q4 2017 & Q1 2018
3.2. INDIA
3.2.1. OVERVIEW
B2C E-Commerce Market Overview and International Comparisons, May 2018
3.2.2. TRENDS
Smartphone Users, in millions, and Penetration, in % of Population, 2017- 2022f
Categories Researched on the Mobile Internet, in % of Mobile Internet Users, and Breakdown of Daily Time
Spent on Mobile Internet by Category, in %, incl. “Shopping”, Q2 2017
Breakdown of Number and Value of Purchases by Urban Consumers by Channel, incl. “Pure Online”, “Pure
Offline” and “Mixed”, in %, 2017
3.2.3. SALES & SHARES
Retail E-Commerce Sales, in USD billion, and CAGR, in %, by Five Comparative Estimates, 2016-2022f & 2026f
E-Commerce Share of Total Retail Sales, in %, by Five Comparative Estimates, 2016, 2017, 2021f, 2022f & 2026f
3
ONLINE RETAIL IN EMERGING MARKETS 2018
TABLE OF CONTENTS (2 OF 13)
6
6
ASIA-PACIFIC (CONT.)
3.2. INDIA (CONT.)
3.2.4. USERS & SHOPPERS
Number of Internet Users, in millions, by Urban and Rural, October 2014-2017, December 2016-2017e & June
2018f
Online Shopper Penetration, in % of Internet Users, by Five Comparative Estimates, 2016 - 2022f & 2026f
3.2.5. PRODUCTS
Breakdown of E-Commerce Sales by Segments, in INR billion, incl. “Travel”, “Retail”, “Online Grocery and Food
Delivery”, and “Other Services”, 2015 - 2017e
Breakdown of Retail E-Commerce Sales by Sub-Categories, in INR billion and in %, 2016
3.2.6. PAYMENT
Share of Urban Online Shoppers Who Switched from Cash on Delivery to Online Payment Methods Following
Demonetization, in % of Online Shoppers, 2017
Breakdown Payment Methods Preferred in E-Commerce, in % of Urban Online Shoppers, 2017
3.2.7. DELIVERY
E-Commerce Logistics Market Size, in USD billion, and Average Logistics Cost, in % of Net Merchandise Value,
2015 & 2020f
3.2.8. PLAYERS
Overview of B2C E-Commerce Players, June 2018
B2C E-Commerce Market Shares of the Top 9 Players, in %, 2017
3.3. INDONESIA
3.3.1. OVERVIEW
B2C E-Commerce Market Overview and International Comparisons, March 2018
3.3.2. TRENDS
Breakdown of Devices Used to Access the Internet, in % of Internet Users, 2017
Activities Performed via Smartphone, incl. “Shopping Online”, in % of Smartphone Users, July 2017
Breakdown of Frequency of Buying Goods in Social Networks, in % of Social Network Users, June 2017
3.3.3. SALES & SHARES
Retail E-Commerce Sales, in USD billion, 2016 & 2021f
Retail E-Commerce Sales, in USD billion, 2018f & 2021f
E-Commerce Share of Retail Sales, in %, 2016
3.3.4. USERS & SHOPPERS
Internet Penetration, in % of Individuals, 2017 & 2022f
Online Shopper Penetration, in % of Internet Users, 2017
3.3.5. PRODUCTS
Share of Online Shoppers Who Prefer to Buy Selected Product Categories Online, in %, by Category, 2016
ONLINE RETAIL IN EMERGING MARKETS 2018
TABLE OF CONTENTS (3 OF 13)
3
7
7
ASIA-PACIFIC (CONT.)
3.3. INDONESIA (CONT.)
3.3.6. PAYMENT
Top 3 Payment Methods Used in E-Commerce, in % of Internet Users, 2016
3.3.7. DELIVERY
Overview of Shipping Features Offered to Selected Major E-Commerce Websites, incl. Free Shipping and
Order Tracking, November 2017
3.3.8. PLAYERS
Overview of E-Commerce Players, March 2018
Top Local E-Commerce Websites by Unique Visitors, in thousands, by Total, Mobile and Desktop, incl. Total
Minutes Spent, in millions, Total Views, in millions, and Average Minutes per View, June 2017
3.4. THAILAND
3.4.1. OVERVIEW
B2C E-Commerce Market Overview and International Comparisons, April 2018
3.4.2. TRENDS
Breakdown of B2C E-Commerce Sales by Mobile and Desktop, in %, 2017e & 2021f
Top Platforms Used to Purchase Products Online, incl. “Facebook, Instagram”, in % of Online Shoppers,
February 2017
3.4.3. SALES & SHARES
B2C E-Commerce Sales of Companies in Thailand, in THB billion, 2014-2017e
B2C E-Commerce Sales, in USD billion, 2016 & 2021f
B2C E-Commerce Share of Total Retail Sales, in %, 2016
3.4.4. USERS & SHOPPERS
Internet Penetration, in % of Individuals, 2011 - 2017e
Number of Online Shoppers, in thousands, and Penetration, in % of Internet Users, by Location, Gender, and
Age Group, Q1 2016 & Q1 2017
3.4.5. PRODUCTS
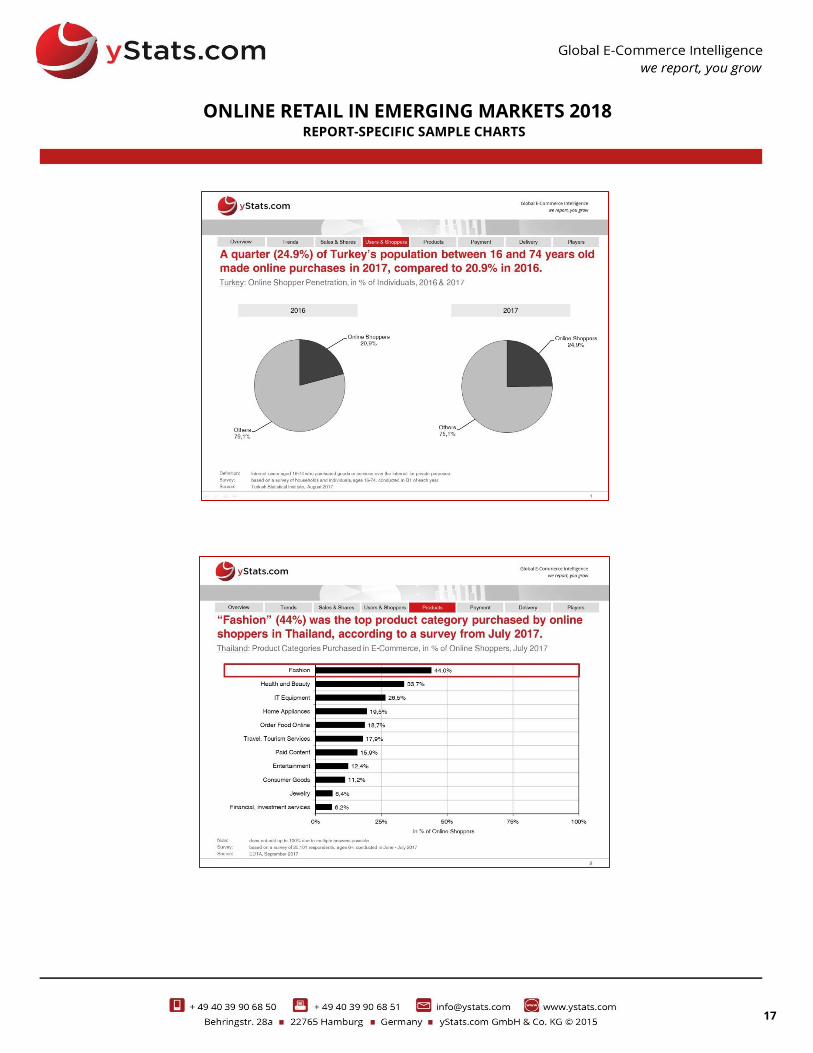
Product Categories Purchased in E-Commerce, in % of Online Shoppers, July 2017
3.4.6. PAYMENT
Payment Methods Used in E-Commerce, by Number of Online Shoppers and Percentage of Online Shoppers,
Q1 2016 & Q1 2017
3.4.7. DELIVERY
Reasons to Choose an E-Commerce Website to Purchase From, incl. Delivery-Related, in % of Online
Shoppers, June 2017
3.4.8. PLAYERS
Overview of E-Commerce Players, March 2018
Breakdown E-Commerce Websites Most Frequently Purchased from, in % of Online Shoppers, June 2017
ONLINE RETAIL IN EMERGING MARKETS 2018
TABLE OF CONTENTS (4 OF 13)
3
8
8
EUROPE
4.1. RUSSIA
4.1.1. OVERVIEW
B2C E-Commerce Market Overview and International Comparisons, July 2017
4.1.2. TRENDS
M-Commerce Share of B2C E-Commerce Sales, in %, 2016
B2C E-Commerce Sales, in RUB billion, and Breakdown by Domestic Sales and Cross-Border Imports, in %,
2011 – 2017
4.1.3. SALES & SHARES
B2C E-Commerce Sales, in RUB billion, by Five Comparative Estimates, 2014 – 2016, and Forecasts, in RUB
billion, 2018f & 2020f
B2C E-Commerce Share of Total Retail Sales, in %, 2018e & 2022f
4.1.4. USERS & SHOPPERS
Number of Active Internet Users, in millions, and Penetration, in % of Population, 2013 – 2017
Number of Online Shoppers, in millions, and Penetration, in % of Population, 2013 - 2017
4.1.5. PRODUCTS
Product Categories Purchased Online, in % of Online Shoppers, 2016 & 2017
Breakdown of B2C E-Commerce Sales by Product Categories, by Domestic and Cross-Border, in %, 2017
4.1.6. PAYMENT
Breakdown of Last Online Purchase by Payment Method, in %, 2016 & 2017
4.1.7. DELIVERY
Preferred Delivery Methods in E-Commerce, in % of Online Shoppers, 2014 - 2016
4.1.8. PLAYERS
B2C E-Commerce Player Overview, July 2017
Top 15 Online Shops by Number of Unique Visitors, in thousands, January 2017
4.2. POLAND
4.2.1. OVERVIEW
B2C E-Commerce Overview and International Comparisons, July 2017
4.2.2. TRENDS
Devices Used for Online Shopping, in % of Online Shoppers, April 2017
Cross-Border Online Shopper Penetration, in % of Online Shoppers, 2012 - 2017
4.2.3. SALES & SHARES
B2C E-Commerce Sales, in PLN billion, 2017 & 2018f
B2C E-Commerce Share of Total Retail Sales, in %, 2016e & 2020f
4
TABLE OF CONTENTS (5 OF 13)
ONLINE RETAIL IN EMERGING MARKETS 2018
9
9
EUROPE (CONT.)
4.2. POLAND (CONT.)
4.2.4. USERS & SHOPPERS
Internet Penetration, in % of Individuals, 2012 – 2017
Online Shopper Penetration, in % of Individuals, 2012 - 2017
4.2.5. PRODUCTS
Product Categories Purchased Online, in % of Online Shoppers, 2016 & 2017
4.2.6. PAYMENT
Payment Methods That Encourage Online Shoppers to Purchase Online, in % of Online Shoppers, April 2017
4.2.7. DELIVERY
Delivery Methods Used in E-Commerce, in % of Online Shoppers, April 2017
4.2.8. PLAYERS
B2C E-Commerce Player Overview, July 2017
Top 12 E-Commerce Websites Most Associated with Online Shopping, in % Internet Users, April 2016 & April
2017
4.3. TURKEY
4.3.1. OVERVIEW
B2C E-Commerce Overview and International Comparisons, July 2017
4.3.2. TRENDS
Devices Used in Online Shopping, in % of Online Shoppers, January 2017
M-Commerce Share of Retail E-Commerce Sales, in %, 2012, 2016 & 2021f
Breakdown of Online Shopping Preference, by Domestic and Foreign Online Stores, in % of Online Shoppers,
February 2017
4.3.3. SALES & SHARES
E-Commerce Sales by Segment, in TRY billion, 2015 – 2017
E-Commerce Share of Total Retail Sales, in %, 2012 & 2016
4.3.4. USERS & SHOPPERS
Internet Penetration, in % of Individuals, 2011 - 2017
Online Shopper Penetration, in % of Individuals, 2016 & 2017
4.3.5. PRODUCTS
Product Categories Purchased Online, in % of Online Shoppers, 2016 & 2017
4.3.6. PAYMENT
Payment Methods Used in E-Commerce, in % of Online Shoppers, January 2017
4
TABLE OF CONTENTS (6 OF 13)
ONLINE RETAIL IN EMERGING MARKETS 2018
10
10
EUROPE
4.3. TURKEY (CONT.)
4.3.7. DELIVERY
Problems Encountered When Shopping Online, in % of Online Shoppers, by Gender and Total, 12 Months to
March 2016
4.3.8. PLAYERS
B2C E-Commerce Player Overview, July 2017
E-Commerce Websites Purchased from, in % of Online Shoppers, January 2017
LATIN AMERICA
5.1. REGIONAL
Breakdown of Retail E-Commerce Sales in Latin America by Country, in %, 2016e
M-Commerce and E-Commerce Sales CAGR in Selected Countries in Latin America, in %, 2015-2019f
5.2. BRAZIL
5.2.1. OVERVIEW
B2C E-Commerce Market Overview, September 2017
5.2.2. TRENDS
M-Commerce Sales Share of B2C E-Commerce Transactions, in %, January 2011 – January 2017
B2C E-Commerce Conversion Rate, in %, by Computer and Mobile, Q1 2017
Cross-Border Online Spending, in USD billion, and Year-on-Year Change, in %, 2013 - 2016
5.2.3. SALES & SHARES
B2C E-Commerce Sales, in BRL billion, and Year-on-Year Change, in %, 2011 - 2017f
B2C E-Commerce Sales Forecasts, by 5 Comparative Estimates, in BRL billion and in USD billion, and CAGR, in
%, 2015 - 2021f
E-Commerce Share of Total Retail Sales, in %, 2016 & 2021f
5.2.4. USERS & SHOPPERS
Internet Penetration, in % of Individuals, 2011 – 2016
Number of Online Shoppers, in millions, and Year-on-Year Change, in %, 2013 - 2016
5.2.5. PRODUCTS
Product Categories Purchased Online, in % of Online Shoppers, June 2017
5.2.6. PAYMENT
Payment Methods Preferred in E-Commerce, in % of Online Shoppers, June 2017
5.2.7. DELIVERY
Motivational Factors in Online Shopping, incl. Delivery-Related, in % of Online Shoppers, June 2017
4
ONLINE RETAIL IN EMERGING MARKETS 2018
TABLE OF CONTENTS (7 OF 13)
5
11
11
LATIN AMERICA
5.2. BRAZIL (CONT.)
5.2.8. PLAYERS
B2C E-Commerce Players Overview, September 2017
Top 10 E-Commerce Website Operators by Unique Visits, in millions, and Reach, in %, April 2017
E-Commerce Apps or Websites Most Used for Mobile Shopping, in % of Mobile Shoppers, March 2016 &
September 2016
5.3. MEXICO
5.3.1. OVERVIEW
B2C E-Commerce Market Overview, September 2017
5.3.2. TRENDS
Breakdown of Last Online Purchase by Device Used, in % Online Shoppers, February 2017
Omnichannel Shopping Behavior, in % of Internet Users, 2015 & 2016
Breakdown of Online Shoppers by Cross-Border and Domestic Shoppers, in %, May 2016
5.3.3. SALES & SHARES
B2C E-Commerce Sales, in MXN billion, and Year-on-Year Change, in %, 2009 – 2015
B2C E-Commerce Sales, in MXN billion, 2016 & 2021f
B2C E-Commerce Share of Total Retail Sales, in %, 2016
5.3.4. USERS & SHOPPERS
Number of Internet Users, in millions, and Penetration, in % of Individuals, 2011 – 2016
Number of Online Shoppers, in millions, and Penetration, in % of Internet Users, May 2015 & May 2016
5.3.5. PRODUCTS
Product Categories Purchased Online, in % of Online Shoppers, and Average Quarterly Online Spending per
Category, in MXN, 2015 & 2016
5.3.6. PAYMENT
Top 10 Payment Methods Used in Online Shopping, in % of Online Shoppers, 2015 & 2016
5.3.7. DELIVERY
Breakdown of Important Factors Related to Delivery, in % of Online Shoppers, February 2017
5.3.8. PLAYERS
B2C E-Commerce Players Overview, September 2017
Top 5 Online Shops, by Visited and Purchased From, in % of Online Shoppers, February 2017
Top 5 Companies by B2C E-Commerce Market Share, in %, 2011, 2012 & 2016
5.4. ARGENTINA
5.4.1. OVERVIEW
B2C E-Commerce Overview and International Comparisons, September 2017
5
ONLINE RETAIL IN EMERGING MARKETS 2018
TABLE OF CONTENTS (8 OF 13)
12
12
LATIN AMERICA
5.4. ARGENTINA
5.4.2. TRENDS
M-Commerce Share of E-Commerce Companies’ Revenues, in %, 2015 & 2016
Breakdown of Online Shoppers by Domestic Only, Domestic & Cross-Border and Cross-Border Only, in %,
October 2016
5.4.3. SALES & SHARES
Retail E-Commerce Sales, in ARS billion, by B2C and C2C, 2014 – 2016
Retail E-Commerce Sales, in USD billion, 2015, 2016 & 2020f
E-Commerce Share of Total Retail Sales, in %, 2016 & 2017f
5.4.4. USERS & SHOPPERS
Internet Penetration, in % of Individuals, 2011 – 2016
Online Shopper Penetration, in % of Adult Internet Users, by Purchased at Least Once in the Past and
Purchased in the Previous 6 Months, December 2016
5.4.5. PRODUCTS
B2C E-Commerce Sales by Product Categories, in ARS billion, 2014 - 2016
5.4.6. PAYMENT
Breakdown of E-Commerce Sales by Payment Methods, in %, 2016
5.4.7. DELIVERY
Preferred Delivery Methods, in % of Online Shoppers, December 2016
5.4.8. PLAYERS
Top 25 E-Commerce Websites/Apps Ranked by Number of Orders Received, H1 2017
Top 4 E-Commerce Websites, incl. Total Website Visits, in millions, Argentina’s Share of Total Visits, in %, and
Estimated Number of Website Visits from Argentina, in millions, August 2017
MIDDLE EAST
6.1. REGIONAL
E-Commerce Sales, by Airlines, Retail, Entertainment, and Travel, in USD billion, by Jordan, Kuwait, Lebanon,
Qatar, Saudi Arabia and UAE, in USD billion, 2016
Retail E-Commerce Sales in the GCC, by the UAE, Saudi Arabia and Other GCC Countries, in USD billion, 2015 –
2020f
6.2. UAE
6.2.1. OVERVIEW
B2C E-Commerce Market Overview and International Comparisons, January 2018
6.2.2. TRENDS
Share of Online Shoppers Who Purchased via Smartphone, in %, October 2016
6
5
ONLINE RETAIL IN EMERGING MARKETS 2018
TABLE OF CONTENTS (9 OF 13)
13
13
MIDDLE EAST
6.2. UAE (CONT.)
6.2.2. TRENDS (CONT.)
Breakdown of Online Shoppers by Domestic Shoppers Only, Domestic and Cross-Border Shoppers, and
Cross-Border Shoppers Only, in %, October 2016
6.2.3. SALES & SHARES
Retail E-Commerce Sales, in USD billion, 2015 – 2020f
E-Commerce Sales, by Airlines, Retail, Entertainment, and Travel, in USD billion, 2015 & 2016
B2C E-Commerce Share of Total Retail Sales, in %, 2015 & 2016
6.2.4. USERS & SHOPPERS
Internet Penetration, in % of Individuals, 2011 – 2016
Online Shopper Penetration, in % of Internet Users, 2015 & 2016
6.2.5. PRODUCTS
Product Categories Purchased Online, in % of Online Shoppers, 2016
6.2.6. PAYMENT
Breakdown of Payment Methods Preferred in Online Shopping, in % of Online Shoppers, 2016
6.2.7. DELIVERY
Retailers’ Perceptions of Customers’ Attitude to E-Commerce Delivery, in % of Respondents, October 2017
6.2.8. PLAYERS
B2C E-Commerce Players Overview, January 2018
Market Share of Amazon and Souq in B2C E-Commerce, in %, 2015 & 2016
6.3. SAUDI ARABIA
6.3.1. OVERVIEW
B2C E-Commerce Market Overview and International Comparisons, January 2018
6.3.2. TRENDS
Share of Online Shoppers Who Make Purchases via Smartphone, in %, May 2017
Origins of Online Purchases Made in the Previous 12 Months, in % of Online Shoppers, May 2017
6.3.3. SALES & SHARES
B2C E-Commerce Sales, in SAR billion, 2016 and Annual Growth Forecast for the Next Years, in %, as of August
2017
E-Commerce Sales, by Airlines, Retail, Entertainment, and Travel, in USD billion, 2015 & 2016
B2C E-Commerce Share of Total Retail Sales, in % 2017e
6.3.4. SALES & SHARES
Number of Internet Users, in millions, and Penetration, in % of Individuals, 2011 – 2016 & Q2 2017
Online Shopper Penetration, in % of Respondents, May 2017
6
ONLINE RETAIL IN EMERGING MARKETS 2018
TABLE OF CONTENTS (10 OF 13)
14
14
MIDDLE EAST (CONT.)
6.3. SAUDI ARABIA (CONT.)
6.3.5. PRODUCTS
Channels Used to Purchase Selected Product Categories, by Online, Offline and Both, in % of Respondents,
May 2017
6.3.6. PAYMENT
Breakdown of Payment Methods Preferred in Online Shopping, in % of Online Shoppers, 2016
6.3.7. DELIVERY
Problems Most Commonly Encountered by E-Commerce Merchants, in % of Surveyed E-Commerce
Merchants, June 2017
6.3.8. PLAYERS
B2C E-Commerce Players Overview, January 2018
Website Traffic Shares of the Leading Online Shopping Websites, in %, February 2015 & February 2017
6.4. ISRAEL
6.4.1. OVERVIEW
B2C E-Commerce Market Overview and International Comparisons, January 2018
6.4.2. TRENDS
Breakdown of Devices Used to Access the Internet, in % of Respondents, May 2017
Breakdown of Online Shoppers by Domestic Shoppers Only, Domestic and Cross-Border Shoppers, and
Cross-Border Shoppers Only, in %, October 2016
6.4.3. SALES & SHARES
B2C E-Commerce Sales, by International and Local Sites, in ILS billion, 2013 & 2016
B2C E-Commerce Share of Total Retail Sales, in %, 2016
6.4.4. USERS & SHOPPERS
Internet Penetration, in % of Individuals, 2011 – 2016
Online Shopper Penetration, in % of Internet Users, 2016
6.4.5. PRODUCTS
Breakdown of Spending on Selected Product Categories by Channel, According to Buyers in Each Category,
in %, September 2016
6.4.6. PLAYERS
Top 5 Most Visited Online Shopping Sites, by Rank, by Local and International, June 2017
AFRICA
7.1. REGIONAL
Breakdown of Frequency of Shopping Online, in % of Internet Users, by Egypt, Kenya, Nigeria, Tunisia,
South Africa, Compared to Global, Q1 2017
6
ONLINE RETAIL IN EMERGING MARKETS 2018
TABLE OF CONTENTS (11 OF 13)
7
15
15
AFRICA (CONT.)
7.1. REGIONAL (CONT.)
Share of Internet Users Who Do Not Buy Online Due to Lack of Trust, in % of Internet Users Who Do Not
Shop Online, by Egypt, Kenya, Nigeria, Tunisia, South Africa, Compared to Global, Q1 2017
7.2. SOUTH AFRICA
7.2.1. OVERVIEW
B2C E-Commerce Market Overview and International Comparisons, March 2018
7.2.2. TRENDS
Breakdown of Devices Preferred in Online Shopping, in % of Online Shoppers, August 2017
Breakdown of Online Shoppers by Domestic Shoppers Only, Domestic and Cross-Border Shoppers, and