28
Online UPLC Applications for Biotherapeutic Development Douglas D. Richardson Ph.D. BioProcess Development, Merck Research Labs, Kenilworth, NJ IFPAC 2015- Arlington, VA
| Date post: | 05-Jul-2018 |
| Category: |
Documents |
| Upload: | truongminh |
| View: | 226 times |
| Download: | 0 times |

Online UPLC Applications for Biotherapeutic Development
Douglas D. Richardson Ph.D.BioProcess Development, Merck Research Labs, Kenilworth, NJ
IFPAC 2015- Arlington, VA

2
Overview• Process Analytical Technologies (PAT) at Merck
– Continuous Processing and Facility of the Future
– Real Time Release Testing
• BioProcess Case Studies w/ Online UPLC– RP-UPLC for Titer
– UP-SEC Multi-Attribute Method (Titer, Purity, Excipients)
UF/DF for High Concentration Formulation Development
Parallel Sampling
• Summary and Future Work

3
Merck’s Vision and Mission of PAT Vision
PAT is engineered into our manufacturing processes, fully integrated in our business processes, part of the technical fabric of our people so that PAT provides a clear competitive advantage for Merck.
MissionPAT will provide value to Merck Manufacturing Division through innovative technical solutions to further manufacturing science resulting in efficient commercialization and minimized in-line manufacturing cost.
Process
API
Newproducts In-line
productsPharm
Biologics
Vaccines
PAT Tools• On-line HPLC• In-Line FTIR• On-line Mass Spec• FTIR • RAMAN
• In-line NIR• On-line PSD• FBRM• Sensors
• pH, Temp, etc

Merck’s Global Presence:Active PAT Implementations
ItalyRTRT
Netherlands
Ireland API & Pharm
Singapore Pharm
Puerto RicoPharm
SingaporeRTRT
UK siteRTRT
NJ/PA pilot plants
Elkton Vaccines and
Biologics
Durham Vaccines
Singapore API

Batch
Stainless / Single Use
Batch
Stainless
Continuous
Single Use Enabled
INTENSIFICATION
Transition to Future Manufacture Concepts

Continuous Processing: PAT, Automated Control & Real Time ReleaseMedia Feed
SurgeBag
SurgeBag
SurgeBag
SurgeBag
SurgeBag
SurgeBag
DS Fill or DP Manufacture
QbD Design Space
KPA’s & CQA’s
• End Product Testing transition to Real Time Release Testing • Real time automated control: process responds to variability & disturbances
• End to end prediction models for complete process• RM control Process input Product quality & yield
Process monitoring
AdaptiveControl Critical inputs
(raw materials)
BioProcess Control
RM ScreeningExperience learning MVDA
Mai
n F
Bloc
k
Xv TC-X
v
pCO
2
Glu
c
Lac
Gln
Glu
NH
4+
Osm
o
Tem
pD
O
pH AA 2
FAA
3 F
Acidic
Basic
Basic1
HMW
Oxidation
IEX
AA 1
F
Parameters
Time

Continuous Processing: Purification PAT ExamplesMedia Feed Surge
BagSurgeBag
SurgeBag
SurgeBag
SurgeBag
SurgeBag
PAT On-line & At-line
Parameter PAT
Concentration Inline UV280 or Waters UPLC
Purity IEX & SEC: Waters Patrol
Quality Bioburden BioVigilant
Quality Endotoxin At line
Quality: n-glycans At line
Impurities At line (Gyrolab ELISA’s)
Conductivity Parker / Pendotech sensors
pH Senova SU pH
Flow Transonics SU ultrasonic flow
CPP’s & CQA’s
Senova Solid State pH
Pressure & Conductivity
ParkerPendotech
Titer, SEC, IEX
Waters Patrol UPLC
FlowClamp on
Transonics flow
Process ResidualsMicrofluidic ELISA

8
Online UPLC Case Studies
• Case Study 1– Online Titer (RPLC)
3L bioreactor
Continuous perfusion
• Case Study 2– Multi Attribute Method
UPSEC for Titer
• Case Study 3– UPSEC for Process Understanding
UF/DF for high concentration formulation development» Concentration, purity, & excipient monitoring
Parallel Sampling

9
Online UPLC System Waters Patrol®
UPLC pump
Process Sample Manager
Column manager
Detector(s)External selector valveDilution Range is 1-100x
PSM System Volume: 104 µLPEEK Tubing Volumes:
0.040” @ 36” 741 µL (Natural)
0.030” @ 36” 417 µL (Green)
0.020” @ 36” 185 µL (Orange)
At-Line and On-Line Sampling
Fixed Loop Injection
3x Sample Volume required for fresh sample at Inj

10
Case Study #1 Bioreactor Real-time Titer Monitoring
• 3L Bioreactor• RP-UPLC for Online Titer• Flownamics FISP Filter
Probe:• 200mm
• Autoclave for probe sterilization
Probe Volumes120mm = .585 mL200mm = .625 mL310mm = .685 mL410mm = .745 mL

11
Case Study #1: mAb 1 Calibration1, 2, 3, 6, & 30x dilutions0.1-3 mg/mL
Column Poros R2/10, 2.1 x 30 mm
Mobile phase A: 0.1% TFA in Water, B: 0.1% TFA in ACN
Flow rate 2 mL/min
Gradient 0-0.5 min: 28.8 %B, 0.55.0 min: 28.854 %B, 5.0-6.0 min: 5490 %B, 6.0-6.1 min: 9028.8 %B, 6.1-7.0 min: 28.8%B
Column Temp. 70 ºC
Injection Volume 2 µL (full sample loop injection)

12
Case Study #1: 24 Hour Real-time Titer Monitoring
00.10.20.30.40.50.60.70.8
0 10 20 30 40 50
Tite
r (m
g/m
L)
Time (hour)
Real-time Titer Monitoring
Added new mobile phase, slowed down the flow rate to 0.2 mg/mL between runs
On-line RP-UPLC provides both content and quality dataMulti Attribute Method Capabilities
13
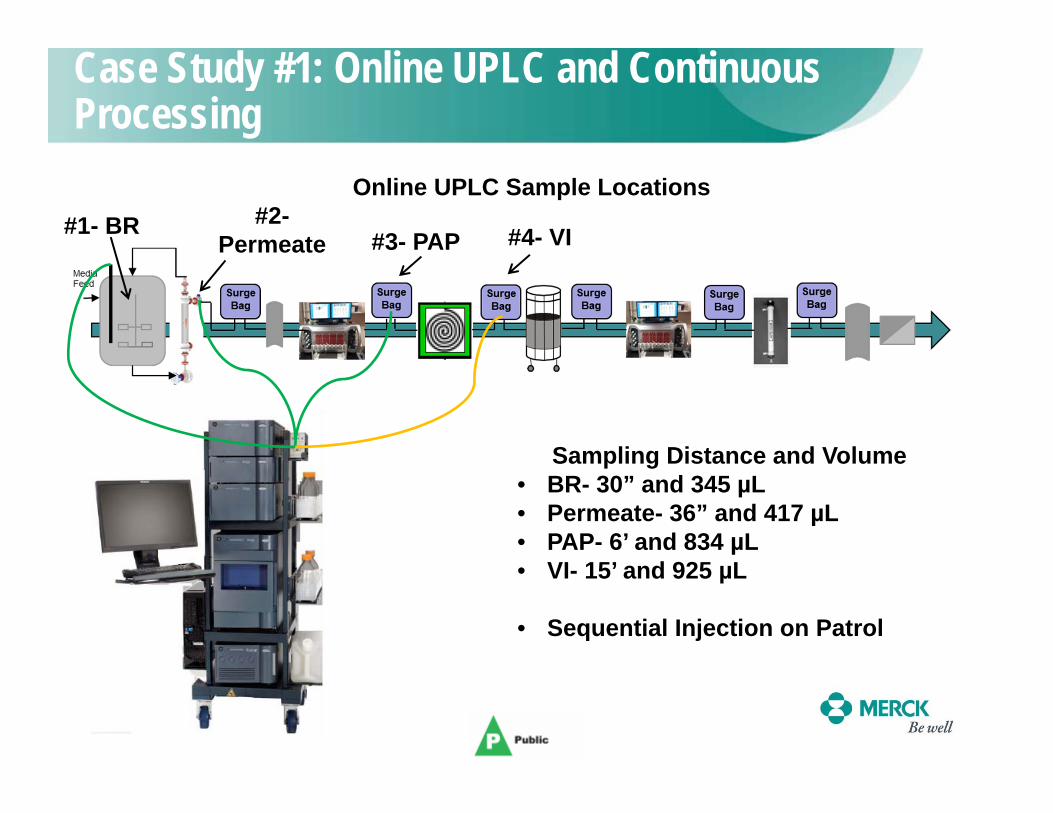
Case Study #1: Online UPLC and Continuous Processing
Online UPLC Sample Locations#1- BR #2-
Permeate #3- PAP #4- VI
Sampling Distance and Volume• BR- 30” and 345 µL• Permeate- 36” and 417 µL• PAP- 6’ and 834 µL• VI- 15’ and 925 µL
• Sequential Injection on Patrol

14
Case Study #1: Online UPLC and Continuous Processing
Time (hrs)
Con
cent
ratio
n (m
g/m
L)
• Online Titer for Perfusion• 14 days of continuous data
• Bioreactor probe fouling at day 9• Decreased product sampling• Fouling characterization
ongoing
Bioreactor
Continuous Downstream Processing
• 4 sequential sampling locations
• Good online and offline titer correlation
• Permeate, PAP, and VI
Online UPLC is a valuable tool for continuous processing
15
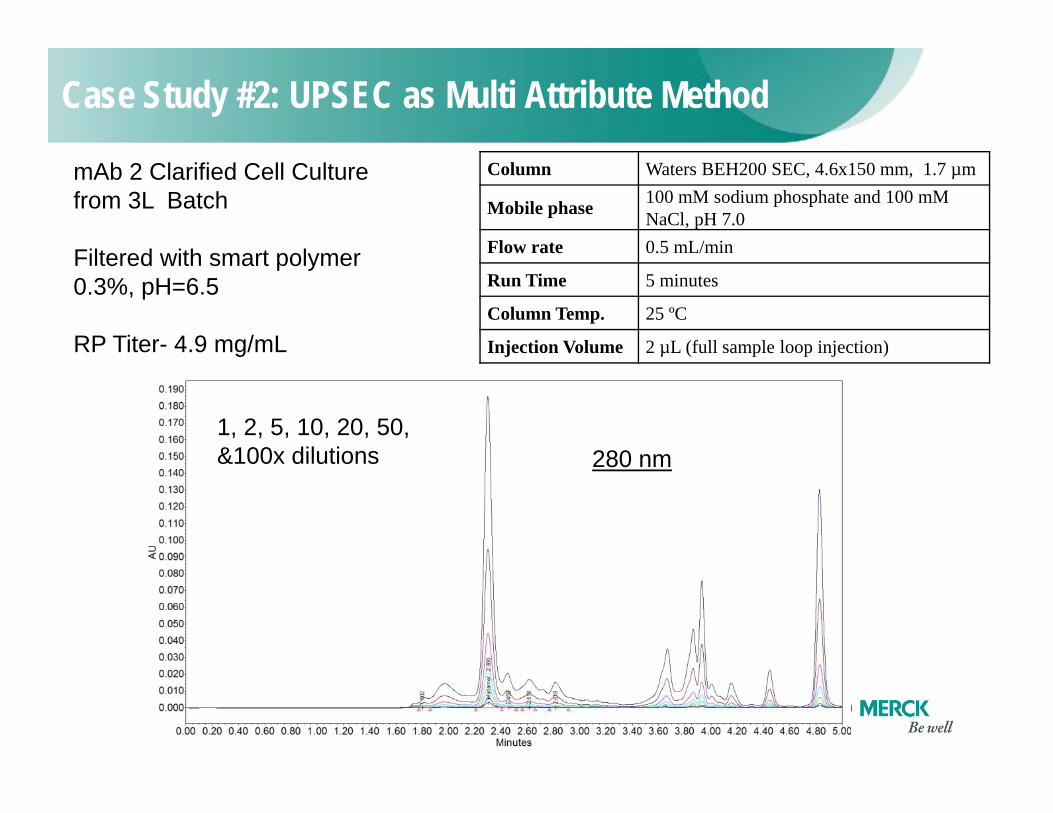
Case Study #2: UPSEC as Multi Attribute Method
mAb 2 Clarified Cell Culture from 3L Batch
Filtered with smart polymer 0.3%, pH=6.5
RP Titer- 4.9 mg/mL
1, 2, 5, 10, 20, 50, &100x dilutions
Column Waters BEH200 SEC, 4.6x150 mm, 1.7 µm
Mobile phase 100 mM sodium phosphate and 100 mMNaCl, pH 7.0
Flow rate 0.5 mL/min
Run Time 5 minutes
Column Temp. 25 ºC
Injection Volume 2 µL (full sample loop injection)
280 nm

16
Case Study #2: UPSEC Automated vs Manual Dilution
Y = 7.23*103 X+6.99*102
R2 = 0.9999Y = 7.11*103 X+1.61*104
R2 = 0.999
Automated DilutionOn-line Sampling
Manual DilutionAt-line Sampling
UPSEC Summary• Excellent linearity (R2)• Comparable slope (difference < 2%)• Manual dilution has less carryover (smaller intercept)• UPSEC preforms as a Multi Attribute Method (MAM)
• Purity and Titer information

17
Case Study #3: Online UPSEC for Multi Attribute Monitoring of High Concentration UF/DF
Sampling Position #1-Post Pump

18
Case Study #3: mAb3 Arginine Diafiltration
DV # UPSEC [mg/mL]
A280 [mg/mL]
1 39.0 44.22 40.2 40.53 40.3 41.74 39.9 -5 40.4 37.46 39.7 37.2
280 nm
214 nmHis
Arg
Arginine plateau after 5 DV
Team originally planned 8 DV but made real time decision to stop after 6 DV
Additional Multi Attribute Method Capabilities for UPSEC Titer, Purity, and Excipients

19
Case Study #3: Patrol System Pressure
Sample/wash
Diluent
Process pump
Injection Mark
System pressure for all pumps are normal and consistent

20
Arginine Histidine
Case Study #3: UF UP-SEC Overlay
6 injections were tried but only the first 4 were made due to increasing sample viscosity
214 nm
280 nm

21
Normal Profile (first 4 injections)
Case Study #3: Patrol System Pressure
Pressure too high due to higher sample viscosity injection failed
Sampling with slower pumping speed –investigation ongoing
Hi Viscosity Alternative Sampling Options
• Larger bore tubing• Slower process pump
sampling speed• Shorter distance

22
Sample # Conc. by OnlineUPSEC (mg/mL)
Conc. by UV280 w/ Dilution (mg/mL)
%HMWS by OnlineUPSEC
ProcessPump
Pressure Range (psi)
Viscosity (cP)
Before UF 39.7 37.2 0.41 108-1181 51.1 47.9 0.46 108-118 1.7782 91.9 84.8 0.41 120-215 3.0313 138.0 155.5 0.44 212-530 9.9194 144.1 198.4 0.41 548-778 50.9005 247.8* 254.2 0.42 830-1003* 271.022
Case Study #3 Summary: Correlation with Offline Data
* Sample is too viscous. Tested at-line with dilution.
Good correlation between online and offline UV 280 concentration data

23
Case Study #3: Parallel Sampling with UPSEC for High Concentration UFDF
Sampling Position #1-Post Pump
Sampling Position #2-Post TFF Membrane

24
Case Study #3: Parallel Sampling
• 2 Patrol Systems testing in parallel• Good correlation with offline
UPSEC data• Position 2 is post TFF membrane
• Concentration increase observed
Parallel Patrol Online UPSEC
UF/DF Pump Comparison

25
Case Study #3 Summary: Online vs Offline Aggregation
• HMW Species Increase with Concentration
• Aggregation not observed in offline UPLC
• Reversible Aggregation tied to dilution and analysis time is suspected

26
Summary and Future Work• Successful application of Online UPLC for BioProcess Development
• Upstream monitoring of titer
• Bioreactor
• Continuous Processing
• 4 positions for >14 days
• Online UPSEC
• Multi Attribute Method Capabilities
• Downstream monitoring of concentration, aggregation and excipients
• Parallel Sampling show value (Multiple Patrol Systems)
• Line of Sight to Continuous Processing
• Facility of the Future and Real Time Release testing
• Expanded applications
• Online Mass Spec, Admixture, and Forced Degradation
• Expanded UPLC Methods (i.e. IEX and Oxidation)

27
Patrol with QDA Detector- On-line MSOn-line UPLC-MS
• Multi Attribute Methods (MAM)• Metabolites• Excipients• Purity• Quality
Media
Permeate
Waters QDA• 30-1250 m/z
• Mass accuracy of +/- 0.2 Da• ESI Positive and Negative Ion Modes
• 25ms switching time• Empower Software

28
AcknowledgementsMRL Bioprocess Development
• Zhi Chen
• Xiaodun (Susan) Mou
• Patricia Rowicki
• Jennifer Pollard
• InKwan Han
• Mark Brower
• Daisy Richardson
• Shenjiang Yu
• Chris Kistler
• Bill Napoli
• Jun Hyuk Heo
• David Pollard
• Mohammed Shameem
MMD PAT
• Maria Khouzam
• Jorge Vazquez
• Katie Haynes
• John Higgins
Waters
• Vladimir Binshtock
• Eva Gallea
• Ernie Hillier


