Page 1
Online Appendix
List of Figures
A1 Computing District-level Aquifer Coverage . . . . . . . . . . . . . . . . . . . . . . . . 2A2 Pre-existing Irrigation Coverage and Congress Performance . . . . . . . . . . . . . . 6A4 Dis-aggregating the Impact of HYV Crops by Opposition Party Type . . . . . . . . . 9A5 Correlation between Aquifers and Economic Indicators Over Time . . . . . . . . . . 11A6 Relationship Between Rainfall Shocks and Agricultural Productivity . . . . . . . . . 12
List of Tables
A1 Descriptive Statistics for Major Variables in Analysis . . . . . . . . . . . . . . . . . . 3A2 States and Election Years in Analysis . . . . . . . . . . . . . . . . . . . . . . . . . . . . 4A3 Balance on Pre-Green Revolution Covariates of Cross-sectional Measures of Suit-
ability for HYV Crops . . . . . . . . . . . . . . . . . . . . . . . . . . . . . . . . . . . . . 5A4 IV Estimates: Effects of HYV Crop on Single-Party Dominance in India Using Pre-
Irrigation Instrument . . . . . . . . . . . . . . . . . . . . . . . . . . . . . . . . . . . . . 7A5 Coding of Top 20 Opposition Parties . . . . . . . . . . . . . . . . . . . . . . . . . . . . 8A6 IV Estimates: Dis-aggregating the Effects of HYV Crops by Opposition Party . . . . 10
1
Page 2
Fig
ure
A1:
Co
mp
uti
ng
Dis
tric
t-le
velA
qu
ifer
Cov
erag
e
(a)
Aq
uif
erM
ap(b
)O
verl
aid
1961
Dis
tric
tBo
un
dar
ies
(c)
Dis
tric
t-A
qu
ifer
Poly
gon
Inte
rsec
tio
ns
(d)
Co
mp
ute
dD
istr
ictA
qu
ifer
Cov
erag
e
2
Page 3
Tab
leA
1:D
escr
ipti
veSt
atis
tics
for
Maj
or
Var
iab
les
inA
nal
ysis
Var
iab
le19
57-6
6M
ean
1967
-76
Mea
n19
77-8
7M
ean
SDW
ith
in-S
D
Pan
elA
:Con
stit
uen
cy-l
evel
INC
Win
63.7
952
.05
42.7
549
.99
47.8
8IN
CVo
te%
45.4
139
.70
38.3
616
.95
15.1
5A
grar
ian
Win
0.86
7.32
32.5
036
.73
33.9
3A
grar
ian
Vote
%0.
995.
5527
.38
22.1
419
.41
No
n-A
grar
ian
Win
29.6
834
.68
21.9
245
.01
43.0
6N
on
-Agr
aria
nVo
te%
46.1
846
.90
30.1
623
.37
22.1
7
Pan
elB
:Dis
tric
t-le
vel
HY
V0.
000.
140.
330.
200.
17Y
ield
1055
.88
1315
.25
1344
.52
774.
8736
7.20
Wag
e4.
034.
095.
111.
901.
13P
rice
Ind
ex12
1.13
127.
5710
1.07
31.4
924
.10
Wh
eatP
rice
134.
5413
0.85
103.
9431
.51
25.6
4Fe
rtil
izer
1.92
10.1
728
.23
21.3
517
.14
Trac
tors
0.22
0.90
3.15
3.65
2.92
1966
Irri
gati
on
0.21
0.21
0.21
0.20
0.00
Aq
uif
er0.
430.
430.
430.
430.
00
Not
es:W
ith
in-S
Dis
wit
hin
-dis
tric
tst
and
ard
dev
iati
on
afte
rp
arti
alin
go
ut
dis
tric
tfi
xed
effe
cts.
Des
crip
tive
stat
isti
csat
asse
mb
lyco
nst
itu
ency
-yea
r
leve
lfo
rp
olit
ical
vari
able
san
dd
istr
ict-
year
leve
lfo
rec
on
om
icva
riab
les,
for
year
s19
57-1
987.
Pan
elA
:Win
isa
bin
ary
ind
icat
or
ofw
inn
ing
the
seat
,
mu
ltip
lied
by
100.
Vote
%is
vote
shar
e,m
ult
ipli
edb
y10
0.Se
ete
xtfo
rco
din
go
fagr
aria
nvs
.no
n-a
grar
ian
op
po
siti
on
par
ties
.Pan
elB
:HY
Vis
shar
e
ofa
gric
ult
ura
llan
du
nd
erH
YV
cro
ps.
Yie
ldis
agri
cult
ura
lpro
du
ctiv
ity
mea
sure
din
term
so
fru
pee
s/h
ecta
refo
rth
eto
p6
maj
or
cro
ps:
rice
,wh
eat,
sorg
hu
m,m
illet
,mai
ze,s
uga
rcan
e.W
age
isth
ed
aily
wag
eo
fa
mal
eag
ricu
ltu
rall
abo
rer
inru
pee
s/d
ay.
Pri
ceIn
dex
isa
reve
nu
ew
eigh
ted
aver
age
of
the
pri
cein
rup
ees/
qu
inta
lo
fth
eto
p6
cro
ps.
Wh
eat
Pri
ceis
pri
ceo
fw
hea
tp
erq
uin
tal.
All
mo
net
ary
amo
un
tsar
ed
eflat
edb
yst
ate-
spec
ific
con
sum
erp
rice
ind
ices
too
bta
inre
alp
rice
s,b
ase
year
1973
.Fer
tiliz
eru
sage
ism
easu
red
inte
rms
ofk
g./h
a.Tr
acto
rsis
nu
mb
ero
ftra
cto
rsp
er10
00
hec
tare
so
fagr
icu
ltu
rall
and
.196
6Ir
riga
tio
nis
shar
eo
fagr
icu
ltu
rall
and
wit
hir
riga
tio
nac
cess
in19
66.A
qu
ifer
isd
istr
icta
qu
ifer
cove
rage
.
3
Page 4
Table A2: States and Election Years in Analysis
State Election YearAndhra Pradesh 1957, 1962, 1967, 1972, 1978, 1983, 1985Bihar 1957, 1962, 1967, 1969, 1972, 1977, 1980, 1985Gujarat 1957, 1962, 1967, 1972, 1975, 1980, 1985Haryana 1957, 1962, 1967, 1968, 1972, 1977, 1982, 1987Madhya Pradesh 1957, 1962, 1967, 1972, 1977, 1980, 1985Maharashtra 1957, 1962, 1967, 1972, 1978, 1980, 1985Orissa 1957, 1961, 1967, 1971, 1974, 1977, 1980, 1985Punjab 1957, 1962, 1967, 1969, 1972, 1977, 1980, 1985Rajasthan 1957, 1962, 1967, 1972, 1977, 1980, 1985Uttar Pradesh 1957, 1962, 1967, 1969, 1974, 1977, 1980, 1985West Bengal 1957, 1962, 1967, 1969, 1971, 1972, 1977, 1982, 1987Karnataka 1957, 1962, 1967, 1972, 1978, 1983, 1985Tamil Nadu 1957, 1962, 1967, 1971, 1977, 1980, 1984
Notes: Karnataka and Tamil Nadu are the states of Mysore and Madras before 1967. The districts that comprise
Haryana were a part of Punjab before the 1967 elections. In the 1957 elections, the districts that comprise the
states of Maharashtra and Gujarat were part of Bombay state. Districts in all major states except Assam and
Kerala are included in the analysis, covering 85% of India’s land area.
4
Page 5
Tab
leA
3:B
alan
ceo
nP
re-G
reen
Rev
olu
tio
nC
ovar
iate
so
fCro
ss-s
ecti
on
alM
easu
res
ofS
uit
abil
ity
for
HY
VC
rop
s
Urb
aniz
atio
nP
rod
uct
ivit
yLi
tera
cyP
re-I
NC
Urb
aniz
atio
nP
rod
uct
ivit
yLi
tera
cyP
re-I
NC
(1)
(2)
(3)
(4)
(5)
(6)
(7)
(8)
Aq
uif
er−1
.060
49.8
47−0
.001
1.94
5(1
.586
)(5
1.29
2)(0
.011
)(2
.759
)
1966
Irri
gati
on
2.51
347
0.64
8∗∗∗
0.07
4∗∗∗
2.83
6(3
.497
)(1
09.6
33)
(0.0
24)
(6.0
90)
Co
nst
ant
16.3
51∗∗
∗48
2.18
1∗∗∗
0.20
9∗∗∗
66.0
53∗∗
∗15
.352
∗∗∗
402.
830∗
∗∗0.
193∗
∗∗65
.640
∗∗∗
(0.9
72)
(31.
450)
(0.0
07)
(2.4
56)
(1.0
17)
(31.
897)
(0.0
07)
(2.5
41)
Ob
serv
atio
ns
270
270
270
270
270
270
270
270
Not
es:A
qu
ifer
isd
istr
ict-
leve
laq
uif
erco
vera
geac
cord
ing
toh
isto
rica
lgro
un
dw
ater
map
s.19
66Ir
riga
tio
nis
shar
eo
fdis
tric
t-le
vela
gric
ult
ura
llan
d
wit
hac
cess
toir
riga
tio
np
rio
rto
the
gree
nre
volu
tio
nin
1966
.U
rban
izat
ion
isth
eu
rban
izat
ion
rate
acco
rdin
gth
e19
61ce
nsu
s.P
rod
uct
ivit
yis
esti
mat
edag
ricu
ltu
ralr
even
ue
div
ided
by
the
tota
lru
ralp
op
ula
tio
nin
1961
.Li
tera
cyis
the
liter
acy
rate
in19
61.
Pre
-IN
Cis
the
pre
-196
7C
on
gres
s
par
tyse
atsh
are
atth
ed
istr
ictl
evel
.An
alys
ises
tim
ated
by
OLS
.∗p<0
.1;∗
∗ p<0
.05;
∗∗∗ p
<0.0
1
5
Page 6
Fig
ure
A2:
Red
uce
dFo
rmR
elat
ion
ship
Bet
wee
nP
re-e
xist
ing
Irri
gati
on
Cov
erag
ean
dC
on
gres
sP
erfo
rman
ce
●
●
● ●
●
●
●
●● ●
●
●
●
●
●
●
●
●
●
●
● ●
●
●
●
●●
●
●
●
●
●
●●
●
●
●
●
●
●
●
●●
●●
●
●
●
●
●
●
●
●
●
●
●
●● ●
●
●
●
●
●
●
●
●
●
●
●
●
●●
●
●
●
●
●
●
●
●
●●
●
●●
●
●
●● ●
●
●
●
●●
●
●
●
● ●
●
●●
●●
● ●
●
●●
●●
●
●
●●
●
●●
●
●
●
●
●
●
●
●
●●
●
●
●
●
●
●
●
●
●
●
●
●
●
●
●
●
●●
●
●
●
●
●
●
●
●
●
●
●
●
●
●
●
●
●
●●
●
●
●
●
●
●●
●●
●
●
●
● ●
●
●
●
●
●
●
●
●
●●●●
●
●
●
●
●●
●
●●
●
●
●●
●
●
●
●
●
● ●
●
●
●
●
●
●●
●
●
●
●
●●
●
●
●●
●
●
●●
●
●
●
●
●
●
●
●
●
●
●
●
●
●
●
● ●
●
●
●
●
●
●
●●
●
●
●
●●
●
● ●
●
●
●
0.0
0.2
0.4
0.6
0.8
020406080100
A. B
efor
e G
reen
Rev
olut
ion
Year
change$preAC
●
●
● ●
●
●
●
●
● ●
●
●
●
●
●
●●
●
●
●
● ●
●
●
●
●●
●
●
●●
●●●
●
●
●
●
●
●
●
●●● ●
●
●
●
●
●
●
●●
●
●
●
●● ●
●
●
●
●
●
●
●
●
●
●
●
●
● ●
●
●
●
●
●
●
●
●
●●●
●
●
●
●
●● ●
●
●
●
●
●●
●
●
● ●
●●
●
●
●
● ●
●
● ●
●
●
●
●
●●
●
●
●
●
●
●
●
●
●
●
●●●
●
●●
●●
●
●
●
●●
●
●
●
●
●●
●
●●
●
●
●
●
●
●●
●
●
●●
●
●
●
●
●
●
●
●
●
●
●
●●
●
●●
●
●
●
●●
●
●
●
●
●
●
●
●
●● ● ●
●●
●
●
●
●
●
●
●
●
●
●
●●
●
●
●
●
● ●
●
●
●
●
●●
●
●
●
●
●
●
●●
●
●
●
●
●
●
●
●
●
●●
●
●
●
●
●
●
●
●
●
●
●
● ●
●
●
●●
●
●
●
●
●
●●
●
●
●
● ●
●
●
●
0.0
0.2
0.4
0.6
0.8
020406080100
B. A
fter
Gre
en R
evol
utio
n
Year
change$postAC
1966
Irrig
atio
n
Congress Seat Share Not
es:H
ori
zon
tala
xis
rep
rese
nts
shar
eo
fagr
icu
ltu
rall
and
wit
hac
cess
toco
ntr
olle
dir
riga
tio
nin
1966
,pri
or
toth
ein
tro
du
ctio
no
fHY
Vcr
op
s.Ve
rti-
cala
xis
rep
rese
nts
per
cen
tage
po
intC
on
gres
sp
arty
seat
shar
e.Pa
nel
Are
pre
sen
tsth
ep
re-1
967
per
iod
and
pan
elB
the
po
st-H
YV
cro
pin
tro
du
ctio
n
per
iod
.Po
ints
rep
rese
ntd
istr
icts
.Lin
esre
pre
sen
tfitt
edb
i-va
riat
eO
LSre
gres
sio
nlin
es.
6
Page 7
Tab
leA
4:IV
Est
imat
es:E
ffec
tso
fHY
VC
rop
on
Sin
gle-
Part
yD
om
inan
cein
Ind
iaU
sin
gP
re-I
rrig
atio
nIn
stru
men
t
Dep
end
entv
aria
ble:
INC
Vote
%IN
CW
in
(1)
(2)
(3)
(4)
(5)
(6)
(7)
(8)
(9)
(10)
HY
V−1
1.71
∗−1
3.68
∗∗∗
−18.
23∗∗
∗0.
60−9
.41
−66.
89∗∗
∗−6
2.12
∗∗∗
−73.
36∗∗
∗−5
4.68
−54.
84∗
(6.0
4)(5
.22)
(6.7
7)(7
.52)
(8.8
1)(1
7.58
)(1
7.50
)(1
8.92
)(3
4.74
)(3
2.10
)
Firs
t-st
age
1966
Irri
gati
on×P
ost
-196
70.
42∗∗
∗0.
36∗∗
∗0.
42∗∗
∗0.
44∗∗
∗0.
31∗∗
∗0.
42∗∗
∗0.
36∗∗
∗0.
42∗∗
∗0.
44∗∗
∗0.
31∗∗
∗
(0.0
7)(0
.07)
(0.0
9)(0
.10)
(0.0
8)(0
.07)
(0.0
7)(0
.09)
(0.1
0)(0
.08)
F-s
tati
stic
39.1
229
.04
22.2
017
.83
13.6
539
.12
29.0
422
.20
17.8
313
.65
Spec
ifica
tio
nM
ain
Co
ntr
ols
No
rth
ern
No
n-N
ort
hSt
ate-
Year
FE
Mai
nC
on
tro
lsN
ort
her
nN
on
-No
rth
Stat
e-Ye
arF
ER
egio
n-Y
ear
FE
Yes
Yes
Yes
Yes
No
Yes
Yes
Yes
Yes
No
Dis
tric
tFE
Yes
Yes
Yes
Yes
Yes
Yes
Yes
Yes
Yes
Yes
Ob
serv
atio
ns
2190
720
057
9889
1201
821
907
2190
720
057
9889
1201
821
907
Not
es:U
nit
ofo
bse
rvat
ion
asse
mb
lyco
nst
itu
ency
-yea
rfo
rel
ecti
on
year
sb
etw
een
1957
-198
7.O
utc
om
es:I
NC
Vote
%in
dic
ates
Co
ngr
ess
vote
shar
e
and
INC
Win
ind
icat
esw
het
her
Co
ngr
ess
wo
nse
at,b
oth
mu
ltip
lied
by
100
soth
atco
effi
cien
tsh
ave
ap
erce
nta
gep
oin
tin
terp
reta
tio
n.E
xpla
nat
ory
vari
able
s:H
YV
cro
pad
op
tio
nis
dis
tric
t-le
vel
shar
eo
fag
ricu
ltu
ral
lan
dw
ith
HY
Vcr
op
s(0
-1).
Inst
rum
ent
isp
re-g
reen
revo
luti
on
dis
tric
t-le
vel
irri
gati
on
cove
rage
in19
66in
tera
cted
wit
ha
tim
ed
um
my
vari
able
wh
ich
swit
ches
on
follo
win
gth
ein
tro
du
ctio
no
fHY
Vcr
op
sto
Ind
iain
1967
.A
ll
spec
ifica
tio
ns
con
tro
lfo
rd
istr
ict
fixe
def
fect
san
dre
gio
n(N
ort
h,
Sou
th,
Eas
t,W
est)
fixe
def
fect
sin
tera
cted
wit
hye
ard
um
my
vari
able
s.C
on
tro
l
vari
able
sin
clu
de
init
iald
istr
ict-
leve
lCo
ngr
ess
par
tyse
atsh
are
in19
57,t
he
leve
lof
urb
aniz
atio
nan
dp
erca
pit
aag
ricu
ltu
ralp
rod
uct
ivit
yin
1961
,
ind
icat
or
for
his
tori
cale
xpo
sure
tod
irec
tBri
tish
colo
nia
lru
le,a
nd
shar
eo
flan
dex
po
sed
toa
lan
dlo
rd-b
ased
colo
nia
llan
dte
nu
resy
stem
.Co
ntr
ols
are
inte
ract
edw
ith
year
du
mm
yva
riab
les
(th
elo
wer
ord
erte
rms
are
abso
rbed
by
the
dis
tric
tfi
xed
effe
cts)
.A
nal
ysis
esti
mat
edb
yO
LS.S
tan
dar
d
erro
rsad
just
edfo
rtw
o-w
aycl
ust
erin
gw
ith
ind
istr
icts
and
by
regi
on
-yea
r.∗ p
<0.1
;∗∗ p
<0.0
5;∗∗
∗ p<0
.01
7
Page 8
Table A5: Coding of Top 20 Opposition Parties
PartySeats Agrarian Notes Sources
NCU 82 No Congress (Urs): split from Congress in 1978. Manor 1980
GP 87 No Ganatrantra Parishad: conservative party supported bylandlords. Joined SWP in 1962.
Bailey 1959
PWP 109 No Peasants and Workers Party of India: left-wing party formedin 1947.
Srinivas 1957
FBL 127 No Forward Block: left-wing nationalist party, formed in 1939 bySubhas Chandra Bose.
Sinha 1965
NCO 166 No Congress (Organisation): conservative wing which split fromthe Indira-Gandhi led faction of the Congress party in 1969.
Hardgrave 1970
TDP 203 Yes Telugu Desam Party: regional party founded in 1982. Lead-ership and support drawn considerably from the Kammas, aprosperous farming caste.
Kohli 1988
BKD 212 Yes Bharatiya Kranti Dal: pro-rural, anti-urban party founded in1967 by INC dissident Charan Singh
Duncan 1988
SAD 235 Yes Shiromani Akali Dal: Sikh-Punjabi sub-nationalist partyfounded in 1920. Leadership drawn significantly from pros-perous farming communities.
Kumar 2004
LKD 247 Yes Bharatiya Lok Dal: founded in 1974, descended from BKD. Brass 1981
SSP 249 No Samyukta Socialist Party: split from PSP in 1964. Fickett 1973
BJP 357 No Bharatiya Janata Party: Hindu nationalist party founded in1980, descended from BJS.
Jaffrelot 1999
ADK 385 Yes All India Anna Dravida Munnetra Kazhagam: split from DMKin 1972.
Wyatt 2009
DMK 400 Yes Dravida Munnetra Kazhagam: Dravidian sub-nationalistparty. Populist platforms consisted significantly of subsidiesfor farmers.
Wyatt 2009
PSP 460 No Praja Socialist Party: socialist party formed in 1952. Fickett 1973
SWA 505 No Swatantra Party: conservative party founded in 1959. Erdman 2007
BJS 569 No Bharatiya Jana Sangh: Hindu nationalist party founded in1951 by Syama Prasad Mookherjee.
Jaffrelot 1999
CPI 691 No Communist Party of India: India’s first communist party,founded in 1920.
CPM 885 No Communist Party of India (Marxist): split from CPI in 1964. Kohli 1983
JNP 1716 Yes Janata Party: merger of several opposition parties in 1977,with large support base amongst farmers.
Rudolph 1980
IND 1780 No Independent: independent candidates were typically localnotables without organized party ties.
Chhibber and Kollman 2009
Notes: Table contains top 20 opposition parties by seats won. Party is classified as agrarian if it received signif-
icant political support from and/or advocated programs oriented around interests of agricultural producers.
8
Page 9
Fig
ure
A4:
Dis
-agg
rega
tin
gth
eIm
pac
tofH
YV
Cro
ps
by
Op
po
siti
on
Part
yTy
pe
Dis
trib
utio
n of
Est
imat
es
IV E
stim
ate
Frequency
−40
−20
020
40
05101520
●
●
●
●
0.00.20.40.60.81.0
Jana
ta P
artie
s
Qua
rtile
Outcome Party List Share
4th
3rd
2nd
1st
●
●
●
●
0.00.20.40.60.81.0
Reg
iona
l Par
ties
Qua
rtile
Outcome Party List Share
4th
3rd
2nd
1st
●●
●●
0.00.20.40.60.81.0
Left
Par
ties
Qua
rtile
Outcome Party List Share
4th
3rd
2nd
1st
●●
●●
0.00.20.40.60.81.0
Spl
inte
r P
artie
s
Qua
rtile
Outcome Party List Share
4th
3rd
2nd
1st
●●
●●
0.00.20.40.60.81.0
Con
serv
ativ
e P
artie
s
Qua
rtile
Outcome Party List Share
4th
3rd
2nd
1st
●
●
●
●
0.00.20.40.60.81.0
Inde
pend
ent
Qua
rtile
Outcome Party List Share4t
h3r
d2n
d1s
t
●
●
●
●
0.00.20.40.60.81.0
Rel
igio
us P
artie
s
Qua
rtile
Outcome Party List Share
4th
3rd
2nd
1st
Not
es:
His
togr
amre
pre
sen
td
istr
ibu
tio
no
fes
tim
ates
of
HY
Vcr
op
ado
pti
on
on
vote
shar
esac
ross
ever
yu
niq
ue
gro
up
ing
of
7fa
mili
es(J
anat
a
par
ties
,Reg
ion
alp
arti
es,S
pli
nte
rp
arti
es,L
eftp
arti
es,C
on
serv
ativ
ePa
rtie
s,R
elig
iou
sp
arti
es,I
nd
epen
den
ts)
oft
op
20o
pp
osi
tio
np
arti
es.I
np
arty
-
wis
ep
lots
,a
po
siti
vegr
adie
nt
ind
icat
esth
atth
ep
arty
isas
soci
ated
wit
hgr
ou
pin
gso
fo
pp
osi
tio
np
arti
esth
atte
nd
edto
ben
efit
elec
tora
llyfr
om
HY
Vcr
op
s.Ja
nat
aPa
rtie
sin
clu
de
the
Bh
arat
iya
Kra
nti
Dal
,th
eB
har
atiy
aLo
kD
al,a
nd
the
Jan
ata
Part
y.R
egio
nal
par
ties
incl
ud
eth
eD
MK
,AD
MK
,
Telu
guD
esam
Part
yan
dA
kali
Dal
.Sp
lin
ter
par
ties
incl
ud
eth
eC
on
gres
s(O
rgan
izat
ion
)an
dC
on
gres
s(U
rs).
Left
par
ties
incl
ud
eth
eC
om
mu
nis
t
Part
yo
fIn
dia
(Mar
xist
),C
om
mu
nis
tPa
rty
ofI
nd
ia,P
raja
Soci
alis
tPa
rty,
Sam
yukt
aSo
cial
ist
Part
y,Pe
asan
tsan
dW
ork
ers
Part
y,an
dFo
rwar
dB
lock
.
Co
nse
rvat
ive
par
ties
incl
ud
eth
eSw
atan
tra
Part
yan
dG
anat
antr
aPa
rish
ad.
Ind
epen
den
tre
pre
sen
tsca
nd
idat
esw
ith
ou
tp
arty
affi
liati
on
.R
elig
iou
s
Part
ies
incl
ud
eth
eB
har
atiy
aJa
na
San
ghan
dth
eB
har
atiy
aJa
nat
aPa
rty.
9
Page 10
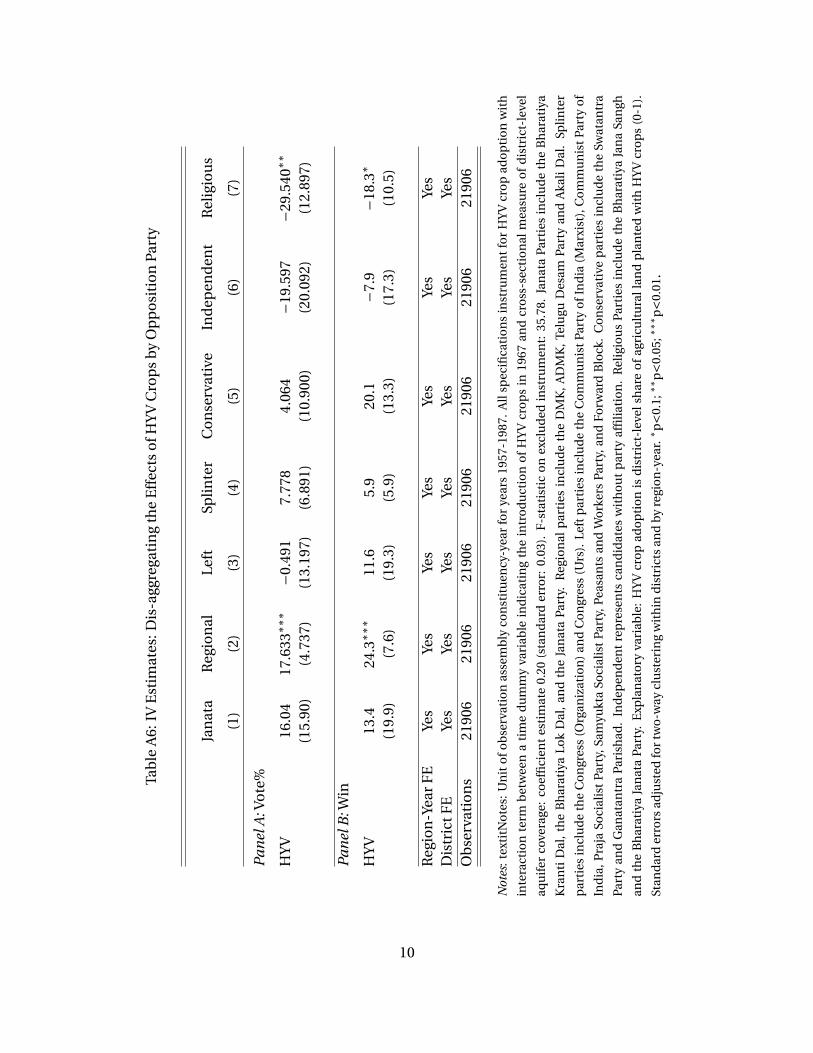
Tab
leA
6:IV
Est
imat
es:D
is-a
ggre
gati
ng
the
Eff
ects
ofH
YV
Cro
ps
by
Op
po
siti
on
Part
y
Jan
ata
Reg
ion
alLe
ftSp
lin
ter
Co
nse
rvat
ive
Ind
epen
den
tR
elig
iou
s
(1)
(2)
(3)
(4)
(5)
(6)
(7)
Pan
elA
:Vo
te%
HY
V16
.04
17.6
33∗∗
∗−0
.491
7.77
84.
064
−19.
597
−29.
540∗
∗
(15.
90)
(4.7
37)
(13.
197)
(6.8
91)
(10.
900)
(20.
092)
(12.
897)
Pan
elB
:Win
HY
V13
.424
.3∗∗
∗11
.65.
920
.1−7
.9−1
8.3∗
(19.
9)(7
.6)
(19.
3)(5
.9)
(13.
3)(1
7.3)
(10.
5)
Reg
ion
-Yea
rF
EYe
sYe
sYe
sYe
sYe
sYe
sYe
sD
istr
ictF
EYe
sYe
sYe
sYe
sYe
sYe
sYe
sO
bse
rvat
ion
s21
906
2190
621
906
2190
621
906
2190
621
906
Not
es:
text
itN
ote
s:U
nit
of
ob
serv
atio
nas
sem
bly
con
stit
uen
cy-y
ear
for
year
s19
57-1
987.
All
spec
ifica
tio
ns
inst
rum
ent
for
HY
Vcr
op
ado
pti
on
wit
h
inte
ract
ion
term
bet
wee
na
tim
ed
um
my
vari
able
ind
icat
ing
the
intr
od
uct
ion
of
HY
Vcr
op
sin
1967
and
cro
ss-s
ecti
on
alm
easu
reo
fd
istr
ict-
leve
l
aqu
ifer
cove
rage
:co
effi
cien
tes
tim
ate
0.20
(sta
nd
ard
erro
r:0.
03).
F-s
tati
stic
on
excl
ud
edin
stru
men
t:35
.78.
Jan
ata
Part
ies
incl
ud
eth
eB
har
atiy
a
Kra
nti
Dal
,th
eB
har
atiy
aLo
kD
al,
and
the
Jan
ata
Part
y.R
egio
nal
par
ties
incl
ud
eth
eD
MK
,A
DM
K,
Telu
guD
esam
Part
yan
dA
kali
Dal
.Sp
linte
r
par
ties
incl
ud
eth
eC
on
gres
s(O
rgan
izat
ion
)an
dC
on
gres
s(U
rs).
Left
par
ties
incl
ud
eth
eC
om
mu
nis
tPa
rty
ofI
nd
ia(M
arxi
st),
Co
mm
un
ist
Part
yo
f
Ind
ia,P
raja
Soci
alis
tPa
rty,
Sam
yukt
aSo
cial
ist
Part
y,P
easa
nts
and
Wo
rker
sPa
rty,
and
Forw
ard
Blo
ck.
Co
nse
rvat
ive
par
ties
incl
ud
eth
eSw
atan
tra
Part
yan
dG
anat
antr
aPa
rish
ad.
Ind
epen
den
tre
pre
sen
tsca
nd
idat
esw
ith
ou
tp
arty
affi
liati
on
.R
elig
iou
sPa
rtie
sin
clu
de
the
Bh
arat
iya
Jan
aSa
ngh
and
the
Bh
arat
iya
Jan
ata
Part
y.E
xpla
nat
ory
vari
able
:H
YV
cro
pad
op
tio
nis
dis
tric
t-le
vels
har
eo
fag
ricu
ltu
rall
and
pla
nte
dw
ith
HY
Vcr
op
s(0
-1).
Stan
dar
der
rors
adju
sted
for
two
-way
clu
ster
ing
wit
hin
dis
tric
tsan
db
yre
gio
n-y
ear.
∗ p<0
.1;∗
∗ p<0
.05;
∗∗∗ p
<0.0
1.
10
Page 11
Fig
ure
A5:
Co
rrel
atio
nb
etw
een
Aq
uif
ers
and
Eco
no
mic
Ind
icat
ors
Ove
rT
ime
●●
●●
●●
●●
●●
●
●
●
●●
●●
●●
●●
●●
●●
●●
●●
●
●
●
1955
1960
1965
1970
1975
1980
1985
−0.4−0.20.00.20.4
HY
V
Tim
e P
erio
d
Correlation Between Aquifer Coverage and Congress Performance
●●
●●
●●
●●
●
●●
●●
●●
●
●●
●●
●
●●
●
●
●●
●
●●
●
●
1955
1960
1965
1970
1975
1980
1985
−1500−1000−500050010001500
Rea
l Yie
ld
Tim
e P
erio
d
Correlation Between Aquifer Coverage and Congress Performance
●
●●
●●
●●
●●
●●
●
●●
●●
●
●●
●
●●
●●
●●
●●
●●
●●
1955
1960
1965
1970
1975
1980
1985
−4−2024
Rea
l Wag
e
Tim
e P
erio
d
Correlation Between Aquifer Coverage and Congress Performance
●
●
●
●●
●
●●
●●
●
●
●●
●●
●●
●
●
●●
●
●●
●●
●●
●●
●
1955
1960
1965
1970
1975
1980
1985
−60−40−200204060
Whe
at P
rice
Tim
e P
erio
d
Correlation Between Aquifer Coverage and Congress Performance
●●
●●
●●
●●
●●
●●
●●
●●
●●
●
●●
●
●
●●
●
●●
●●
●
●
1955
1960
1965
1970
1975
1980
1985
−40−2002040
Fer
tiliz
er
Tim
e P
erio
d
Correlation Between Aquifer Coverage and Congress Performance
●●
●●
●●
●●
●●
●●
●●
●●
●●
●●
●●
●●
●●
●●
●
●●
●
1955
1960
1965
1970
1975
1980
1985
−505
Trac
tor
Tim
e P
erio
d
Correlation Between Aquifer Coverage and Congress Performance
Year
Correlation Between Aquifer and Economic Indicators
Not
es:
Un
ito
fan
alys
isas
sem
bly
dis
tric
t-ye
arfo
rye
ars
bet
wee
n19
57-1
987.
Ou
tco
me
issp
ecifi
edec
on
om
ico
utc
om
eva
riab
le.
Poin
tsre
pre
sen
t
esti
mat
eso
fco
effi
cien
to
nti
me
per
iod
du
mm
yva
riab
les
inte
ract
edw
ith
the
cro
ssse
ctio
nal
mea
sure
of
suit
abili
tyfo
rH
YV
cro
pad
op
tio
nb
ased
on
dis
tric
t-le
vela
qu
ifer
cove
rage
.Ve
rtic
alax
isre
pre
sen
tsp
lus
or
min
us
two
stan
dar
dd
evia
tio
ns
ofo
utc
om
eva
riab
le.
Reg
ress
ion
also
con
tro
lsfo
r
regi
on
-yea
rfi
xed
effe
cts.
An
alys
ises
tim
ated
by
OLS
.Sta
nd
ard
erro
rsad
just
edfo
rtw
o-w
aycl
ust
erin
gw
ith
ind
istr
icts
and
by
regi
on
-yea
r.D
ash
ed
lin
esre
pre
sen
t95%
con
fid
ence
inte
rval
.
11
Page 12
Figure A6: Relationship Between Rainfall Shocks and Agricultural Productivity
−3 −2 −1 0 1 2 3
−30
0−
200
−10
00
100
Standardized Rainfall Shock | X
Rea
l Yie
lds
| X
Notes: Unit of observation district-year. Rainfall shock measured in terms of standardized deviation from long-
run district level mean rainfall. Analysis estimated by generalized additive model, controlling for district and
year fixed effects. The effect of rainfall shocks is modeled with a penalized spline function, with the number of
knot points selected through cross-validation.
12
Page 13
12
Online Appendix References
Bailey, Frederick George. 1970. Politics and Social Change: Orissa in 1959. University of
California Press.
Brass, Paul R. 1981. “Congress, the Lok Dal, and the Middle-Peasant Castes: An Analysis of the
1977 and 1980 Parliamentary Elections in Uttar Pradesh.” Pacific Affairs 54(1): 5-41
Chhibber, Pradeep and Ken Kollman. 2009. The Formation of National Party Systems:
Federalism and Party Competition in Canada, Great Britain, India, and the United States.
Princeton University Press.
Duncan, Ian. 1988. “Party Politics and the North Indian Peasantry: The Rise of the Bharatiya
Kranti Dal in Uttar Pradesh.” The Journal of Peasant Studies 16(1):40–76.
Erdman, Howard L. 2007. The Swatantra Party and Indian Conservatism. Cambridge University
Press.
Fickett, Lewis P. 1973. “The Praja Socialist Party of India–1952-1972: A FInal Assessment.”
Asian Survey 13(9):826–832.
Hardgrave, Robert 1970. “The Congress in India–Crisis and Split.” Asian Survey 10(3):256–262.
Jaffrelot, Christophe. 1999. The Hindu Nationalist Movement and Indian Politics, 1925 to the
1990s: Strategies of Identity-Building, Implantation and Mobilisation. Penguin Books India.
Kumar, Ashutosh. 2004. “Electoral Politics in Punjab: Study of Akali Dal.” Economic and
Political Weekly 39(14/15):1515–1520.
Kohli, Atul. 1983. “Parliamentary Communism and Agrarian Reform: The Evidence from
India’s Bengal.” Asian Survey 23(7):783–809.
Kohli, Atul. 1988. “The NTR Phenomenon in Andhra Pradesh: Political Change in a South
Indian State.” Asian Survey 28(10):991–1017.
Manor, James. 1980. “Pragmatic Progressives in Regional Politics: The Case of Devaraj Urs.”
Economic and Political Weekly 21(5):201–213.
Rudolph, Susanne Hoeber and Lloyd I Rudolph. 1980. “The Centrist Future of Indian Politics.”
Asian Survey 20(6):575–594.
Srinivas, Mysore Narasimhachar. 1957. “Caste in Modern India.” The Journal of Asian Studies
August: 529–548.
Wyatt, Andrew. 2009. Party System Change in South India: Political Entrepreneurs, Patterns
and Processes. Routledge.