Page 1
®
The contents of this report reflect the views of the authors, who are responsible for the facts and the accuracy of the information presented herein. This document is disseminated under the sponsorship of the Department of Transportation
University Transportation Centers Program, in the interest of information exchange. The U.S. Government assumes no liability for the contents or use thereof.
Onsite Use of Recycled Asphalt Pavement Materials and Geocells to Reconstruct Pavements Damaged by Heavy Trucks
Report # MATC-KU: 462 Final Report
Jie Han, Ph.D., P.E.ProfessorDepartment of Civil, Environmental, and Architectural EngineeringUniversity of Kansas
Bhagaban Acharya Graduate Research Assistant
Jitendra K. ThakurGraduate Research Assistant
Robert Parsons, Ph.D., P.E.Professor
2012A Cooperative Research Project sponsored by the U.S. Department of Transportation Research and Innovative Technology Administration
MATC
The contents of this report reflect the views of the authors, who are responsible for the facts and the accuracy of the information presented herein. This document is disseminated under the sponsorship of the U.S. Department of Transportation’s University
Transportation Centers Program, in the interest of information exchange. The U.S. Government assumes no liability for the contents or use thereof.
25-1121-0001-462
Page 2
Onsite Use of Recycled Asphalt Pavement Materials with Geocells to Reconstruct
Pavements Damaged by Heavy Trucks
Jie Han, Ph.D., P.E.
Professor of Geotechnical Engineering
Department of Civil, Environmental, and Architectural Engineering
University of Kansas, Lawrence
Bhagaban Acharya
Graduate Research Assistant
Department of Civil, Environmental, and Architectural Engineering
University of Kansas, Lawrence
Jitendra K. Thakur
Graduate Research Assistant
Department of Civil, Environmental, and Architectural Engineering
University of Kansas, Lawrence
Robert L. Parsons, Ph.D., P.E.
Professor
Department of Civil, Environmental, and Architectural Engineering
University of Kansas, Lawrence
A Report on Research Sponsored by
Mid-America Transportation Center
University of Nebraska-Lincoln
July 2011
Page 3
ii
Technical Report Documentation Page
1. Report No. 2. Government Accession No. 3. Recipient’s Catalog No.
25-1121-0001-462
4. Title and Subtitle 5. Report Date
Onsite Use of Recycled Asphalt Pavement Materials with Geocells to Reconstruct
Pavements Damaged by Heavy Trucks
July 2011
6. Performing Organization Code
7. Author(s)
Jie Han, Bhagaban Acharya, Jitendra K. Thakur, and Robert L. Parsons
8. Performing Organization Report No.
25-1121-0001-462
8. Performing Organization Name and Address 10. Work Unit No.
Mid-America Transportation Center
2200 Vine St. 262 Whittier
PO Box 830851
Lincoln, NE 68583-0851
11. Contract or Grant No.
12. Sponsoring Agency Name and Address 13. Type of Report and Period Covered
Research and Innovative Technology Administration
1200 New Jersey Ave., SE Washington, D.C. 20590
Final Report
14. Sponsoring Agency Code
MATC TRB RiP No. 28887
15. Supplementary Notes
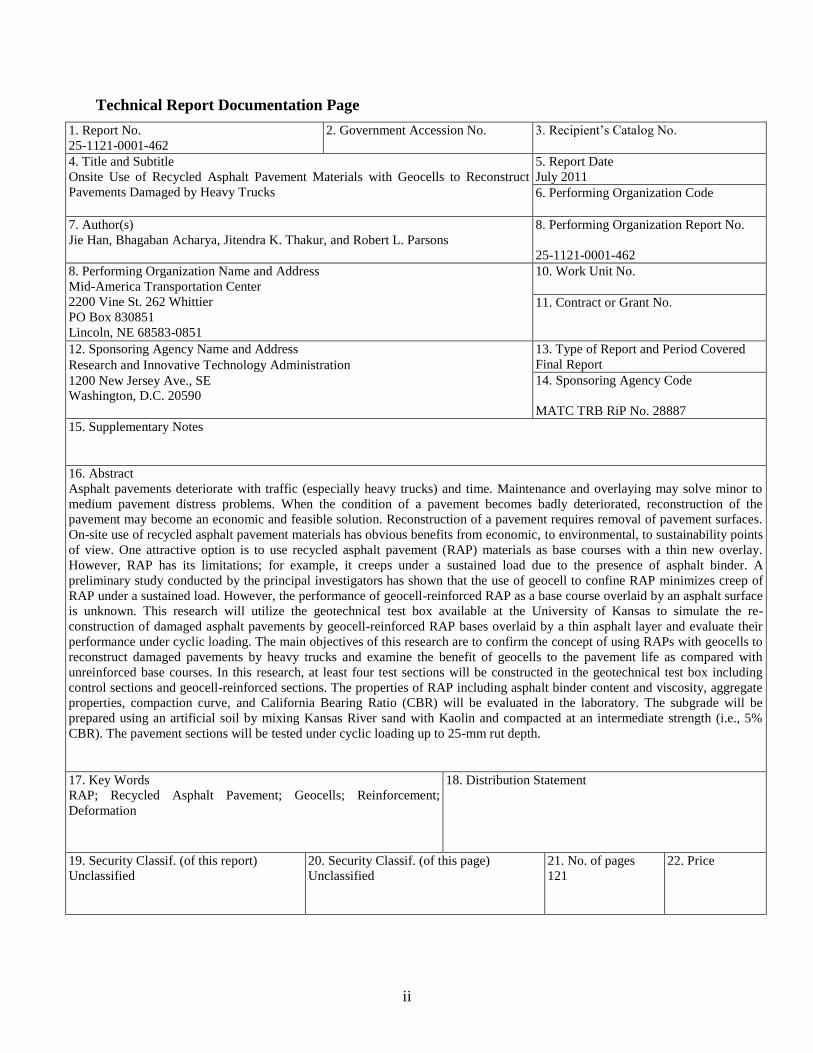
16. Abstract
Asphalt pavements deteriorate with traffic (especially heavy trucks) and time. Maintenance and overlaying may solve minor to
medium pavement distress problems. When the condition of a pavement becomes badly deteriorated, reconstruction of the
pavement may become an economic and feasible solution. Reconstruction of a pavement requires removal of pavement surfaces.
On-site use of recycled asphalt pavement materials has obvious benefits from economic, to environmental, to sustainability points
of view. One attractive option is to use recycled asphalt pavement (RAP) materials as base courses with a thin new overlay.
However, RAP has its limitations; for example, it creeps under a sustained load due to the presence of asphalt binder. A
preliminary study conducted by the principal investigators has shown that the use of geocell to confine RAP minimizes creep of
RAP under a sustained load. However, the performance of geocell-reinforced RAP as a base course overlaid by an asphalt surface
is unknown. This research will utilize the geotechnical test box available at the University of Kansas to simulate the re-
construction of damaged asphalt pavements by geocell-reinforced RAP bases overlaid by a thin asphalt layer and evaluate their
performance under cyclic loading. The main objectives of this research are to confirm the concept of using RAPs with geocells to
reconstruct damaged pavements by heavy trucks and examine the benefit of geocells to the pavement life as compared with
unreinforced base courses. In this research, at least four test sections will be constructed in the geotechnical test box including
control sections and geocell-reinforced sections. The properties of RAP including asphalt binder content and viscosity, aggregate
properties, compaction curve, and California Bearing Ratio (CBR) will be evaluated in the laboratory. The subgrade will be
prepared using an artificial soil by mixing Kansas River sand with Kaolin and compacted at an intermediate strength (i.e., 5%
CBR). The pavement sections will be tested under cyclic loading up to 25-mm rut depth.
17. Key Words 18. Distribution Statement
RAP; Recycled Asphalt Pavement; Geocells; Reinforcement;
Deformation
19. Security Classif. (of this report) 20. Security Classif. (of this page) 21. No. of pages 22. Price
Unclassified Unclassified 121
Page 4
iii
Table of Contents
Acknowledgments vii
Disclaimer xiii
Chapter 1 Introduction 1
1.1 Background 1
1.2 Problem Statement 2
1.3 Research Objective 3
1.4 Research Methodology 3
1.5 Organization of Report 4
Chapter 2 Literature Review 5
2.1 Geosynthetics 5
2.1.1 Basic Functions 5
2.1.3 Geocell and its Application in Road Construction 8
2.2 Recycled Asphalt Pavement Materials 12
2.2.1 Sources and Applications 12
2.2.2 General Characteristics of RAP 15
(Source: U. S. Department of Transportation, FHWA-RD-97-148) 19
2.2.3 Performance of RAP Base Materials 19
2.3 Summary of Past Studies 21
3.1 Base Course 23
3.2 Subgrade 25
3.3 Asphalt Concrete 27
3.4 Geocell 27
3.5 Geotextile 29
3.6 Test Devices and Instrumentation 30
3.6.1 Earth Pressure Cells 31
3.6.2 Strain Gauges 32
3.6.3 Displacement Transducers and Tell-Tales 34
3.6.4 Data Acquisition 35
3.6.5 MTS Loading System 36
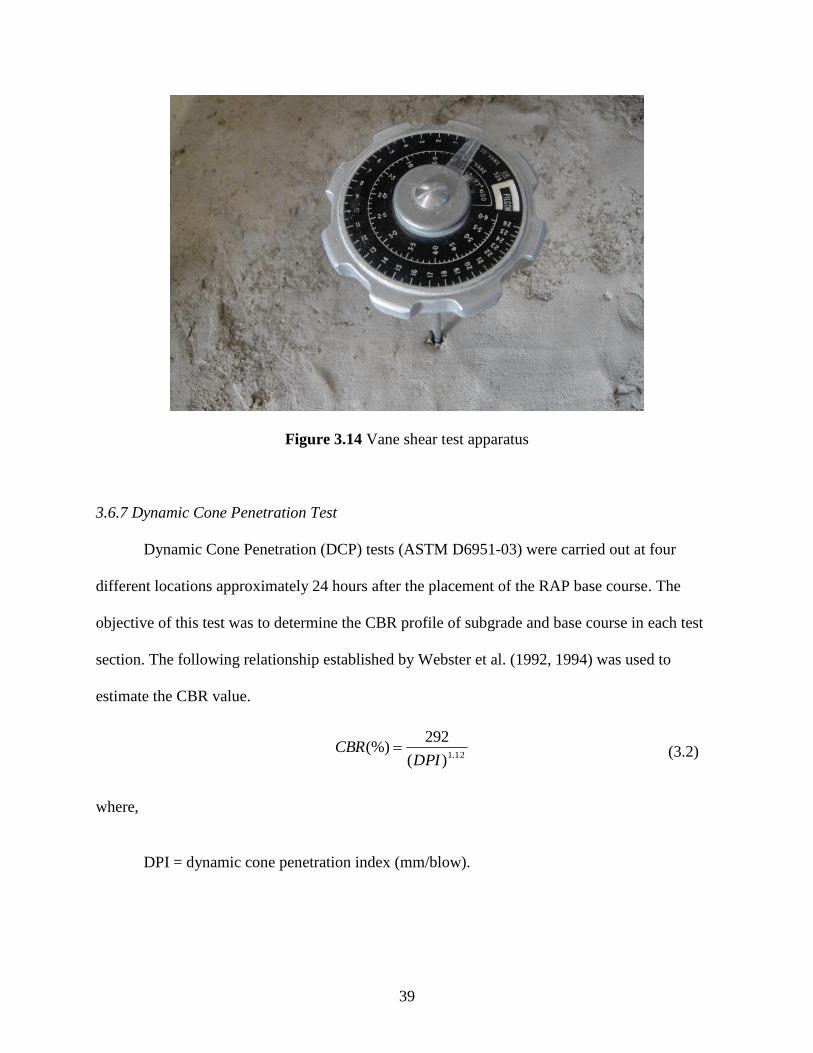
3.6.6 Vane Shear Test 38
3.6.7 Dynamic Cone Penetration Test 39
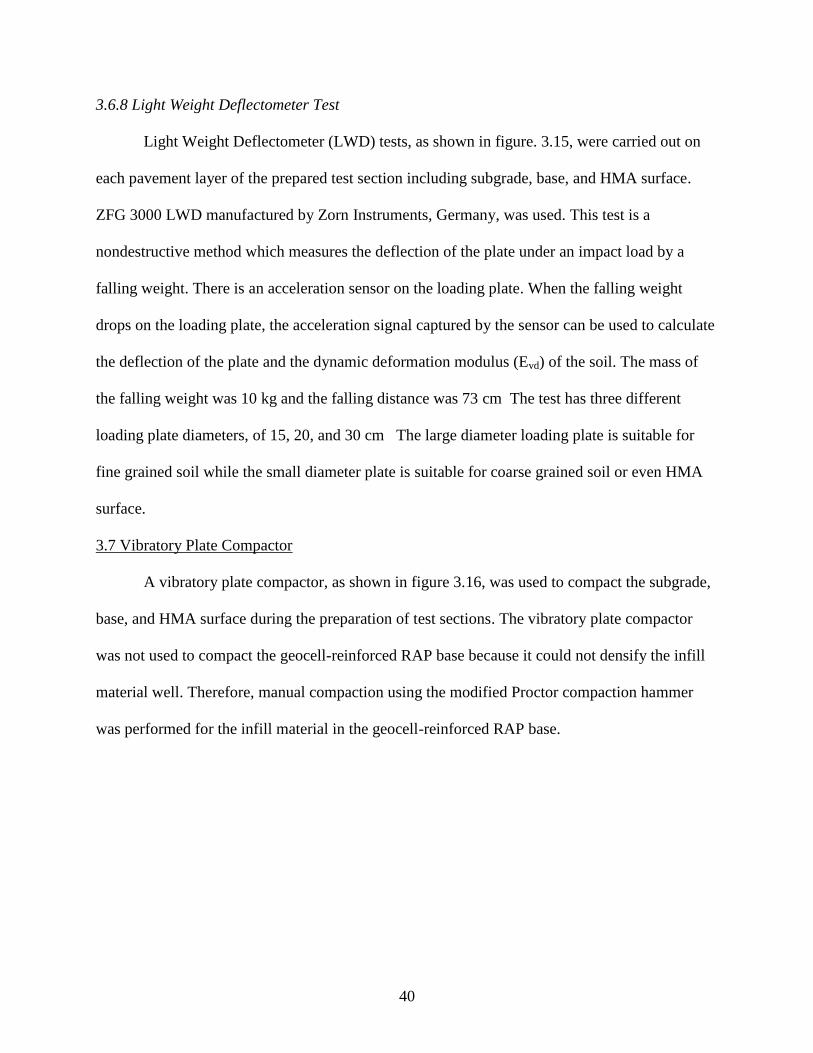
3.6.8 Light Weight Deflectometer Test 40
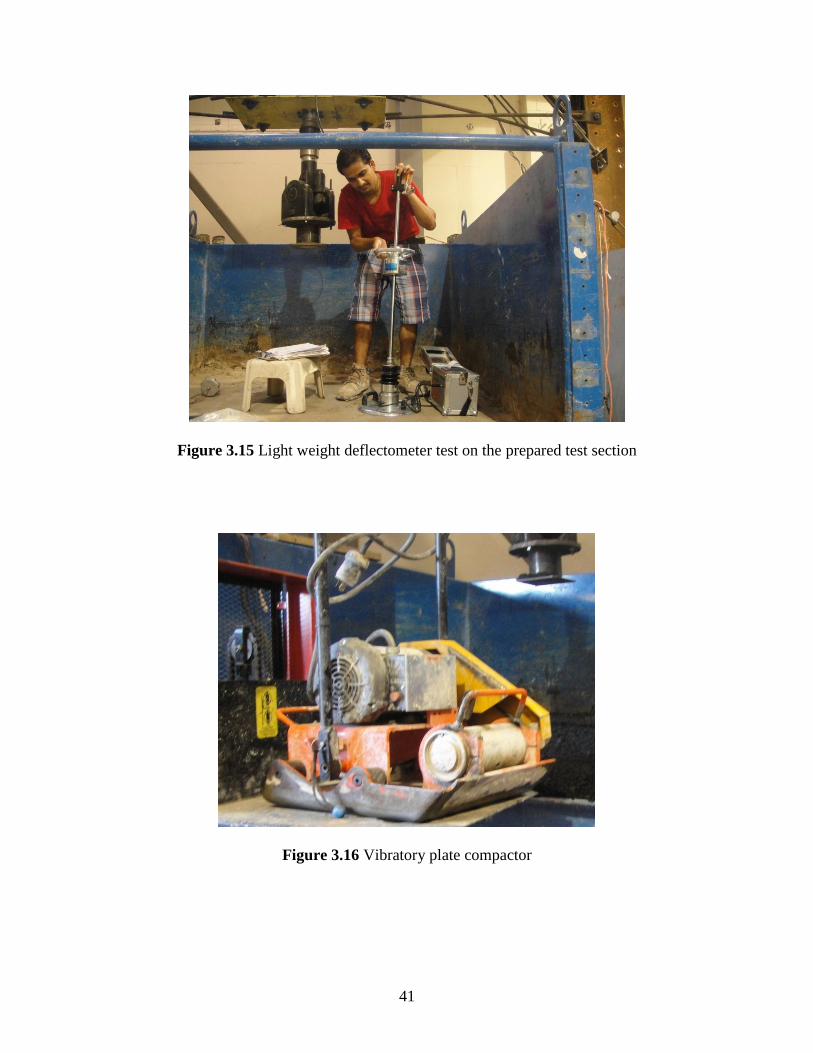
3.7 Vibratory Plate Compactor 40
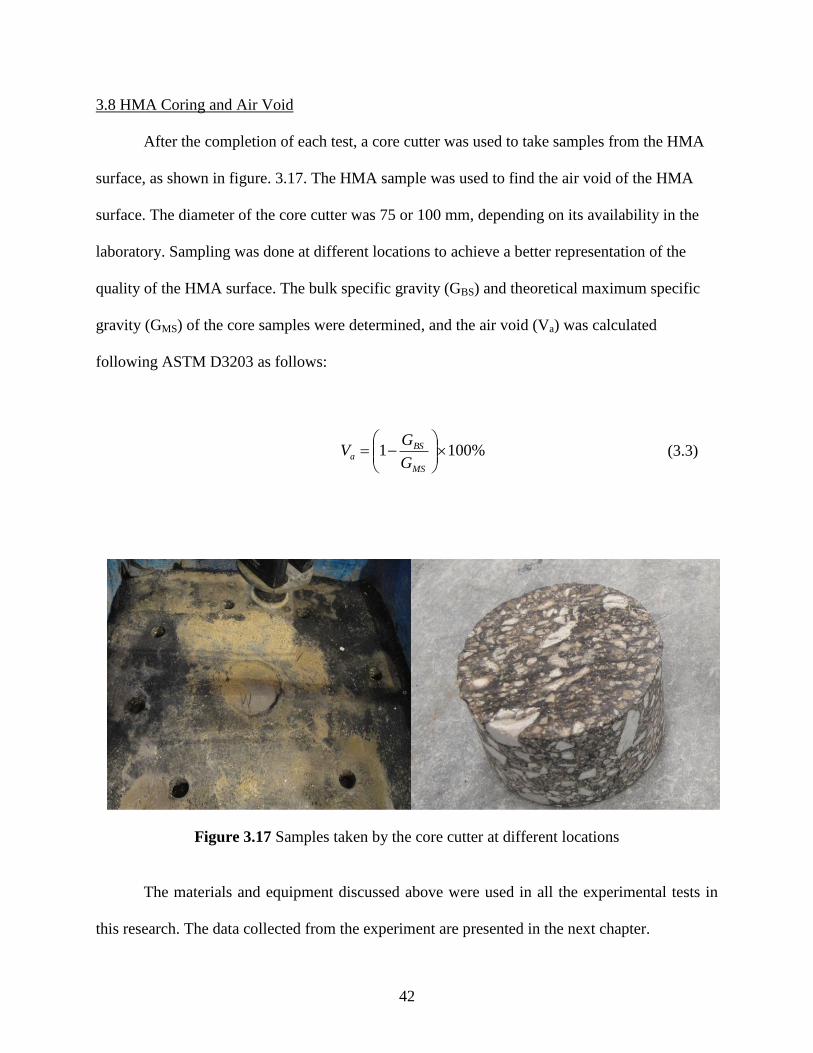
3.8 HMA Coring and Air Void 42
4.1 Preparation of Test Sections 43
4.1.1 Subgrade 43
4.1.2 RAP Base Course 44
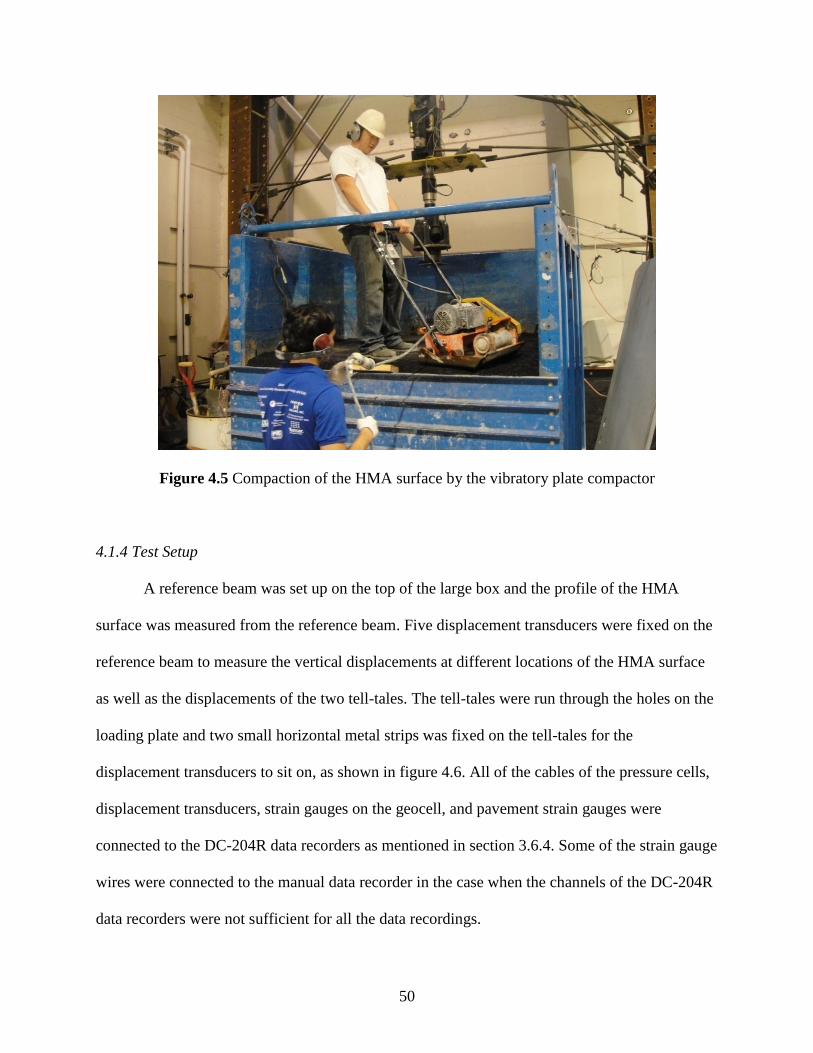
4.1.3 Hot Mix Asphalt Surface 48
4.1.4 Test Setup 50
4.2 Cyclic Plate Load Tests 51
4.3 Test Results 52
4.3.1 Format of Presentation 52
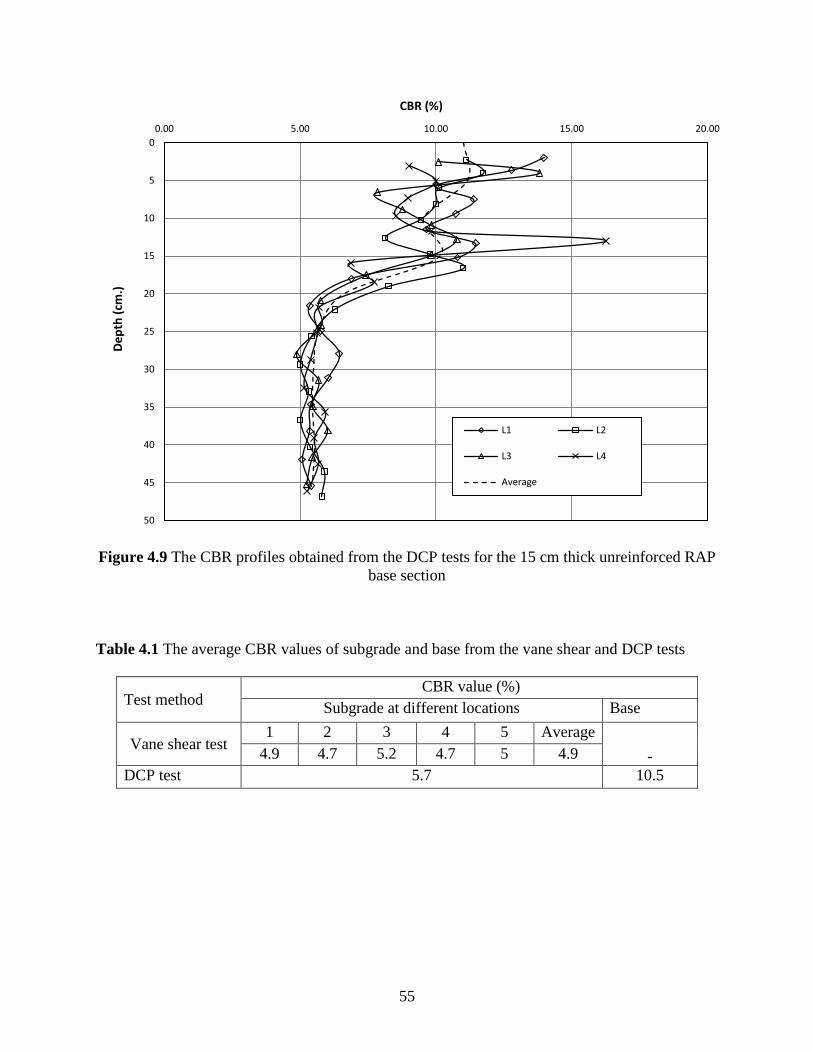
4.3.2 15 cm Thick Unreinforced RAP Base Section 54
4.3.3 15 cm Thick Geocell-Reinforced RAP Base Section (Hard Subgrade) 61
Page 5
iv
4.3.4 15 cm Thick Geocell-Reinforced RAP Base Section 69
4.3.5 23 cm Thick Geocell-Reinforced RAP Base Section 77
4.3.6 30 cm Thick Unreinforced RAP Base Section 84
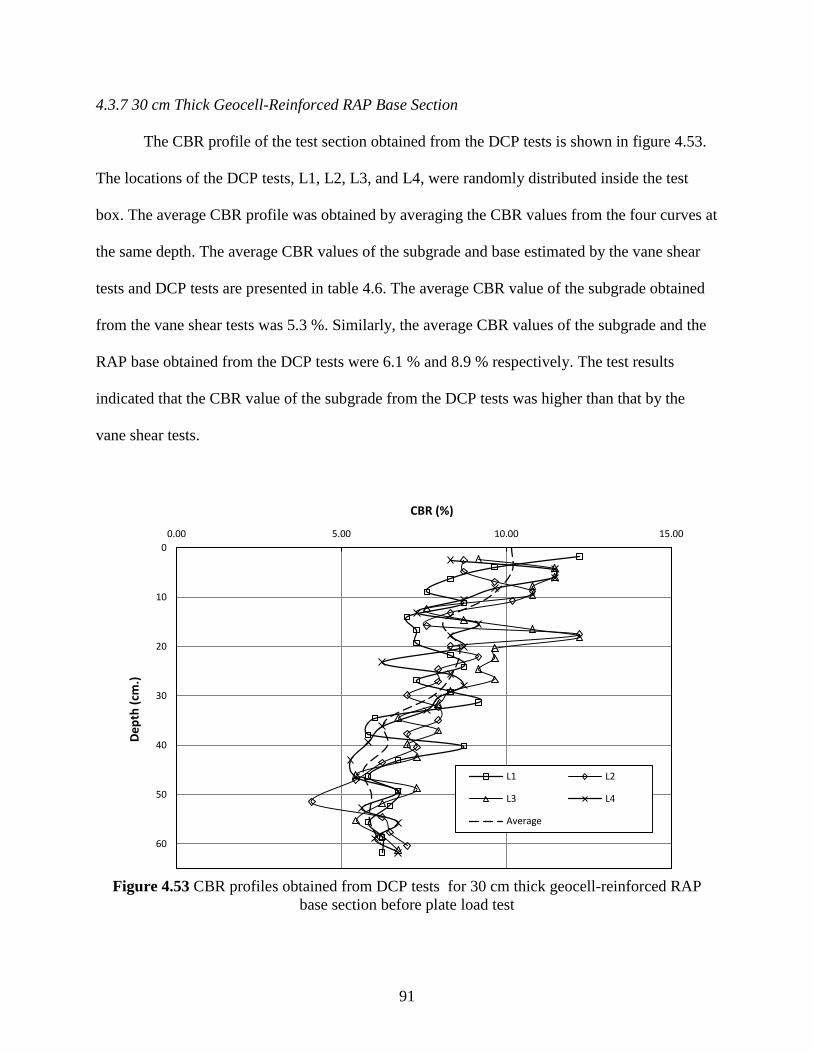
4.3.7 30 cm Thick Geocell-Reinforced RAP Base Section 91
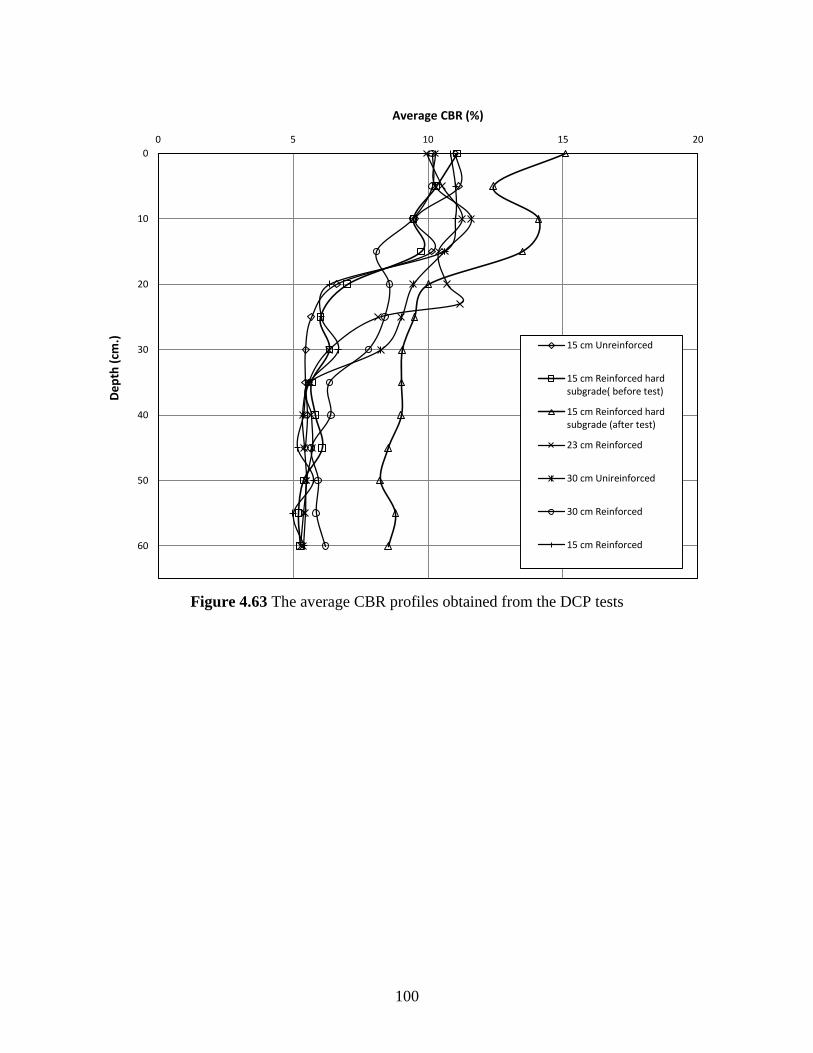
4.4 Analysis of Test Data 99
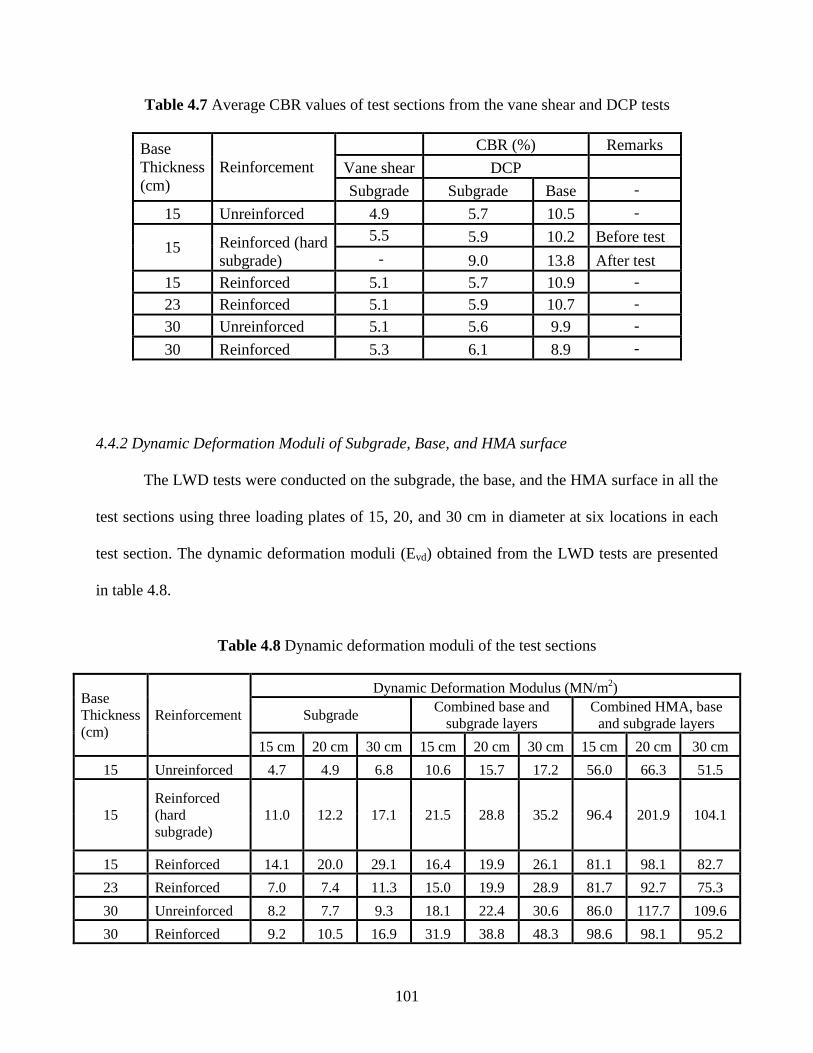
4.4.1 CBR Values of Subgrade and Base Course 99
4.4.2 Dynamic Deformation Moduli of Subgrade, Base, and HMA surface 101
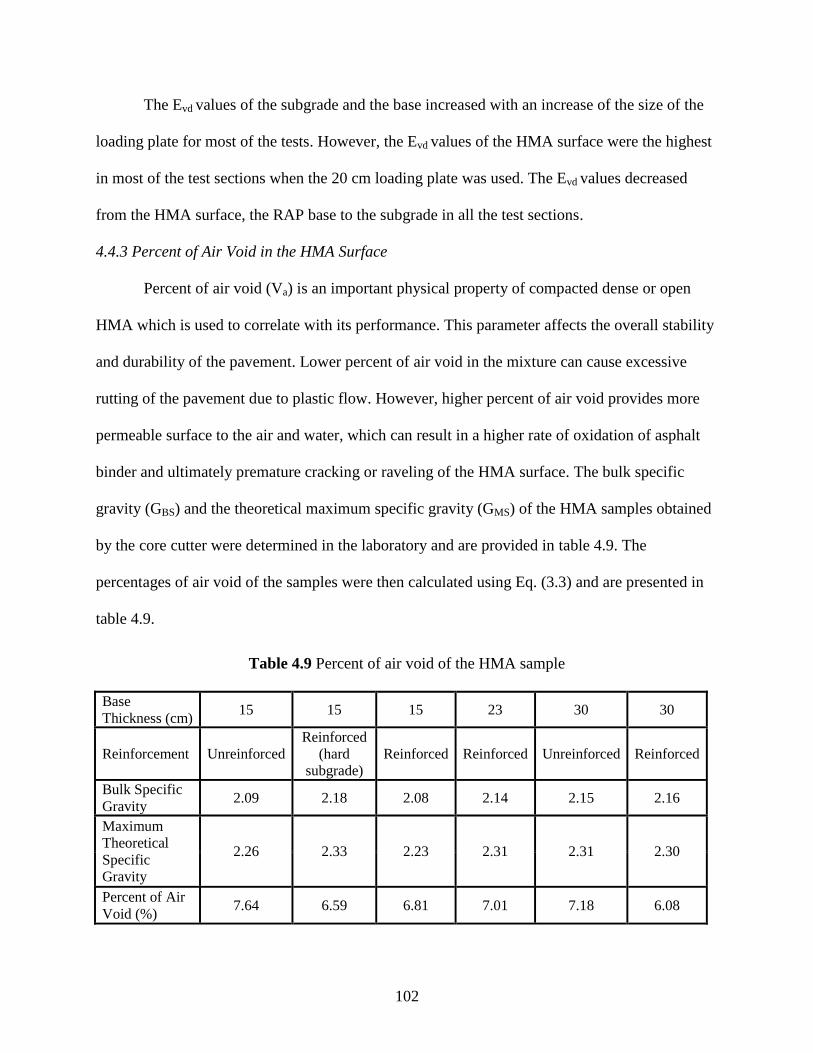
4.4.3 Percent of Air Void in the HMA Surface 102
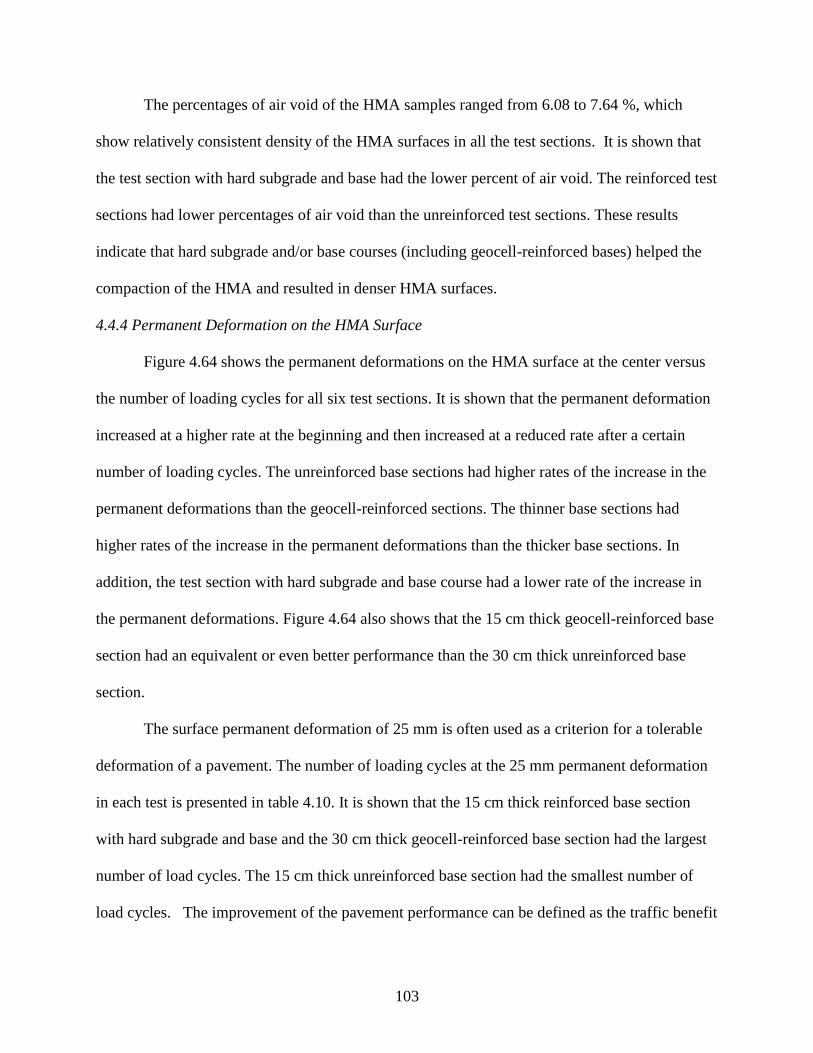
4.4.4 Permanent Deformation on the HMA Surface 103
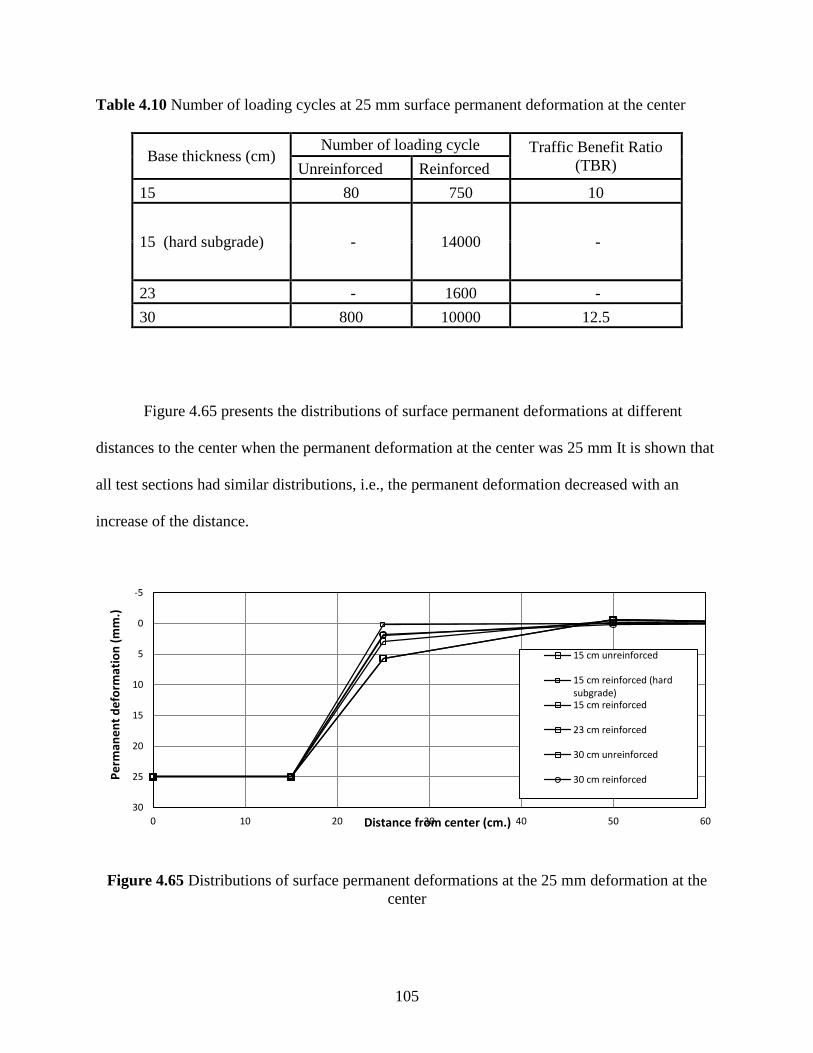
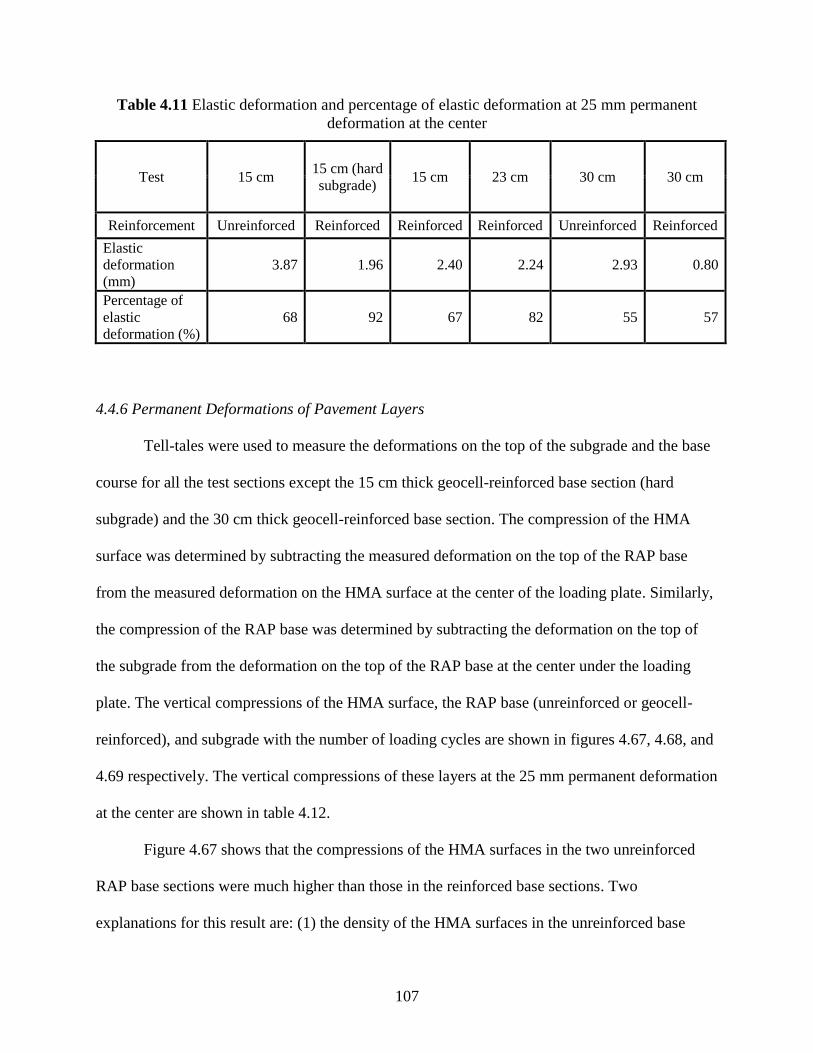
4.4.5 Elastic Deformation at the Surface of HMA Layer 106
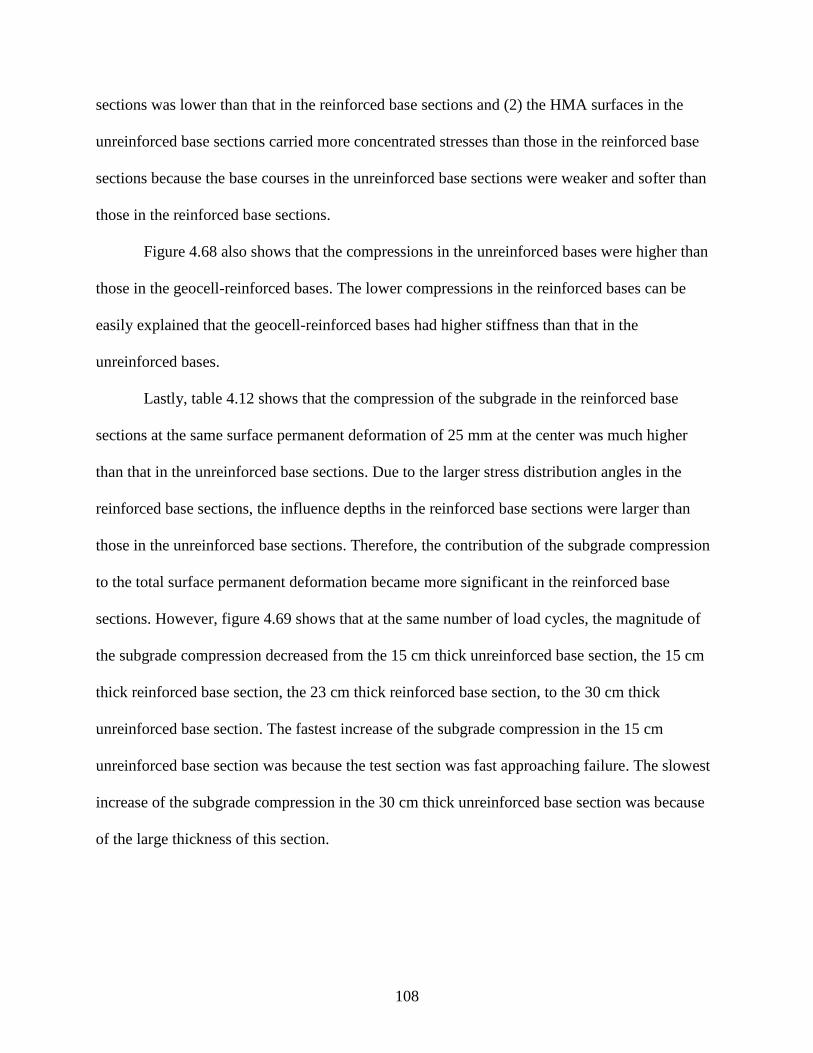
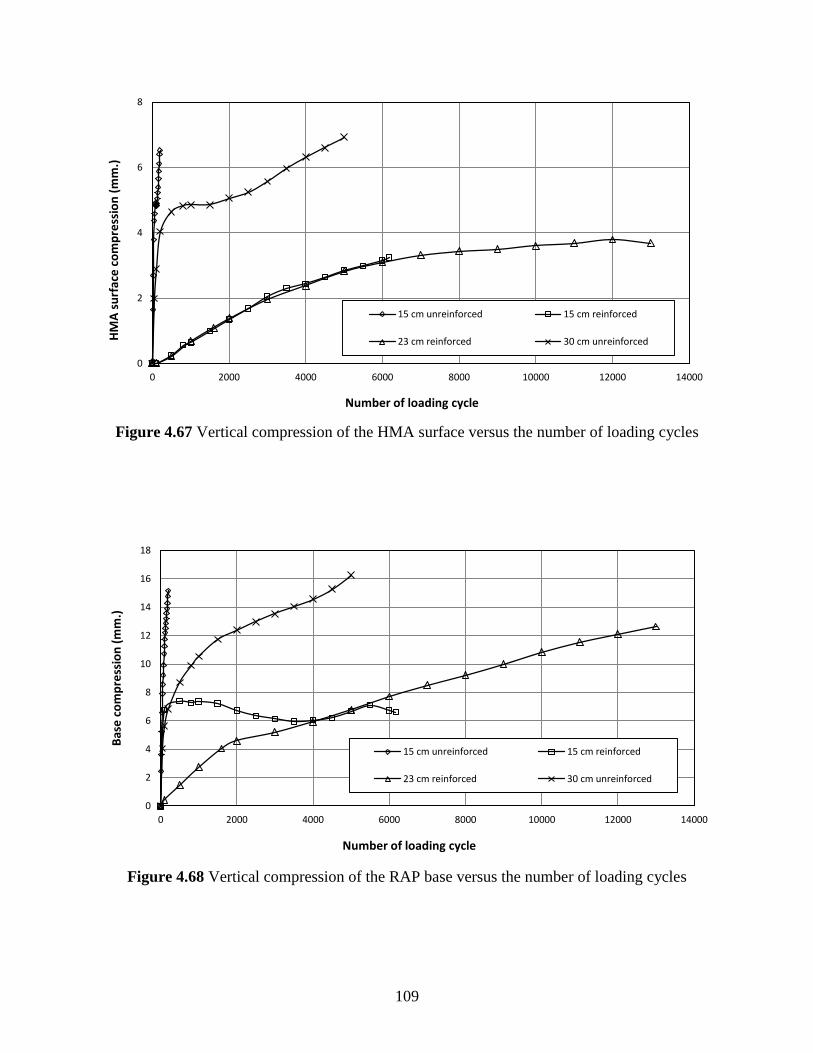
4.4.6 Permanent Deformations of Pavement Layers 107
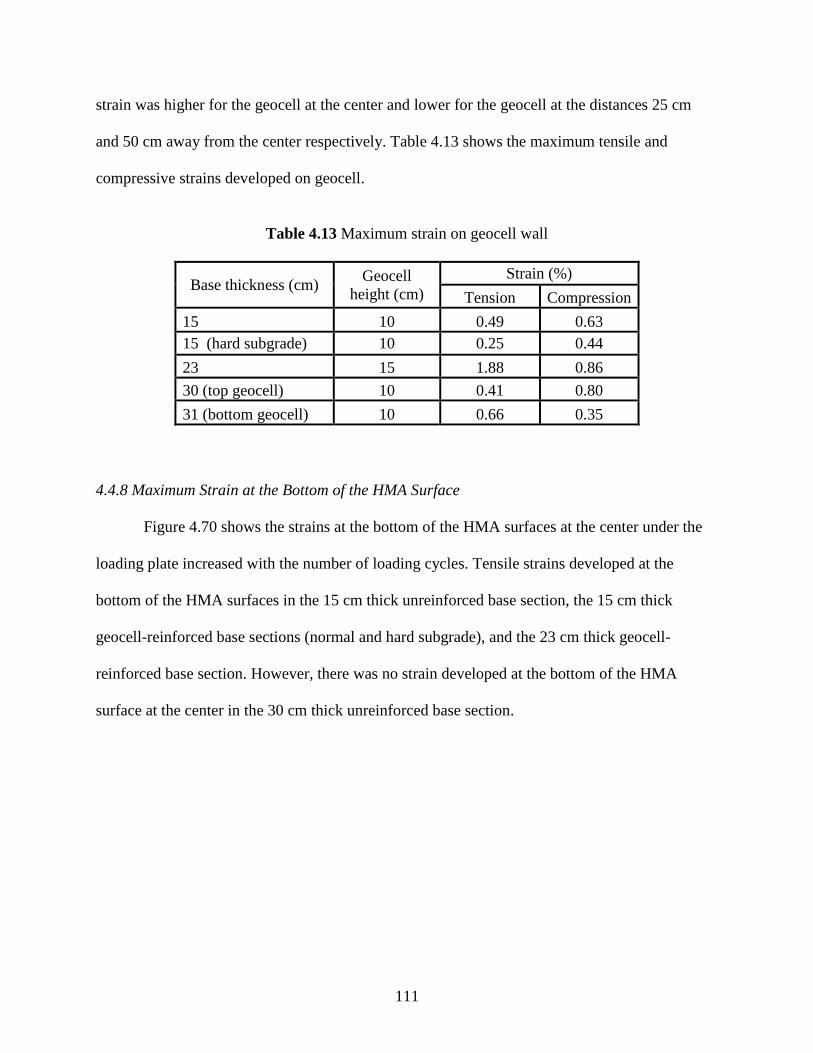
4.4.7 Maximum Strain on the Geocell 110
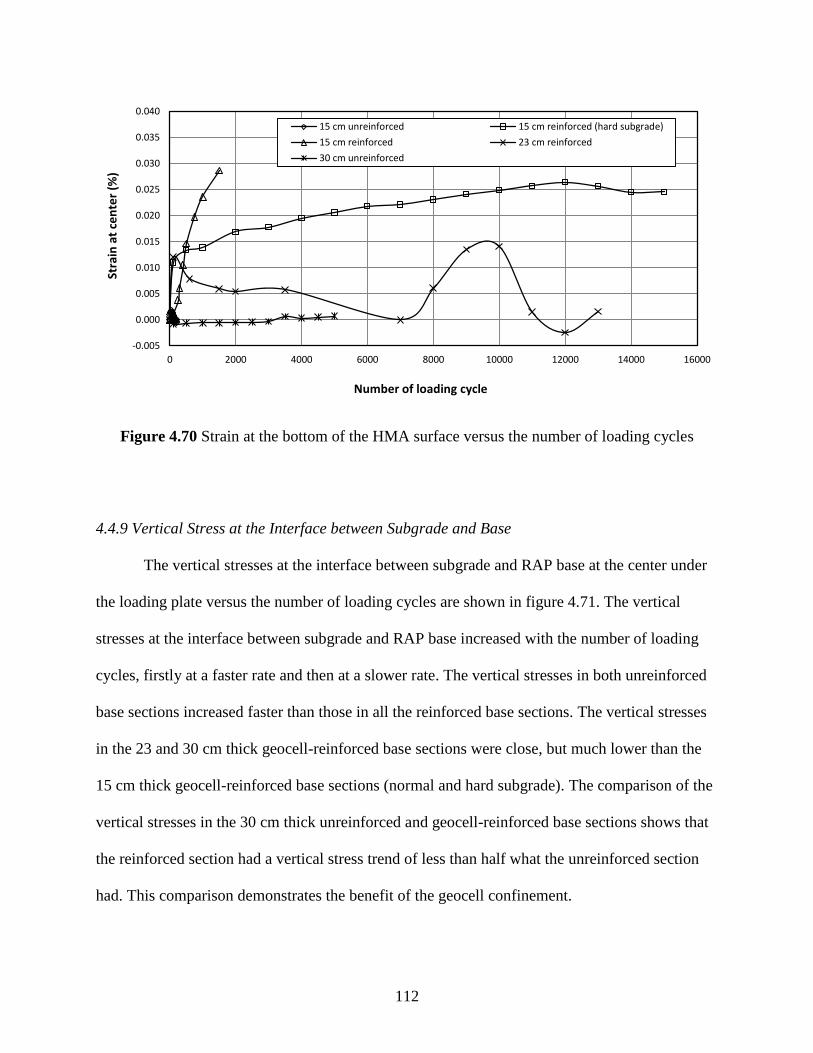
4.4.8 Maximum Strain at the Bottom of the HMA Surface 111
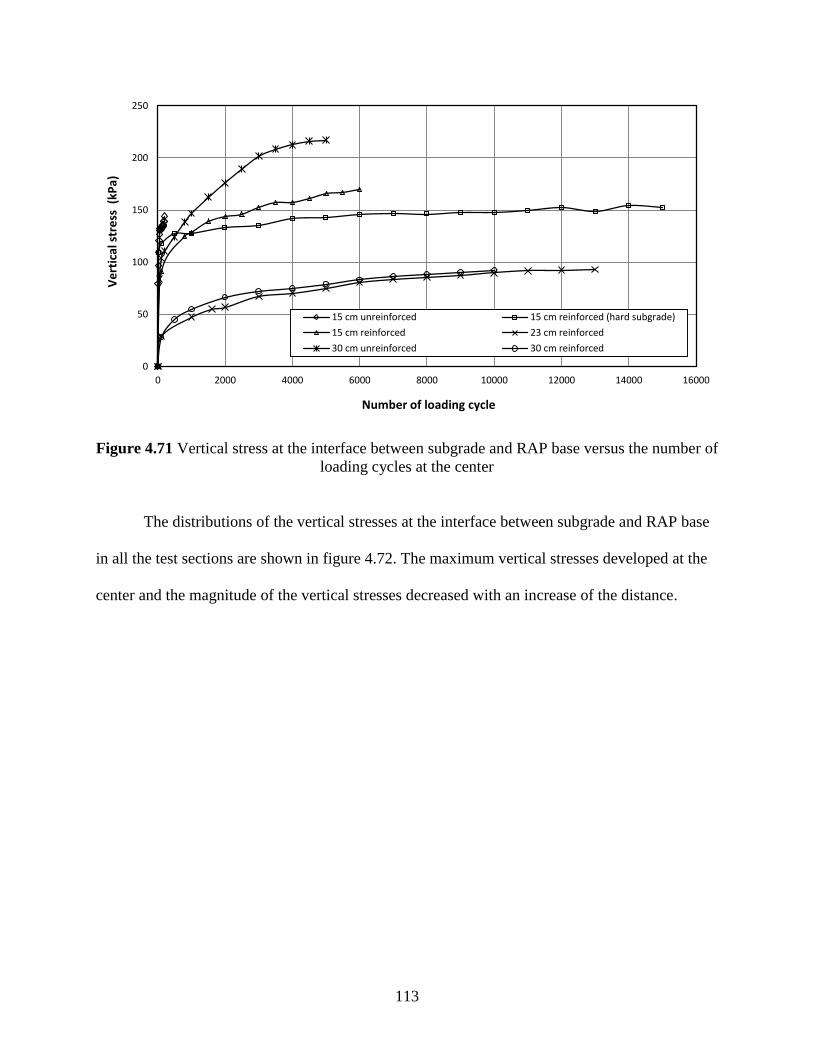
4.4.9 Vertical Stress at the Interface between Subgrade and Base 112
4.4.10 Stress Distribution Angle 114
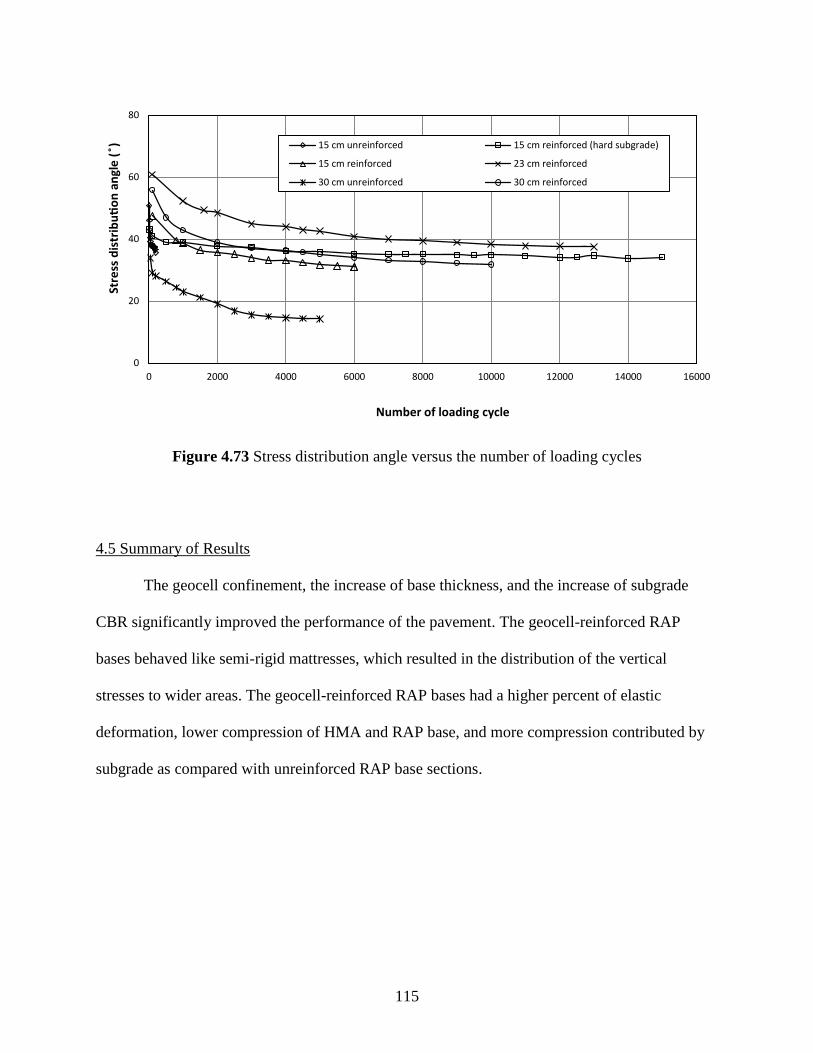
4.5 Summary of Results 115
5.1 Conclusions 116
5.2 Recommendations 117
Page 6
v
List of Figures
Figure 2.1 Usage and potential of various RAP percentages in the
intermediate layer 14
Figure 2.2 Usage and potential of various RAP percentages in the
surface layer 15
Figure 2.3 States with increased RAP used since 2007 15
Figure 3.1 Grain size distribution curve of Kansas River (KS) sand 23
Figure 3.2 Standard Proctor compaction and CBR curves of the subgrade 24
Figure 3.3 Power gradation curve of the aggregates extracted by the ignition
method before and after compaction 26
Figure 3.4 Standard Proctor compaction and CBR curves of RAP 27
Figure 3.5 The bundled NPA Geocell used in this research 28
Figure 3.6 Non-woven geotextile used in this research 30
Figure 3.7 Earth pressure cells on the top of the subgrade 32
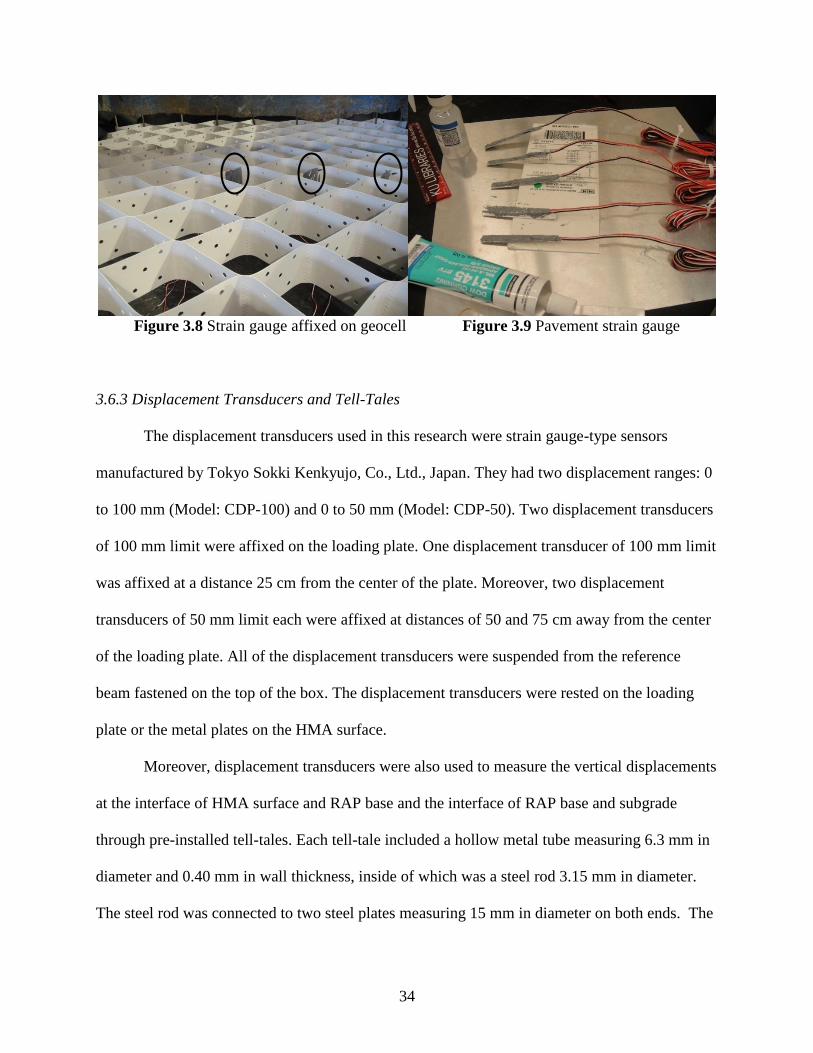
Figure 3.8 Strain gauge affixed on geocell 33
Figure 3.9 Pavement strain gauge 33
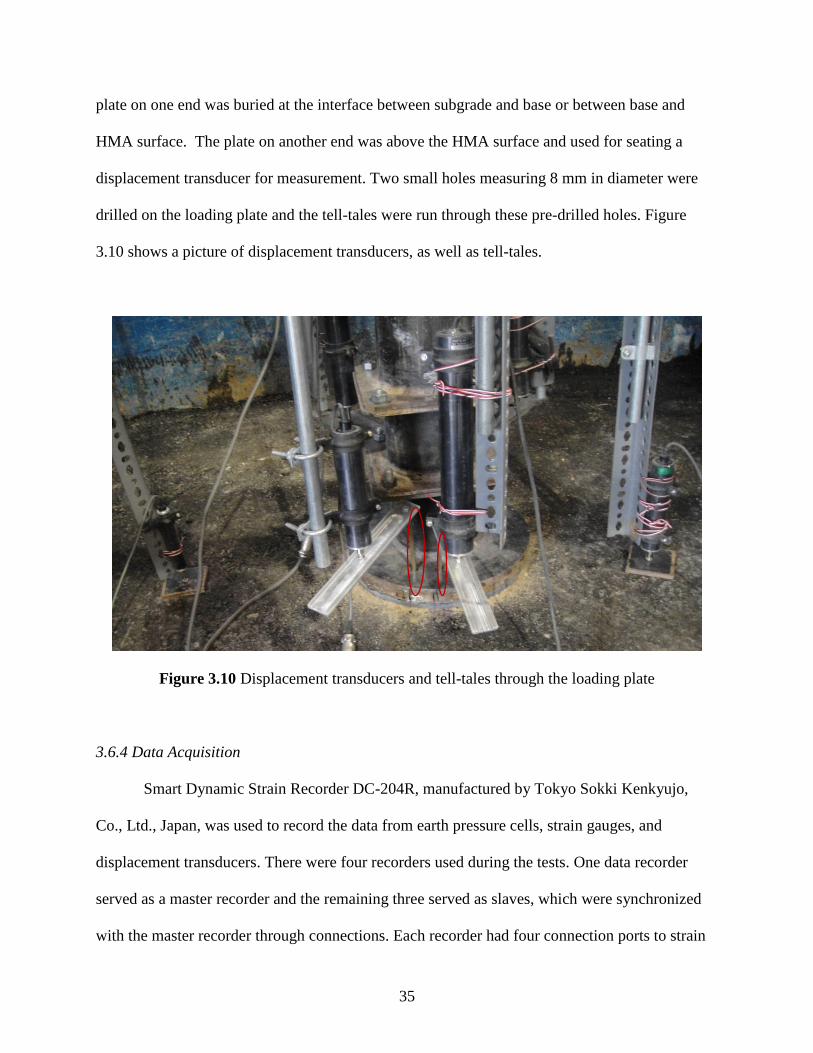
Figure 3.10 Displacement transducers and tell tales through the loading plate 35
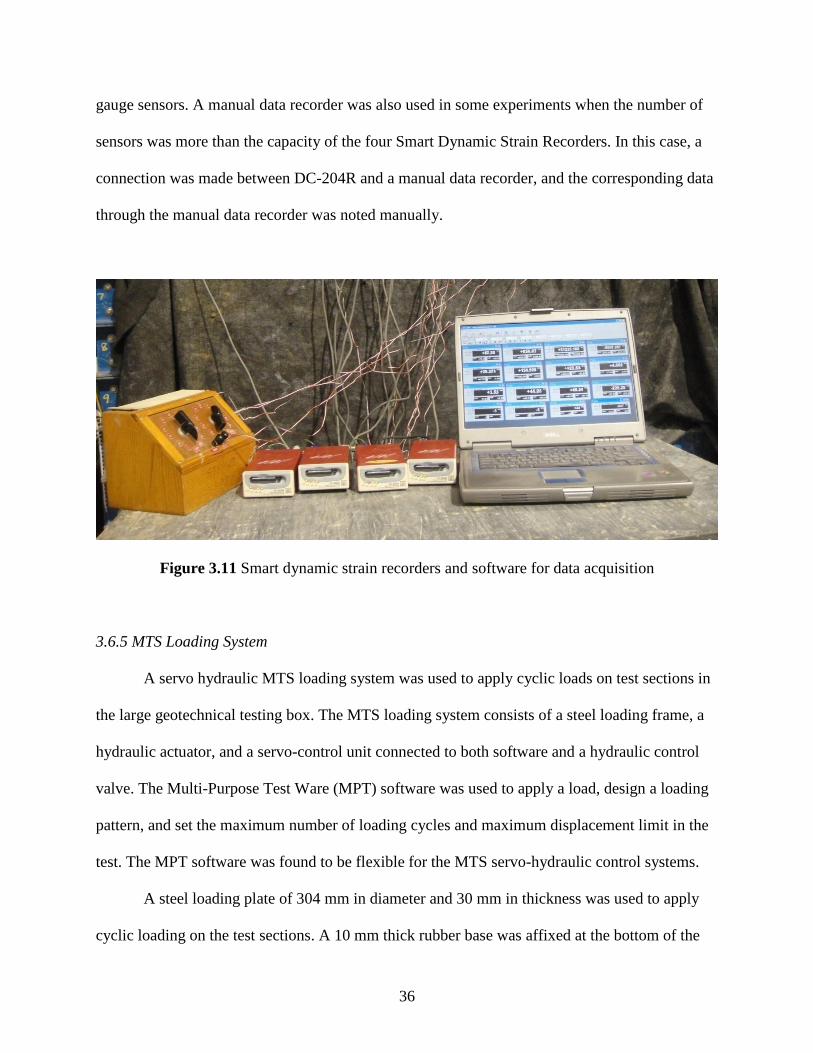
Figure 3.11 Smart Dynamic Strain Recorder and software for data acquisition 36
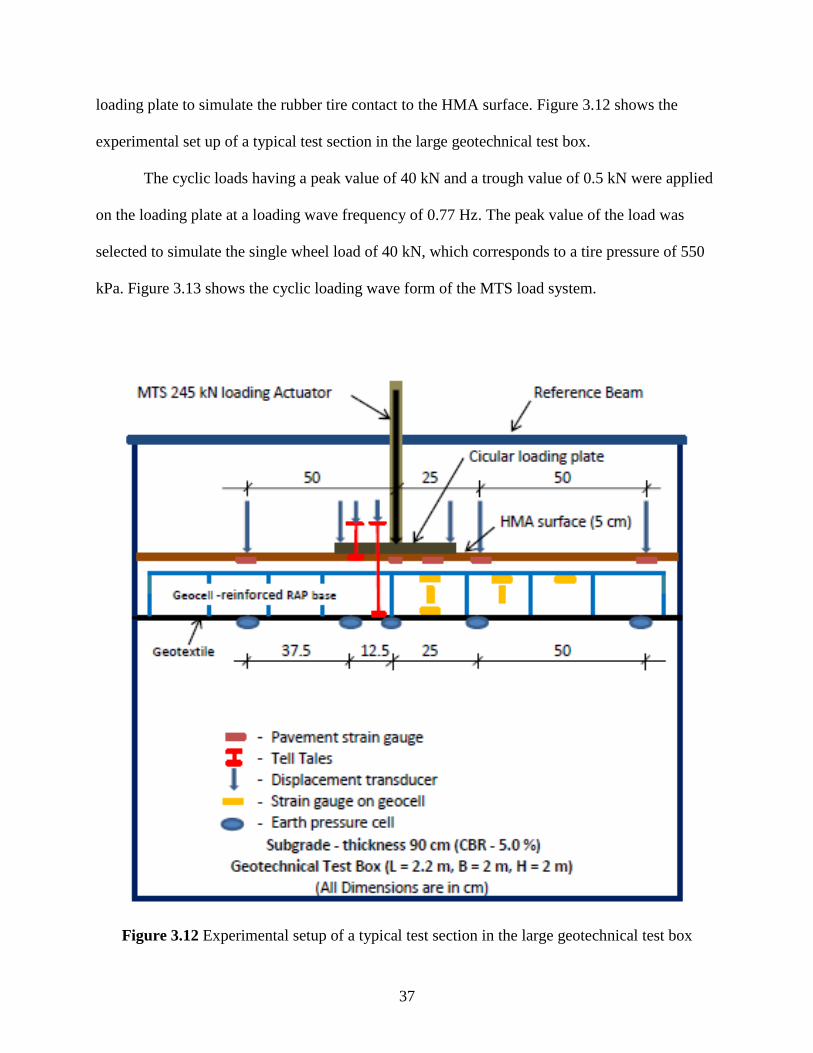
Figure 3.12 Experimental set up of a typical test section in the large
geotechnical test box 37
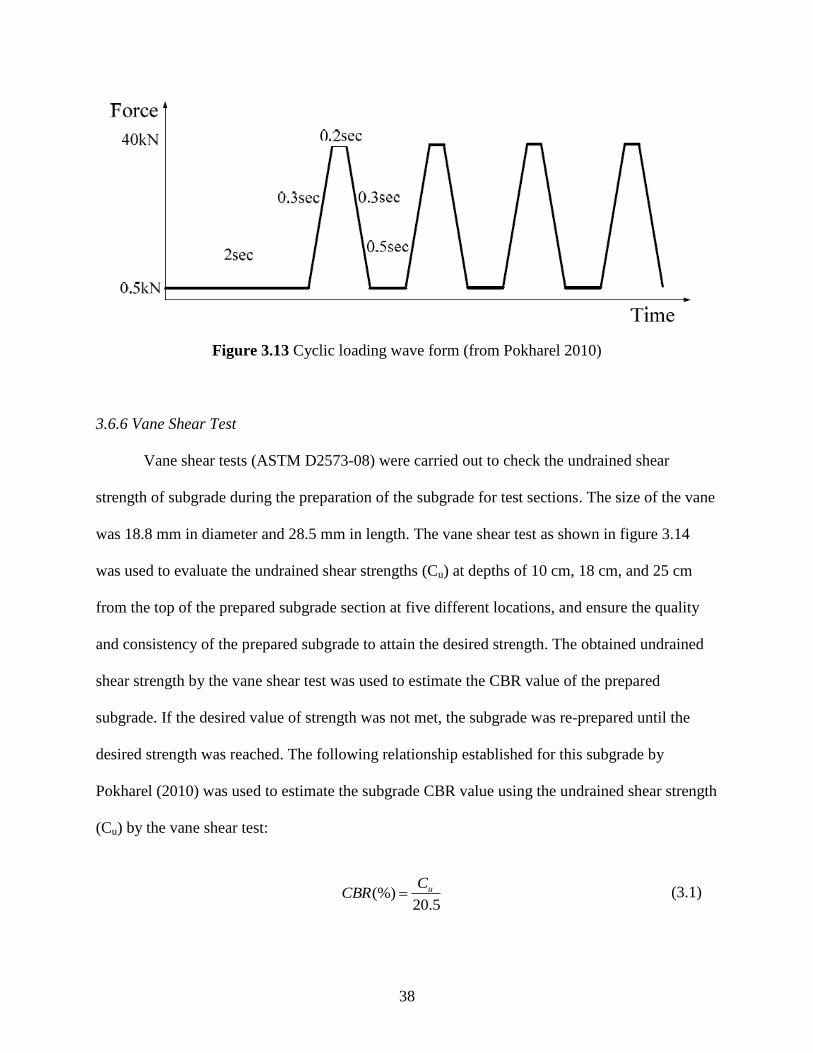
Figure 3.13 Cyclic loading wave form 38
Figure 3.14 Vane shear test apparatus 39
Figure 3.15 Light weight deflectometer test on the prepared test section 41
Figure 3.16 Vibratory plate compactor 41
Figure 3.17 Samples taken by core cutter at different locations 42
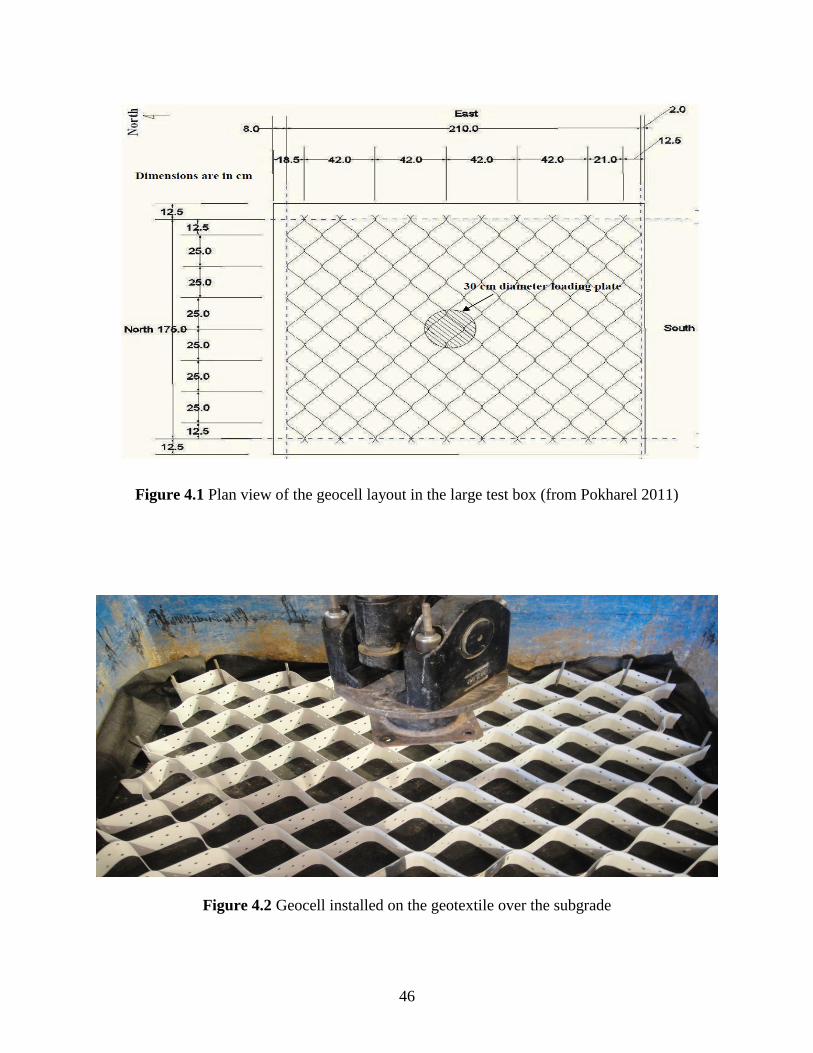
Figure 4.1 Plan view of geocell layout in the large box test 46
Figure 4.2 Geocell installed on the geotextile over the subgrade 46
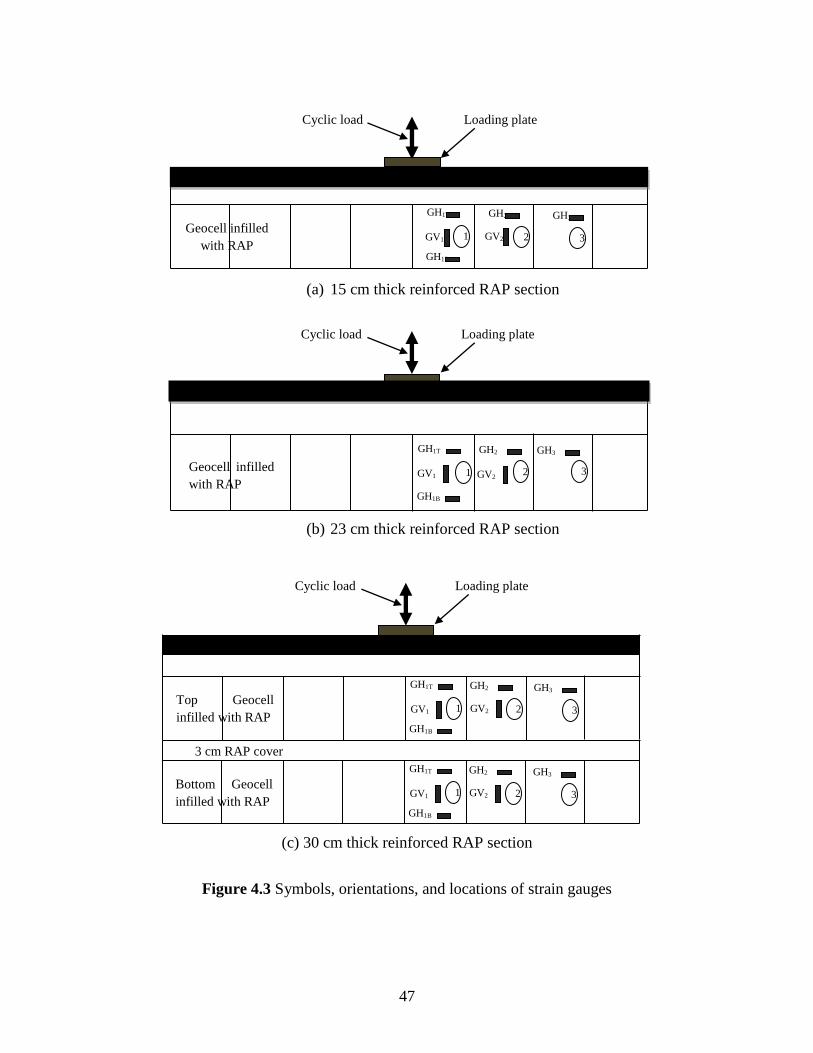
Figure 4.3 Symbols, orientations, and locations of strain gauges 47
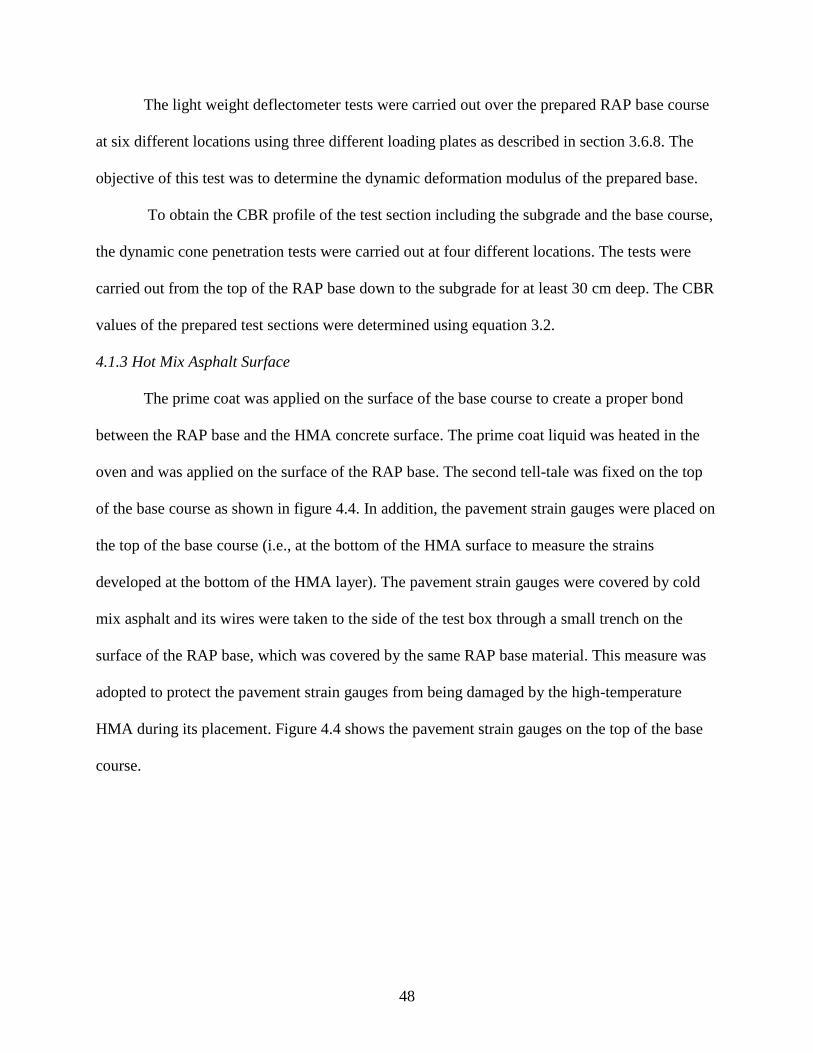
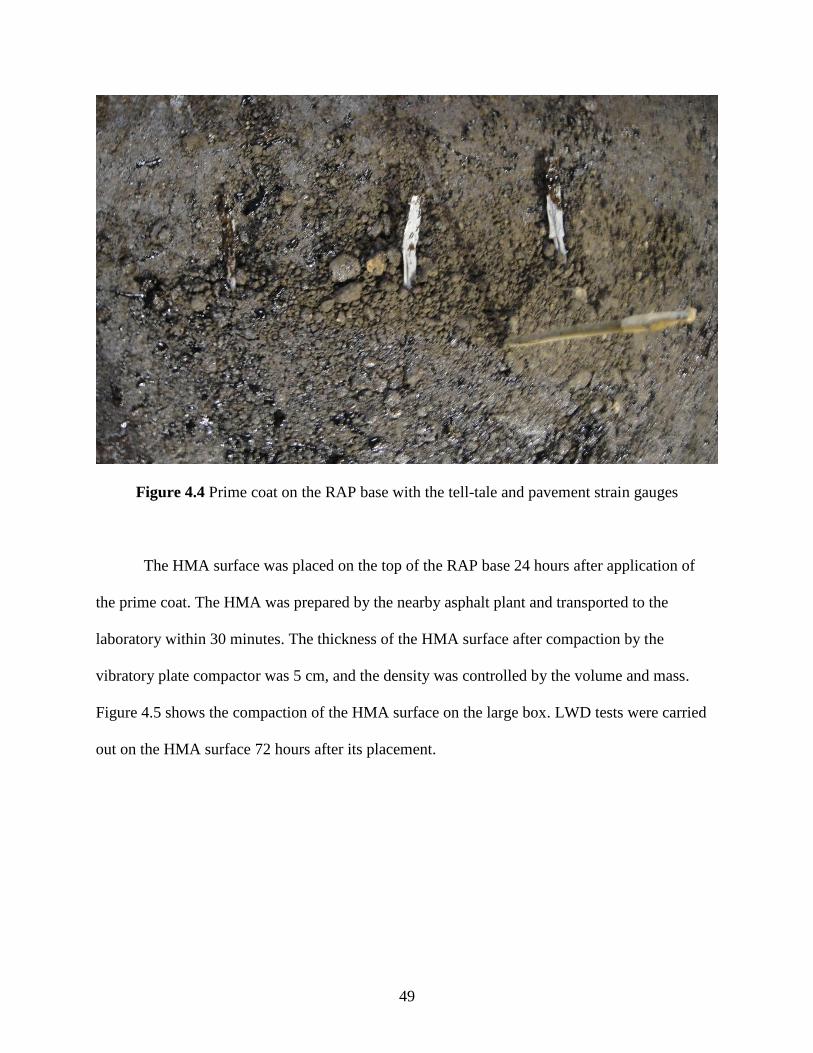
Figure 4.4 Prime coat on the RAP base with the tell-tale and pavement strain gauge 49
Figure 4.5 Compaction of HMA surface by the vibratory plate compactor 50
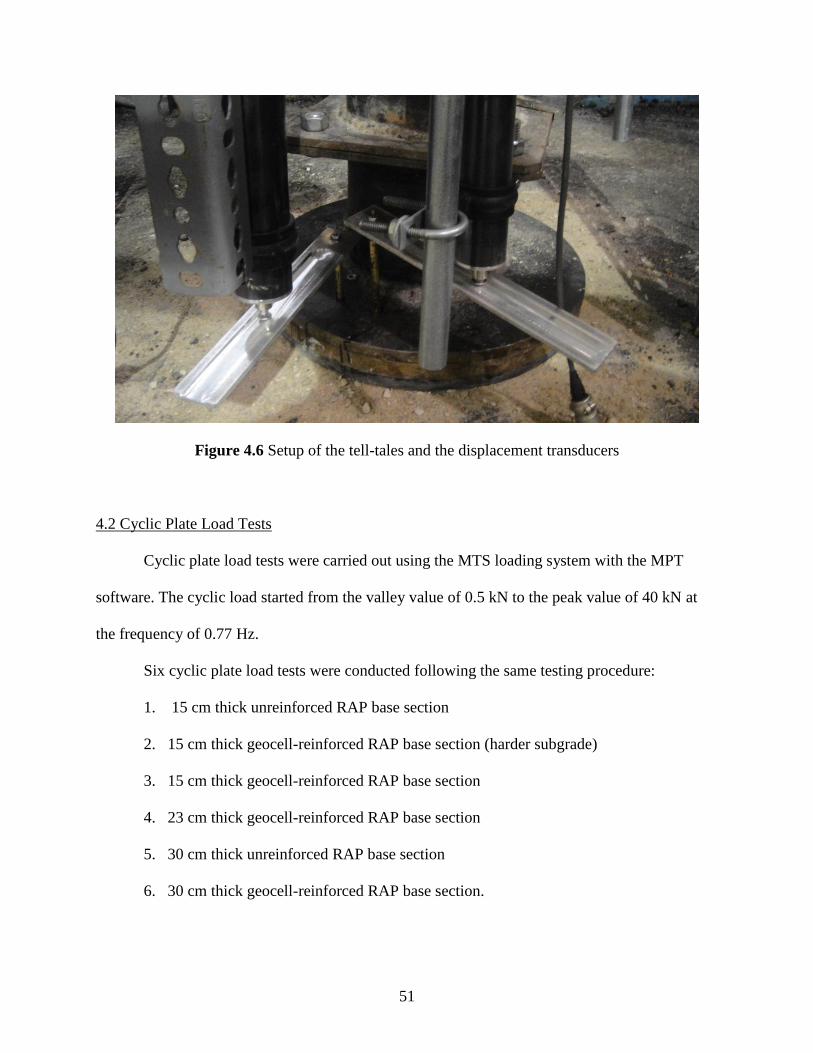
Figure 4.6 Setup of the tell tales and the displacement transducers 51
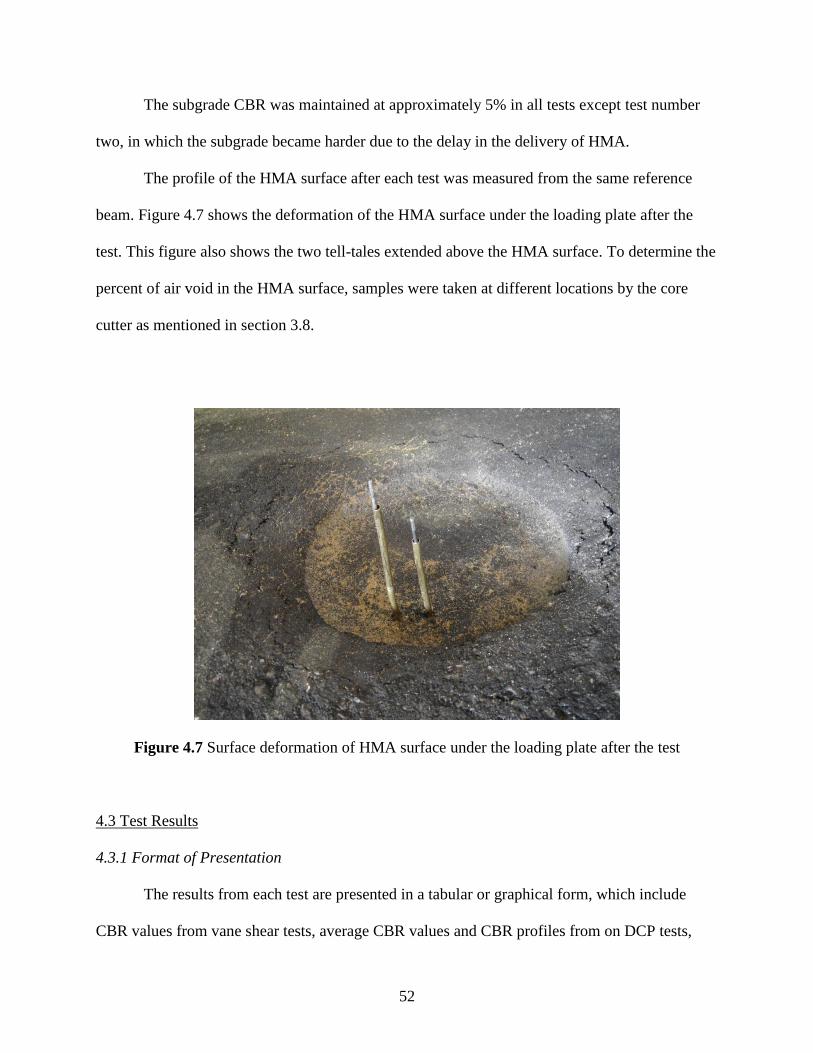
Figure 4.7 Surface deformation of the HMA surface under the loading plate
after the test 52
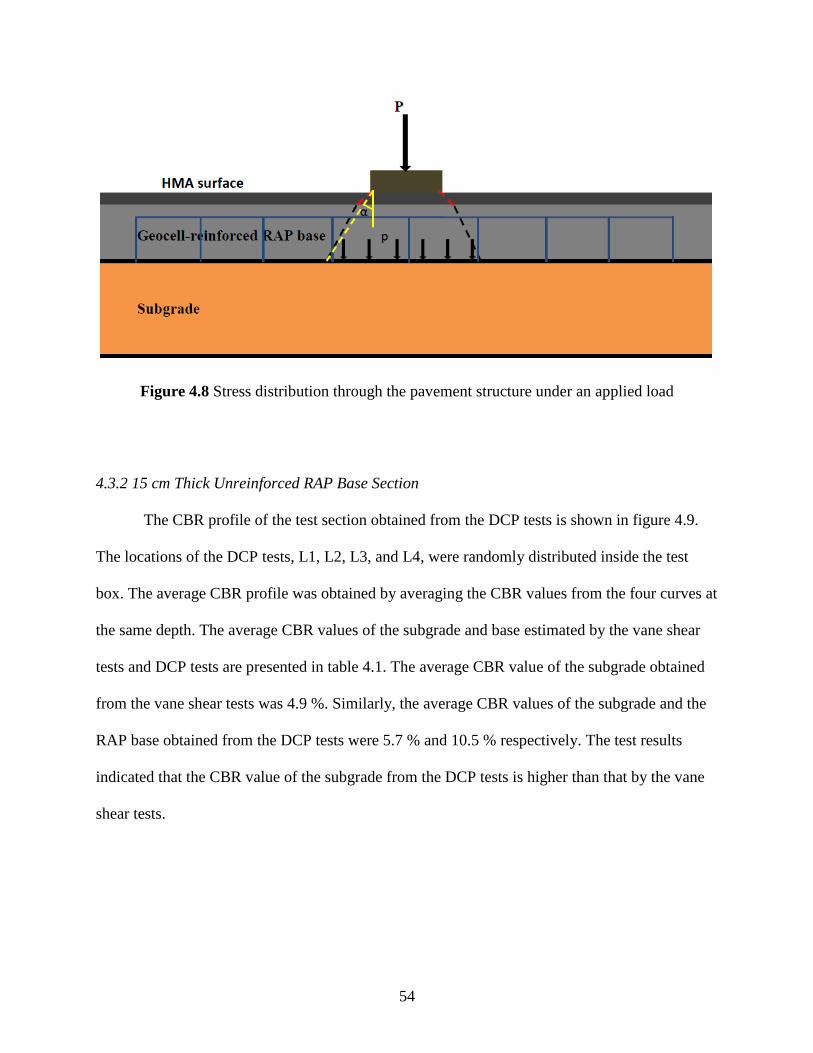
Figure 4.8 Stress distribution through the pavement structure under an applied load 54
Figure 4.9 The CBR profiles obtained from the DCP tests for the 15 cm thick
unreinforced RAP base section 55
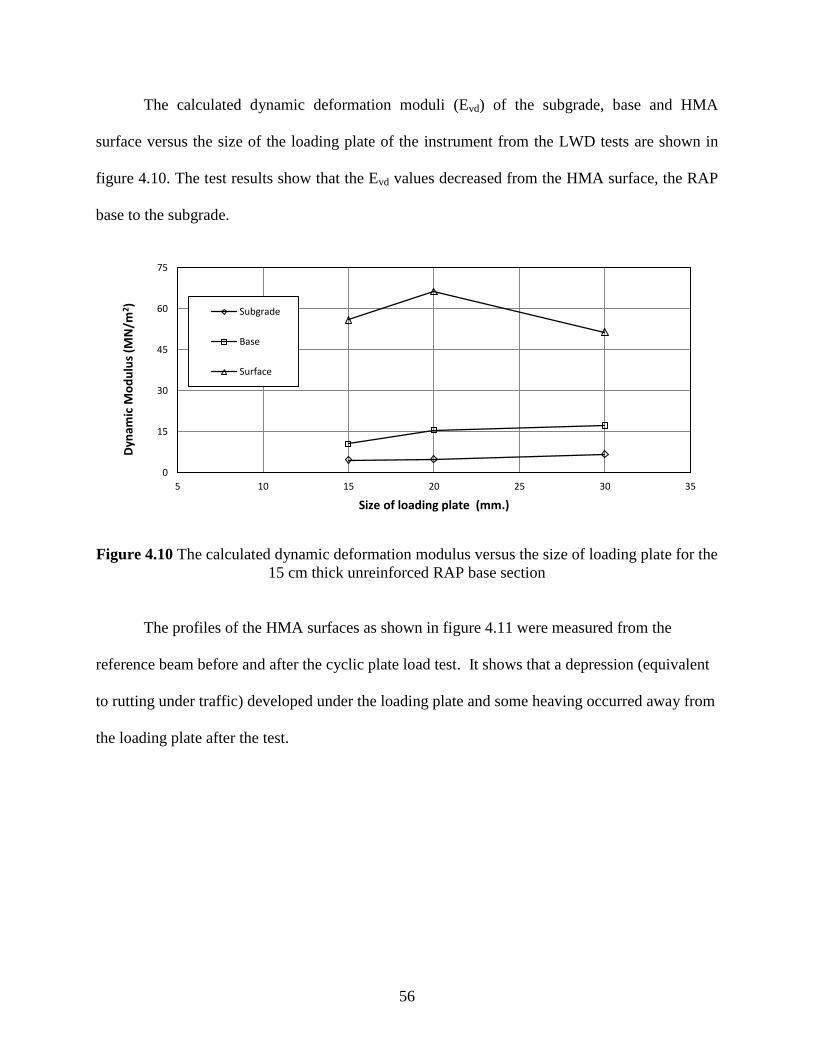
Figure 4.10 The calculated dynamic deformation modulus versus the size of loading
plate for the 15 cm thick unreinforced RAP base section 56
Page 7
vi
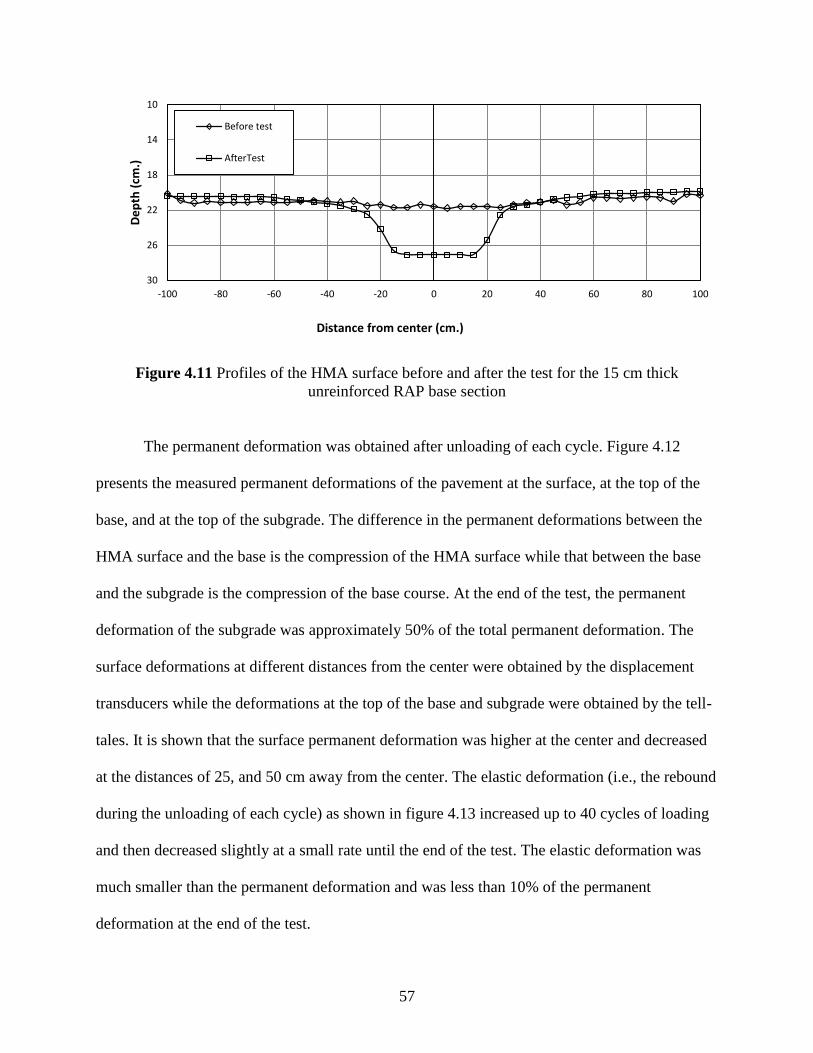
Figure 4.11 Profiles of the HMA surface before and after the test for the 15 cm thick
unreinforced RAP base section 57
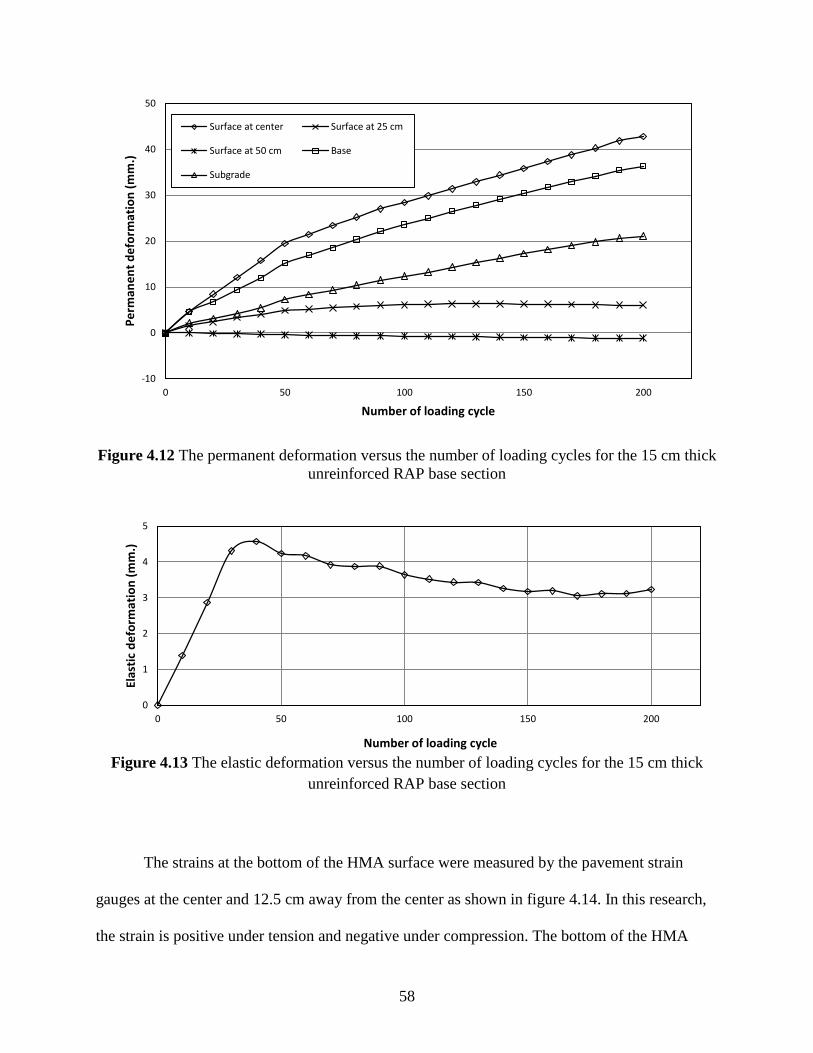
Figure 4.12 The permanent deformation versus the number of loading cycles
for the 15 cm thick unreinforced RAP base section 58
Figure 4.13 The elastic deformation versus the number of loading cycles for
the 15 cm thick unreinforced RAP base section 58
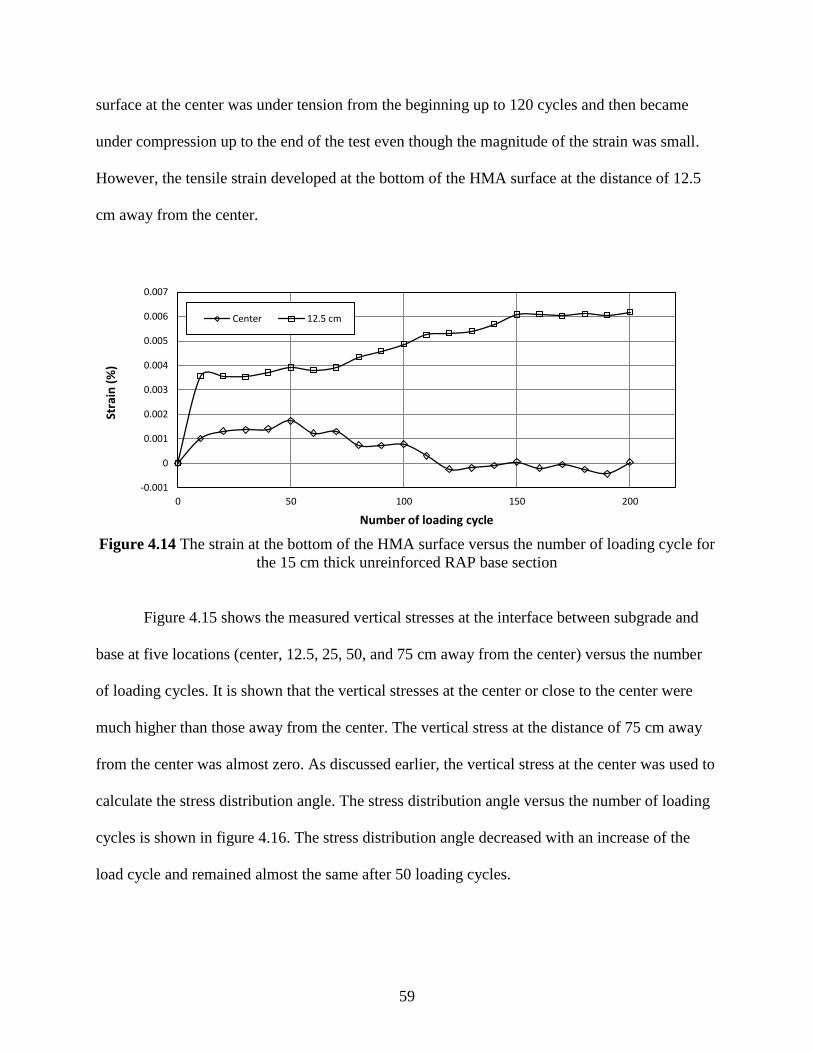
Figure 4.14 The strain at the bottom of the HMA surface versus number
of loading cycles for the 15 cm thick unreinforced RAP base section 59
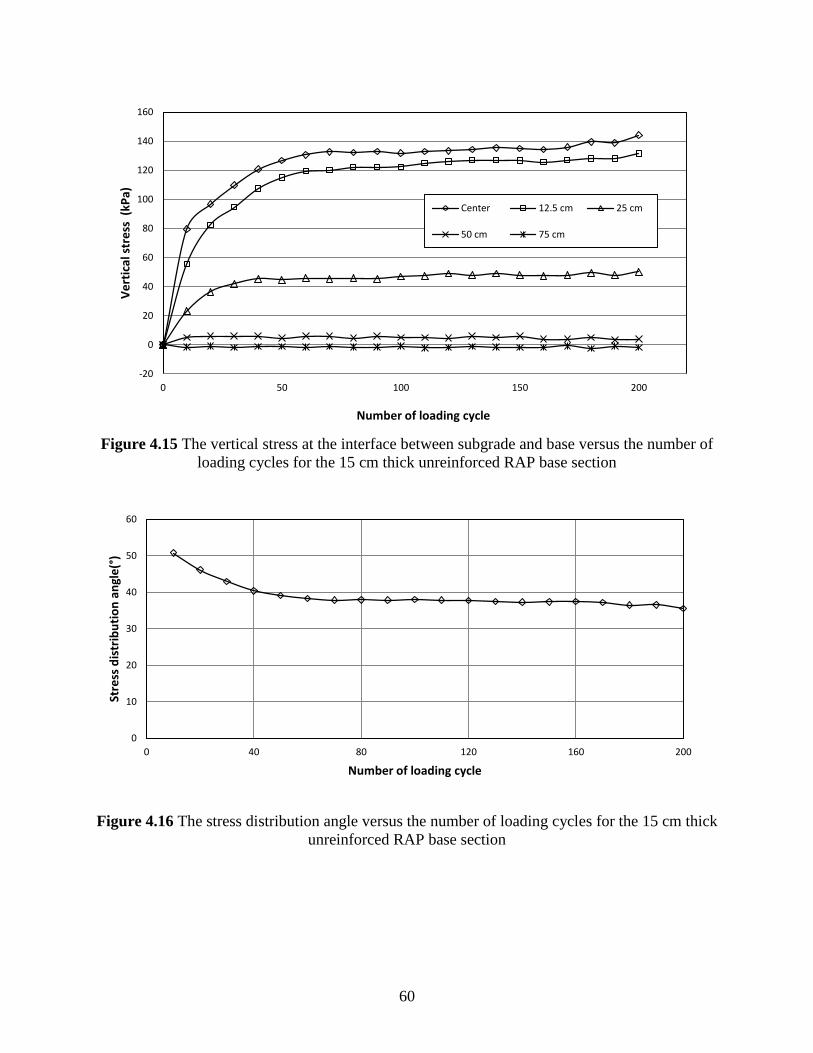
Figure 4.15 The vertical stress at the interface between subgrade and base versus the
number of loading cycles for the 15 cm thick unreinforced RAP
base section 60
Figure 4.16 The stress distribution angle versus number of loading cycle for 15 cm
thick unreinforced RAP base section 60
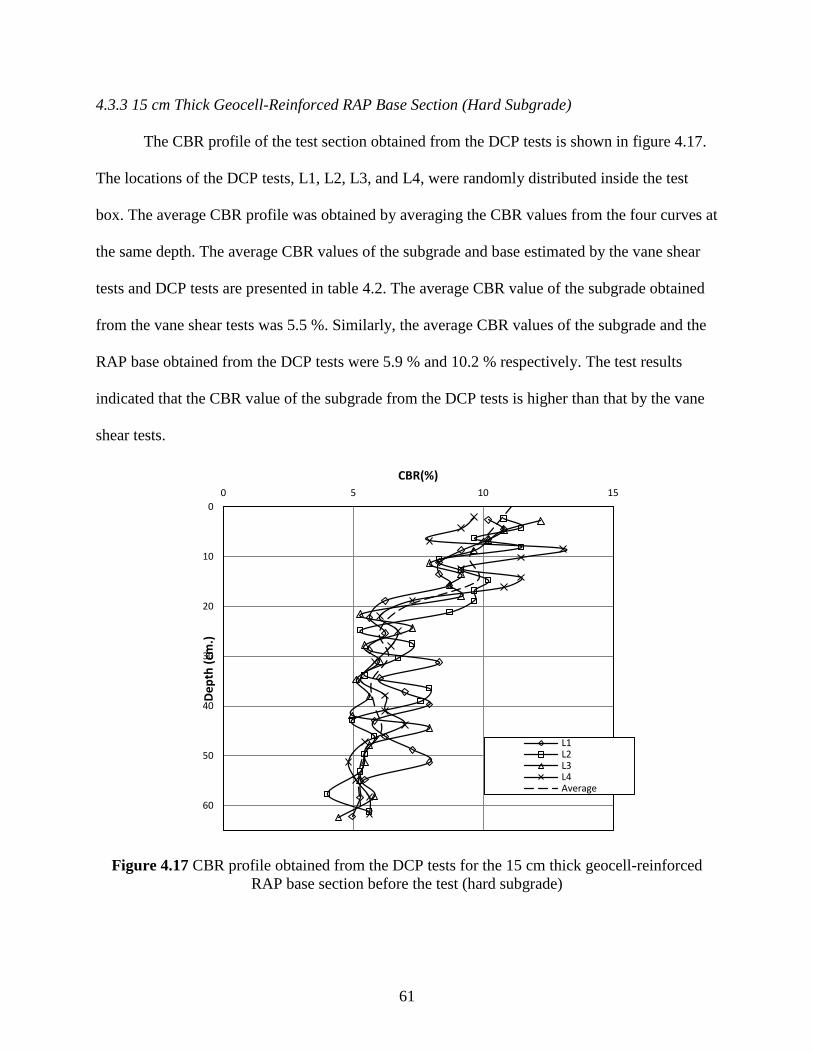
Figure 4.17 The CBR profile obtained from the DCP tests for the 15 cm
thick geocell-reinforced RAP base section before the test (hard subgrade) 61
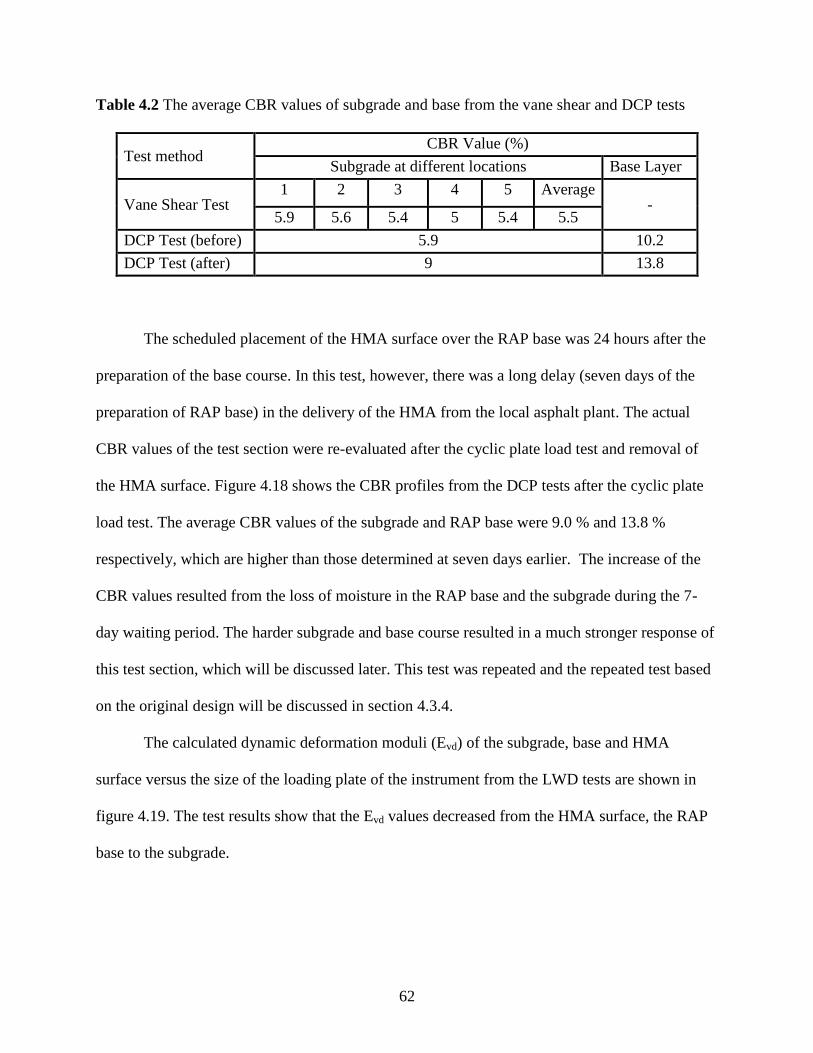
Figure 4.18 The CBR profile obtained from the DCP tests for the 15 cm thick
geocell-reinforced RAP base section after the test (hard subgrade) 63
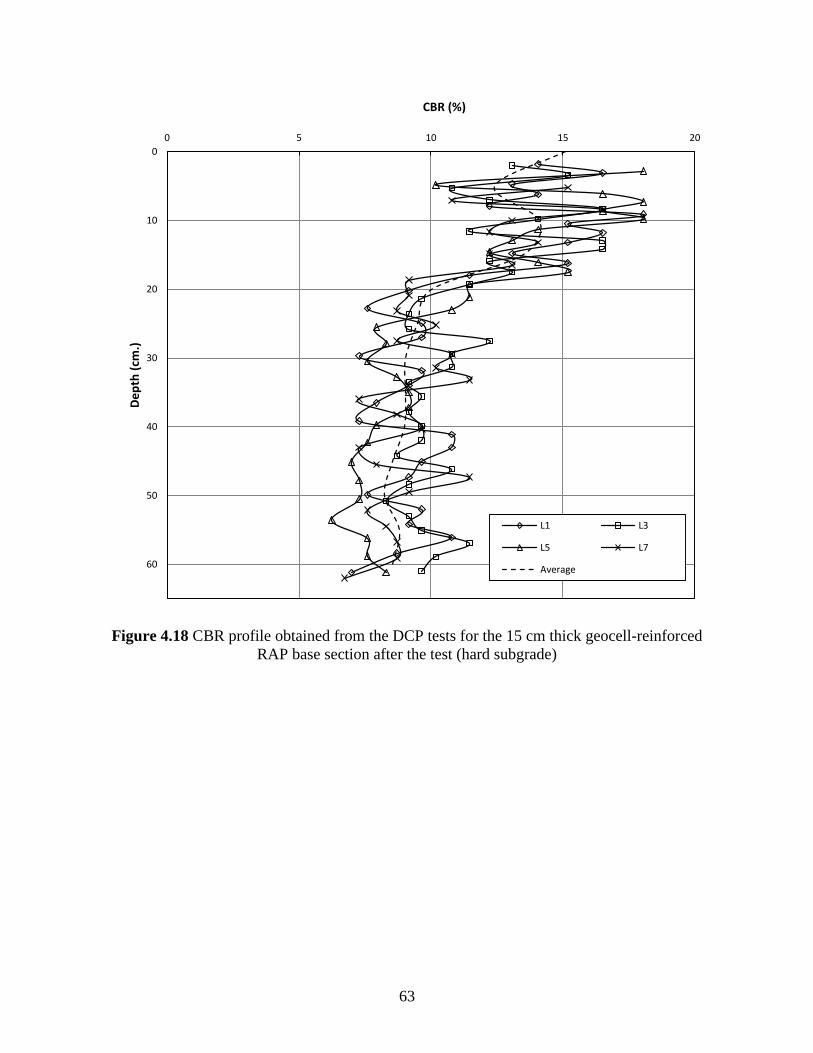
Figure 4.19 The calculated dynamic deformation modulus versus the size of loading
plate for the 15 cm thick geocell-reinforced RAP base section
(hard subgrade) 64
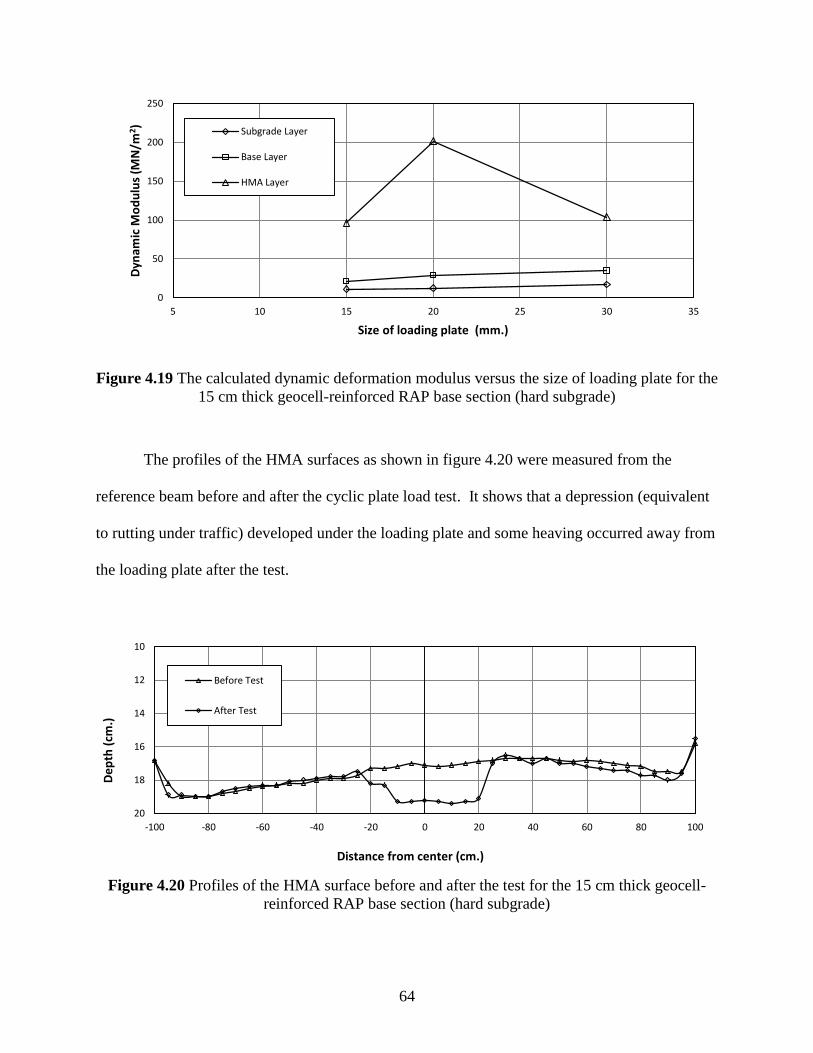
Figure 4.20 Profiles of the HMA surface before and after the test for the
15 cm thick geocell-reinforced RAP base section (hard subgrade) 64
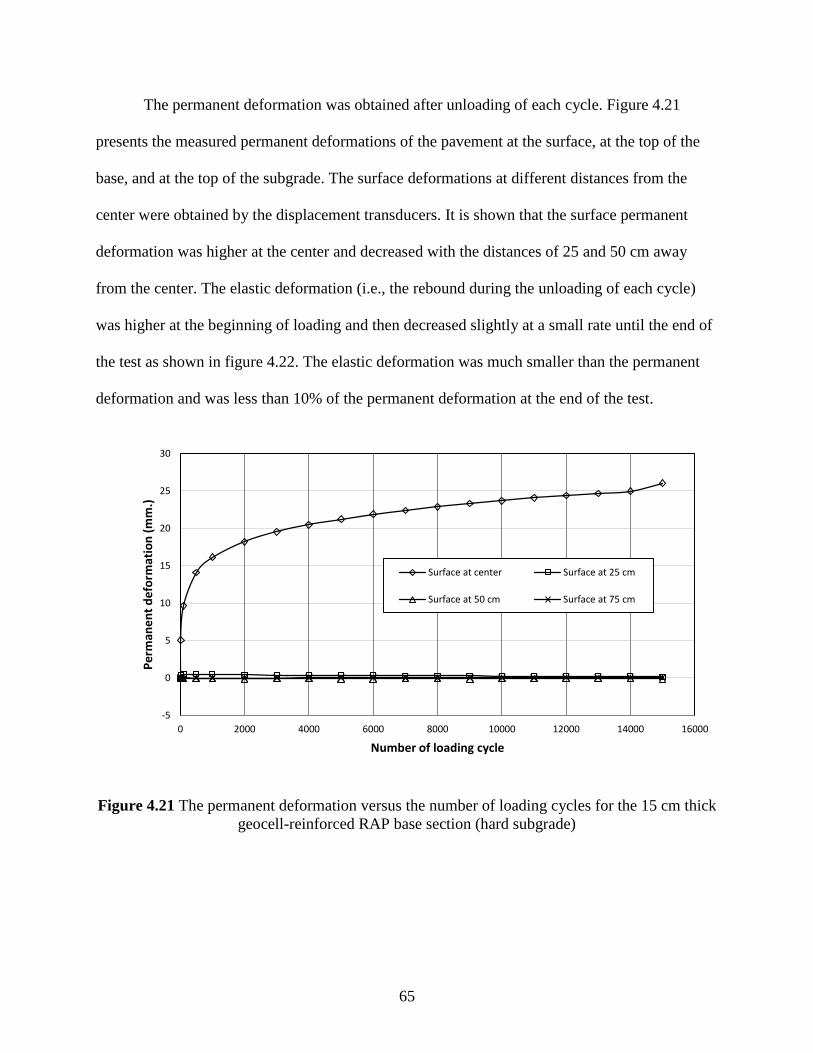
Figure 4.21 The permanent deformation versus the number of loading cycles
for the 15 cm thick geocell-reinforced RAP base section (hard subgrade) 65
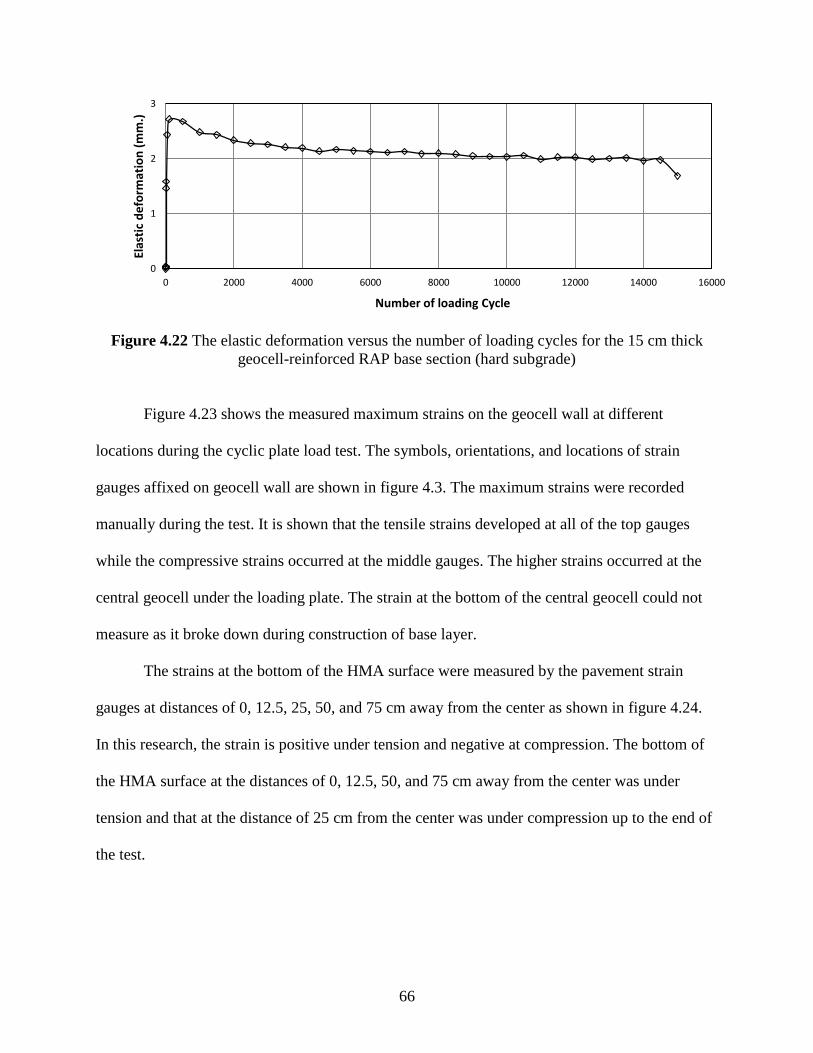
Figure 4.22 The elastic deformation versus the number of loading cycles for the 15 cm
thick geocell-reinforced RAP base section (hard subgrade) 66
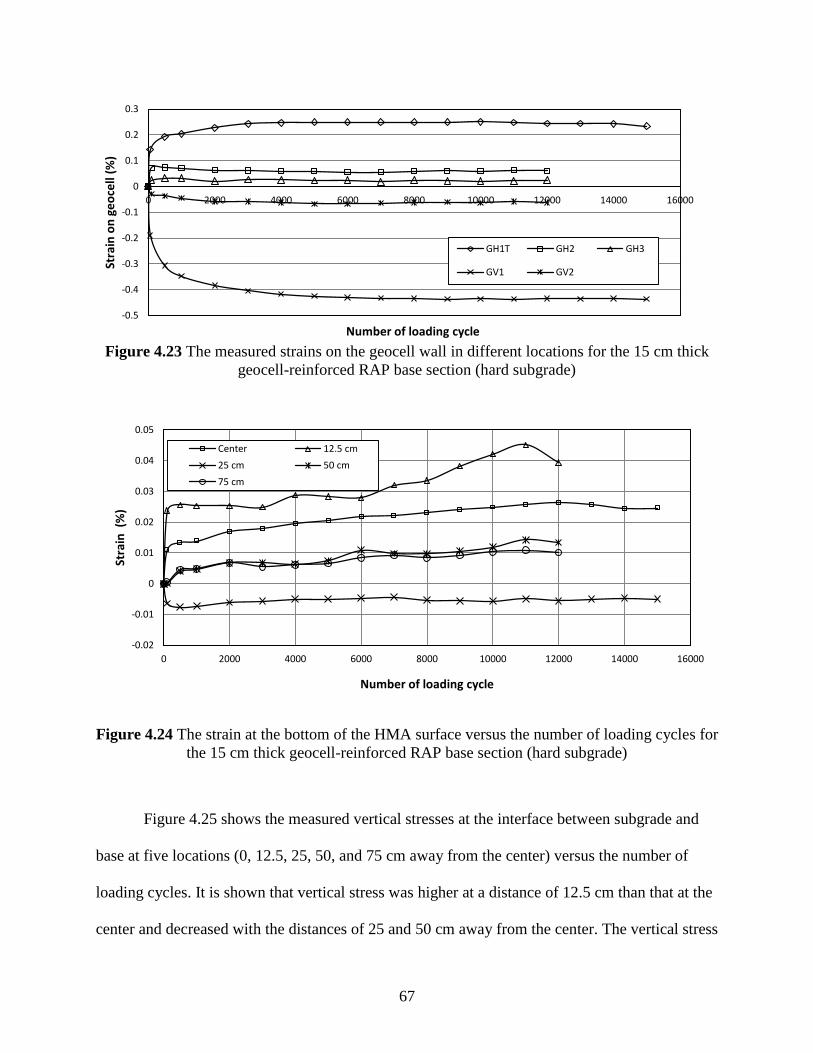
Figure 4.23 The measured strain on the geocell wall in different locations for the 15 cm
thick geocell-reinforced RAP base section (hard subgrade) 67
Figure 4.24 The strain at the bottom of the HMA surface versus number of loading
cycle for the 15 cm thick geocell-reinforced RAP
base section (hard subgrade) 67
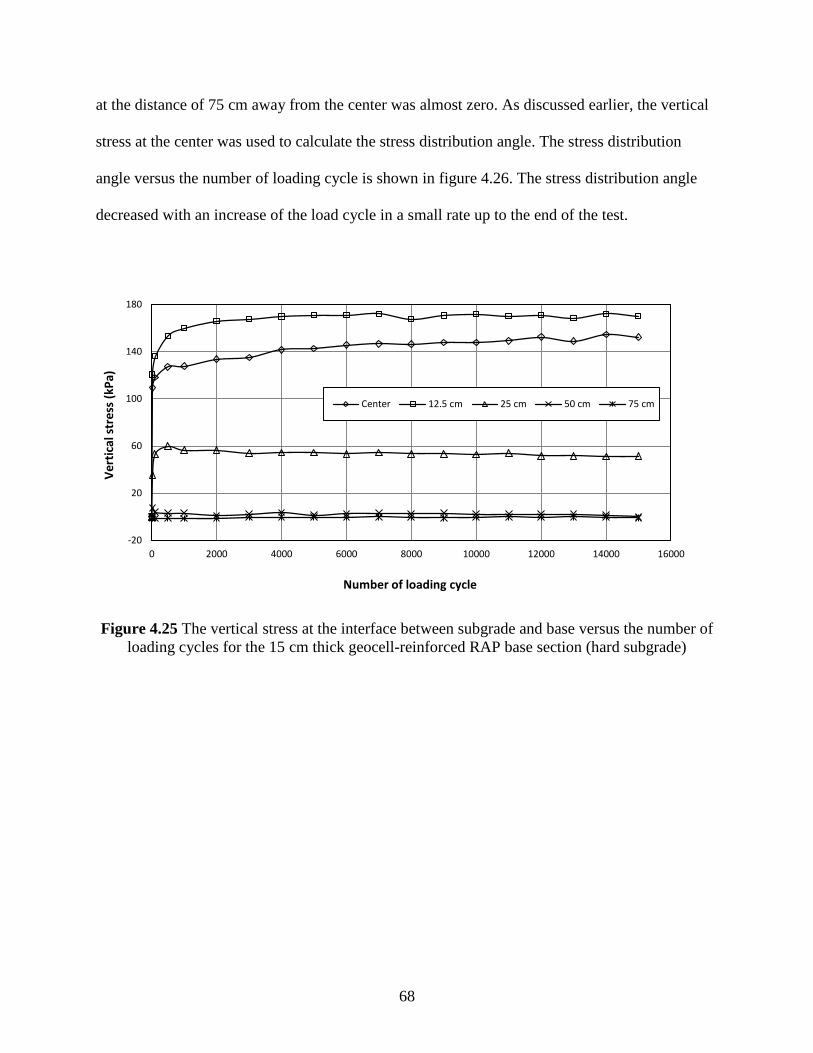
Figure 4.25 The vertical stress at the interface between subgrade and base versus the
number of loading cycles for the 15 cm thick geocell-reinforced RAP
base section (hard subgrade) 68
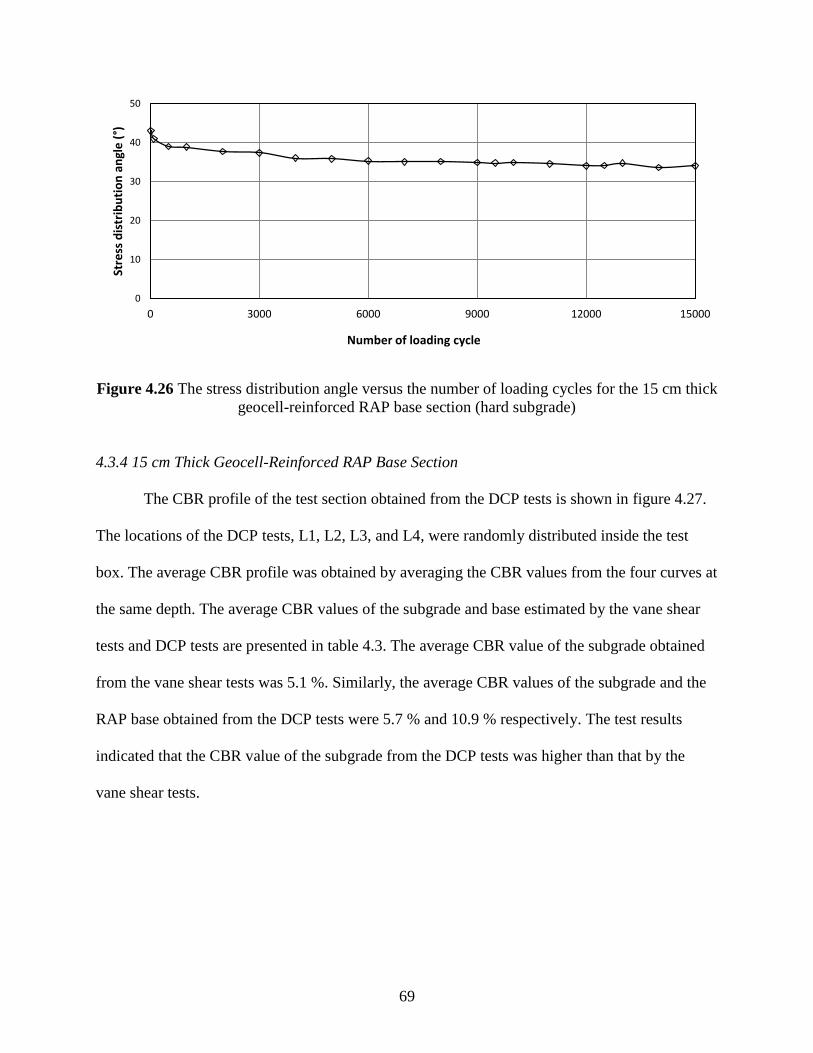
Figure 4.26 The stress distribution angle versus the number of loading cycles
for the 15 cm thick geocell-reinforced RAP base section (hard subgrade) 69
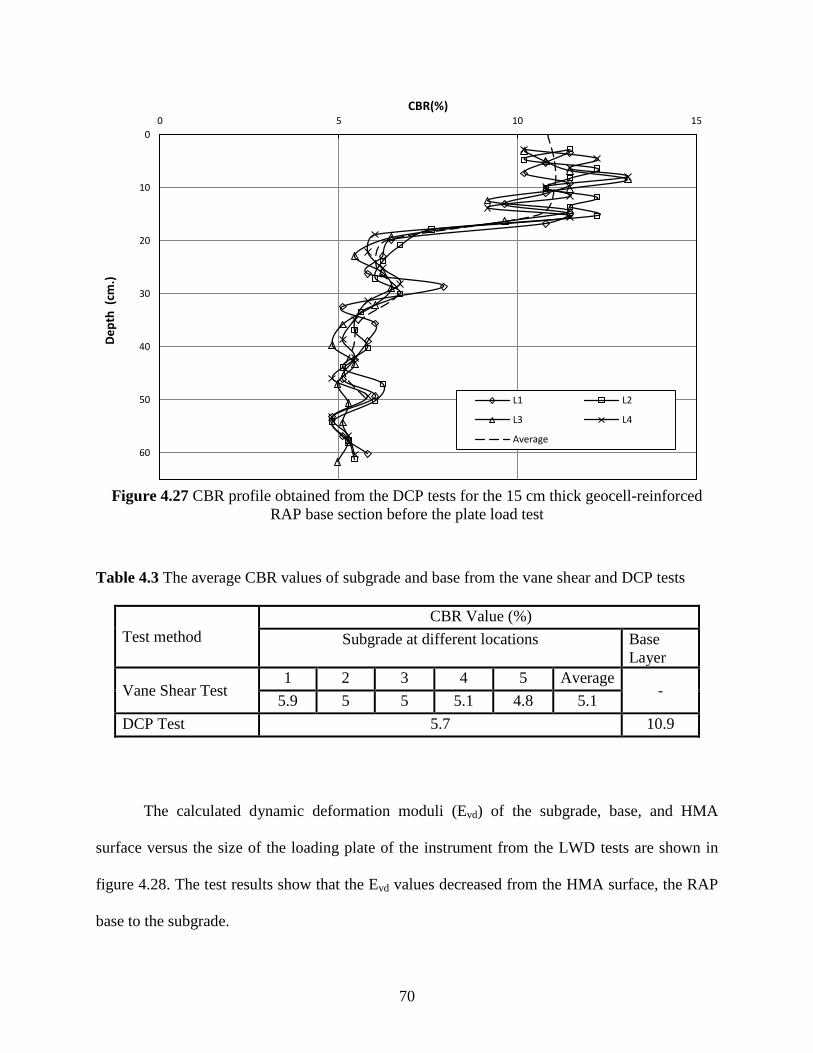
Figure 4.27 The CBR profile obtained from the DCP tests for the 15 cm thick
geocell-reinforced RAP base section before the plate load test 70
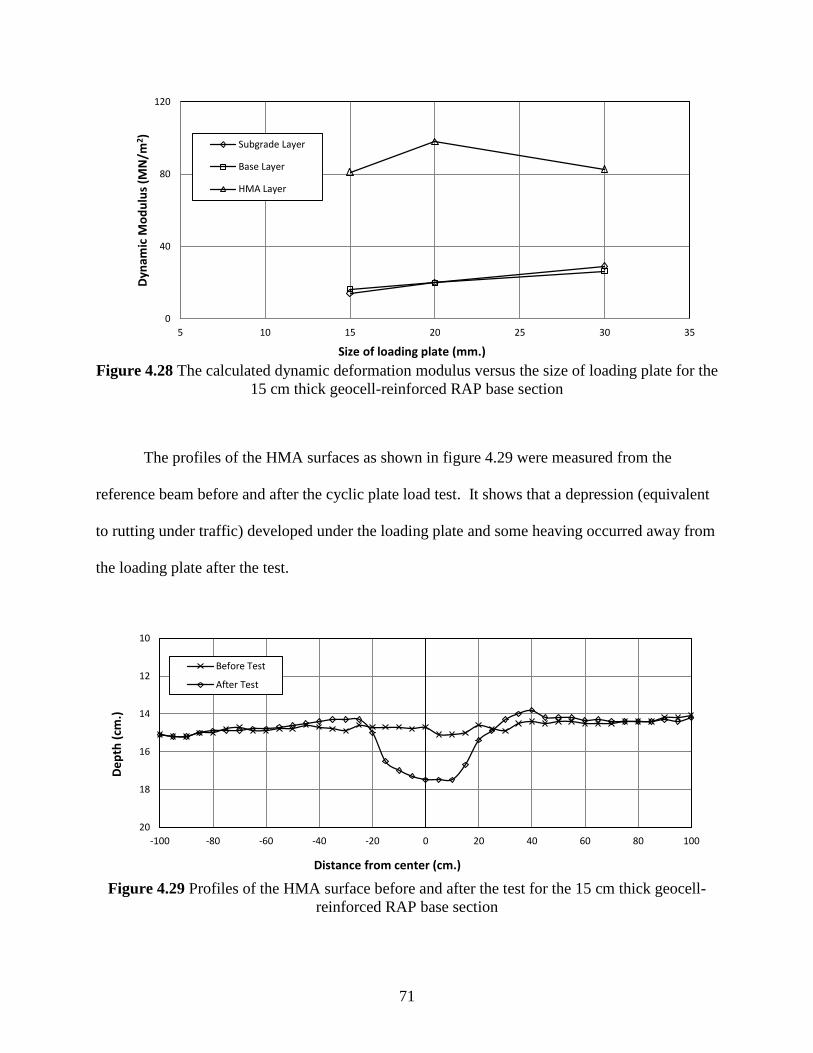
Figure 4.28 The calculated dynamic deformation modulus versus the size of loading
plate for the 15 cm thick geocell-reinforced RAP base section 71
Page 8
vii
Figure 4.29 Profiles of the HMA surface before and after the test for the 15 cm thick
geocell-reinforced RAP base section 71
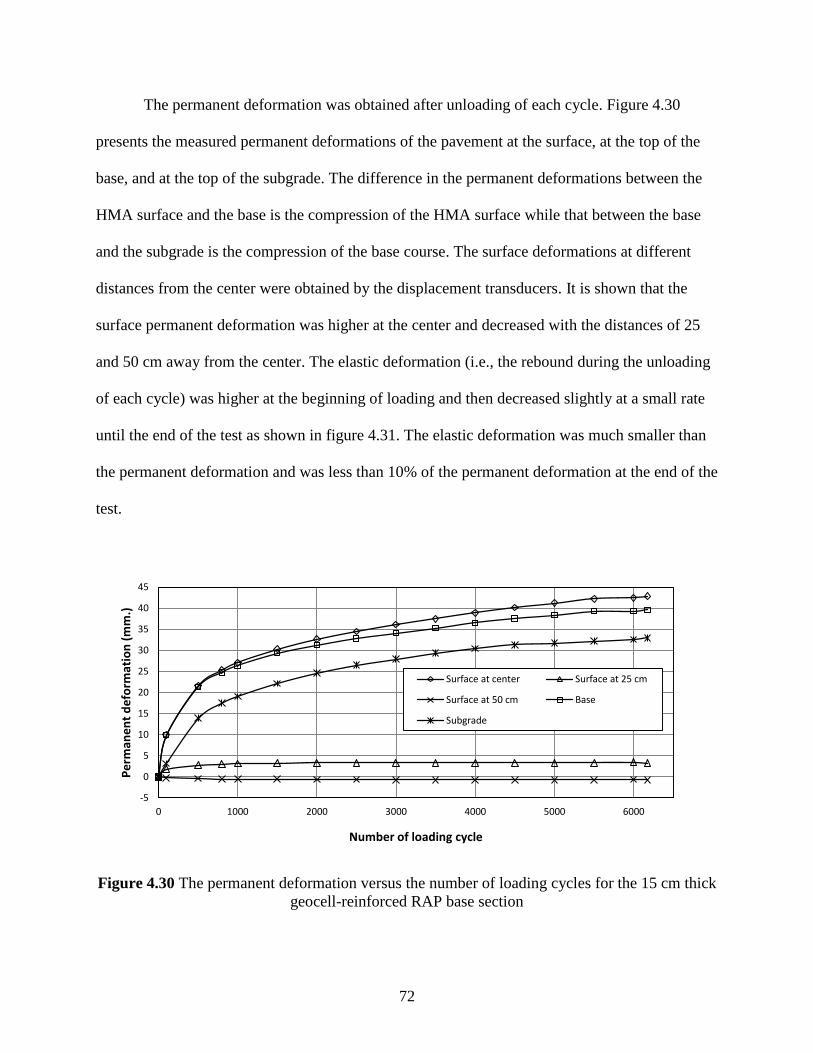
Figure 4.30 The permanent deformation versus the number of loading cycles
for the 15 cm thick geocell-reinforced RAP base section 72
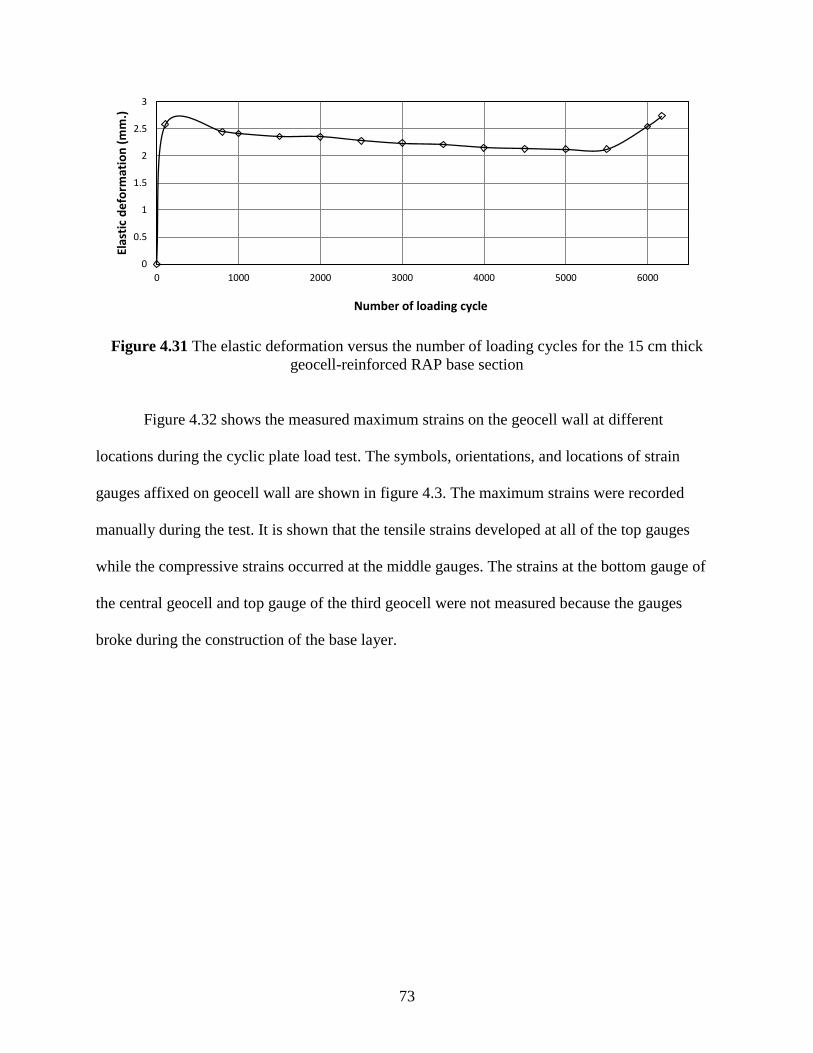
Figure 4.31 The elastic deformation versus the number of loading cycles for the 15 cm
thick geocell-reinforced RAP base section 73
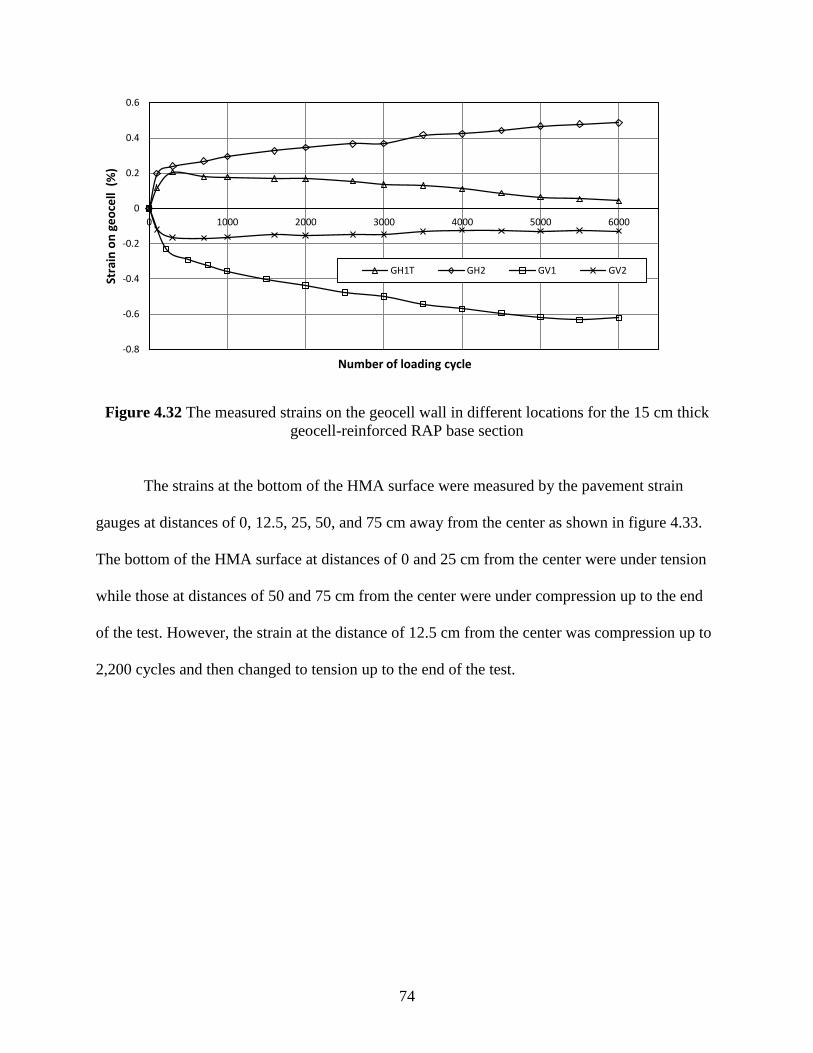
Figure 4.32 The measured strain on the geocell wall in different locations for the 15 cm
thick geocell-reinforced RAP base section 74
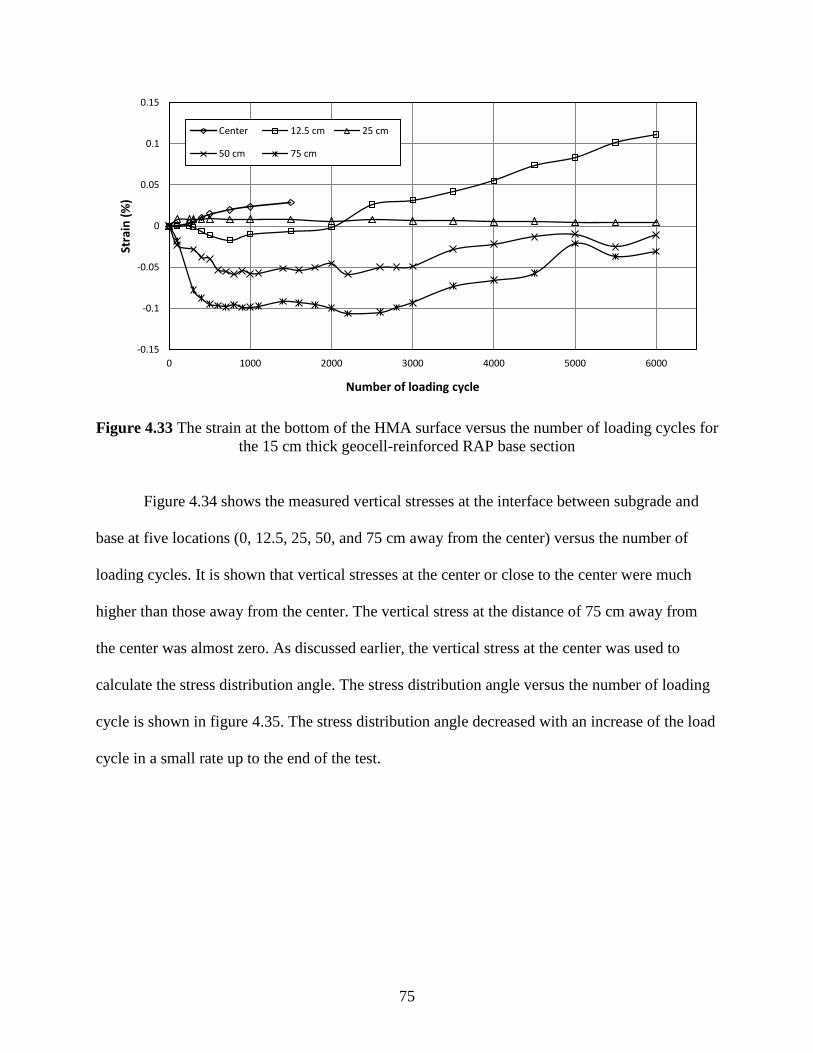
Figure 4.33 The strain at the bottom of the HMA surface versus the number of loading
cycles for the 15 cm thick geocell-reinforced RAP base section 75
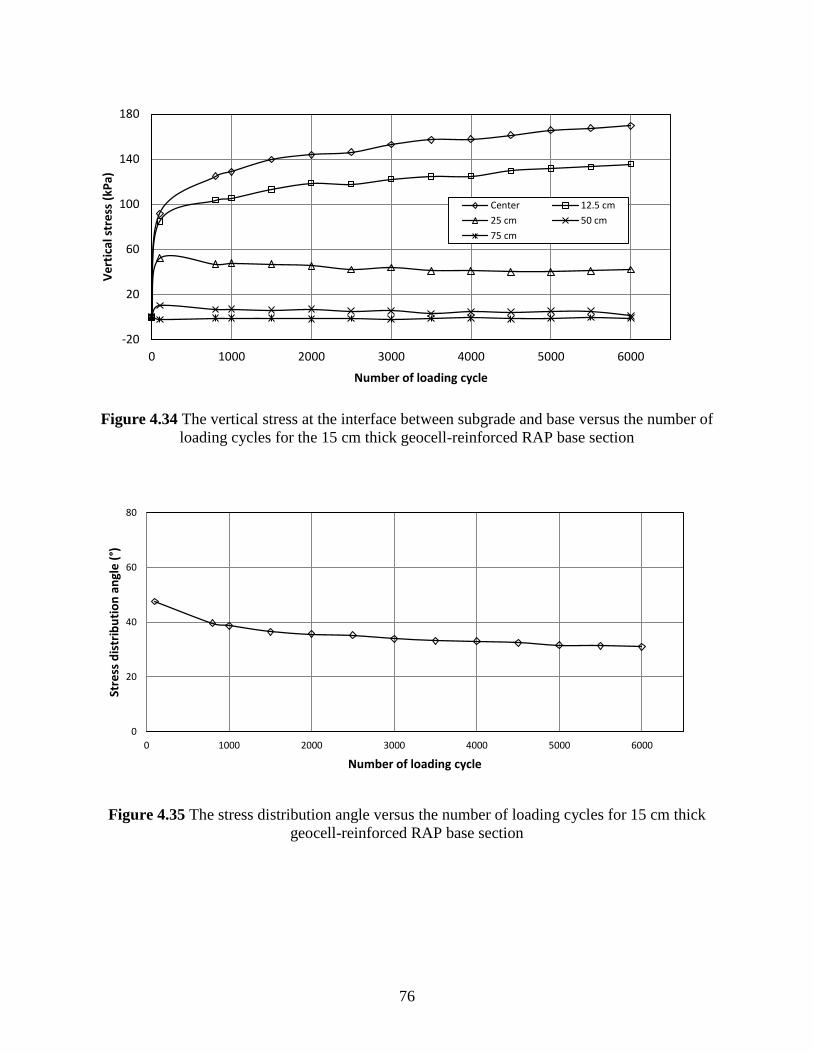
Figure 4.34 The vertical stress at the interface between subgrade and base versus the
number of loading cycles for the 15 cm thick geocell-reinforced RAP
base section 76
Figure 4.35 The stress distribution angle versus the number of loading cycle
for 15 cm thick geocell-reinforced RAP base section 76
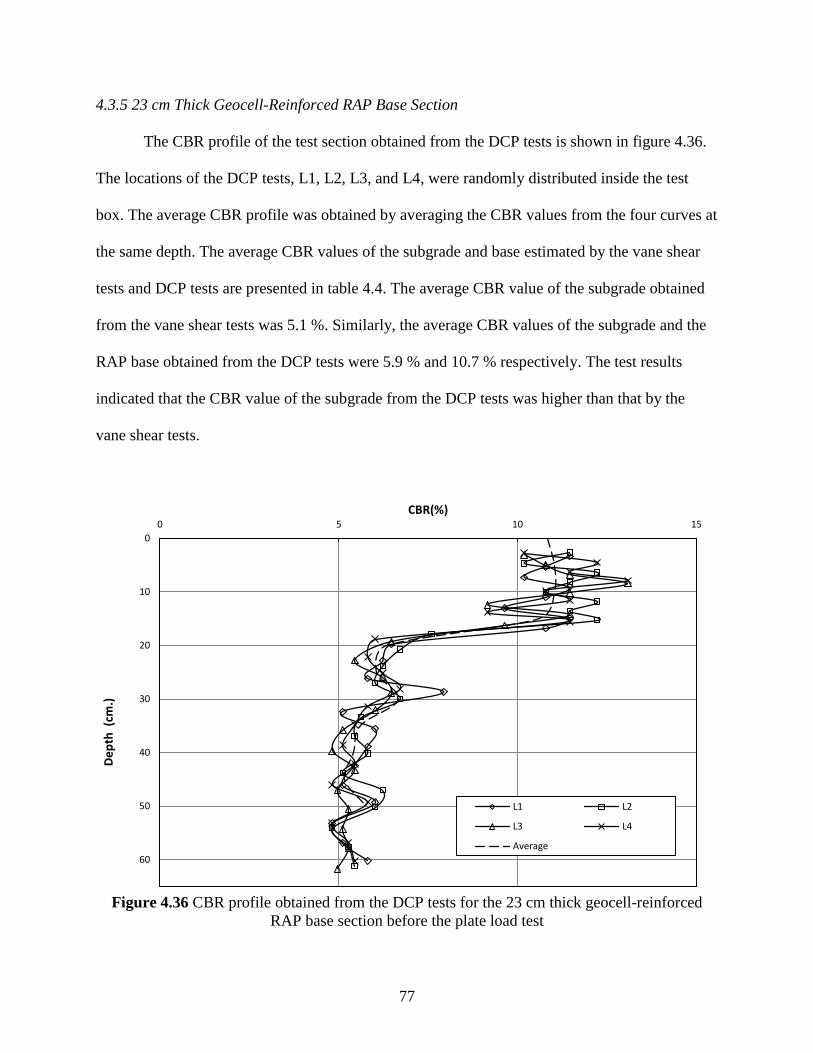
Figure 4.36 The CBR profile obtained from the DCP tests for the 23 cm thick
geocell-reinforced RAP base section before the plate load test 77
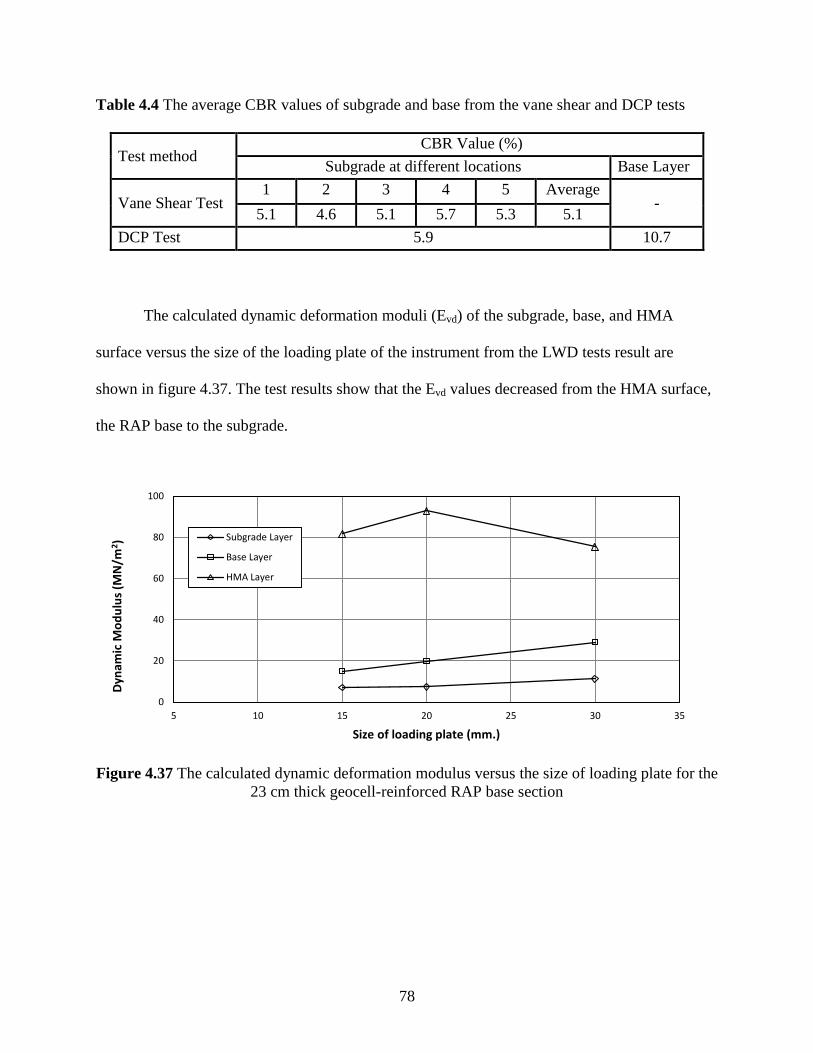
Figure 4.37 The calculated dynamic deformation modulus versus the size of loading
plate for the 23 cm thick geocell-reinforced RAP base section 78
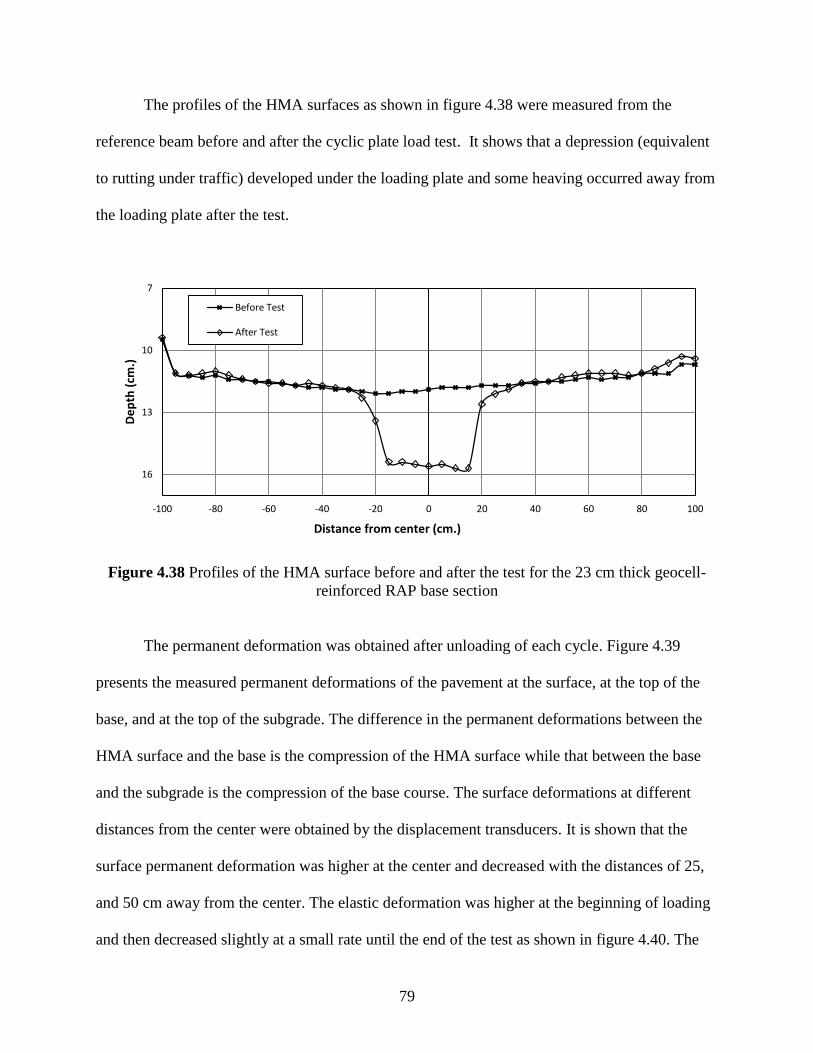
Figure 4.38 Profiles of the HMA surface before and after the test for the 23 cm thick
geocell-reinforced RAP base section 89
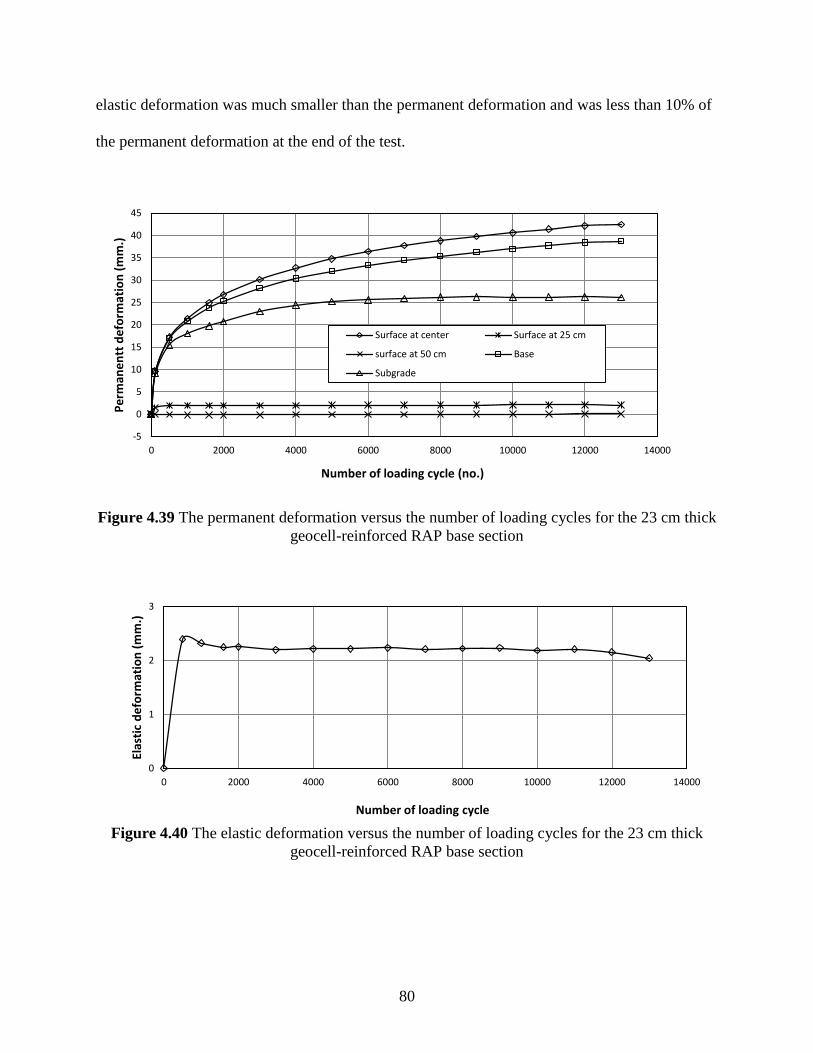
Figure 4.39 The permanent deformation versus the number of loading cycles
for the 23 cm thick geocell-reinforced RAP base section 80
Figure 4.40 The elastic deformation versus the number of loading cycle for the 23 cm
thick geocell-reinforced RAP base section 80
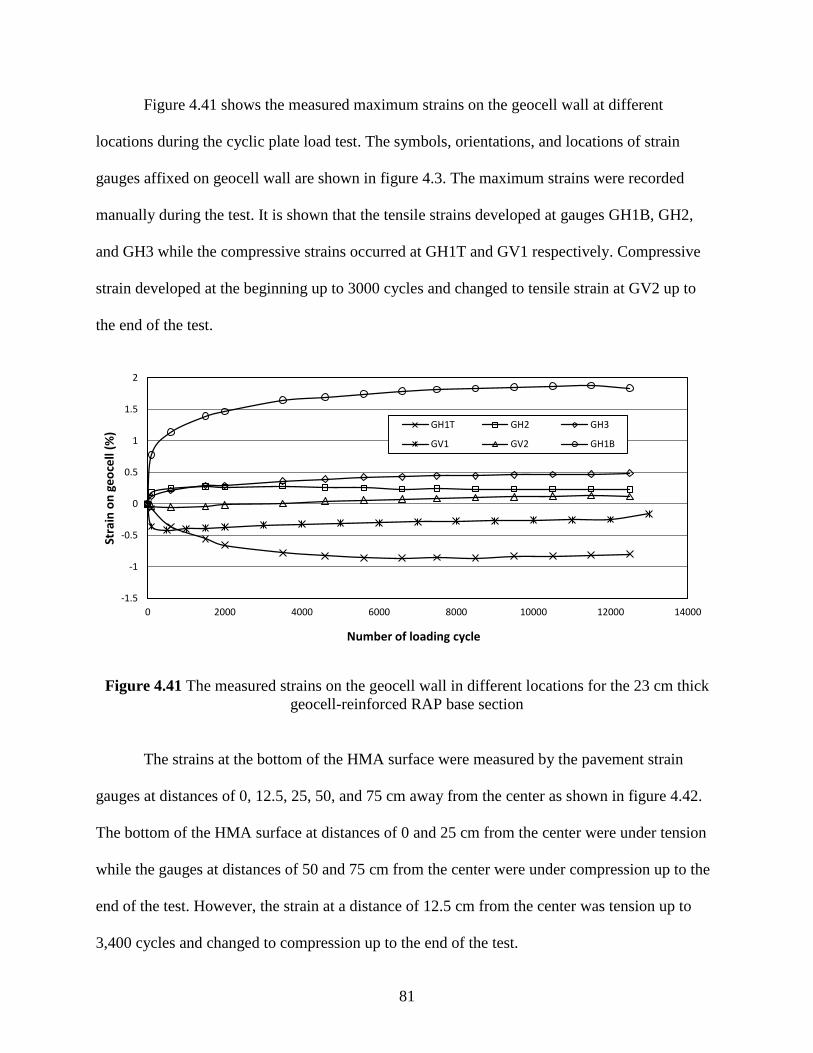
Figure 4.41 The measured strain on the geocell wall in different locations for the 23 cm
thick geocell-reinforced RAP base section 81
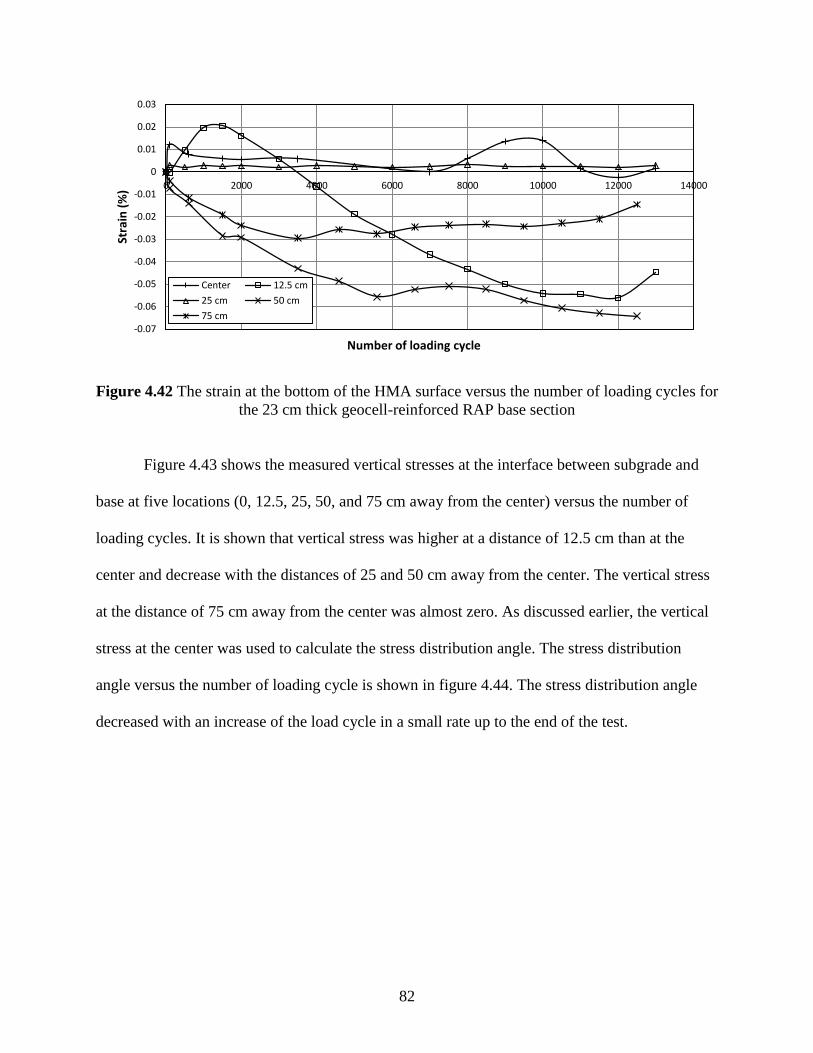
Figure 4.42 The strain at the bottom of the HMA surface versus number of loading
cycles for the 23 cm thick geocell-reinforced RAP base section 82
Figure 4.43 The vertical stress at the interface between subgrade and base versus the
number of loading cycles for the 23 cm thick geocell-reinforced RAP
base section 83
Figure 4.44 The stress distribution angle versus number of loading cycles for 23 cm thick
geocell-reinforced RAP base section 83
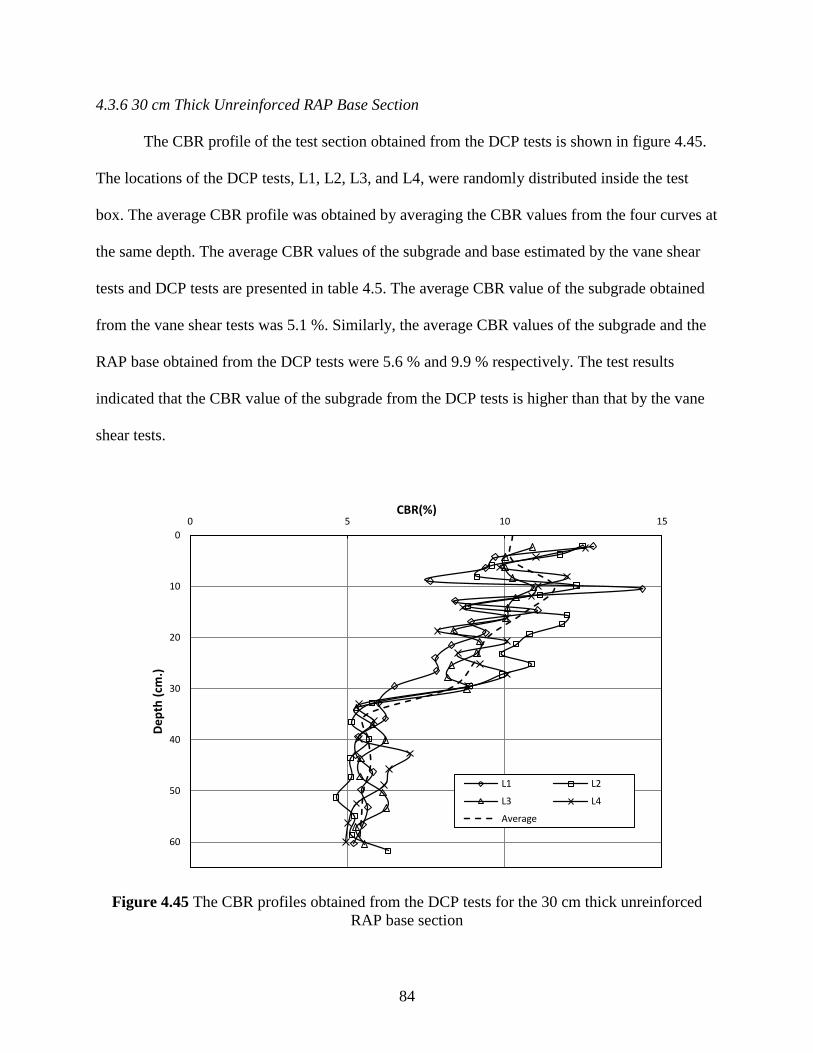
Figure 4.45 The CBR profiles obtained from the DCP tests for the 30 cm thick
unreinforced RAP base section 84
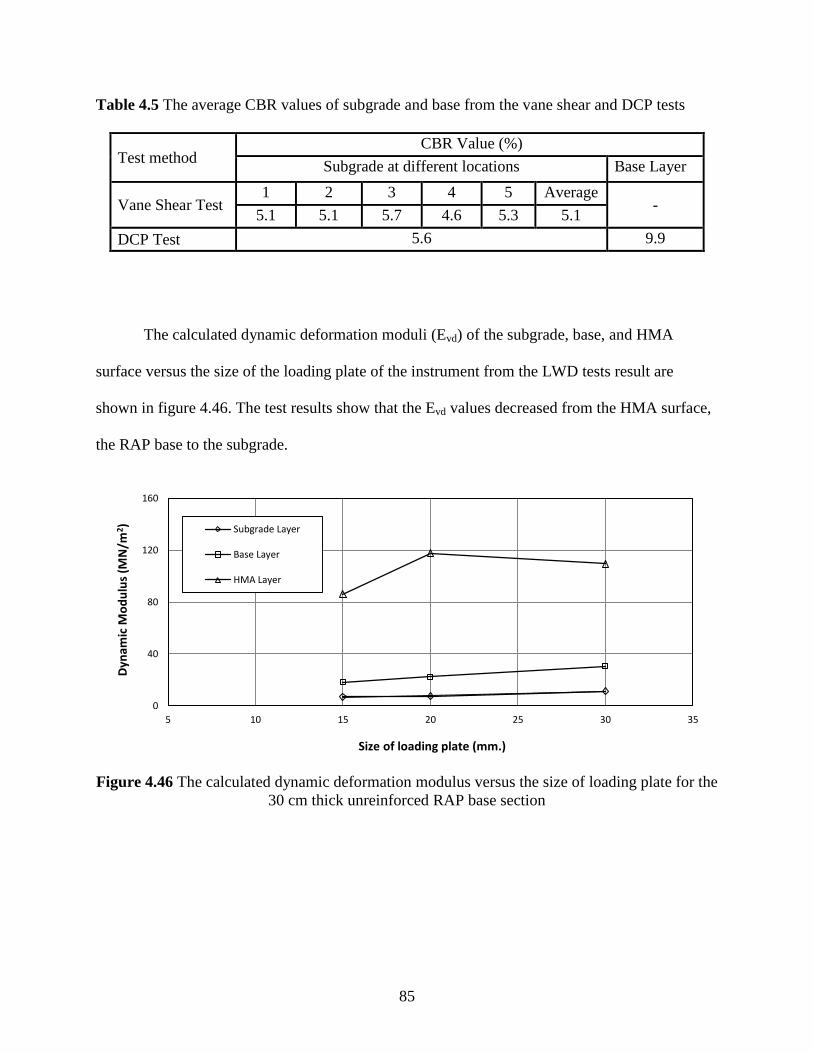
Figure 4.46 The calculated dynamic deformation modulus versus the size of loading
plate for the 30 cm thick unreinforced RAP base section 85
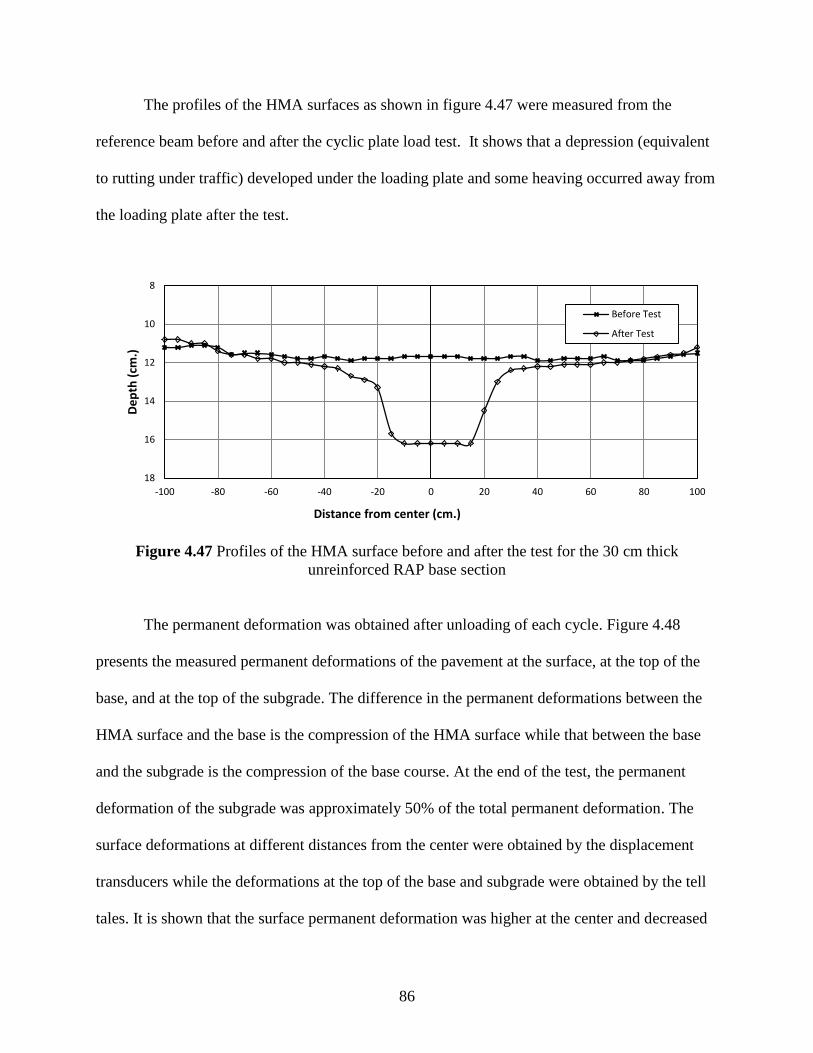
Figure 4.47 Profiles of the HMA surface before and after the test for the 30 cm thick
unreinforced RAP base section 86
Page 9
viii
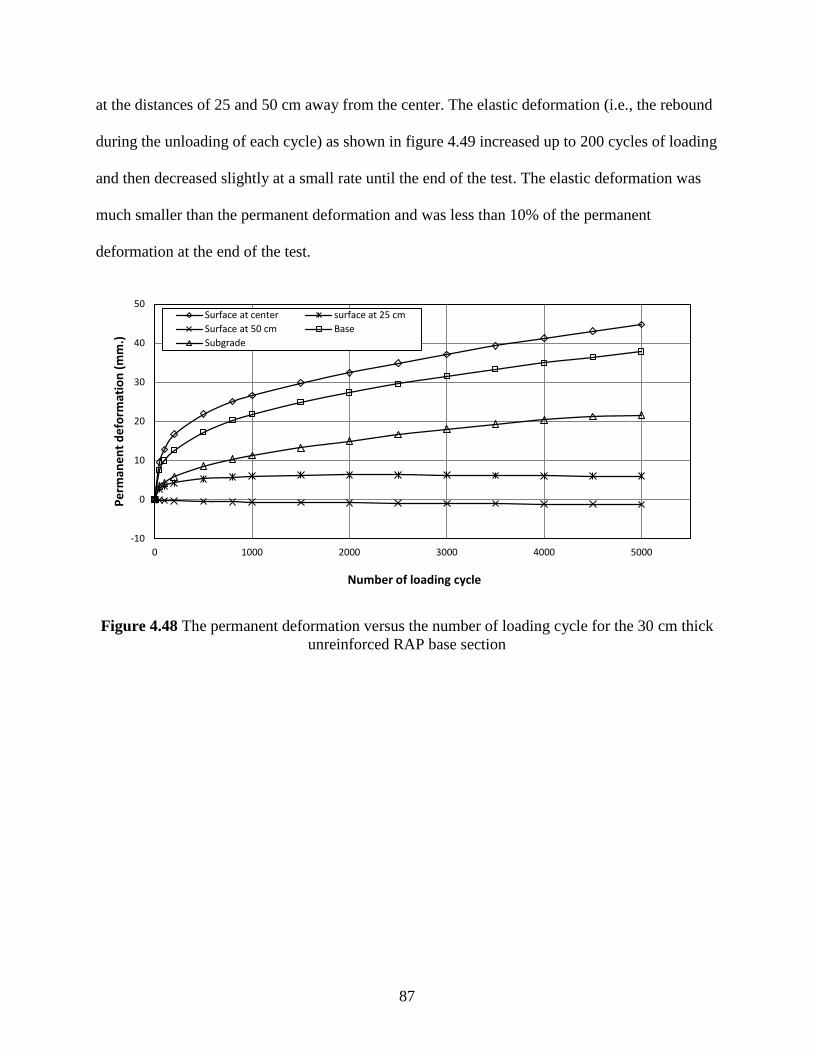
Figure 4.48 The permanent deformation versus the number of loading cycles
for the 30 cm thick unreinforced RAP base section 87
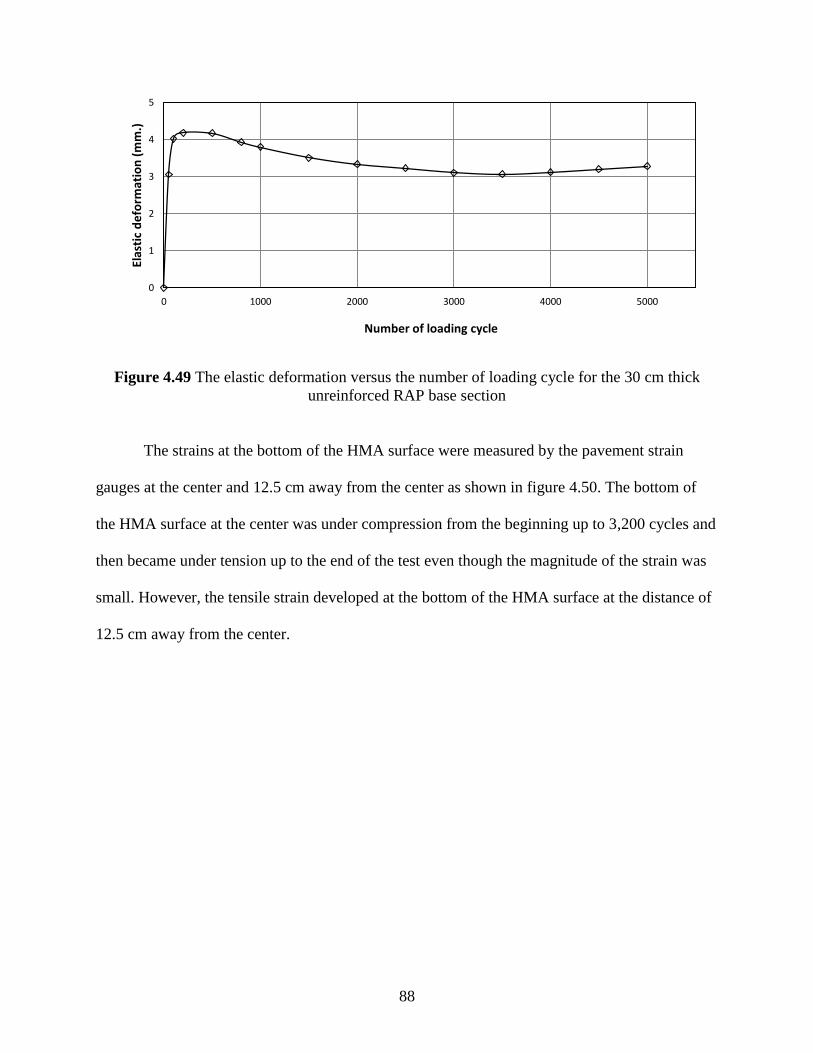
Figure 4.49 The elastic deformation versus the number of loading cycles for the 30 cm
thick unreinforced RAP base section 88
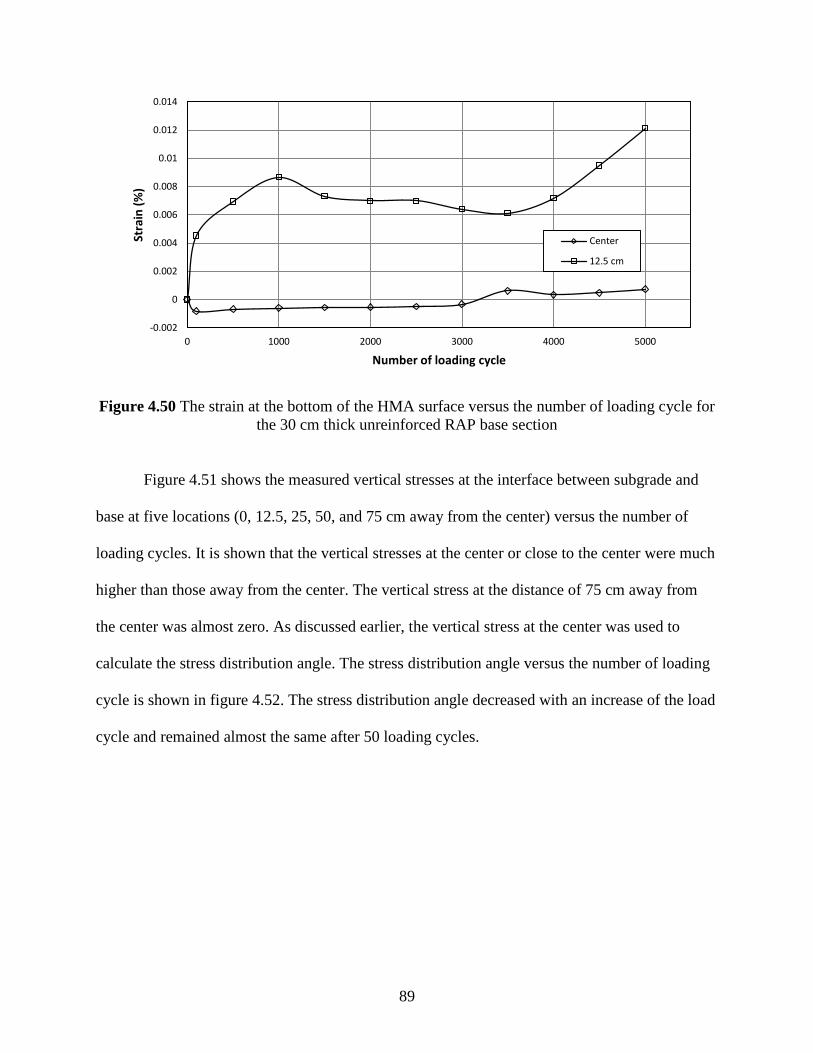
Figure 4.50 The strain at the bottom of the HMA surface versus number of
loading cycles for the 30 cm thick unreinforced RAP base section 89
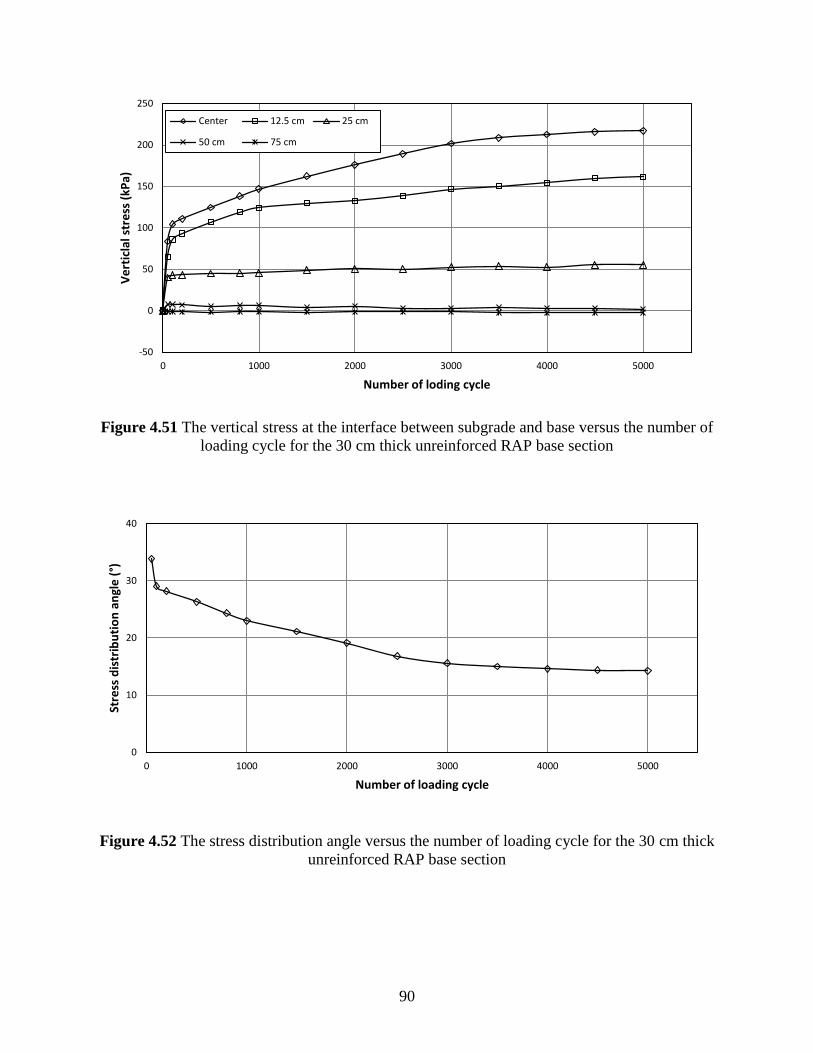
Figure 4.51 The vertical stress at the interface between subgrade and base versus the
number of loading cycles for the 30 cm thick unreinforced RAP
base section 90
Figure 4.52 The stress distribution angle versus the number of loading cycles
for 30 cm thick unreinforced RAP base section 90
Figure 4.53 The CBR profiles obtained from the DCP tests for the 30 cm thick
geocell-reinforced RAP base section before the plate load test 91
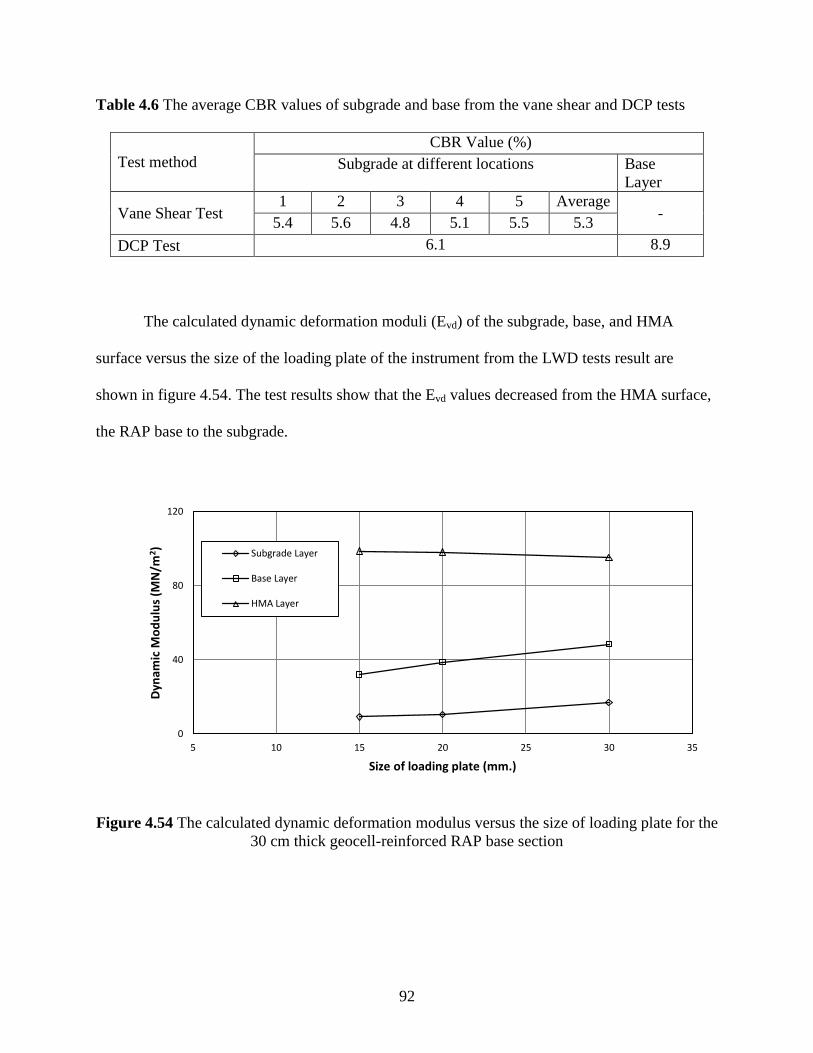
Figure 4.54 The calculated dynamic deformation modulus versus the size of loading
plate for the 30 cm thick geocell-reinforced RAP base section 92
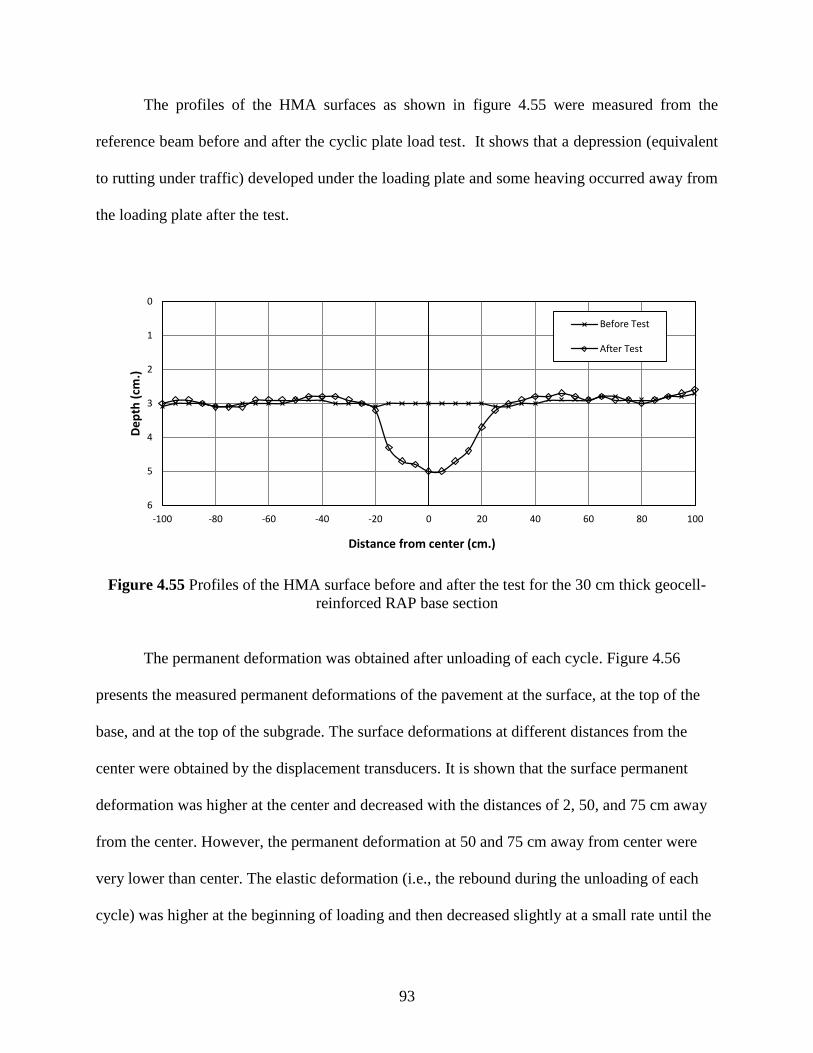
Figure 4.55 Profiles of the HMA surface before and after the test for the 30 cm thick
geocell-reinforced RAP base section 93
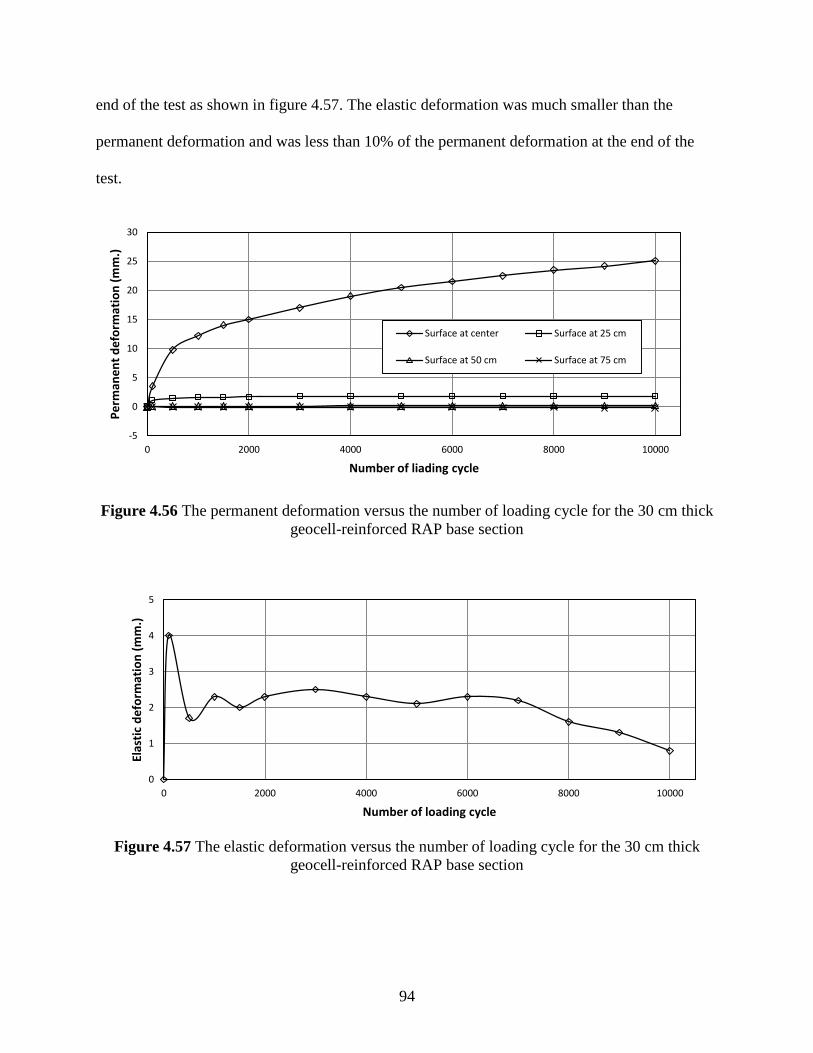
Figure 4.56 The permanent deformation versus the number of loading cycles
for the 30 cm thick geocell-reinforced RAP base section 94
Figure 4.57 The elastic deformation versus the number of loading cycles for the 30 cm
thick geocell-reinforced RAP base section 94
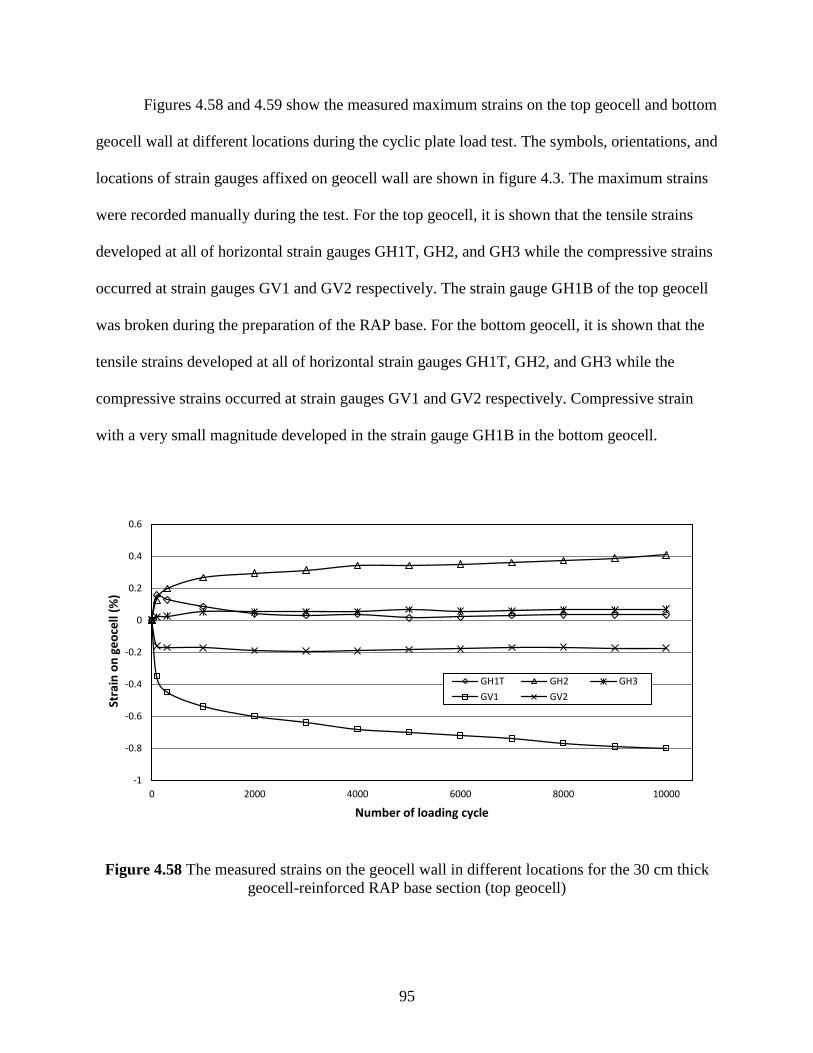
Figure 4.58 The measured strain on the geocell wall in different locations for the 30 cm
thick geocell-reinforced RAP base section (top geocell) 95
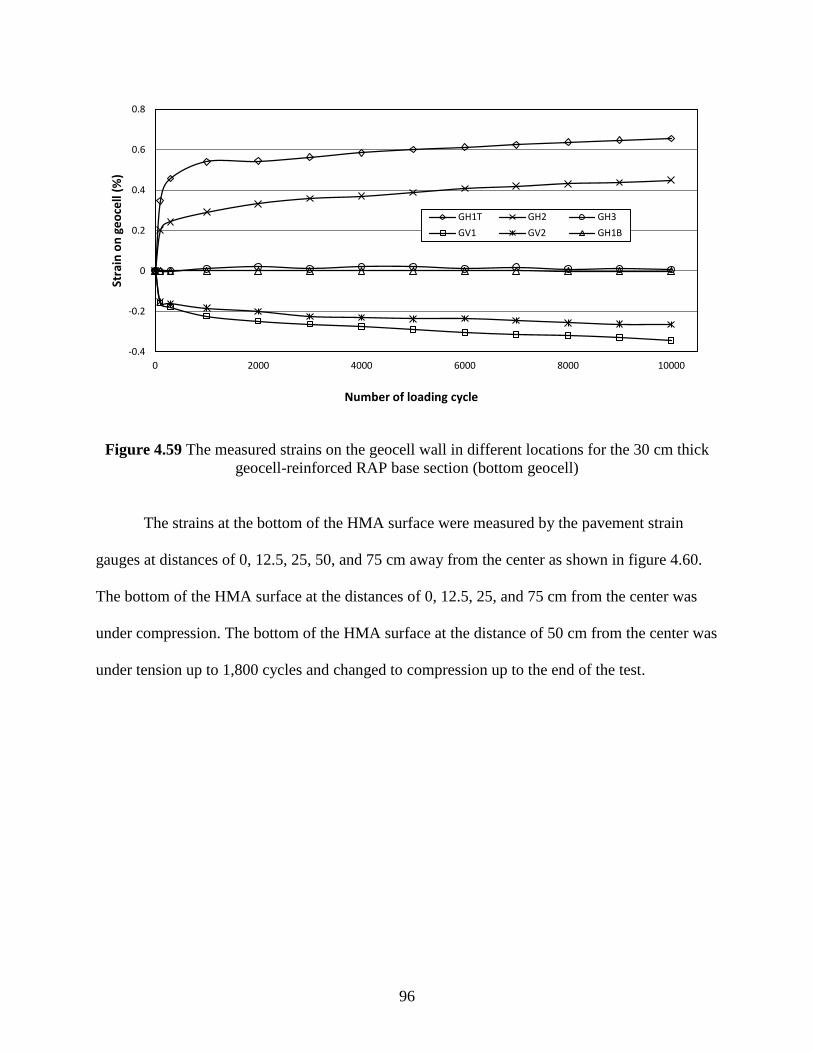
Figure 4.59 The measured strain on the geocell wall in different locations for the 30 cm
thick geocell-reinforced RAP base section (bottom geocell) 96
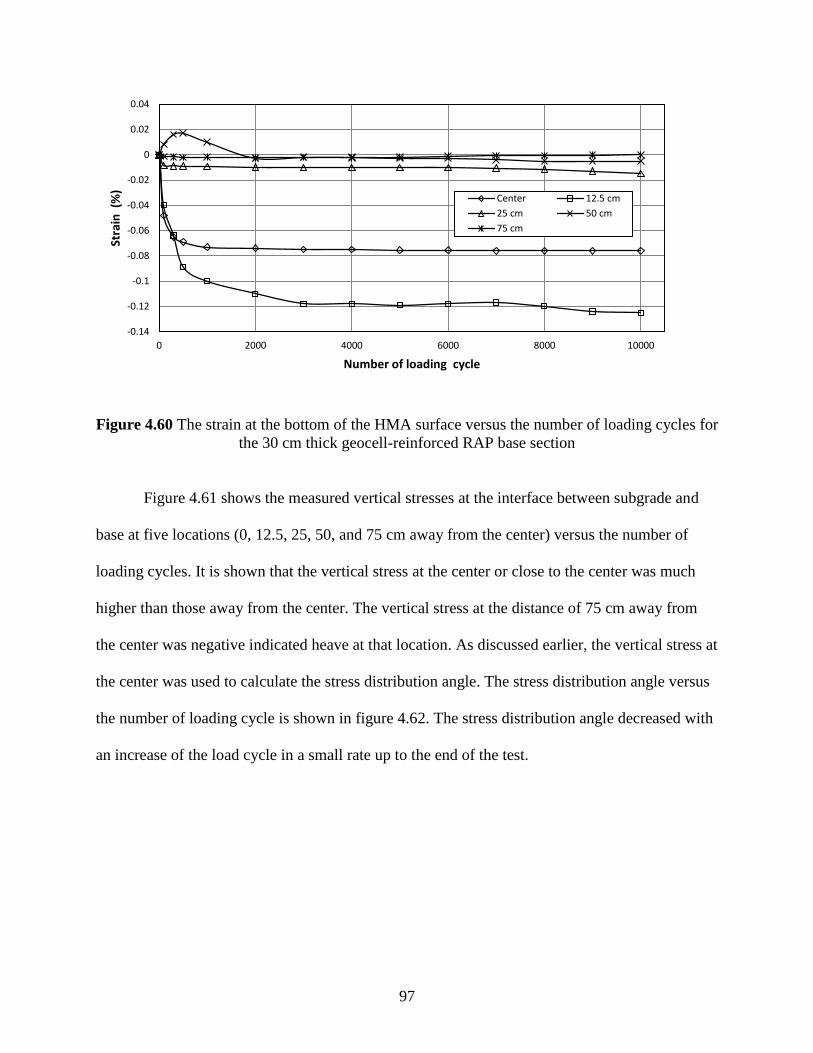
Figure 4.60 The strain at the bottom of the HMA surface versus number of loading
cycles for the 30 cm thick geocell-reinforced RAP base section 97
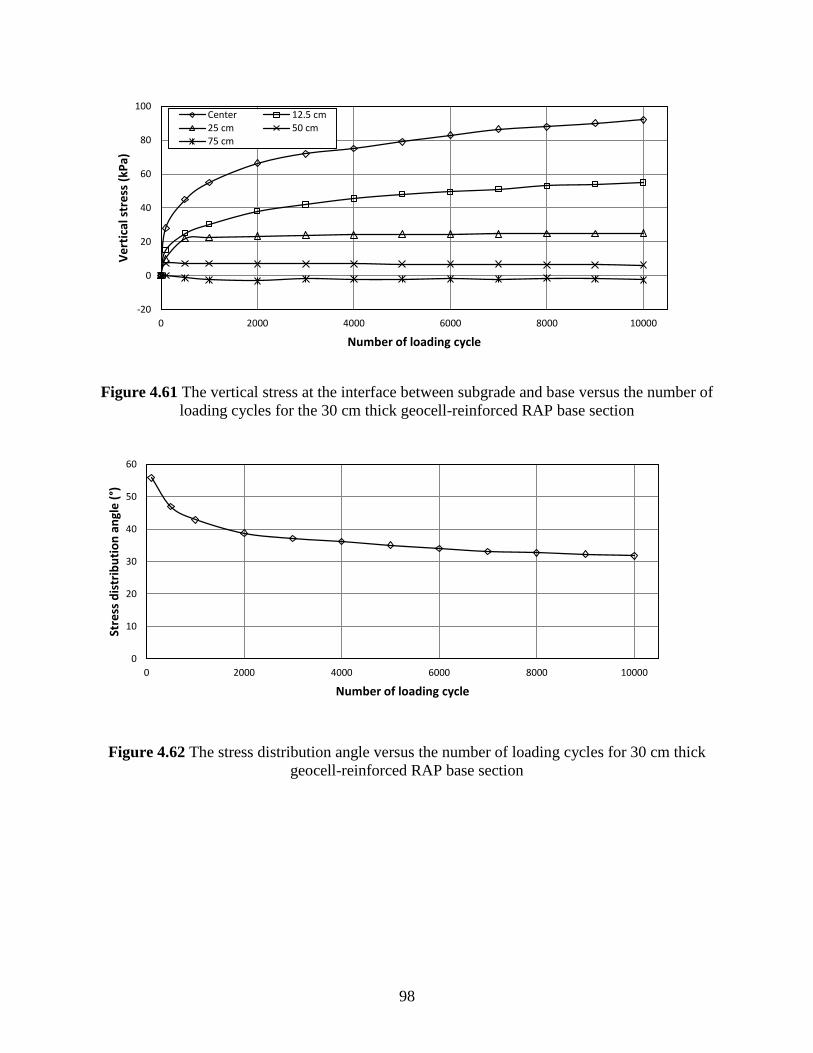
Figure 4.61 The vertical stress at the interface between subgrade and base versus the
number of loading cycles for the 30 cm thick geocell-reinforced RAP
base section 98
Figure 4.62 The stress distribution angle versus the number of loading cycles for
30 cm thick geocell-reinforced RAP base section 98
Figure 4.63 The average CBR profiles obtained from the DCP tests 100
Figure 4.64 The surface permanent deformation at the center versus the number
of loading cycles 104
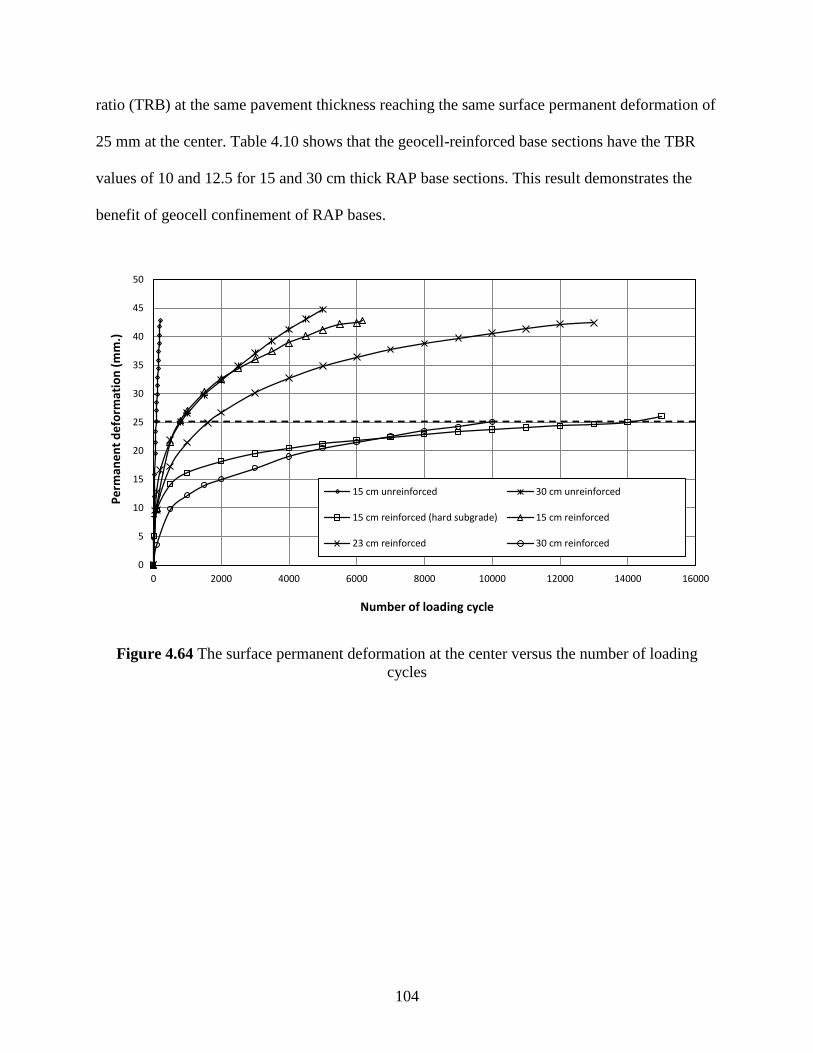
Figure 4.65 Distributions of surface permanent deformations at the 25 mm
deformation at the center 105
Figure 4.66 The percentage of elastic deformations versus the number
of loading cycles 106
Page 10
ix
Figure 4.67 Vertical compression of the HMA surface versus the number of
loading cycles 109
Figure 4.68 Vertical compression of the RAP base versus the number
of loading cycles 109
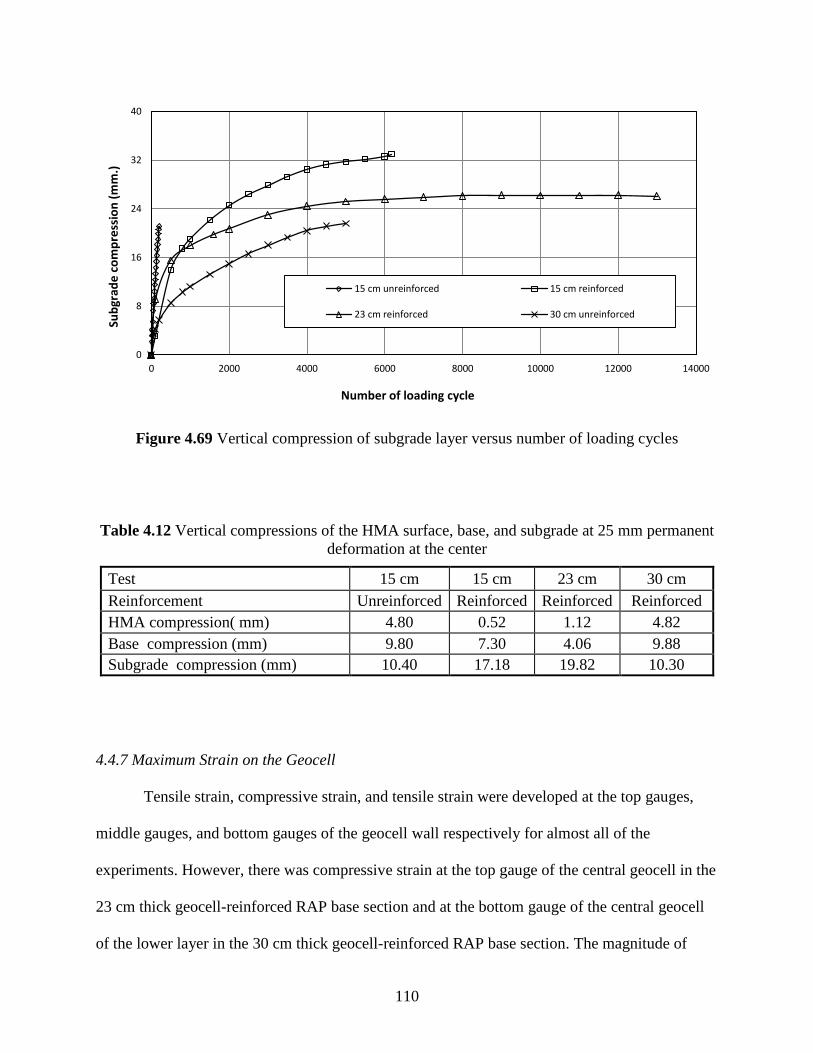
Figure 4.69 Vertical compression of subgrade layer versus the number
of loading cycles 110
Figure 4.70 Strain at the bottom of the HMA surface versus the number of
loading cycles 112
Figure 4.71 Vertical stress at the interface between subgrade and RAP base versus
the number of loading cycles at center 113
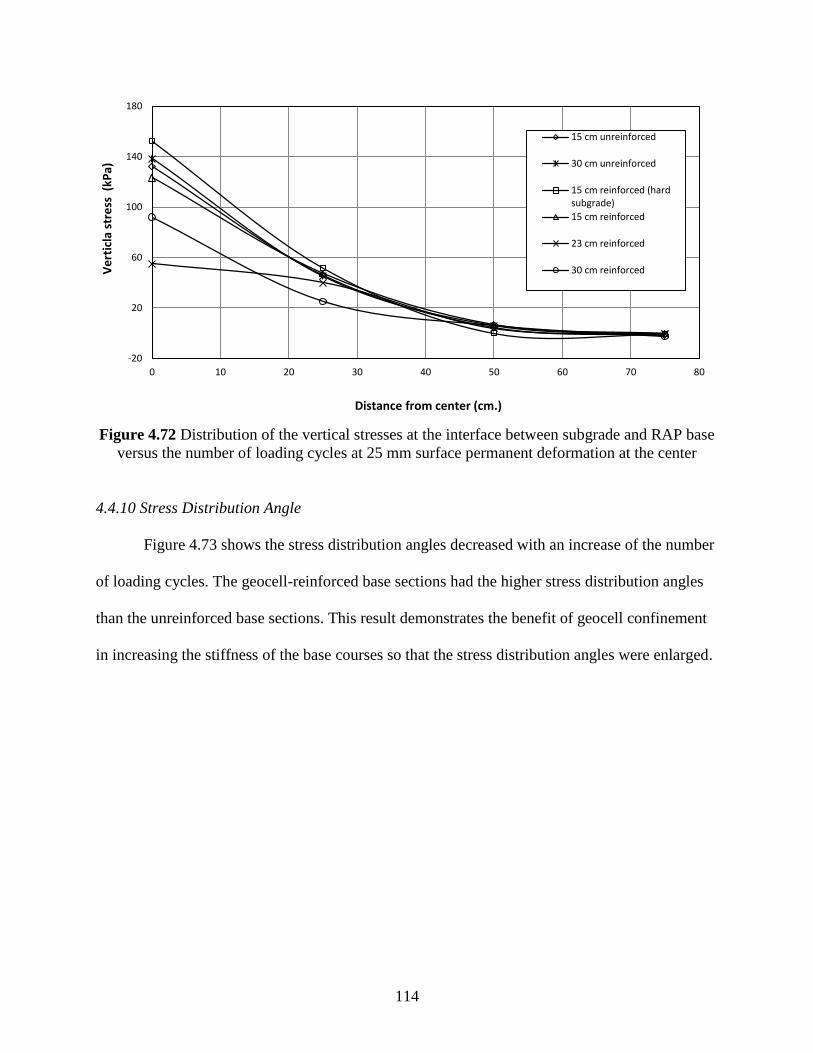
Figure 4.72 Distribution of the vertical stresses at the interface between subgrade
and RAP base versus the number of loading cycles at 25 mm
surface permanent deformation at the center 114
Figure 4.73 Stress distribution angle versus the number of loading cycles 115
Page 11
x
List of Tables
Table 2.1 Percentage use of RAP in pavement construction by the
U.S. DOTs 17
Table 2.2 Typical range of particle size distribution for RAP 18
Table 2.3 Typical physical and mechanical properties of RAP 19
Table 3.1 Properties of the RAP base material 25
Table 3.2 Basic properties of NPA geocell 29
Table 3.3 Creep resistance properties of NPA geocell 29
Table 4.1 The average CBR values of subgrade and base from
the vane shear and DCP tests (15 cm unreinforced RAP base) 55
Table 4.2 The average CBR values of subgrade and base from
the vane shear and DCP tests (15 cm reinforced RAP
base - hard subgrade) 62
Table 4.3 The average CBR values of subgrade and base from
the vane shear and DCP tests (15 cm reinforced RAP base) 70
Table 4.4 The average CBR values of subgrade and base from the vane
shear and DCP tests (23 cm reinforced RAP base) 78
Table 4.5 The average CBR values of subgrade and base from
the vane shear and DCP tests (30 cm unreinforced RAP base) 85
Table 4.6 The average CBR values of subgrade and base from the vane
shear and DCP tests (30 cm reinforced RAP base) 92
Table 4.7 Average CBR value of test sections from the vane shear and
DCP tests 101
Table 4.8 Dynamic deformation moduli of the test sections 101
Table 4.9 Percent of air void of the HMA samples 102
Table 4.10 Number of loading cycles at 25 mm surface permanent
deformation at center 105
Table 4.11 Elastic deformation and percentage of elastic deformation
at 25 mm permanent deformation at center 107
Table 4.11 Vertical compressions of the HMA surface, base and subgrade
at 25 mm permanent deformation at the center 110
Table 4.13 Maximum strain on geocell wall 111
Page 12
xi
List of Abbreviations
California Bearing Ratio (CBR)
Dynamic Cone Penetration (DCP)
Dynamic Cone Penetration Index (DPI)
High density polyethylene (HDPE)
Hot mix asphalt (HMA)
Kansas River (KR)
Light Weight Deflectometer (LWD)
Mechanistic-Empirical Pavement Design Guide (MEPDG)
Multi-Purpose Test Ware (MPT)
National Asphalt Pavement Association (NAPA)
Novel polymeric alloy (NPA Geocell)
North Carolina Department of Transportation (NCDOT)
Optimum Moisture Content (OMC)
Oxidation Induction Time (OTI)
Recycled Asphalt Pavement (RAP)
Recycled Concrete Aggregate (RCA)
Traffic Benefit Ratio (TBR)
Page 13
xii
Acknowledgements
This research was funded by the Mid-America Transportation Center. PRS
Mediterranean, Inc. in Israel provided the geocell material and R.D. Johnson Excavating, Co.,
Lawrence, Kansas provided the RAP material and hot mix asphalt concrete. Undergraduate
students, Byron Whitted, Brandon W. Basgall, and Guo Jun, provided great help in the
experimental work. Mr. Jim Weaver, Laboratory Manager and Mr. Matthew Maksimowicz,
Laboratory Technician provided their technical support throughout the experimental work. The
above-mentioned financial support, material supplies, and individuals’ help in this research are
greatly appreciated.
Page 14
xiii
Disclaimer
The contents of this report reflect the views of the authors, who are responsible for the
facts and the accuracy of the information presented herein. This document is disseminated under
the sponsorship of the Department of Transportation University Transportation Centers Program,
in the interest of information exchange. The U.S. Government assumes no liability for the
contents or use thereof.
Page 15
xiv
Abstract
Asphalt pavements deteriorate with traffic (especially heavy trucks) and time.
Maintenance and overlaying may solve minor to medium pavement distress problems. When the
condition of a pavement becomes badly deteriorated, reconstruction of the pavement may
become an economic and feasible solution. Reconstruction of a pavement requires removal of
pavement surfaces. On-site use of recycled asphalt pavement (RAP) materials has obvious
benefits from economic, environmental, and sustainability points of view. One attractive option
is to use recycled asphalt pavement (RAP) materials as base courses with a thin new overlay.
However, RAP has its limitations. For example, it creeps under a sustained load due to the
presence of asphalt binder. Our previous study showed that the use of geocell to confine RAP
minimized creep of RAP under a sustained load. However, the performance of geocell-reinforced
RAP as a base course overlaid with an asphalt surface is unknown.
In this research, the behavior of hot mix asphalt (HMA) pavements constructed over
unreinforced and geocell-reinforced RAP bases under cyclic loading was studied in the
geotechnical testing box at the University of Kansas, Lawrence. Pavement sections consisting of
subgrade, RAP base, and HMA surface were constructed in the geotechnical testing box and
tested under cyclic loading. The subgrade was composed of a mixture of 75% Kansas river sand
and 25% kaolin at 10.4% optimum moisture content, which corresponded to 5% CBR. The RAP
base was constructed without or with geocell at 6.6% optimum moisture content to achieve the
density requirement. The base thicknesses varied from 15 to 30 cm. The HMA surface above the
base was 5 cm thick. Extensive QC/QA tests and instrumentation were included. The test
sections were evaluated by vane shear test, light weight deflectometer test, and dynamic cone
penetration test for consistency. Earth pressure cells were placed at the interface between the
Page 16
xv
subgrade and base to measure the vertical stresses applied on the subgrade. Tell tales were placed
at the interface of subgrade and base and the interface of base and HMA surface to measure their
corresponding compression. Strain gauges were placed on geocells and at the bottom of the
HMA layer to measure the strains. Large-scale plate load tests with a cyclic load up to 40 kN
was applied to simulate heavy truck wheel loading until permanent deformation exceeding the
failure criterion of 25 mm.
Six cyclic plate load tests were conducted on unreinforced and geocell-reinforced test
sections by varying the thickness of the RAP base. The performance of each test section under
cyclic loading was evaluated for a number of loading cycles up to the failure of the test section.
The test results show better performance of the geocell-reinforced section than the unreinforced
section at the same base thickness. The higher stress distribution angle, higher percentage of
elastic deformation, lower compression of HMA surface, and lower compression of RAP base
were observed in the geocell-reinforced test section as compared with those in the unreinforced
test section. The compression of subgrade was high compared to that of RAP base and HMA
layers. The geocell-reinforced section with higher stiffness resulted in better compaction of the
HMA layer as evidenced with lower air voids as well. The subgrade and/or RAP base layer with
a higher CBR value improved the performance of the pavement section. To obtain consistent test
results, it is important to follow the same procedure to prepare and test the pavement section.
Page 17
1
Chapter 1 Introduction
1.1 Background
The United States has one of the largest road systems in the world. According to the
National Asphalt Pavement Association (NAPA), more than 90% of U.S. roads are paved with
hot mix asphalt (HMA) on the surface layer (FHWA-HRT-10-001, 2010). Factors such as aged
roads, rapid growth in traffic volume, and high axle loads necessitate the maintenance and
rehabilitation of existing roads, as well as the construction of new roads. In turn, demand for a
large quantity of construction materials derived from natural resources, such as aggregate and
asphalt binder, is high. The escalating cost and scarcity of these materials, and their
transportation to a desired construction site, require transportation agencies to explore new and
sustainable alternatives of constructing and maintaining roads. Recycling of waste materials can
be one such alternative. Old-aged HMA pavement material is the most recyclable material
obtained from roads near or past their design life. Reprocessed HMA waste is also called
“Recycled Asphalt Pavement” (RAP). The use of RAP has several benefits, such as the
preservation of natural resources for future generations, protection of the environment, and the
conservation of energy. Therefore, the use of RAP is a sustainable approach. RAP has been used
mostly in new HMA mix for pavement surfaces; however, it has been increasingly used as a base
course material for construction of new roads or rehabilitation of existing roads.
Geosynthetic materials have been used in road construction to stabilize soft soil all over
the world. The concept of stabilizing a road using natural materials as reinforcement dates back
to 3000 BC (Kerisel 1985). One of the earliest uses of geosynthetics for roadway construction
occurred in 1920s (Becham et al. 1935). A review of the literature shows that the inclusion of
geosynthetics at the subgrade-base interface, or even within the base course, can improve the
Page 18
2
service life and performance of paved as well as unpaved roads and reduce the required thickness
of the base course (Giroud and Han 2004). Common geosynthetics used in roadway construction
are geotextile, geomembrane, geogrid, geocell, geonet, geofoam, geocomposite, etc. The major
functions of geosynthetics include separation, filtration, drainage, reinforcement, protection,
and/or barrier, etc.
The use of 100% RAP as a base material reinforced by geocell is a new concept
developed by Han et al. (2011) and Thakur (2011). The use of RAP is a sustainable approach for
constructing new roads and rehabilitating existing roads. The use of geocell improves the
mechanical properties of RAP, thereby improving the performance of RAP bases and pavements.
Due to the three-dimensional configuration of geocell, it can provide better lateral and vertical
confinement, distribute the load over a wider area, increase the bearing capacity, and reduce
settlement or rutting. Moreover, a geocell-reinforced pavement system is a composite structure
and it has benefits from combined advantages.
1.2 Problem Statement
Asphalt pavements deteriorate with traffic (especially heavy trucks) and time.
Maintenance and overlaying may solve minor to medium pavement distress problems. When the
condition of a pavement becomes badly deteriorated, reconstruction of the pavement may
become an economic and feasible solution. Reconstruction of a pavement requires removal of
pavement surfaces. For the most part, the removed pavement surfaces are transported to a plant
for processing into recycled asphalt pavement (RAP) materials. The RAP materials are then re-
mixed with virgin binder and aggregate to produce hot mix asphalt (HMA) or they are used as
base courses. Obviously, the transportation and processes of RAP consume energy and increase
cost.
Page 19
3
On-site use of RAP materials has recognizable economic, environmental, and
sustainability benefits. One attractive option is to use RAP materials as base courses onsite with
a thin new overlay. However, RAP is characterized as a time, temperature, and stress-dependent
material, which means it creeps under a sustained load due to the presence of asphalt binder.
According to Bartenov and Zuyev (1999), static fatigue and dynamic fatigue are two interrelated
thermally activated processes pertaining to a viscoelastic material like RAP. The material,
subjected to static fatigue, is regarded as one subjected to creep. Cosentino et al. (2003) and
Viyanant et al. (2007) both confirmed that fully confined and triaxially confined RAP samples
creep under static loading. The creep test is shown to be sensitive to mixture variables including
asphalt grade, binder content, aggregate type, air void content, testing temperature, and testing
stress. The previous study by Thakur et al. (2011) showed that the use of geocell to confine RAP
could minimize creep of RAP under a sustained load. However, the performance of geocell-
reinforced RAP as a base course overlaid by an asphalt surface is unknown.
1.3 Research Objective
The objective of the current research is to evaluate the behavior and performance of the
geocell-reinforced RAP bases in a flexible pavement under cyclic loading. This study simulated
onsite use of RAP with geocells to reconstruct damaged pavements under heavy trucks. The test
data obtained from this research would provide the basis for the development of a new design
procedure for geocell-reinforced flexible pavements with RAP base courses.
1.4 Research Methodology
The research methodology adopted for this research work includes an extensive literature
review on geosynthetics (especially geocells), RAP, and geocell-reinforced granular bases,
experimental tests on unreinforced and geocell-reinforced flexible pavements with RAP bases,
Page 20
4
and data analysis of test results. The large-scale cyclic plate load tests were conducted in the
large geotechnical testing box in the Department of Civil, Environment, and Architecture
Engineering at the University of Kansas.
1.5 Organization of Report
This report is divided into five chapters. Chapter 1 presents the background, problem
statement, research objective, and research methodology. Chapter 2 describes the present state of
knowledge of geocell and RAP and a review of laboratory and field studies of geosynthetic-
reinforced unpaved roads. The properties of the materials, equipment, and test procedures used in
the large-scale cyclic plate load tests are presented in Chapter 3. Chapter 4 presents test results
and data analysis. Conclusions and recommendations for future work are provided in Chapter 5.
Page 21
5
Chapter 2 Literature Review
Recycled Asphalt Pavement (RAP) and geocell have been increasingly used for unpaved
and paved road construction in recent years. This chapter presents a literature review of RAP and
geocell materials and their related behavior and applications. This literature review includes the
following two components: (1) geosynthetics (especially “geocell”) and their applications in
roadway construction, (2) RAP materials and their applications in roadway construction.
2.1 Geosynthetics
A geosynthetic can be defined as “a planar product manufactured from polymeric
material used with soil, rock, earth, or other geotechnical engineering related material as an
integral part of a man-made project, structure or system” (ASTM D 4439-11, 2011). The main
objective of using a geosynthetic is to improve physical, mechanical, and hydraulic properties of
soils. The geosynthetics that are frequently used in construction are geotextile, geogrid,
geomembrane, geonet, geocell, geosynthetic clay liner, geofoam, and geocomposites.
Geosynthetics have been successfully used in several areas of civil engineering including
roadways, airports, railroads, embankments, retaining structures, reservoirs, dams, landfills, etc.
Literature shows that the state of South Carolina used a cotton textile to stabilize the underlying
soft soil in a road in the 1920s (Becham and Mills 1935). The evaluation of the road after several
years found the textile in a good workable condition.
2.1.1 Basic Functions
The basic functions of geosynthetics in civil engineering projects include separation,
filtration, drainage, reinforcement, protection, barrier, etc.
Page 22
6
Separation. Separation is the introduction of a flexible geosynthetic sheet between two
dissimilar materials so that the functions of both materials are maintained. The geosynthetic
works as a separator which prevents the intermixing of dissimilar materials, thus maintaining the
design thickness and roadway integrity of two different layers such as sub-base and subgrade in
roadways. The separator prevents granular particles in bases from penetrating into subgrade, and
fines in subgrade from migrating into permeable granular bases. Geotextile and geomembrane
are commonly used as a function of separation in roadways.
Filtration. Filtration via a geosynthetic consists of movement of liquid through the
geosynthetic and a resulting retention of fine particles of soil. Geotextiles are the geosynthetic
products commonly used for filtration purposes. Geotextiles are used to prevent the movement of
fine particles from soft subgrade to granular bases, thus maintaining the design thickness and
roadway integrity. Geosynthetics have been used for their filtration function in roadways,
landfills, retaining walls, and slopes, etc.
Drainage. Geosynthetics perform a drainage function by transmitting the liquid within
the plane of the structure. The geosynthetics generally used for drainage purposes are
geocomposites and geotextiles. The geosynthetics have been used to dissipate pore water
pressures at the base of road embankments, exposed soil or rock surfaces, retaining walls, dams,
and reservoirs, etc.
Reinforcement. Geosynthetics can be used as a reinforcing element within a soil mass to
produce a composite that has improved strength and deformation properties over the
unreinforced soil. Geogrid, woven geotextile, and geocell are the geosynthetic products
commonly used for reinforcement of soil to provide tensile strength and stiffness and lateral
confinement.
Page 23
7
Protection. Geosynthetics are sometimes used to protect other geosynthetics against
damage during placement and construction, such as tearing by sharp edged rock, penetration of
roots of trees, sun degradation, and other localized damage. For example, a geotextile is
sometimes used with geomembrane as protection in roadway and embankment construction in
expansive soils.
Barrier. The function of geosynthetic as a barrier is the isolation of two different layers.
Geomembrane is often used as an impermeable barrier to moisture movement from subgrade and
surrounding soil to a granular base layer. This barrier prevents change in moisture content of
subgrade and maintains a constant strength throughout the life of the pavement, thus increasing
pavement life.
2.1.2 Geosynthetics in Roadways
The use of geosynthetics to improve the performance of unpaved and paved roads has
been significantly increasing in the past three decades. Among various geosynthetics available in
the market, nonwoven geotextile is commonly used as a separator between subgrade and
aggregate base. Geogrid has been commonly used for subgrade improvement and base
reinforcement by interlocking with granular bases.
Previous research on geogrid-reinforced granular base courses under flexible pavements
was carried out at the University of Waterloo, Ontario in 1984 (Haas et al. 1988). The variables
investigated in this research included subgrade strength (CBR values of 1, 3.5, and 8%),
aggregate base thickness (150, 200, and 300 mm), asphalt concrete thickness (75 and 100 mm),
and reinforcement location (bottom, middle, and top of the aggregate base course). One of the
purposes of this study was to determine the Traffic Benefit Ratio (TBR, i.e., the ratio of the
number of load cycles of a stiff geogrid-reinforced section to that of the unreinforced section),
Page 24
8
after incorporating a stiff biaxial geogrid in the granular base. The result of this experiment was a
TBR value of approximately 3 when the stiff biaxial geogrid was placed at the bottom of the
base course. For thick aggregate base courses, geogrid provided better performance when it was
located at the mid-height of the base course rather than at the bottom of the base course. The
geogrid placed at the top of the aggregate base course provided no improvement.
A full-scale field study conducted at the US Army Corps of Engineers demonstrated that
under a large moving wheel load (130 kN), a remarkable improvement in pavement performance
was observed when the pavement was reinforced with the stiff biaxial geogrid (Webster 1992).
The test results showed that flexible pavements with geogrid-reinforced base courses on
subgrade at CBR of 1.5 to 5.0% carried approximately 3.5 times more traffic repetitions than
equivalent unreinforced sections based on a rut depth criterion of 38 mm.
An experimental study conducted at the University of Alaska (Collin et al. 1988) with
flexible pavements constructed on subgrade with a CBR of 3% and base course thickness
between 175 and 300 mm resulted in similar findings as those of Haas et al. (1998) and Webster
(1992). It was concluded that the geogrid-reinforced flexible pavements increased the pavement
life by approximately 2 to 4 times with respect to that of the unreinforced pavements.
2.1.3 Geocell and its Application in Road Construction
Geocells are three-dimensional honeycombed cellular structures that provide confinement
to compacted infill soil. Their confinement reduces the lateral movement of soil particles and
forms a stiffened mattress or slab to distribute applied loads over a wider area. Geocells have
been used in construction of slopes, retaining walls, channels, roads, and railways.
In the late 1970s, the U.S. Army Corps of Engineers first developed the concept of a
cellular confinement system over a grid confinement system to construct roads in soft terrain and
Page 25
9
wet weather conditions. Webster and Bach developed a method to weld polyethylene strips to
form a cellular structure co-called "Sandgrid" (Presto Products Co. 2009). This cellular
confinement system with high density polyethylene (HDPE) strips was used first for load support
applications such as road constructions in the United States in the early 1980s. It was then used
for slope erosion control and channel lining in the United States in 1984, and for earth retention
in Canada in 1986. The new type of geocell is made of novel polymeric alloy that is
characterized by flexibility at low temperatures similar to HDPE and an elastic behavior similar
to engineering thermoplastic (Pokharel 2010; Yang 2010).
Geocell has been increasingly used to confine base course materials in roadway
construction. The main mechanisms of confinement include active earth pressure within loaded
cells, soil resistance in the adjacent cells, and hoop stresses in the cell walls. Under vertical
loading, hoop stresses in the cell walls and soil resistance in the adjacent cells are mobilized so
that the soil inside the cells is confined and the strength and stiffness of the soil is increased. The
geocell-reinforced base layer acts as a stiff mattress or slab to distribute the vertical traffic load
over a wider area of the subgrade. As a result, the vertical stresses applied on the subgrade are
reduced and the bearing capacity is increased.
Field trafficking tests and falling weight deflectometer measurements found that geocell
reduced vertical stresses beneath the geocell layer by approximately 30%, reduced the
deflections on the flexible pavement surface by approximately 15%, and increased the back-
calculated layer modulus by approximately 10% in comparison to an unreinforced section
(Emersleben and Meyer 2008 2010). Al Qadi and Hughes (2000) reported that geocell
confinement increased the resilient modulus of the aggregate layer in a flexible pavement by
approximately two times.
Page 26
10
Pokharel et al. (2009a) conducted an experimental study to evaluate the behavior of
geocell-reinforced bases under static and repeated loading. Two base course materials, Kansas
River sand and quarry waste, were used as the infill materials. The test results showed that
geocell confinement increased the bearing capacity and stiffness of the Kansas River sand by
improvement factors of 1.75 and 1.5 respectively, under static loading. However, geocell
confinement had a minor effect on the stiffness of the quarry waste under static loading due to
the existence of apparent cohesion. The single geocell reduced the permanent deformation of the
quarry waste base by a factor of approximately 1.5 in comparison to the unreinforced base under
dynamic loading. The Kansas River sand had a lower percentage of elastic deformation
compared to the unreinforced and reinforced quarry waste due to poor gradation, sub-rounded
particles, and no apparent cohesion of the sand. The reinforced quarry waste had a higher
percentage of elastic deformation than the unreinforced quarry waste due to the contribution of
the geocell. Pokharel et al. (2009b) conducted another experimental study to evaluate the
influence factors for single geocell-reinforced sand. This study found that the geocell placed in a
circular shape had a higher bearing capacity and stiffness of the reinforced base than geocell
placed in an elliptical shape. The performance of the geocell with a higher elastic modulus had a
higher bearing capacity and stiffness of the reinforced section. The improvement factor for a
geocell-reinforced base over its corresponding unreinforced base ranged from 1.5 to 2.5 in terms
of bearing capacity and 1.3 to 2.0 in terms of stiffness. The geocell with a higher elastic modulus
had a higher improvement factor.
Due to poor subgrade conditions in a desert area, it is difficult to construct roads of good
quality. Ta-teh et al. (2009) conducted static and dynamic loading tests to determine the bearing
capacity and dynamic properties of sandy soil confined with geocells. They concluded that desert
Page 27
11
subgrade can be improved in terms of bearing capacity and settlement compared to unreinforced
sandy subgrade.
Keif and Rajagopal (2008) conducted a field study to examine the benefit of geocell
reinforcement of the base layer in a flexible pavement. The field test demonstrated that the
vertical stress underneath the geocell-reinforced granular layer due to traffic loading was reduced
by more than 50% in comparison to the unreinforced case. Finite element analysis of the test
sections revealed that the bearing capacity of the subgrade layer was increased by approximately
2.5 times.
Dash et al. (2003) conducted model studies on a circular footing supported on geocell-
reinforced sand underlain by a soft clay bed. The test section was subjected to monotonic loading
by a rigid circular footing. Footing load, footing settlement, and surface deformation on the fill
were measured during the test. The test results showed that geocell confinement of the sand layer
substantially increased the bearing capacity and reduced surface heaving of the foundation bed.
An additional layer of geogrid placed at the base of the geocell mattress further enhanced the
bearing capacity and stiffness of the foundation bed.
Singh et al. (2007) found that the ultimate bearing capacity of a square footing was
appreciably increased by geocell confinement under the axial load as well as under the eccentric-
inclined load. It was observed that the confinement of soil under the footing resisted the lateral
displacement of the infilled material, leading to a significant decrease in the settlement and an
increase of the ultimate bearing capacity.
Sitharam et al. (2006) conducted a numerical study using FLAC3D to evaluate the
influence of geocell confinement on the bearing capacity of a circular footing supported on a
sand bed subjected to vertical loading. The numerical analysis demonstrated that the footing
Page 28
12
pressure was well distributed within the geocell mattress and was transferred to a wider area of
the subsoil compared to the unreinforced sand bed.
Latha et al. (2006) conducted laboratory model tests to investigate the benefit of geocell
confinement on the performance of earth embankments constructed over weak foundation soil.
They evaluated the influence of several factors on the behavior of the embankment, such as
tensile stiffness of geocell material, height and length of geocell layer, pocket size of the cell,
pattern of formation of geocells, and type of fill material inside the cells. Geocell confinement
was found to be beneficial in increasing the bearing capacity and reducing the deformation of the
embankment.
2.2 Recycled Asphalt Pavement Materials
2.2.1 Sources and Applications
Recycled Asphalt Pavement (RAP) is a removed or reprocessed material derived from
existing aged asphalt pavements or plant hot mix asphalt (HMA) waste containing asphalt and
aggregate. Generally, asphalt pavements are removed either by milling using a milling machine
or full depth removal using a bulldozer or pneumatic pavement breaker. The removed asphalt
material is processed using a series of operations including crushing, screening, conveying, and
stacking, etc. The RAP is processed either at the central processing plant or on site. According
to the National Asphalt Pavement Association (NAPA), it is estimated that U. S. production of
asphalt pavement materials is around 500 million tons per year. In 2011, about 60 million tons of
RAP were reused or recycled directly into pavements by transportation agencies. In addition,
agencies reuse or recycle about 40 million tons of RAP for other pavement related applications
every year. About 100 million tons of RAP were used in 2011, compared to 72 million tons used
Page 29
13
annually in the early 1990s (FHWA-HRT-11-021). High-quality and well-graded aggregates
coated with asphalt binder can be obtained when RAP is crushed and screened properly.
The use of RAP in pavement construction has become more popular since the mid-1970s,
although it was practiced as early as 1915. Previous sustained efforts to recover and reuse old
asphalt paving materials in road construction were undertaken in Nevada and Texas in 1974.
RAP has been used mostly in hot or cold mix asphalt with virgin asphalt binder and aggregate. In
addition, RAP has been used as granular bases or sub-bases, stabilized base aggregate, and
embankment fill for constructing roadways, roadbeds, shoulders, and embankments (AASHTO
Center for Environmental Excellence 2003). According to the FHWA Pavement Recycling
Guidelines (FHWA-HRT-11-021), the recycling or reuse of RAP for pavement construction has
the following advantages: (a) reduced cost of construction, (b) preservation of aggregate and
binder resources, (c) preservation of the environment, and (d) preservation of energy.
According to NAPA, more than 90% of U.S. roads are paved with HMA. As roads
become old, transportation agencies face increasing demand for raw materials required to
maintain and rehabilitate these roads. Because of growing demand, the scarcity and rising cost of
aggregate and binder, and environmental and energy saving considerations, RAP is considered as
a viable alternative to virgin aggregate materials in roadway construction. According to the
FHWA survey (FHWA-HRT-10-001), as of 2007, the average amount of RAP incorporated into
HMA mixtures by state DOTs was 12% by weight. State DOT specifications have set restrictions
on the maximum amount of RAP in HMA. If more than 15% RAP is used in a new mix, the
required performance grade of the virgin binder should be adjusted.
In 2007, the North Carolina Department of Transportation (NCDOT) conducted a survey
on behalf of FHWA and AASHTO to determine the level of RAP use across the country, as well
Page 30
14
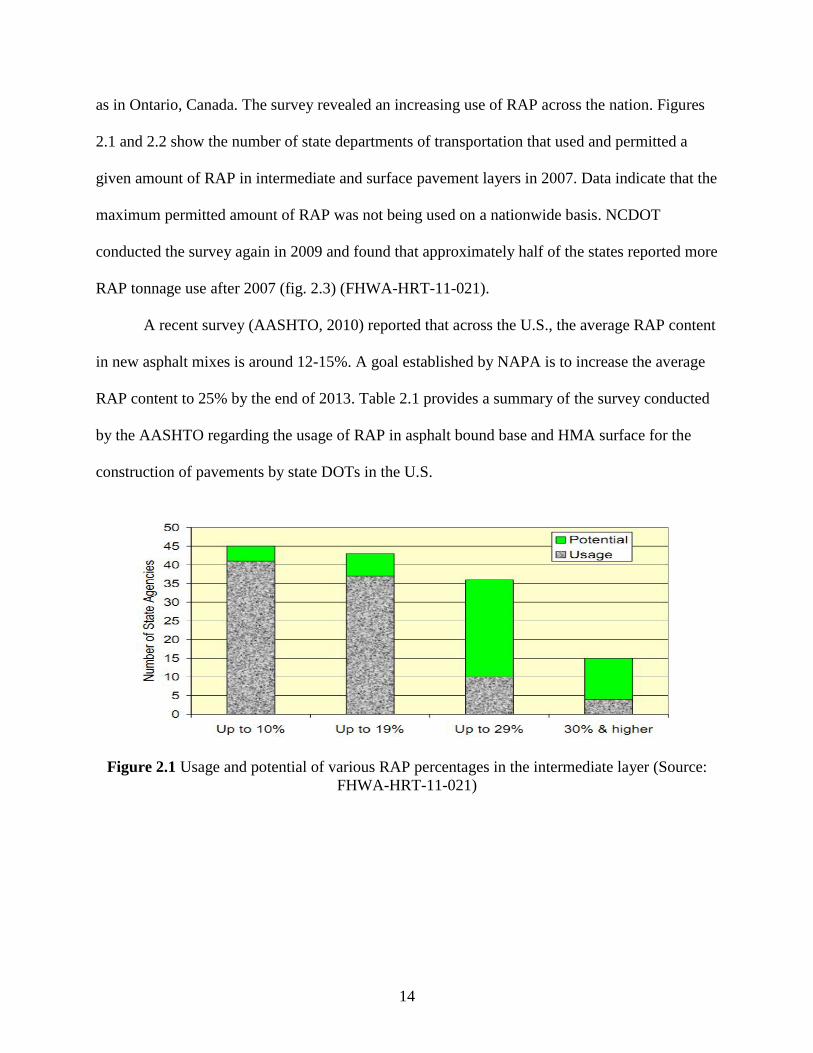
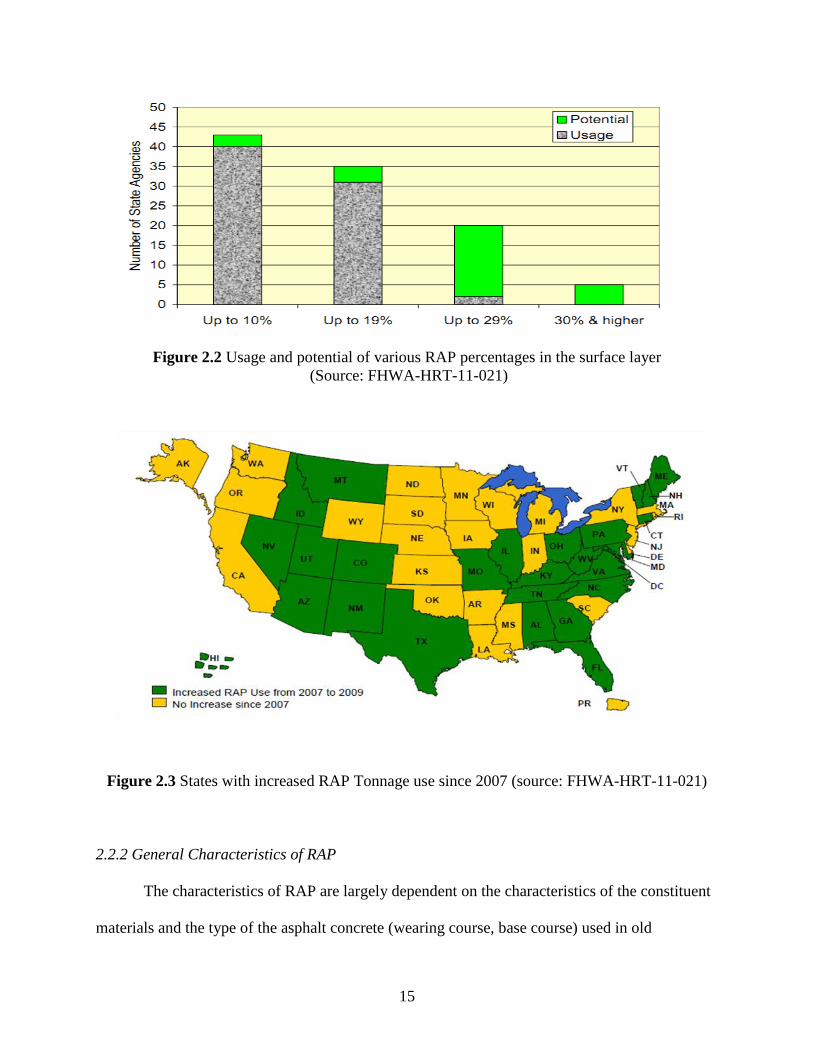
as in Ontario, Canada. The survey revealed an increasing use of RAP across the nation. Figures
2.1 and 2.2 show the number of state departments of transportation that used and permitted a
given amount of RAP in intermediate and surface pavement layers in 2007. Data indicate that the
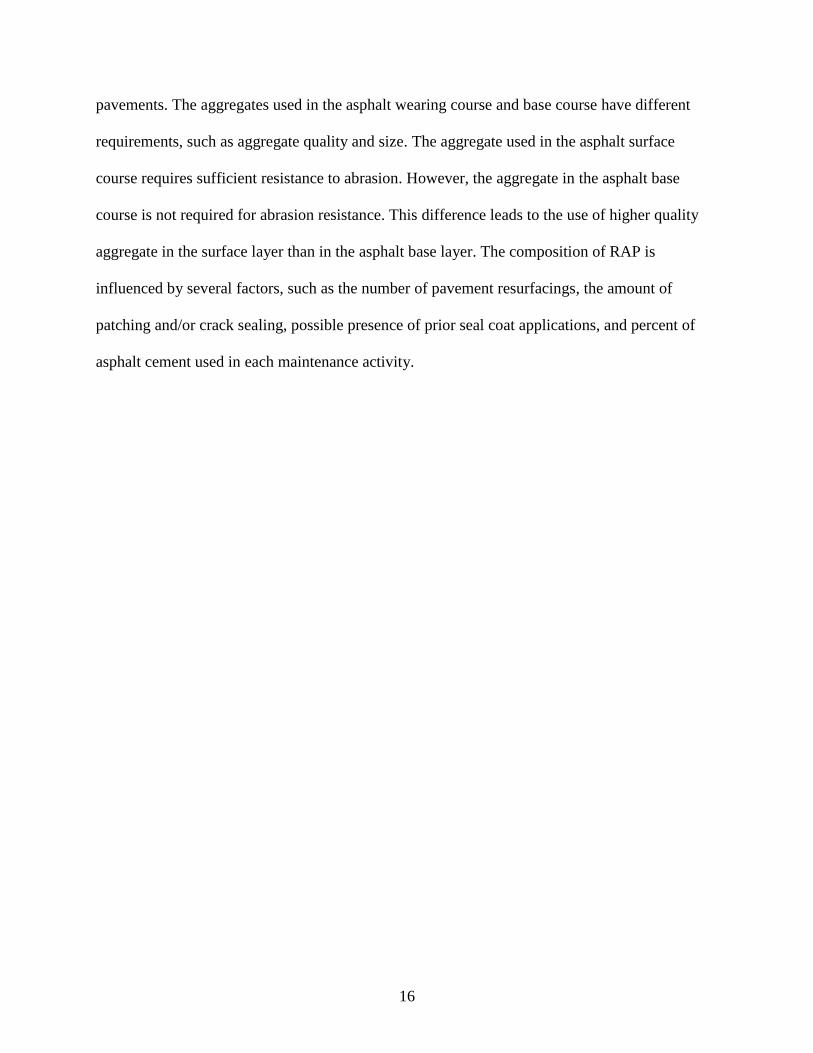
maximum permitted amount of RAP was not being used on a nationwide basis. NCDOT
conducted the survey again in 2009 and found that approximately half of the states reported more
RAP tonnage use after 2007 (fig. 2.3) (FHWA-HRT-11-021).
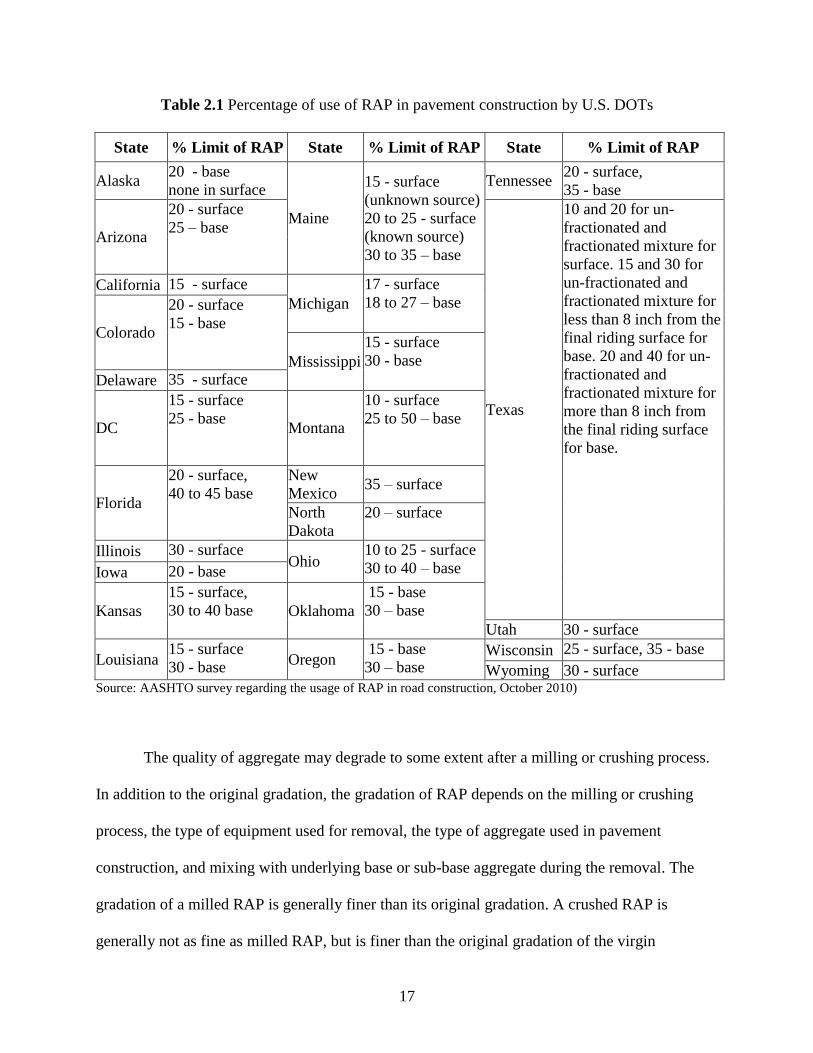
A recent survey (AASHTO, 2010) reported that across the U.S., the average RAP content
in new asphalt mixes is around 12-15%. A goal established by NAPA is to increase the average
RAP content to 25% by the end of 2013. Table 2.1 provides a summary of the survey conducted
by the AASHTO regarding the usage of RAP in asphalt bound base and HMA surface for the
construction of pavements by state DOTs in the U.S.
Figure 2.1 Usage and potential of various RAP percentages in the intermediate layer (Source:
FHWA-HRT-11-021)
Page 31
15
Figure 2.2 Usage and potential of various RAP percentages in the surface layer
(Source: FHWA-HRT-11-021)
Figure 2.3 States with increased RAP Tonnage use since 2007 (source: FHWA-HRT-11-021)
2.2.2 General Characteristics of RAP
The characteristics of RAP are largely dependent on the characteristics of the constituent
materials and the type of the asphalt concrete (wearing course, base course) used in old
Page 32
16
pavements. The aggregates used in the asphalt wearing course and base course have different
requirements, such as aggregate quality and size. The aggregate used in the asphalt surface
course requires sufficient resistance to abrasion. However, the aggregate in the asphalt base
course is not required for abrasion resistance. This difference leads to the use of higher quality
aggregate in the surface layer than in the asphalt base layer. The composition of RAP is
influenced by several factors, such as the number of pavement resurfacings, the amount of
patching and/or crack sealing, possible presence of prior seal coat applications, and percent of
asphalt cement used in each maintenance activity.
Page 33
17
Table 2.1 Percentage of use of RAP in pavement construction by U.S. DOTs
State % Limit of RAP State % Limit of RAP State % Limit of RAP
Alaska 20 - base
none in surface
Maine
15 - surface
(unknown source)
20 to 25 - surface
(known source)
30 to 35 – base
Tennessee 20 - surface,
35 - base
Arizona
20 - surface
25 – base
Texas
10 and 20 for un-
fractionated and
fractionated mixture for
surface. 15 and 30 for
un-fractionated and
fractionated mixture for
less than 8 inch from the
final riding surface for
base. 20 and 40 for un-
fractionated and
fractionated mixture for
more than 8 inch from
the final riding surface
for base.
California 15 - surface
Michigan
17 - surface
18 to 27 – base
Colorado
20 - surface
15 - base
Mississippi
15 - surface
30 - base
Delaware 35 - surface
DC
15 - surface
25 - base Montana
10 - surface
25 to 50 – base
Florida
20 - surface,
40 to 45 base
New
Mexico 35 – surface
North
Dakota
20 – surface
Illinois 30 - surface Ohio
10 to 25 - surface
30 to 40 – base Iowa 20 - base
Kansas
15 - surface,
30 to 40 base Oklahoma
15 - base
30 – base
Utah 30 - surface
Louisiana 15 - surface
30 - base Oregon
15 - base
30 – base Wisconsin 25 - surface, 35 - base
Wyoming 30 - surface Source: AASHTO survey regarding the usage of RAP in road construction, October 2010)
The quality of aggregate may degrade to some extent after a milling or crushing process.
In addition to the original gradation, the gradation of RAP depends on the milling or crushing
process, the type of equipment used for removal, the type of aggregate used in pavement
construction, and mixing with underlying base or sub-base aggregate during the removal. The
gradation of a milled RAP is generally finer than its original gradation. A crushed RAP is
generally not as fine as milled RAP, but is finer than the original gradation of the virgin
Page 34
18
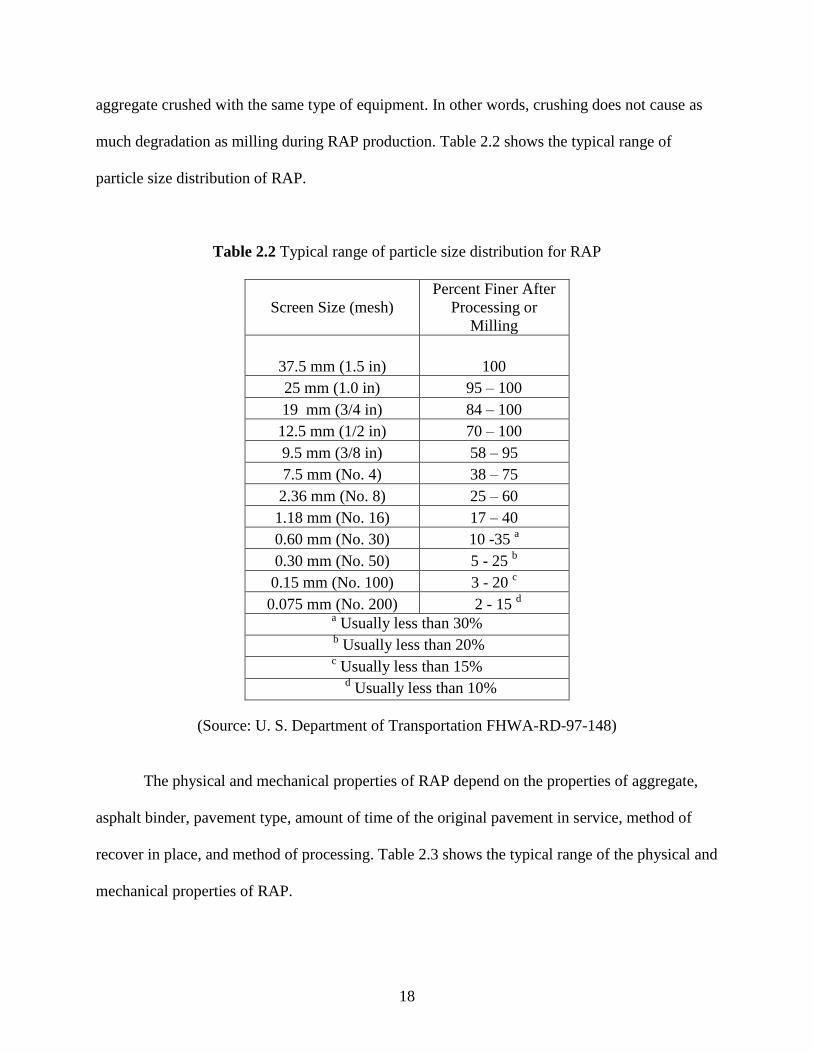
aggregate crushed with the same type of equipment. In other words, crushing does not cause as
much degradation as milling during RAP production. Table 2.2 shows the typical range of
particle size distribution of RAP.
Table 2.2 Typical range of particle size distribution for RAP
Screen Size (mesh)
Percent Finer After
Processing or
Milling
37.5 mm (1.5 in) 100
25 mm (1.0 in) 95 – 100
19 mm (3/4 in) 84 – 100
12.5 mm (1/2 in) 70 – 100
9.5 mm (3/8 in) 58 – 95
7.5 mm (No. 4) 38 – 75
2.36 mm (No. 8) 25 – 60
1.18 mm (No. 16) 17 – 40
0.60 mm (No. 30) 10 -35 a
0.30 mm (No. 50) 5 - 25 b
0.15 mm (No. 100) 3 - 20 c
0.075 mm (No. 200) 2 - 15 d
a Usually less than 30%
b Usually less than 20%
c Usually less than 15%
d Usually less than 10%
(Source: U. S. Department of Transportation FHWA-RD-97-148)
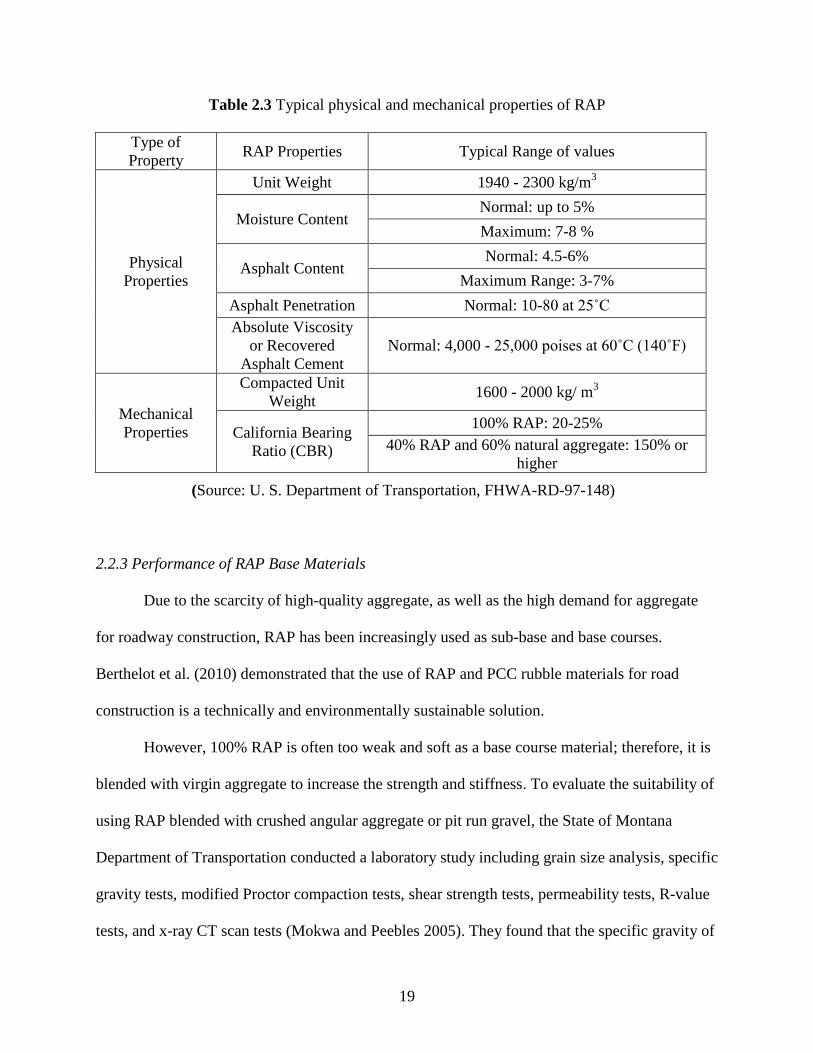
The physical and mechanical properties of RAP depend on the properties of aggregate,
asphalt binder, pavement type, amount of time of the original pavement in service, method of
recover in place, and method of processing. Table 2.3 shows the typical range of the physical and
mechanical properties of RAP.
Page 35
19
Table 2.3 Typical physical and mechanical properties of RAP
Type of
Property RAP Properties Typical Range of values
Physical
Properties
Unit Weight 1940 - 2300 kg/m3
Moisture Content Normal: up to 5%
Maximum: 7-8 %
Asphalt Content Normal: 4.5-6%
Maximum Range: 3-7%
Asphalt Penetration Normal: 10-80 at 25˚C
Absolute Viscosity
or Recovered
Asphalt Cement
Normal: 4,000 - 25,000 poises at 60˚C (140˚F)
Mechanical
Properties
Compacted Unit
Weight 1600 - 2000 kg/ m
3
California Bearing
Ratio (CBR)
100% RAP: 20-25%
40% RAP and 60% natural aggregate: 150% or
higher
(Source: U. S. Department of Transportation, FHWA-RD-97-148)
2.2.3 Performance of RAP Base Materials
Due to the scarcity of high-quality aggregate, as well as the high demand for aggregate
for roadway construction, RAP has been increasingly used as sub-base and base courses.
Berthelot et al. (2010) demonstrated that the use of RAP and PCC rubble materials for road
construction is a technically and environmentally sustainable solution.
However, 100% RAP is often too weak and soft as a base course material; therefore, it is
blended with virgin aggregate to increase the strength and stiffness. To evaluate the suitability of
using RAP blended with crushed angular aggregate or pit run gravel, the State of Montana
Department of Transportation conducted a laboratory study including grain size analysis, specific
gravity tests, modified Proctor compaction tests, shear strength tests, permeability tests, R-value
tests, and x-ray CT scan tests (Mokwa and Peebles 2005). They found that the specific gravity of
Page 36
20
RAP blended samples decreased as the percentage of RAP was increased. Results from Proctor
compaction tests indicated that the maximum dry unit weight and optimum water content
decreased with the addition of RAP. Shear strength tests showed that blending of RAP with
aggregate resulted in a more ductile and softer response than that of the virgin (unblended)
aggregate. The secant modulus of the blend at low strain decreased as the percentage of RAP in
the sample was increased. As the RAP content increased, the stiffness of the blend decreased and
approached that of the blend with 75% RAP content. The large direct shear tests showed that the
shear strength of the blend decreased up to 20% with the increase of RAP, and appeared to level
off with no significant change as the RAP content was increased to 75%. Constant head
permeability tests indicated that the permeability of the blend increased as the percentage of RAP
increased. The addition of RAP to the crushed angular aggregate had a minor effect on the R-
value, while the addition of RAP to the natural pit run soil resulted in an increase of the R-value.
Mokwa and Peebles (2005) concluded that the R-value was primarily dependent upon the
properties of the virgin aggregate, and was only secondarily influenced by the percentage of
RAP. In contrast, Bennert and Maher (2005) found that as the percentage of RAP in the blend of
base courses increased, both the CBR and permeability values decreased, but permanent
deformation increased.
To evaluate the potential use of RAP and recycled concrete aggregate (RCA) as base and
sub-base materials, the New Jersey Department of Transportation conducted the following
performance tests: permeability (falling head and constant head tests), triaxial shear strength,
cyclic triaxial loading, California Bearing Ratio (CBR), and resilient modulus tests. The test
results showed that an increase of the percent of RAP in the blend reduced both the CBR and
Page 37
21
permeability values. The addition of RAP also caused larger permanent deformations during
cyclic triaxial testing.
Mechanistic-Empirical Pavement Design Guide (MEPDG) requires resilient moduli of
unbound layers for pavement design. The laboratory tests showed that as RAP content was
increased, the resilient modulus of the blend increased (Alam et al. 2009). RAP has a potential to
be used in high percentages as pavement bases, which may help alleviate a growing
environmental problem while providing a strong pavement foundation.
Kim et al. (2007) carried out resilient modulus tests on specimens with different ratios of
RAP to aggregate. The test results show that specimens at 65% optimum moisture content
(OMC) were stiffer than specimens at 100% OMC at all confining pressures. The 50%
aggregate-50% RAP specimens had stiffness equivalent to 100% aggregate specimens at lower
confining pressures. At higher confining pressures, the blended RAP specimens were even
stiffer. However, the test results indicated that specimens with RAP exhibited larger permanent
deformation than those with 100% aggregate.
The effect of moisture content on the resilient modulus of RAP base layer was similar to
its effect on virgin aggregate base course. The resilient modulus of the RAP base layer decreased
with an increase in moisture content (Mohamed et al. 2010).
2.3 Summary of Past Studies
Findings from previous studies on geosynthetics and RAP are summarized as follows:
i. The inclusion of geosynthetics in pavements reduces required base thickness, increases
bearing capacity, and increases pavement life.
Page 38
22
ii. Geocell-reinforced granular bases behave as stiffened mattresses or slabs and distribute
traffic loads over a wider area of subgrade, thus increasing the bearing capacity and
reducing deformation.
iii. Height, location of placement of geocell in a base course, thickness of the base course,
and strength of subgrade, etc., affect the overall performance of geocell-reinforced
granular bases.
iv. Recycled Asphalt Pavement (RAP) is a reclaimed waste material derived from existing
flexible pavements. It can be used in hot mix asphalt or as a base course material to
provide a sustainable solution.
v. RAP is often blended with virgin aggregate to attain sufficient strength and stiffness as a
base course material. The variation of RAP content in the blend affects the properties and
behavior of the blend.
Page 39
23
Chapter 3 Material Properties and Experimental Setup
This chapter presents the characteristics of the materials as well as the experimental set-
up of the large-scale cyclic plate load tests conducted in this study. The cyclic plate load tests
were conducted in a large geotechnical test box equipped with a servo hydraulic MTS loading
system available at the University of Kansas.
3.1 Base Course
The base course material used in this study was RAP, which was provided by R.D.
Johnson Excavating, Co. in Lawrence, Kansas. The RAP was milled off from a city street in
Lawrence. The binder content of the RAP was determined by the ignition method (ASTM
D6307) and the centrifuge method (ASTM D2172). The gradation of the RAP aggregate was
determined for the sample extracted by the ignition method before and after compaction tests.
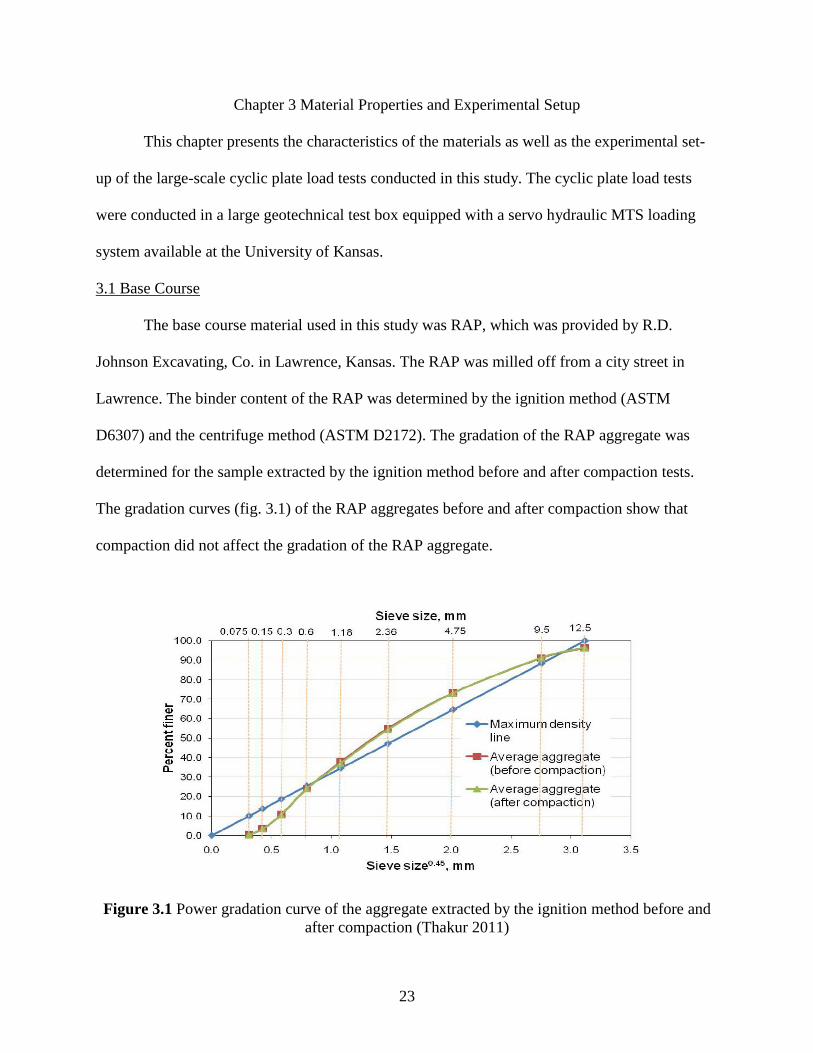
The gradation curves (fig. 3.1) of the RAP aggregates before and after compaction show that
compaction did not affect the gradation of the RAP aggregate.
Figure 3.1 Power gradation curve of the aggregate extracted by the ignition method before and
after compaction (Thakur 2011)
Page 40
24
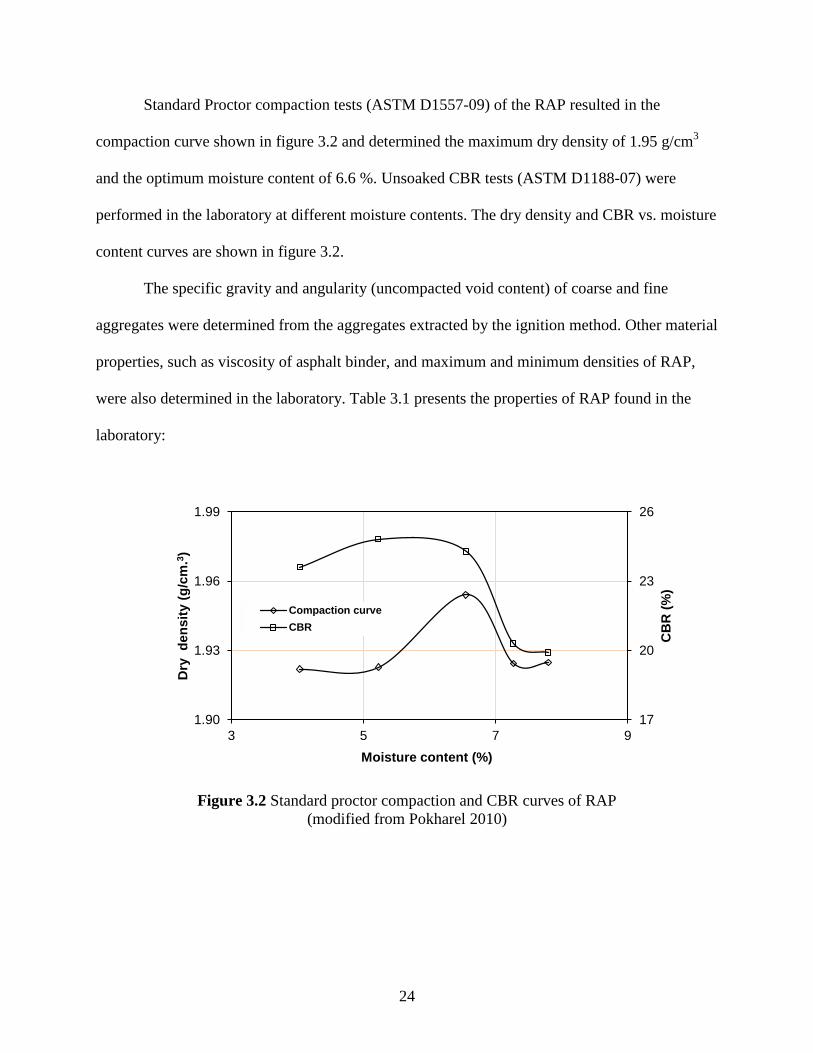
Standard Proctor compaction tests (ASTM D1557-09) of the RAP resulted in the
compaction curve shown in figure 3.2 and determined the maximum dry density of 1.95 g/cm3
and the optimum moisture content of 6.6 %. Unsoaked CBR tests (ASTM D1188-07) were
performed in the laboratory at different moisture contents. The dry density and CBR vs. moisture
content curves are shown in figure 3.2.
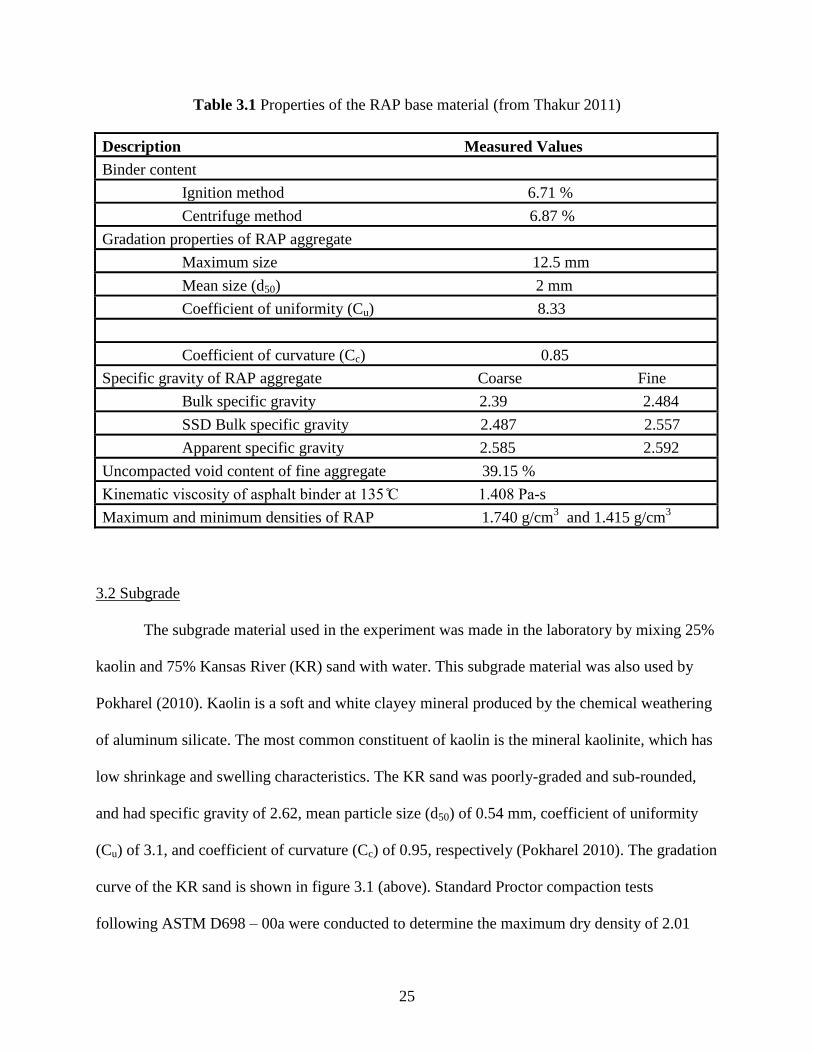
The specific gravity and angularity (uncompacted void content) of coarse and fine
aggregates were determined from the aggregates extracted by the ignition method. Other material
properties, such as viscosity of asphalt binder, and maximum and minimum densities of RAP,
were also determined in the laboratory. Table 3.1 presents the properties of RAP found in the
laboratory:
Figure 3.2 Standard proctor compaction and CBR curves of RAP
(modified from Pokharel 2010)
17
20
23
26
1.90
1.93
1.96
1.99
3 5 7 9
CB
R (
%)
Dry
d
en
sit
y (
g/c
m.3
)
Moisture content (%)
Compaction curve
CBR
Page 41
25
Table 3.1 Properties of the RAP base material (from Thakur 2011)
Description Measured Values
Binder content
Ignition method 6.71 %
Centrifuge method 6.87 %
Gradation properties of RAP aggregate
Maximum size 12.5 mm
Mean size (d50) 2 mm
Coefficient of uniformity (Cu) 8.33
Coefficient of curvature (Cc) 0.85
Specific gravity of RAP aggregate Coarse Fine
Bulk specific gravity 2.39 2.484
SSD Bulk specific gravity 2.487 2.557
Apparent specific gravity 2.585 2.592
Uncompacted void content of fine aggregate 39.15 %
inematic viscosity of asphalt binder at 135 C 1.408 Pa-s
Maximum and minimum densities of RAP 1.740 g/cm3 and 1.415 g/cm
3
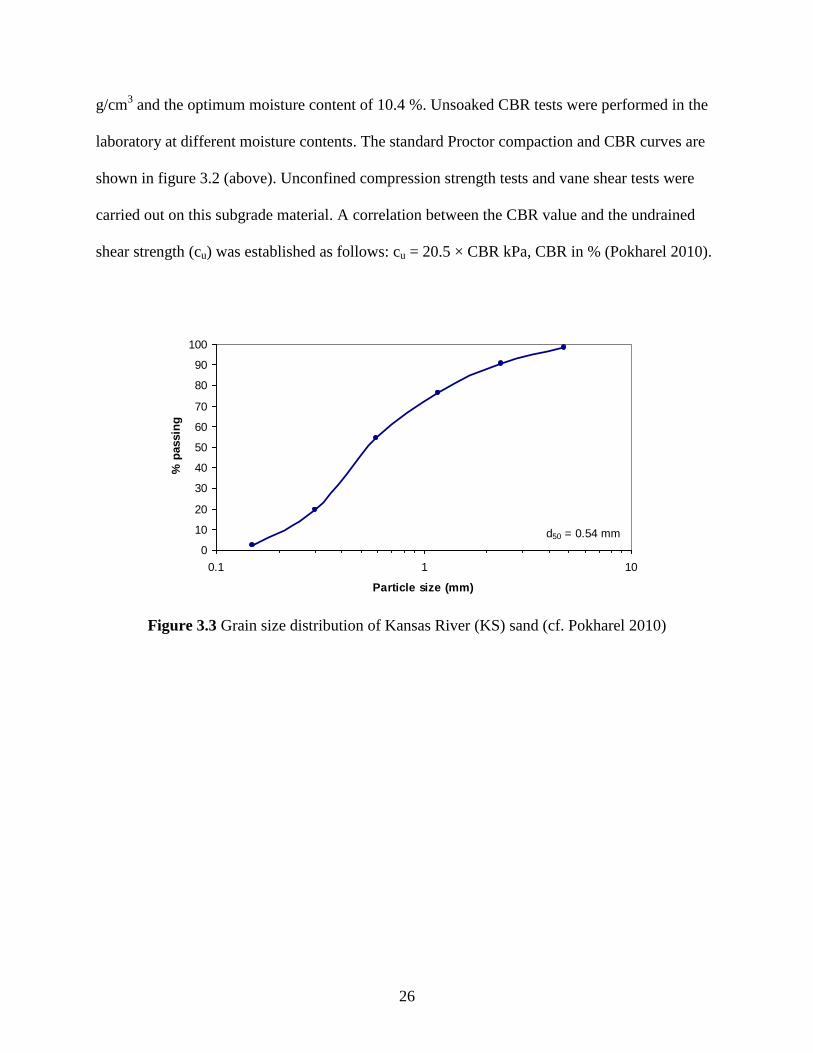
3.2 Subgrade
The subgrade material used in the experiment was made in the laboratory by mixing 25%
kaolin and 75% Kansas River (KR) sand with water. This subgrade material was also used by
Pokharel (2010). Kaolin is a soft and white clayey mineral produced by the chemical weathering
of aluminum silicate. The most common constituent of kaolin is the mineral kaolinite, which has
low shrinkage and swelling characteristics. The KR sand was poorly-graded and sub-rounded,
and had specific gravity of 2.62, mean particle size (d50) of 0.54 mm, coefficient of uniformity
(Cu) of 3.1, and coefficient of curvature (Cc) of 0.95, respectively (Pokharel 2010). The gradation
curve of the KR sand is shown in figure 3.1 (above). Standard Proctor compaction tests
following ASTM D698 – 00a were conducted to determine the maximum dry density of 2.01
Page 42
26
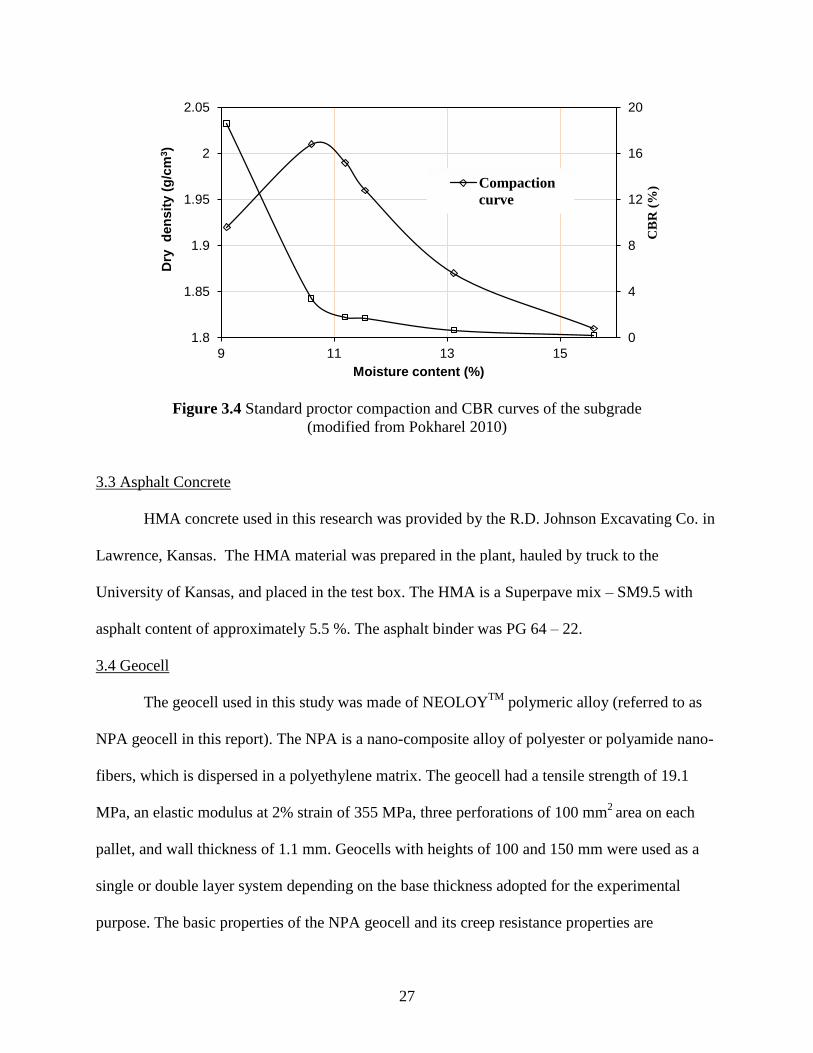
g/cm3 and the optimum moisture content of 10.4 %. Unsoaked CBR tests were performed in the
laboratory at different moisture contents. The standard Proctor compaction and CBR curves are
shown in figure 3.2 (above). Unconfined compression strength tests and vane shear tests were
carried out on this subgrade material. A correlation between the CBR value and the undrained
shear strength (cu) was established as follows: cu = 20.5 × CBR kPa, CBR in % (Pokharel 2010).
Figure 3.3 Grain size distribution of Kansas River (KS) sand (cf. Pokharel 2010)
0
10
20
30
40
50
60
70
80
90
100
0.1 1 10
Particle size (mm)
% p
assin
g
d50 = 0.54 mm
Page 43
27
Figure 3.4 Standard proctor compaction and CBR curves of the subgrade
(modified from Pokharel 2010)
3.3 Asphalt Concrete
HMA concrete used in this research was provided by the R.D. Johnson Excavating Co. in
Lawrence, Kansas. The HMA material was prepared in the plant, hauled by truck to the
University of Kansas, and placed in the test box. The HMA is a Superpave mix – SM9.5 with
asphalt content of approximately 5.5 %. The asphalt binder was PG 64 – 22.
3.4 Geocell
The geocell used in this study was made of NEOLOYTM
polymeric alloy (referred to as
NPA geocell in this report). The NPA is a nano-composite alloy of polyester or polyamide nano-
fibers, which is dispersed in a polyethylene matrix. The geocell had a tensile strength of 19.1
MPa, an elastic modulus at 2% strain of 355 MPa, three perforations of 100 mm2
area on each
pallet, and wall thickness of 1.1 mm. Geocells with heights of 100 and 150 mm were used as a
single or double layer system depending on the base thickness adopted for the experimental
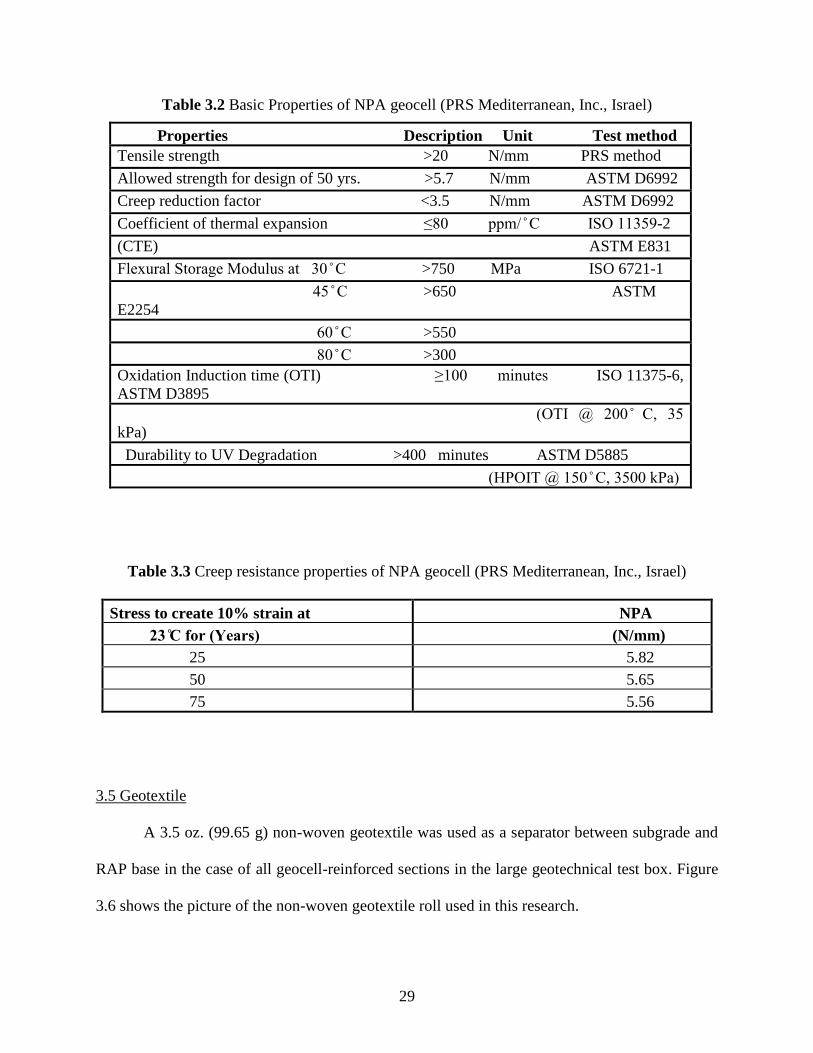
purpose. The basic properties of the NPA geocell and its creep resistance properties are
0
4
8
12
16
20
1.8
1.85
1.9
1.95
2
2.05
9 11 13 15
CB
R (
%)
Dry
d
en
sit
y (
g/c
m3)
Moisture content (%)
Compaction
curve
Page 44
28
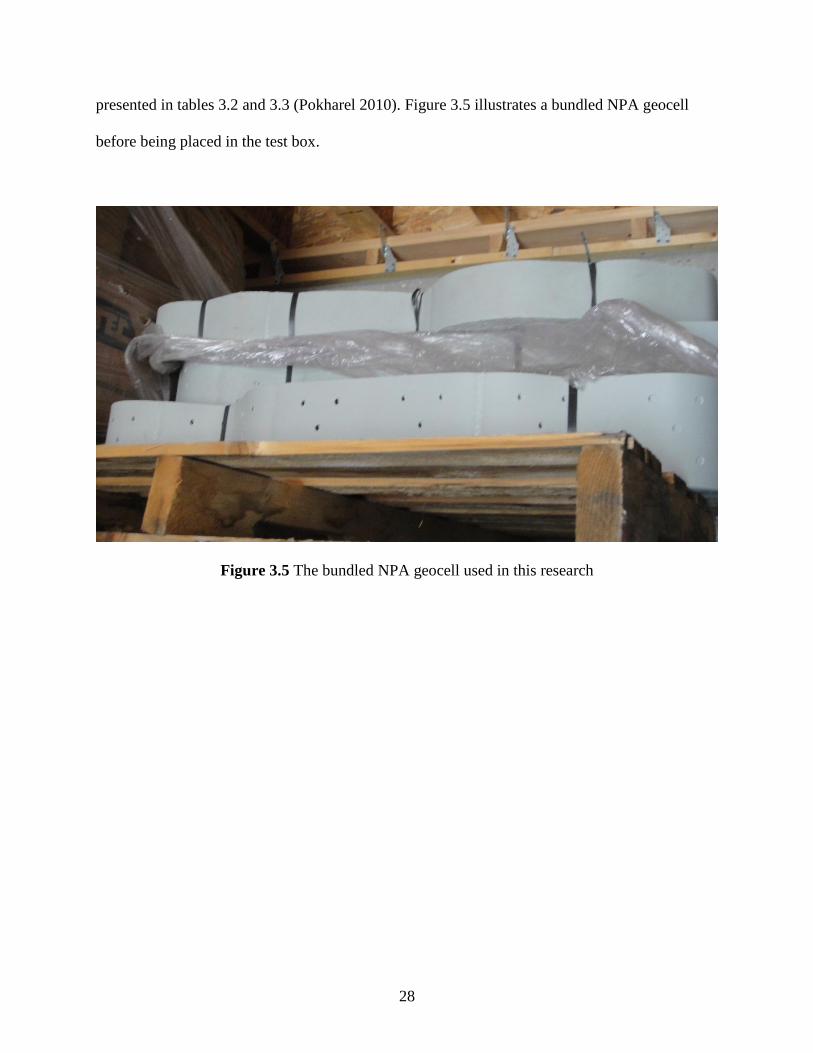
presented in tables 3.2 and 3.3 (Pokharel 2010). Figure 3.5 illustrates a bundled NPA geocell
before being placed in the test box.
Figure 3.5 The bundled NPA geocell used in this research
Page 45
29
Table 3.2 Basic Properties of NPA geocell (PRS Mediterranean, Inc., Israel)
Properties Description Unit Test method
Tensile strength >20 N/mm PRS method
Allowed strength for design of 50 yrs. >5.7 N/mm ASTM D6992
Creep reduction factor <3.5 N/mm ASTM D6992
Coefficient of thermal expansion ≤80 ppm C S 11359-2
(CTE) ASTM E831
Fle ural Storage Modulus at 30 C >750 MPa ISO 6721-1
45 C >650 ASTM
E2254
60 C >550
80 C >300
Oxidation Induction time (OTI) ≥100 minutes ISO 11375-6,
ASTM D3895
( T 200 C, 35
kPa)
Durability to UV Degradation >400 minutes ASTM D5885
( P T 150 C, 3500 Pa)
Table 3.3 Creep resistance properties of NPA geocell (PRS Mediterranean, Inc., Israel)
Stress to create 10% strain at NPA
(N/mm)
25 5.82
50 5.65
75 5.56
3.5 Geotextile
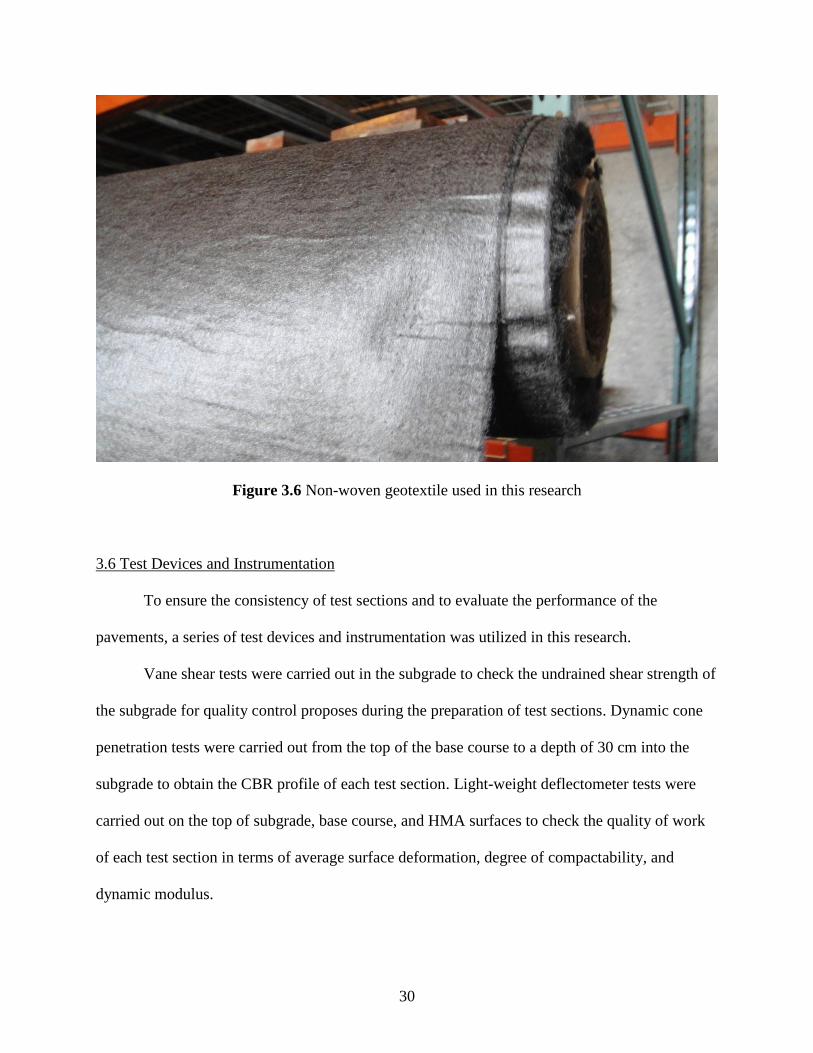
A 3.5 oz. (99.65 g) non-woven geotextile was used as a separator between subgrade and
RAP base in the case of all geocell-reinforced sections in the large geotechnical test box. Figure
3.6 shows the picture of the non-woven geotextile roll used in this research.
Page 46
30
Figure 3.6 Non-woven geotextile used in this research
3.6 Test Devices and Instrumentation
To ensure the consistency of test sections and to evaluate the performance of the
pavements, a series of test devices and instrumentation was utilized in this research.
Vane shear tests were carried out in the subgrade to check the undrained shear strength of
the subgrade for quality control proposes during the preparation of test sections. Dynamic cone
penetration tests were carried out from the top of the base course to a depth of 30 cm into the
subgrade to obtain the CBR profile of each test section. Light-weight deflectometer tests were
carried out on the top of subgrade, base course, and HMA surfaces to check the quality of work
of each test section in terms of average surface deformation, degree of compactability, and
dynamic modulus.
Page 47
31
Earth pressure cells were installed at the interface between subgrade and base course.
Strain gauges were placed on the geocell and at the bottom of the HMA surface. Tell-tales were
installed at the interface between subgrade and base and the interface between HMA surface and
base. Data acquisition software was configured to record the above-mentioned information on
full time-history of response for prescribed maximum load cycles and maximum surface
deformations.
3.6.1 Earth Pressure Cells
The earth pressure cells used in this research were strain gauge-type soil pressure gauges
manufactured in Japan by Tokyo Sokki Kenkyujo Co., Ltd. They had two capacity ranges: 200
(Model: KDE-200KPA) and 500 kPa (Model: KDE-500KPA). These pressure cells are made of
stainless steel and are suitable for measuring earth pressure under dynamic loading. Each cell
had an external diameter of 50 mm, a diameter of the sensing area of 46 mm, a thickness of 11.3
mm, and a total weight of 160 g. This type of pressure cell can function at a temperature range of
-20 to 60o C.
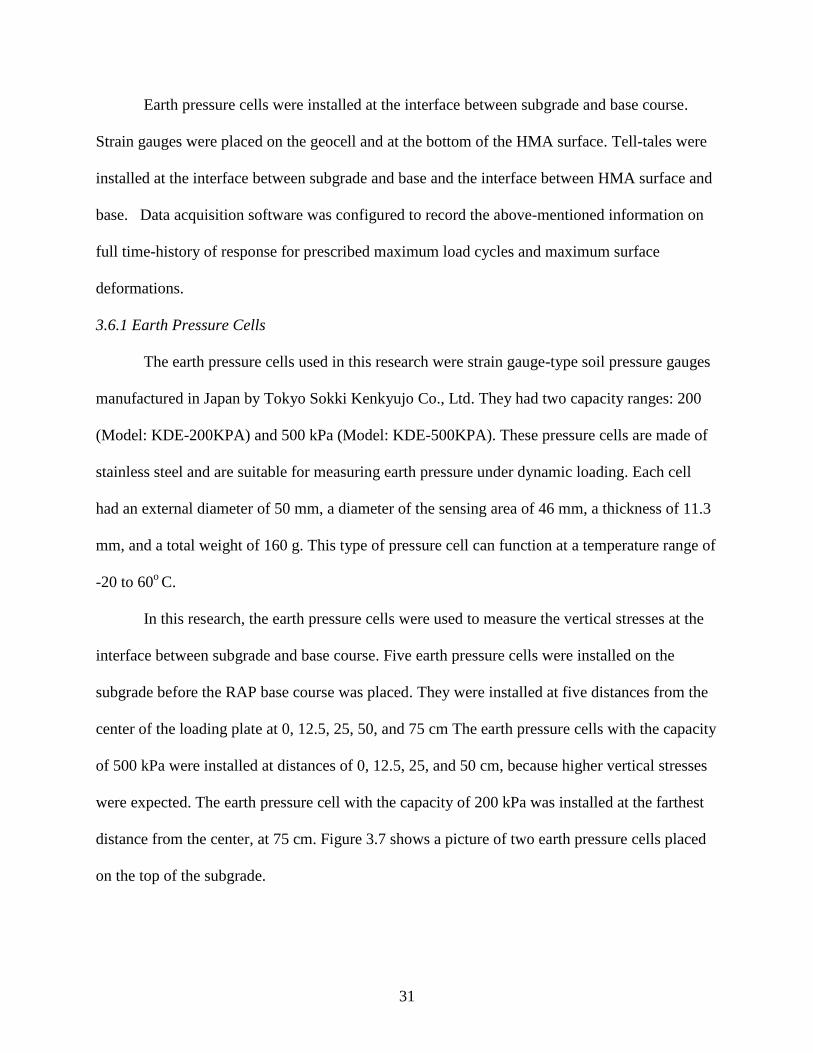
In this research, the earth pressure cells were used to measure the vertical stresses at the
interface between subgrade and base course. Five earth pressure cells were installed on the
subgrade before the RAP base course was placed. They were installed at five distances from the
center of the loading plate at 0, 12.5, 25, 50, and 75 cm The earth pressure cells with the capacity
of 500 kPa were installed at distances of 0, 12.5, 25, and 50 cm, because higher vertical stresses
were expected. The earth pressure cell with the capacity of 200 kPa was installed at the farthest
distance from the center, at 75 cm. Figure 3.7 shows a picture of two earth pressure cells placed
on the top of the subgrade.
Page 48
32
Figure 3.7 Earth pressure cells on the top of the subgrade
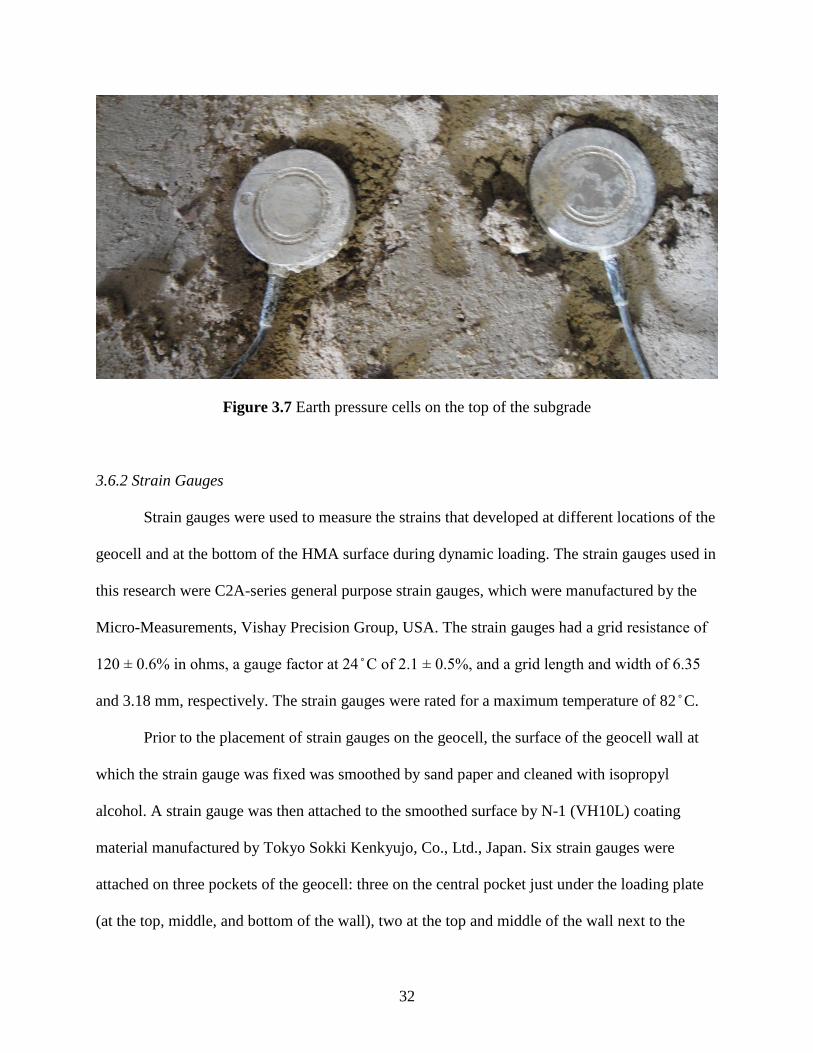
3.6.2 Strain Gauges
Strain gauges were used to measure the strains that developed at different locations of the
geocell and at the bottom of the HMA surface during dynamic loading. The strain gauges used in
this research were C2A-series general purpose strain gauges, which were manufactured by the
Micro-Measurements, Vishay Precision Group, USA. The strain gauges had a grid resistance of
120 0.6 in ohms, a gauge factor at 24 C of 2.1 0.5 , and a grid length and idth of 6.35
and 3.18 mm, respectively. The strain gauges were rated for a maximum temperature of 82 C.
Prior to the placement of strain gauges on the geocell, the surface of the geocell wall at
which the strain gauge was fixed was smoothed by sand paper and cleaned with isopropyl
alcohol. A strain gauge was then attached to the smoothed surface by N-1 (VH10L) coating
material manufactured by Tokyo Sokki Kenkyujo, Co., Ltd., Japan. Six strain gauges were
attached on three pockets of the geocell: three on the central pocket just under the loading plate
(at the top, middle, and bottom of the wall), two at the top and middle of the wall next to the
Page 49
33
central pocket, and one at the top of the wall next to the second pocket. Strain gauges at the top
and bottom were placed horizontally, and strain gauges at middle were placed vertically. All
geocell pockets with strain gauges were oriented in the line identical to the width of the test box
at the distances of 0, 25, and 50 cm from the center. Figure 3.8 shows a picture of strain gauges
affixed on the geocell at different locations.
The same C2A series strain gauges were used to measure the strains developed at the
bottom of the HMA surface during cyclic loading. For easy installation, a rectangular shape
aluminum plate measuring 80 mm long × 7 mm wide × 1.0 mm thick was smoothed by sand
paper and cleaned with isopropyl alcohol. A strain gauge was attached to the aluminum plate and
M-Coat C was applied to cover the strain gauge. The coating was cured for 24 hours for
hardening. After 24 hours, 3145 RTV silicon rubber coating was applied and allowed to cure for
another 24 hours before the aluminum plate with the strain gauge was placed at the bottom of the
HMA surface. The aluminum plate with the strain gauge is referred as the pavement strain gauge
in this report. The main purpose of applying M-Coat C and 3145 RTV silicon rubber coating was
to protect the strain gauge and its wire from high temperature (approximately 135o
C) in HMA. A
typical strain gauge without any protection can survive up to a maximum temperature of about
82o C.
Figure 3.9 (below) shows a picture of prepared pavement strain gauges.
Page 50
34
Figure 3.8 Strain gauge affixed on geocell Figure 3.9 Pavement strain gauge
3.6.3 Displacement Transducers and Tell-Tales
The displacement transducers used in this research were strain gauge-type sensors
manufactured by Tokyo Sokki Kenkyujo, Co., Ltd., Japan. They had two displacement ranges: 0
to 100 mm (Model: CDP-100) and 0 to 50 mm (Model: CDP-50). Two displacement transducers
of 100 mm limit were affixed on the loading plate. One displacement transducer of 100 mm limit
was affixed at a distance 25 cm from the center of the plate. Moreover, two displacement
transducers of 50 mm limit each were affixed at distances of 50 and 75 cm away from the center
of the loading plate. All of the displacement transducers were suspended from the reference
beam fastened on the top of the box. The displacement transducers were rested on the loading
plate or the metal plates on the HMA surface.
Moreover, displacement transducers were also used to measure the vertical displacements
at the interface of HMA surface and RAP base and the interface of RAP base and subgrade
through pre-installed tell-tales. Each tell-tale included a hollow metal tube measuring 6.3 mm in
diameter and 0.40 mm in wall thickness, inside of which was a steel rod 3.15 mm in diameter.
The steel rod was connected to two steel plates measuring 15 mm in diameter on both ends. The
Page 51
35
plate on one end was buried at the interface between subgrade and base or between base and
HMA surface. The plate on another end was above the HMA surface and used for seating a
displacement transducer for measurement. Two small holes measuring 8 mm in diameter were
drilled on the loading plate and the tell-tales were run through these pre-drilled holes. Figure
3.10 shows a picture of displacement transducers, as well as tell-tales.
Figure 3.10 Displacement transducers and tell-tales through the loading plate
3.6.4 Data Acquisition
Smart Dynamic Strain Recorder DC-204R, manufactured by Tokyo Sokki Kenkyujo,
Co., Ltd., Japan, was used to record the data from earth pressure cells, strain gauges, and
displacement transducers. There were four recorders used during the tests. One data recorder
served as a master recorder and the remaining three served as slaves, which were synchronized
with the master recorder through connections. Each recorder had four connection ports to strain
Page 52
36
gauge sensors. A manual data recorder was also used in some experiments when the number of
sensors was more than the capacity of the four Smart Dynamic Strain Recorders. In this case, a
connection was made between DC-204R and a manual data recorder, and the corresponding data
through the manual data recorder was noted manually.
Figure 3.11 Smart dynamic strain recorders and software for data acquisition
3.6.5 MTS Loading System
A servo hydraulic MTS loading system was used to apply cyclic loads on test sections in
the large geotechnical testing box. The MTS loading system consists of a steel loading frame, a
hydraulic actuator, and a servo-control unit connected to both software and a hydraulic control
valve. The Multi-Purpose Test Ware (MPT) software was used to apply a load, design a loading
pattern, and set the maximum number of loading cycles and maximum displacement limit in the
test. The MPT software was found to be flexible for the MTS servo-hydraulic control systems.
A steel loading plate of 304 mm in diameter and 30 mm in thickness was used to apply
cyclic loading on the test sections. A 10 mm thick rubber base was affixed at the bottom of the
Page 53
37
loading plate to simulate the rubber tire contact to the HMA surface. Figure 3.12 shows the
experimental set up of a typical test section in the large geotechnical test box.
The cyclic loads having a peak value of 40 kN and a trough value of 0.5 kN were applied
on the loading plate at a loading wave frequency of 0.77 Hz. The peak value of the load was
selected to simulate the single wheel load of 40 kN, which corresponds to a tire pressure of 550
kPa. Figure 3.13 shows the cyclic loading wave form of the MTS load system.
Figure 3.12 Experimental setup of a typical test section in the large geotechnical test box
Page 54
38
Figure 3.13 Cyclic loading wave form (from Pokharel 2010)
3.6.6 Vane Shear Test
Vane shear tests (ASTM D2573-08) were carried out to check the undrained shear
strength of subgrade during the preparation of the subgrade for test sections. The size of the vane
was 18.8 mm in diameter and 28.5 mm in length. The vane shear test as shown in figure 3.14
was used to evaluate the undrained shear strengths (Cu) at depths of 10 cm, 18 cm, and 25 cm
from the top of the prepared subgrade section at five different locations, and ensure the quality
and consistency of the prepared subgrade to attain the desired strength. The obtained undrained
shear strength by the vane shear test was used to estimate the CBR value of the prepared
subgrade. If the desired value of strength was not met, the subgrade was re-prepared until the
desired strength was reached. The following relationship established for this subgrade by
Pokharel (2010) was used to estimate the subgrade CBR value using the undrained shear strength
(Cu) by the vane shear test:
5.20(%) uC
CBR (3.1)
Page 55
39
Figure 3.14 Vane shear test apparatus
3.6.7 Dynamic Cone Penetration Test
Dynamic Cone Penetration (DCP) tests (ASTM D6951-03) were carried out at four
different locations approximately 24 hours after the placement of the RAP base course. The
objective of this test was to determine the CBR profile of subgrade and base course in each test
section. The following relationship established by Webster et al. (1992, 1994) was used to
estimate the CBR value.
(3.2)
where,
DPI = dynamic cone penetration index (mm/blow).
12.1)(
292(%)
DPICBR
Page 56
40
3.6.8 Light Weight Deflectometer Test
Light Weight Deflectometer (LWD) tests, as shown in figure. 3.15, were carried out on
each pavement layer of the prepared test section including subgrade, base, and HMA surface.
ZFG 3000 LWD manufactured by Zorn Instruments, Germany, was used. This test is a
nondestructive method which measures the deflection of the plate under an impact load by a
falling weight. There is an acceleration sensor on the loading plate. When the falling weight
drops on the loading plate, the acceleration signal captured by the sensor can be used to calculate
the deflection of the plate and the dynamic deformation modulus (Evd) of the soil. The mass of
the falling weight was 10 kg and the falling distance was 73 cm The test has three different
loading plate diameters, of 15, 20, and 30 cm The large diameter loading plate is suitable for
fine grained soil while the small diameter plate is suitable for coarse grained soil or even HMA
surface.
3.7 Vibratory Plate Compactor
A vibratory plate compactor, as shown in figure 3.16, was used to compact the subgrade,
base, and HMA surface during the preparation of test sections. The vibratory plate compactor
was not used to compact the geocell-reinforced RAP base because it could not densify the infill
material well. Therefore, manual compaction using the modified Proctor compaction hammer
was performed for the infill material in the geocell-reinforced RAP base.
Page 57
41
Figure 3.15 Light weight deflectometer test on the prepared test section
Figure 3.16 Vibratory plate compactor
Page 58
42
3.8 HMA Coring and Air Void
After the completion of each test, a core cutter was used to take samples from the HMA
surface, as shown in figure. 3.17. The HMA sample was used to find the air void of the HMA
surface. The diameter of the core cutter was 75 or 100 mm, depending on its availability in the
laboratory. Sampling was done at different locations to achieve a better representation of the
quality of the HMA surface. The bulk specific gravity (GBS) and theoretical maximum specific
gravity (GMS) of the core samples were determined, and the air void (Va) was calculated
following ASTM D3203 as follows:
%1001
MS
BSa
G
GV (3.3)
Figure 3.17 Samples taken by the core cutter at different locations
The materials and equipment discussed above were used in all the experimental tests in
this research. The data collected from the experiment are presented in the next chapter.
Page 59
43
Chapter 4 Experimental Data Analysis
This chapter presents the analysis of the data from the experiments carried out in the
large-scale geotechnical test box. The first part of the chapter explains the preparation of test
sections. The second part presents data obtained from the tests in a graphical form. At the end of
this chapter, the comparison of the results from different test sections is presented.
4.1 Preparation of Test Sections
4.1.1 Subgrade
The subgrade consisted of a mixture of 75% Kansas River (KR-I) sand and 25% kaolin.
The target CBR value of the subgrade was 5%, which represents an intermediate stiff subgrade
for pavement applications. The previous discussion in Chapter 3 showed that the CBR of 5%
occurred at the moisture content close to the optimum moisture content (OMC) of 10.4%. These
two materials were mixed in proportion manually on a platform to achieve a homogeneous dry
mixture. Water was added to the mixture and mixed again with water to achieve water content
slightly higher than the OMC of 10.4%. The prepared mixture was set for more than 24 hours to
allow uniform distribution of moisture in the mass.
The total thickness of the subgrade was 90 cm The prepared mixture was placed inside
the large box in a lift thickness of 15 cm for six lifts, and its moisture content was checked for
each lift If the moisture content differed from the required one, the moisture content of the
subgrade was adjusted by adding more water or by allowing it to dry. The placed subgrade soil
was then compacted by a vibratory plate compactor for several passes until the average vane
shear strength reached the desired value. Vane shear tests were conducted at five different
locations. The average undrained shear strength obtained from the vane shear tests was used to
estimate the subgrade CBR value based on the correlation described in section 3.6.6.
Page 60
44
Light weight deflectometer tests were carried out at six different locations over the
prepared subgrade using three different loading plates of 10, 20, and 30 cm in diameter, as
described in section 3.6.8. These tests were carried out to determine the dynamic deformation
modulus of the subgrade in each test section.
After the preparation of subgrade, a geotextile layer was placed at the interface between
the subgrade and the base course in the geocell-reinforced RAP base sections. In the
unreinforced RAP base sections, no geotextile was placed at the interface between the subgrade
and the base.
4.1.2 RAP Base Course
The base material used in all the experiments was RAP. The nominal thicknesses of the
RAP base courses adopted in the tests were 15, 23, and 30 cm, respectively. No test was done
for a 23 cm thick unreinforced base section. In the geocell-reinforced test sections, the geocell
was installed over the geotextile placed on the top of the subgrade. The plan view and actual
installation of the geocell over the subgrade with the geotextile are shown in figures 4.1 and 4.2.
In the 15 cm thick geocell-reinforced RAP base section, one layer of 10 cm high geocell infilled
with RAP was installed with a 5 cm thick RAP cover. In the 30 cm thick geocell-reinforced RAP
base section, two layers of geocells (10 cm high), infilled with RAP, were installed, and the RAP
covers on the bottom and upper geocells were 3 and 7 cm thick. In the 23 cm thick geocell-
reinforced RAP base section, one layer of 15 cm high geocell infilled with RAP was installed
with an 8 cm thick RAP cover. The total numbers of strain gauges fixed on the wall of the
geocell were six, six and 12 (six on each layer) for the 15 cm, 23 cm, and 30 cm thick RAP base
courses.
Page 61
45
The quantity of RAP placed in each lift was calculated by multiplying the volume of that
lift by the density of RAP. The RAP was compacted at the moisture content of 5.5%, which
corresponded to 95 % of the maximum dry density. The lift thickness depended on the base
thickness. The 15 cm thick unreinforced RAP base was compacted in two lifts (8 cm for the first
lift and 7 cm for the second lift). The 30 cm thick unreinforced RAP base was compacted in
three lifts (10 cm each lift). Both unreinforced base courses were compacted by the vibratory
plate compactor. For the 15 and 23 cm thick geocell-reinforced RAP base courses, the infill RAP
in one layer of geocell was placed and compacted by hand tamping using the Proctor hammer
and the RAP cover was compacted by the vibratory plate compactor. For the 30 cm thick
geocell-reinforced RAP base course, RAP was placed and compacted in four lifts, which
included the bottom 10 cm thick geocell-reinforced RAP layer, the 3 cm thick RAP cover, the
upper 10 cm thick geocell-reinforced RAP layer, and the 7 cm RAP. The infill RAP inside the
geocell was placed and compacted by hand tamping using the Proctor hammer and the RAP
cover was compacted by the vibratory plate compactor. The symbols, orientations, and locations
of strain gauges affixed on geocell wall are shown in figure 4.3.
Page 62
46
Figure 4.1 Plan view of the geocell layout in the large test box (from Pokharel 2011)
Figure 4.2 Geocell installed on the geotextile over the subgrade
Page 63
47
(a) 15 cm thick reinforced RAP section
(b) 23 cm thick reinforced RAP section
(c) 30 cm thick reinforced RAP section
Figure 4.3 Symbols, orientations, and locations of strain gauges
Geocell infilled
with RAP
GH1T
GV1
GH1B
GH2
GV2
GH3
1 2 3
Cyclic load Loading plate
Cyclic load Loading plate
3 cm RAP cover
Bottom Geocell
infilled with RAP
GH1T
GV1
GH1B
GH2
GV2
GH3
1 2 3
Top Geocell
infilled with RAP
GH1T
GV1
GH1B
GH2
GV2
GH3
1 2 3
Geocell infilled
with RAP
GH1T
GV1
GH1B
GH2
GV2
GH3
1 2 3
Cyclic load Loading plate
Page 64
48
The light weight deflectometer tests were carried out over the prepared RAP base course
at six different locations using three different loading plates as described in section 3.6.8. The
objective of this test was to determine the dynamic deformation modulus of the prepared base.
To obtain the CBR profile of the test section including the subgrade and the base course,
the dynamic cone penetration tests were carried out at four different locations. The tests were
carried out from the top of the RAP base down to the subgrade for at least 30 cm deep. The CBR
values of the prepared test sections were determined using equation 3.2.
4.1.3 Hot Mix Asphalt Surface
The prime coat was applied on the surface of the base course to create a proper bond
between the RAP base and the HMA concrete surface. The prime coat liquid was heated in the
oven and was applied on the surface of the RAP base. The second tell-tale was fixed on the top
of the base course as shown in figure 4.4. In addition, the pavement strain gauges were placed on
the top of the base course (i.e., at the bottom of the HMA surface to measure the strains
developed at the bottom of the HMA layer). The pavement strain gauges were covered by cold
mix asphalt and its wires were taken to the side of the test box through a small trench on the
surface of the RAP base, which was covered by the same RAP base material. This measure was
adopted to protect the pavement strain gauges from being damaged by the high-temperature
HMA during its placement. Figure 4.4 shows the pavement strain gauges on the top of the base
course.
Page 65
49
Figure 4.4 Prime coat on the RAP base with the tell-tale and pavement strain gauges
The HMA surface was placed on the top of the RAP base 24 hours after application of
the prime coat. The HMA was prepared by the nearby asphalt plant and transported to the
laboratory within 30 minutes. The thickness of the HMA surface after compaction by the
vibratory plate compactor was 5 cm, and the density was controlled by the volume and mass.
Figure 4.5 shows the compaction of the HMA surface on the large box. LWD tests were carried
out on the HMA surface 72 hours after its placement.
Page 66
50
Figure 4.5 Compaction of the HMA surface by the vibratory plate compactor
4.1.4 Test Setup
A reference beam was set up on the top of the large box and the profile of the HMA
surface was measured from the reference beam. Five displacement transducers were fixed on the
reference beam to measure the vertical displacements at different locations of the HMA surface
as well as the displacements of the two tell-tales. The tell-tales were run through the holes on the
loading plate and two small horizontal metal strips was fixed on the tell-tales for the
displacement transducers to sit on, as shown in figure 4.6. All of the cables of the pressure cells,
displacement transducers, strain gauges on the geocell, and pavement strain gauges were
connected to the DC-204R data recorders as mentioned in section 3.6.4. Some of the strain gauge
wires were connected to the manual data recorder in the case when the channels of the DC-204R
data recorders were not sufficient for all the data recordings.
Page 67
51
Figure 4.6 Setup of the tell-tales and the displacement transducers
4.2 Cyclic Plate Load Tests
Cyclic plate load tests were carried out using the MTS loading system with the MPT
software. The cyclic load started from the valley value of 0.5 kN to the peak value of 40 kN at
the frequency of 0.77 Hz.
Six cyclic plate load tests were conducted following the same testing procedure:
1. 15 cm thick unreinforced RAP base section
2. 15 cm thick geocell-reinforced RAP base section (harder subgrade)
3. 15 cm thick geocell-reinforced RAP base section
4. 23 cm thick geocell-reinforced RAP base section
5. 30 cm thick unreinforced RAP base section
6. 30 cm thick geocell-reinforced RAP base section.
Page 68
52
The subgrade CBR was maintained at approximately 5% in all tests except test number
two, in which the subgrade became harder due to the delay in the delivery of HMA.
The profile of the HMA surface after each test was measured from the same reference
beam. Figure 4.7 shows the deformation of the HMA surface under the loading plate after the
test. This figure also shows the two tell-tales extended above the HMA surface. To determine the
percent of air void in the HMA surface, samples were taken at different locations by the core
cutter as mentioned in section 3.8.
Figure 4.7 Surface deformation of HMA surface under the loading plate after the test
4.3 Test Results
4.3.1 Format of Presentation
The results from each test are presented in a tabular or graphical form, which include
CBR values from vane shear tests, average CBR values and CBR profiles from on DCP tests,
Page 69
53
dynamic deformation moduli from LWD tests, surface profiles before and after the tests, surface
permanent and elastic deformations at the center, permanent deformations of base and subgrade,
strains in geocell and pavement strain gauges, maximum vertical stresses at the interface between
subgrade and base, and stress distribution angles.
The applied load is distributed through the pavement structure to the subgrade. The stress
distribution angle method is a simple and approximate method to estimate the maximum stress at
the top of the subgrade. This method has been used by Giroud and Han (2004) to develop their
design method for geosynthetic-reinforced unpaved roads. The stress distribution angle from the
MA surface to the base course (α1) is generally higher than that from the base course to the
subgrade (α2) due to the higher modulus of the HMA surface as shown in figure 4.8. The earth
pressure cells at the interface between subgrade and RAP base measured the vertical stresses at
the bottom of the RAP base. The combined stress distribution angle (α) for the test section can be
calculated based on the vertical stress at the center as follows:
2)tan.( hrpP (4.1)
where,
P = applied load (40 kN);
p = vertical stress at the interface between subgrade and base course;
r = radius of the loading plate (15.2 cm in this study);
h = combined thickness of the HMA surface and RAP base;
α = combined stress distribution angle.
Page 70
54
Figure 4.8 Stress distribution through the pavement structure under an applied load
4.3.2 15 cm Thick Unreinforced RAP Base Section
The CBR profile of the test section obtained from the DCP tests is shown in figure 4.9.
The locations of the DCP tests, L1, L2, L3, and L4, were randomly distributed inside the test
box. The average CBR profile was obtained by averaging the CBR values from the four curves at
the same depth. The average CBR values of the subgrade and base estimated by the vane shear
tests and DCP tests are presented in table 4.1. The average CBR value of the subgrade obtained
from the vane shear tests was 4.9 %. Similarly, the average CBR values of the subgrade and the
RAP base obtained from the DCP tests were 5.7 % and 10.5 % respectively. The test results
indicated that the CBR value of the subgrade from the DCP tests is higher than that by the vane
shear tests.
Page 71
55
Figure 4.9 The CBR profiles obtained from the DCP tests for the 15 cm thick unreinforced RAP
base section
Table 4.1 The average CBR values of subgrade and base from the vane shear and DCP tests
Test method CBR value (%)
Subgrade at different locations Base
Vane shear test 1 2 3 4 5 Average
- 4.9 4.7 5.2 4.7 5 4.9
DCP test 5.7 10.5
0
5
10
15
20
25
30
35
40
45
50
0.00 5.00 10.00 15.00 20.00D
ep
th (
cm.)
CBR (%)
L1 L2
L3 L4
Average
Page 72
56
The calculated dynamic deformation moduli (Evd) of the subgrade, base and HMA
surface versus the size of the loading plate of the instrument from the LWD tests are shown in
figure 4.10. The test results show that the Evd values decreased from the HMA surface, the RAP
base to the subgrade.
Figure 4.10 The calculated dynamic deformation modulus versus the size of loading plate for the
15 cm thick unreinforced RAP base section
The profiles of the HMA surfaces as shown in figure 4.11 were measured from the
reference beam before and after the cyclic plate load test. It shows that a depression (equivalent
to rutting under traffic) developed under the loading plate and some heaving occurred away from
the loading plate after the test.
0
15
30
45
60
75
5 10 15 20 25 30 35
Dyn
amic
Mo
du
lus
(MN
/m2)
Size of loading plate (mm.)
Subgrade
Base
Surface
Page 73
57
Figure 4.11 Profiles of the HMA surface before and after the test for the 15 cm thick
unreinforced RAP base section
The permanent deformation was obtained after unloading of each cycle. Figure 4.12
presents the measured permanent deformations of the pavement at the surface, at the top of the
base, and at the top of the subgrade. The difference in the permanent deformations between the
HMA surface and the base is the compression of the HMA surface while that between the base
and the subgrade is the compression of the base course. At the end of the test, the permanent
deformation of the subgrade was approximately 50% of the total permanent deformation. The
surface deformations at different distances from the center were obtained by the displacement
transducers while the deformations at the top of the base and subgrade were obtained by the tell-
tales. It is shown that the surface permanent deformation was higher at the center and decreased
at the distances of 25, and 50 cm away from the center. The elastic deformation (i.e., the rebound
during the unloading of each cycle) as shown in figure 4.13 increased up to 40 cycles of loading
and then decreased slightly at a small rate until the end of the test. The elastic deformation was
much smaller than the permanent deformation and was less than 10% of the permanent
deformation at the end of the test.
10
14
18
22
26
30
-100 -80 -60 -40 -20 0 20 40 60 80 100
De
pth
(cm
.)
Distance from center (cm.)
Before test
AfterTest
Page 74
58
Figure 4.12 The permanent deformation versus the number of loading cycles for the 15 cm thick
unreinforced RAP base section
Figure 4.13 The elastic deformation versus the number of loading cycles for the 15 cm thick
unreinforced RAP base section
The strains at the bottom of the HMA surface were measured by the pavement strain
gauges at the center and 12.5 cm away from the center as shown in figure 4.14. In this research,
the strain is positive under tension and negative under compression. The bottom of the HMA
-10
0
10
20
30
40
50
0 50 100 150 200
Pe
rman
en
t d
efo
rmat
ion
(m
m.)
Number of loading cycle
Surface at center Surface at 25 cm
Surface at 50 cm Base
Subgrade
0
1
2
3
4
5
0 50 100 150 200
Elas
tic
de
form
atio
n (
mm
.)
Number of loading cycle
Page 75
59
surface at the center was under tension from the beginning up to 120 cycles and then became
under compression up to the end of the test even though the magnitude of the strain was small.
However, the tensile strain developed at the bottom of the HMA surface at the distance of 12.5
cm away from the center.
Figure 4.14 The strain at the bottom of the HMA surface versus the number of loading cycle for
the 15 cm thick unreinforced RAP base section
Figure 4.15 shows the measured vertical stresses at the interface between subgrade and
base at five locations (center, 12.5, 25, 50, and 75 cm away from the center) versus the number
of loading cycles. It is shown that the vertical stresses at the center or close to the center were
much higher than those away from the center. The vertical stress at the distance of 75 cm away
from the center was almost zero. As discussed earlier, the vertical stress at the center was used to
calculate the stress distribution angle. The stress distribution angle versus the number of loading
cycles is shown in figure 4.16. The stress distribution angle decreased with an increase of the
load cycle and remained almost the same after 50 loading cycles.
-0.001
0
0.001
0.002
0.003
0.004
0.005
0.006
0.007
0 50 100 150 200
Stra
in (
%)
Number of loading cycle
Center 12.5 cm
Page 76
60
Figure 4.15 The vertical stress at the interface between subgrade and base versus the number of
loading cycles for the 15 cm thick unreinforced RAP base section
Figure 4.16 The stress distribution angle versus the number of loading cycles for the 15 cm thick
unreinforced RAP base section
-20
0
20
40
60
80
100
120
140
160
0 50 100 150 200
Ve
rtic
al s
tre
ss (
kPa)
Number of loading cycle
Center 12.5 cm 25 cm
50 cm 75 cm
0
10
20
30
40
50
60
0 40 80 120 160 200
Stre
ss d
istr
ibu
tio
n a
ngl
e(°
)
Number of loading cycle
Page 77
61
4.3.3 15 cm Thick Geocell-Reinforced RAP Base Section (Hard Subgrade)
The CBR profile of the test section obtained from the DCP tests is shown in figure 4.17.
The locations of the DCP tests, L1, L2, L3, and L4, were randomly distributed inside the test
box. The average CBR profile was obtained by averaging the CBR values from the four curves at
the same depth. The average CBR values of the subgrade and base estimated by the vane shear
tests and DCP tests are presented in table 4.2. The average CBR value of the subgrade obtained
from the vane shear tests was 5.5 %. Similarly, the average CBR values of the subgrade and the
RAP base obtained from the DCP tests were 5.9 % and 10.2 % respectively. The test results
indicated that the CBR value of the subgrade from the DCP tests is higher than that by the vane
shear tests.
Figure 4.17 CBR profile obtained from the DCP tests for the 15 cm thick geocell-reinforced
RAP base section before the test (hard subgrade)
0
10
20
30
40
50
60
0 5 10 15
De
pth
(cm
.)
CBR(%)
L1L2L3L4Average
Page 78
62
Table 4.2 The average CBR values of subgrade and base from the vane shear and DCP tests
Test method CBR Value (%)
Subgrade at different locations Base Layer
Vane Shear Test 1 2 3 4 5 Average
- 5.9 5.6 5.4 5 5.4 5.5
DCP Test (before) 5.9 10.2
DCP Test (after) 9 13.8
The scheduled placement of the HMA surface over the RAP base was 24 hours after the
preparation of the base course. In this test, however, there was a long delay (seven days of the
preparation of RAP base) in the delivery of the HMA from the local asphalt plant. The actual
CBR values of the test section were re-evaluated after the cyclic plate load test and removal of
the HMA surface. Figure 4.18 shows the CBR profiles from the DCP tests after the cyclic plate
load test. The average CBR values of the subgrade and RAP base were 9.0 % and 13.8 %
respectively, which are higher than those determined at seven days earlier. The increase of the
CBR values resulted from the loss of moisture in the RAP base and the subgrade during the 7-
day waiting period. The harder subgrade and base course resulted in a much stronger response of
this test section, which will be discussed later. This test was repeated and the repeated test based
on the original design will be discussed in section 4.3.4.
The calculated dynamic deformation moduli (Evd) of the subgrade, base and HMA
surface versus the size of the loading plate of the instrument from the LWD tests are shown in
figure 4.19. The test results show that the Evd values decreased from the HMA surface, the RAP
base to the subgrade.
Page 79
63
Figure 4.18 CBR profile obtained from the DCP tests for the 15 cm thick geocell-reinforced
RAP base section after the test (hard subgrade)
0
10
20
30
40
50
60
0 5 10 15 20D
ep
th (
cm.)
CBR (%)
L1 L3
L5 L7
Average
Page 80
64
Figure 4.19 The calculated dynamic deformation modulus versus the size of loading plate for the
15 cm thick geocell-reinforced RAP base section (hard subgrade)
The profiles of the HMA surfaces as shown in figure 4.20 were measured from the
reference beam before and after the cyclic plate load test. It shows that a depression (equivalent
to rutting under traffic) developed under the loading plate and some heaving occurred away from
the loading plate after the test.
Figure 4.20 Profiles of the HMA surface before and after the test for the 15 cm thick geocell-
reinforced RAP base section (hard subgrade)
0
50
100
150
200
250
5 10 15 20 25 30 35
Dyn
amic
Mo
du
lus
(MN
/m2 )
Size of loading plate (mm.)
Subgrade Layer
Base Layer
HMA Layer
10
12
14
16
18
20
-100 -80 -60 -40 -20 0 20 40 60 80 100
De
pth
(cm
.)
Distance from center (cm.)
Before Test
After Test
Page 81
65
The permanent deformation was obtained after unloading of each cycle. Figure 4.21
presents the measured permanent deformations of the pavement at the surface, at the top of the
base, and at the top of the subgrade. The surface deformations at different distances from the
center were obtained by the displacement transducers. It is shown that the surface permanent
deformation was higher at the center and decreased with the distances of 25 and 50 cm away
from the center. The elastic deformation (i.e., the rebound during the unloading of each cycle)
was higher at the beginning of loading and then decreased slightly at a small rate until the end of
the test as shown in figure 4.22. The elastic deformation was much smaller than the permanent
deformation and was less than 10% of the permanent deformation at the end of the test.
Figure 4.21 The permanent deformation versus the number of loading cycles for the 15 cm thick
geocell-reinforced RAP base section (hard subgrade)
-5
0
5
10
15
20
25
30
0 2000 4000 6000 8000 10000 12000 14000 16000
Pe
rman
en
t d
efo
rmat
ion
(m
m.)
Number of loading cycle
Surface at center Surface at 25 cm
Surface at 50 cm Surface at 75 cm
Page 82
66
Figure 4.22 The elastic deformation versus the number of loading cycles for the 15 cm thick
geocell-reinforced RAP base section (hard subgrade)
Figure 4.23 shows the measured maximum strains on the geocell wall at different
locations during the cyclic plate load test. The symbols, orientations, and locations of strain
gauges affixed on geocell wall are shown in figure 4.3. The maximum strains were recorded
manually during the test. It is shown that the tensile strains developed at all of the top gauges
while the compressive strains occurred at the middle gauges. The higher strains occurred at the
central geocell under the loading plate. The strain at the bottom of the central geocell could not
measure as it broke down during construction of base layer.
The strains at the bottom of the HMA surface were measured by the pavement strain
gauges at distances of 0, 12.5, 25, 50, and 75 cm away from the center as shown in figure 4.24.
In this research, the strain is positive under tension and negative at compression. The bottom of
the HMA surface at the distances of 0, 12.5, 50, and 75 cm away from the center was under
tension and that at the distance of 25 cm from the center was under compression up to the end of
the test.
0
1
2
3
0 2000 4000 6000 8000 10000 12000 14000 16000
Elas
tic
de
form
atio
n (
mm
.)
Number of loading Cycle
Page 83
67
Figure 4.23 The measured strains on the geocell wall in different locations for the 15 cm thick
geocell-reinforced RAP base section (hard subgrade)
Figure 4.24 The strain at the bottom of the HMA surface versus the number of loading cycles for
the 15 cm thick geocell-reinforced RAP base section (hard subgrade)
Figure 4.25 shows the measured vertical stresses at the interface between subgrade and
base at five locations (0, 12.5, 25, 50, and 75 cm away from the center) versus the number of
loading cycles. It is shown that vertical stress was higher at a distance of 12.5 cm than that at the
center and decreased with the distances of 25 and 50 cm away from the center. The vertical stress
-0.5
-0.4
-0.3
-0.2
-0.1
0
0.1
0.2
0.3
0 2000 4000 6000 8000 10000 12000 14000 16000
Stra
in o
n g
eo
cell
(%)
Number of loading cycle
GH1T GH2 GH3
GV1 GV2
-0.02
-0.01
0
0.01
0.02
0.03
0.04
0.05
0 2000 4000 6000 8000 10000 12000 14000 16000
Stra
in (
%)
Number of loading cycle
Center 12.5 cm
25 cm 50 cm
75 cm
Page 84
68
at the distance of 75 cm away from the center was almost zero. As discussed earlier, the vertical
stress at the center was used to calculate the stress distribution angle. The stress distribution
angle versus the number of loading cycle is shown in figure 4.26. The stress distribution angle
decreased with an increase of the load cycle in a small rate up to the end of the test.
Figure 4.25 The vertical stress at the interface between subgrade and base versus the number of
loading cycles for the 15 cm thick geocell-reinforced RAP base section (hard subgrade)
-20
20
60
100
140
180
0 2000 4000 6000 8000 10000 12000 14000 16000
Ve
rtic
al s
tre
ss (
kPa)
Number of loading cycle
Center 12.5 cm 25 cm 50 cm 75 cm
Page 85
69
Figure 4.26 The stress distribution angle versus the number of loading cycles for the 15 cm thick
geocell-reinforced RAP base section (hard subgrade)
4.3.4 15 cm Thick Geocell-Reinforced RAP Base Section
The CBR profile of the test section obtained from the DCP tests is shown in figure 4.27.
The locations of the DCP tests, L1, L2, L3, and L4, were randomly distributed inside the test
box. The average CBR profile was obtained by averaging the CBR values from the four curves at
the same depth. The average CBR values of the subgrade and base estimated by the vane shear
tests and DCP tests are presented in table 4.3. The average CBR value of the subgrade obtained
from the vane shear tests was 5.1 %. Similarly, the average CBR values of the subgrade and the
RAP base obtained from the DCP tests were 5.7 % and 10.9 % respectively. The test results
indicated that the CBR value of the subgrade from the DCP tests was higher than that by the
vane shear tests.
0
10
20
30
40
50
0 3000 6000 9000 12000 15000
Stre
ss d
istr
ibu
tio
n a
ngl
e (
°)
Number of loading cycle
Page 86
70
Figure 4.27 CBR profile obtained from the DCP tests for the 15 cm thick geocell-reinforced
RAP base section before the plate load test
Table 4.3 The average CBR values of subgrade and base from the vane shear and DCP tests
Test method
CBR Value (%)
Subgrade at different locations Base
Layer
Vane Shear Test 1 2 3 4 5 Average
- 5.9 5 5 5.1 4.8 5.1
DCP Test 5.7 10.9
The calculated dynamic deformation moduli (Evd) of the subgrade, base, and HMA
surface versus the size of the loading plate of the instrument from the LWD tests are shown in
figure 4.28. The test results show that the Evd values decreased from the HMA surface, the RAP
base to the subgrade.
0
10
20
30
40
50
60
0 5 10 15D
ep
th (
cm.)
CBR(%)
L1 L2
L3 L4
Average
Page 87
71
Figure 4.28 The calculated dynamic deformation modulus versus the size of loading plate for the
15 cm thick geocell-reinforced RAP base section
The profiles of the HMA surfaces as shown in figure 4.29 were measured from the
reference beam before and after the cyclic plate load test. It shows that a depression (equivalent
to rutting under traffic) developed under the loading plate and some heaving occurred away from
the loading plate after the test.
Figure 4.29 Profiles of the HMA surface before and after the test for the 15 cm thick geocell-
reinforced RAP base section
0
40
80
120
5 10 15 20 25 30 35
Dyn
amic
Mo
du
lus
(MN
/m2)
Size of loading plate (mm.)
Subgrade Layer
Base Layer
HMA Layer
10
12
14
16
18
20
-100 -80 -60 -40 -20 0 20 40 60 80 100
De
pth
(cm
.)
Distance from center (cm.)
Before Test
After Test
Page 88
72
The permanent deformation was obtained after unloading of each cycle. Figure 4.30
presents the measured permanent deformations of the pavement at the surface, at the top of the
base, and at the top of the subgrade. The difference in the permanent deformations between the
HMA surface and the base is the compression of the HMA surface while that between the base
and the subgrade is the compression of the base course. The surface deformations at different
distances from the center were obtained by the displacement transducers. It is shown that the
surface permanent deformation was higher at the center and decreased with the distances of 25
and 50 cm away from the center. The elastic deformation (i.e., the rebound during the unloading
of each cycle) was higher at the beginning of loading and then decreased slightly at a small rate
until the end of the test as shown in figure 4.31. The elastic deformation was much smaller than
the permanent deformation and was less than 10% of the permanent deformation at the end of the
test.
Figure 4.30 The permanent deformation versus the number of loading cycles for the 15 cm thick
geocell-reinforced RAP base section
-5
0
5
10
15
20
25
30
35
40
45
0 1000 2000 3000 4000 5000 6000
Pe
rman
en
t d
efo
rmat
ion
(m
m.)
Number of loading cycle
Surface at center Surface at 25 cm
Surface at 50 cm Base
Subgrade
Page 89
73
Figure 4.31 The elastic deformation versus the number of loading cycles for the 15 cm thick
geocell-reinforced RAP base section
Figure 4.32 shows the measured maximum strains on the geocell wall at different
locations during the cyclic plate load test. The symbols, orientations, and locations of strain
gauges affixed on geocell wall are shown in figure 4.3. The maximum strains were recorded
manually during the test. It is shown that the tensile strains developed at all of the top gauges
while the compressive strains occurred at the middle gauges. The strains at the bottom gauge of
the central geocell and top gauge of the third geocell were not measured because the gauges
broke during the construction of the base layer.
0
0.5
1
1.5
2
2.5
3
0 1000 2000 3000 4000 5000 6000
Elas
tic
de
form
atio
n (
mm
.)
Number of loading cycle
Page 90
74
Figure 4.32 The measured strains on the geocell wall in different locations for the 15 cm thick
geocell-reinforced RAP base section
The strains at the bottom of the HMA surface were measured by the pavement strain
gauges at distances of 0, 12.5, 25, 50, and 75 cm away from the center as shown in figure 4.33.
The bottom of the HMA surface at distances of 0 and 25 cm from the center were under tension
while those at distances of 50 and 75 cm from the center were under compression up to the end
of the test. However, the strain at the distance of 12.5 cm from the center was compression up to
2,200 cycles and then changed to tension up to the end of the test.
-0.8
-0.6
-0.4
-0.2
0
0.2
0.4
0.6
0 1000 2000 3000 4000 5000 6000
Stra
in o
n g
eo
cell
(%
)
Number of loading cycle
GH1T GH2 GV1 GV2
Page 91
75
Figure 4.33 The strain at the bottom of the HMA surface versus the number of loading cycles for
the 15 cm thick geocell-reinforced RAP base section
Figure 4.34 shows the measured vertical stresses at the interface between subgrade and
base at five locations (0, 12.5, 25, 50, and 75 cm away from the center) versus the number of
loading cycles. It is shown that vertical stresses at the center or close to the center were much
higher than those away from the center. The vertical stress at the distance of 75 cm away from
the center was almost zero. As discussed earlier, the vertical stress at the center was used to
calculate the stress distribution angle. The stress distribution angle versus the number of loading
cycle is shown in figure 4.35. The stress distribution angle decreased with an increase of the load
cycle in a small rate up to the end of the test.
-0.15
-0.1
-0.05
0
0.05
0.1
0.15
0 1000 2000 3000 4000 5000 6000
Stra
in (
%)
Number of loading cycle
Center 12.5 cm 25 cm
50 cm 75 cm
Page 92
76
Figure 4.34 The vertical stress at the interface between subgrade and base versus the number of
loading cycles for the 15 cm thick geocell-reinforced RAP base section
Figure 4.35 The stress distribution angle versus the number of loading cycles for 15 cm thick
geocell-reinforced RAP base section
-20
20
60
100
140
180
0 1000 2000 3000 4000 5000 6000
Ve
rtic
al s
tre
ss (
kPa)
Number of loading cycle
Center 12.5 cm
25 cm 50 cm
75 cm
0
20
40
60
80
0 1000 2000 3000 4000 5000 6000
Stre
ss d
istr
ibu
tio
n a
ngl
e (
°)
Number of loading cycle
Page 93
77
4.3.5 23 cm Thick Geocell-Reinforced RAP Base Section
The CBR profile of the test section obtained from the DCP tests is shown in figure 4.36.
The locations of the DCP tests, L1, L2, L3, and L4, were randomly distributed inside the test
box. The average CBR profile was obtained by averaging the CBR values from the four curves at
the same depth. The average CBR values of the subgrade and base estimated by the vane shear
tests and DCP tests are presented in table 4.4. The average CBR value of the subgrade obtained
from the vane shear tests was 5.1 %. Similarly, the average CBR values of the subgrade and the
RAP base obtained from the DCP tests were 5.9 % and 10.7 % respectively. The test results
indicated that the CBR value of the subgrade from the DCP tests was higher than that by the
vane shear tests.
Figure 4.36 CBR profile obtained from the DCP tests for the 23 cm thick geocell-reinforced
RAP base section before the plate load test
0
10
20
30
40
50
60
0 5 10 15
De
pth
(cm
.)
CBR(%)
L1 L2
L3 L4
Average
Page 94
78
Table 4.4 The average CBR values of subgrade and base from the vane shear and DCP tests
Test method CBR Value (%)
Subgrade at different locations Base Layer
Vane Shear Test 1 2 3 4 5 Average
- 5.1 4.6 5.1 5.7 5.3 5.1
DCP Test 5.9 10.7
The calculated dynamic deformation moduli (Evd) of the subgrade, base, and HMA
surface versus the size of the loading plate of the instrument from the LWD tests result are
shown in figure 4.37. The test results show that the Evd values decreased from the HMA surface,
the RAP base to the subgrade.
Figure 4.37 The calculated dynamic deformation modulus versus the size of loading plate for the
23 cm thick geocell-reinforced RAP base section
0
20
40
60
80
100
5 10 15 20 25 30 35
Dyn
amic
Mo
du
lus
(MN
/m2 )
Size of loading plate (mm.)
Subgrade Layer
Base Layer
HMA Layer
Page 95
79
The profiles of the HMA surfaces as shown in figure 4.38 were measured from the
reference beam before and after the cyclic plate load test. It shows that a depression (equivalent
to rutting under traffic) developed under the loading plate and some heaving occurred away from
the loading plate after the test.
Figure 4.38 Profiles of the HMA surface before and after the test for the 23 cm thick geocell-
reinforced RAP base section
The permanent deformation was obtained after unloading of each cycle. Figure 4.39
presents the measured permanent deformations of the pavement at the surface, at the top of the
base, and at the top of the subgrade. The difference in the permanent deformations between the
HMA surface and the base is the compression of the HMA surface while that between the base
and the subgrade is the compression of the base course. The surface deformations at different
distances from the center were obtained by the displacement transducers. It is shown that the
surface permanent deformation was higher at the center and decreased with the distances of 25,
and 50 cm away from the center. The elastic deformation was higher at the beginning of loading
and then decreased slightly at a small rate until the end of the test as shown in figure 4.40. The
7
10
13
16
-100 -80 -60 -40 -20 0 20 40 60 80 100
De
pth
(cm
.)
Distance from center (cm.)
Before Test
After Test
Page 96
80
elastic deformation was much smaller than the permanent deformation and was less than 10% of
the permanent deformation at the end of the test.
Figure 4.39 The permanent deformation versus the number of loading cycles for the 23 cm thick
geocell-reinforced RAP base section
Figure 4.40 The elastic deformation versus the number of loading cycles for the 23 cm thick
geocell-reinforced RAP base section
-5
0
5
10
15
20
25
30
35
40
45
0 2000 4000 6000 8000 10000 12000 14000
Pe
rman
en
tt d
efo
rmat
ion
(m
m.)
Number of loading cycle (no.)
Surface at center Surface at 25 cm
surface at 50 cm Base
Subgrade
0
1
2
3
0 2000 4000 6000 8000 10000 12000 14000
Elas
tic
de
form
atio
n (
mm
.)
Number of loading cycle
Page 97
81
Figure 4.41 shows the measured maximum strains on the geocell wall at different
locations during the cyclic plate load test. The symbols, orientations, and locations of strain
gauges affixed on geocell wall are shown in figure 4.3. The maximum strains were recorded
manually during the test. It is shown that the tensile strains developed at gauges GH1B, GH2,
and GH3 while the compressive strains occurred at GH1T and GV1 respectively. Compressive
strain developed at the beginning up to 3000 cycles and changed to tensile strain at GV2 up to
the end of the test.
Figure 4.41 The measured strains on the geocell wall in different locations for the 23 cm thick
geocell-reinforced RAP base section
The strains at the bottom of the HMA surface were measured by the pavement strain
gauges at distances of 0, 12.5, 25, 50, and 75 cm away from the center as shown in figure 4.42.
The bottom of the HMA surface at distances of 0 and 25 cm from the center were under tension
while the gauges at distances of 50 and 75 cm from the center were under compression up to the
end of the test. However, the strain at a distance of 12.5 cm from the center was tension up to
3,400 cycles and changed to compression up to the end of the test.
-1.5
-1
-0.5
0
0.5
1
1.5
2
0 2000 4000 6000 8000 10000 12000 14000
Stra
in o
n g
eo
cell
(%)
Number of loading cycle
GH1T GH2 GH3
GV1 GV2 GH1B
Page 98
82
Figure 4.42 The strain at the bottom of the HMA surface versus the number of loading cycles for
the 23 cm thick geocell-reinforced RAP base section
Figure 4.43 shows the measured vertical stresses at the interface between subgrade and
base at five locations (0, 12.5, 25, 50, and 75 cm away from the center) versus the number of
loading cycles. It is shown that vertical stress was higher at a distance of 12.5 cm than at the
center and decrease with the distances of 25 and 50 cm away from the center. The vertical stress
at the distance of 75 cm away from the center was almost zero. As discussed earlier, the vertical
stress at the center was used to calculate the stress distribution angle. The stress distribution
angle versus the number of loading cycle is shown in figure 4.44. The stress distribution angle
decreased with an increase of the load cycle in a small rate up to the end of the test.
-0.07
-0.06
-0.05
-0.04
-0.03
-0.02
-0.01
0
0.01
0.02
0.03
0 2000 4000 6000 8000 10000 12000 14000
Stra
in (
%)
Number of loading cycle
Center 12.5 cm
25 cm 50 cm
75 cm
Page 99
83
Figure 4.43 The vertical stress at the interface between subgrade and base versus the number of
loading cycles for the 23 cm thick geocell-reinforced RAP base section
Figure 4.44 The stress distribution angle versus the number of loading cycles for 23 cm thick
geocell-reinforced RAP base section
-50
0
50
100
150
200
250
0 2000 4000 6000 8000 10000 12000 14000
Ve
rtic
al s
tre
ss (
kPa)
Number of loading cycle
Centre 12.5 cm 25 cm 50 cm 75 cm
0
10
20
30
40
50
60
70
0 2000 4000 6000 8000 10000 12000 14000
Stre
ss d
istr
ibu
tio
n a
ngl
e (
°)
Number of loading cycle
Page 100
84
4.3.6 30 cm Thick Unreinforced RAP Base Section
The CBR profile of the test section obtained from the DCP tests is shown in figure 4.45.
The locations of the DCP tests, L1, L2, L3, and L4, were randomly distributed inside the test
box. The average CBR profile was obtained by averaging the CBR values from the four curves at
the same depth. The average CBR values of the subgrade and base estimated by the vane shear
tests and DCP tests are presented in table 4.5. The average CBR value of the subgrade obtained
from the vane shear tests was 5.1 %. Similarly, the average CBR values of the subgrade and the
RAP base obtained from the DCP tests were 5.6 % and 9.9 % respectively. The test results
indicated that the CBR value of the subgrade from the DCP tests is higher than that by the vane
shear tests.
Figure 4.45 The CBR profiles obtained from the DCP tests for the 30 cm thick unreinforced
RAP base section
0
10
20
30
40
50
60
0 5 10 15
De
pth
(cm
.)
CBR(%)
L1 L2
L3 L4
Average
Page 101
85
Table 4.5 The average CBR values of subgrade and base from the vane shear and DCP tests
Test method CBR Value (%)
Subgrade at different locations Base Layer
Vane Shear Test 1 2 3 4 5 Average
- 5.1 5.1 5.7 4.6 5.3 5.1
DCP Test 5.6 9.9
The calculated dynamic deformation moduli (Evd) of the subgrade, base, and HMA
surface versus the size of the loading plate of the instrument from the LWD tests result are
shown in figure 4.46. The test results show that the Evd values decreased from the HMA surface,
the RAP base to the subgrade.
Figure 4.46 The calculated dynamic deformation modulus versus the size of loading plate for the
30 cm thick unreinforced RAP base section
0
40
80
120
160
5 10 15 20 25 30 35
Dyn
amic
Mo
du
lus
(MN
/m2)
Size of loading plate (mm.)
Subgrade Layer
Base Layer
HMA Layer
Page 102
86
The profiles of the HMA surfaces as shown in figure 4.47 were measured from the
reference beam before and after the cyclic plate load test. It shows that a depression (equivalent
to rutting under traffic) developed under the loading plate and some heaving occurred away from
the loading plate after the test.
Figure 4.47 Profiles of the HMA surface before and after the test for the 30 cm thick
unreinforced RAP base section
The permanent deformation was obtained after unloading of each cycle. Figure 4.48
presents the measured permanent deformations of the pavement at the surface, at the top of the
base, and at the top of the subgrade. The difference in the permanent deformations between the
HMA surface and the base is the compression of the HMA surface while that between the base
and the subgrade is the compression of the base course. At the end of the test, the permanent
deformation of the subgrade was approximately 50% of the total permanent deformation. The
surface deformations at different distances from the center were obtained by the displacement
transducers while the deformations at the top of the base and subgrade were obtained by the tell
tales. It is shown that the surface permanent deformation was higher at the center and decreased
8
10
12
14
16
18
-100 -80 -60 -40 -20 0 20 40 60 80 100
De
pth
(cm
.)
Distance from center (cm.)
Before Test
After Test
Page 103
87
at the distances of 25 and 50 cm away from the center. The elastic deformation (i.e., the rebound
during the unloading of each cycle) as shown in figure 4.49 increased up to 200 cycles of loading
and then decreased slightly at a small rate until the end of the test. The elastic deformation was
much smaller than the permanent deformation and was less than 10% of the permanent
deformation at the end of the test.
Figure 4.48 The permanent deformation versus the number of loading cycle for the 30 cm thick
unreinforced RAP base section
-10
0
10
20
30
40
50
0 1000 2000 3000 4000 5000
Pe
rman
en
t d
efo
rmat
ion
(m
m.)
Number of loading cycle
Surface at center surface at 25 cm
Surface at 50 cm Base
Subgrade
Page 104
88
Figure 4.49 The elastic deformation versus the number of loading cycle for the 30 cm thick
unreinforced RAP base section
The strains at the bottom of the HMA surface were measured by the pavement strain
gauges at the center and 12.5 cm away from the center as shown in figure 4.50. The bottom of
the HMA surface at the center was under compression from the beginning up to 3,200 cycles and
then became under tension up to the end of the test even though the magnitude of the strain was
small. However, the tensile strain developed at the bottom of the HMA surface at the distance of
12.5 cm away from the center.
0
1
2
3
4
5
0 1000 2000 3000 4000 5000
Elas
tic
de
form
atio
n (
mm
.)
Number of loading cycle
Page 105
89
Figure 4.50 The strain at the bottom of the HMA surface versus the number of loading cycle for
the 30 cm thick unreinforced RAP base section
Figure 4.51 shows the measured vertical stresses at the interface between subgrade and
base at five locations (0, 12.5, 25, 50, and 75 cm away from the center) versus the number of
loading cycles. It is shown that the vertical stresses at the center or close to the center were much
higher than those away from the center. The vertical stress at the distance of 75 cm away from
the center was almost zero. As discussed earlier, the vertical stress at the center was used to
calculate the stress distribution angle. The stress distribution angle versus the number of loading
cycle is shown in figure 4.52. The stress distribution angle decreased with an increase of the load
cycle and remained almost the same after 50 loading cycles.
-0.002
0
0.002
0.004
0.006
0.008
0.01
0.012
0.014
0 1000 2000 3000 4000 5000
Stra
in (
%)
Number of loading cycle
Center
12.5 cm
Page 106
90
Figure 4.51 The vertical stress at the interface between subgrade and base versus the number of
loading cycle for the 30 cm thick unreinforced RAP base section
Figure 4.52 The stress distribution angle versus the number of loading cycle for the 30 cm thick
unreinforced RAP base section
-50
0
50
100
150
200
250
0 1000 2000 3000 4000 5000
Ve
rtic
lal s
tre
ss (
kPa)
Number of loding cycle
Center 12.5 cm 25 cm
50 cm 75 cm
0
10
20
30
40
0 1000 2000 3000 4000 5000
Stre
ss d
istr
ibu
tio
n a
ngl
e (
°)
Number of loading cycle
Page 107
91
4.3.7 30 cm Thick Geocell-Reinforced RAP Base Section
The CBR profile of the test section obtained from the DCP tests is shown in figure 4.53.
The locations of the DCP tests, L1, L2, L3, and L4, were randomly distributed inside the test
box. The average CBR profile was obtained by averaging the CBR values from the four curves at
the same depth. The average CBR values of the subgrade and base estimated by the vane shear
tests and DCP tests are presented in table 4.6. The average CBR value of the subgrade obtained
from the vane shear tests was 5.3 %. Similarly, the average CBR values of the subgrade and the
RAP base obtained from the DCP tests were 6.1 % and 8.9 % respectively. The test results
indicated that the CBR value of the subgrade from the DCP tests was higher than that by the
vane shear tests.
Figure 4.53 CBR profiles obtained from DCP tests for 30 cm thick geocell-reinforced RAP
base section before plate load test
0
10
20
30
40
50
60
0.00 5.00 10.00 15.00
De
pth
(cm
.)
CBR (%)
L1 L2
L3 L4
Average
Page 108
92
Table 4.6 The average CBR values of subgrade and base from the vane shear and DCP tests
Test method
CBR Value (%)
Subgrade at different locations Base
Layer
Vane Shear Test 1 2 3 4 5 Average
- 5.4 5.6 4.8 5.1 5.5 5.3
DCP Test 6.1 8.9
The calculated dynamic deformation moduli (Evd) of the subgrade, base, and HMA
surface versus the size of the loading plate of the instrument from the LWD tests result are
shown in figure 4.54. The test results show that the Evd values decreased from the HMA surface,
the RAP base to the subgrade.
Figure 4.54 The calculated dynamic deformation modulus versus the size of loading plate for the
30 cm thick geocell-reinforced RAP base section
0
40
80
120
5 10 15 20 25 30 35
Dyn
amic
Mo
du
lus
(MN
/m2 )
Size of loading plate (mm.)
Subgrade Layer
Base Layer
HMA Layer
Page 109
93
The profiles of the HMA surfaces as shown in figure 4.55 were measured from the
reference beam before and after the cyclic plate load test. It shows that a depression (equivalent
to rutting under traffic) developed under the loading plate and some heaving occurred away from
the loading plate after the test.
Figure 4.55 Profiles of the HMA surface before and after the test for the 30 cm thick geocell-
reinforced RAP base section
The permanent deformation was obtained after unloading of each cycle. Figure 4.56
presents the measured permanent deformations of the pavement at the surface, at the top of the
base, and at the top of the subgrade. The surface deformations at different distances from the
center were obtained by the displacement transducers. It is shown that the surface permanent
deformation was higher at the center and decreased with the distances of 2, 50, and 75 cm away
from the center. However, the permanent deformation at 50 and 75 cm away from center were
very lower than center. The elastic deformation (i.e., the rebound during the unloading of each
cycle) was higher at the beginning of loading and then decreased slightly at a small rate until the
0
1
2
3
4
5
6
-100 -80 -60 -40 -20 0 20 40 60 80 100
De
pth
(cm
.)
Distance from center (cm.)
Before Test
After Test
Page 110
94
end of the test as shown in figure 4.57. The elastic deformation was much smaller than the
permanent deformation and was less than 10% of the permanent deformation at the end of the
test.
Figure 4.56 The permanent deformation versus the number of loading cycle for the 30 cm thick
geocell-reinforced RAP base section
Figure 4.57 The elastic deformation versus the number of loading cycle for the 30 cm thick
geocell-reinforced RAP base section
-5
0
5
10
15
20
25
30
0 2000 4000 6000 8000 10000
Pe
rman
en
t d
efo
rmat
ion
(m
m.)
Number of liading cycle
Surface at center Surface at 25 cm
Surface at 50 cm Surface at 75 cm
0
1
2
3
4
5
0 2000 4000 6000 8000 10000
Elas
tic
de
form
atio
n (
mm
.)
Number of loading cycle
Page 111
95
Figures 4.58 and 4.59 show the measured maximum strains on the top geocell and bottom
geocell wall at different locations during the cyclic plate load test. The symbols, orientations, and
locations of strain gauges affixed on geocell wall are shown in figure 4.3. The maximum strains
were recorded manually during the test. For the top geocell, it is shown that the tensile strains
developed at all of horizontal strain gauges GH1T, GH2, and GH3 while the compressive strains
occurred at strain gauges GV1 and GV2 respectively. The strain gauge GH1B of the top geocell
was broken during the preparation of the RAP base. For the bottom geocell, it is shown that the
tensile strains developed at all of horizontal strain gauges GH1T, GH2, and GH3 while the
compressive strains occurred at strain gauges GV1 and GV2 respectively. Compressive strain
with a very small magnitude developed in the strain gauge GH1B in the bottom geocell.
Figure 4.58 The measured strains on the geocell wall in different locations for the 30 cm thick
geocell-reinforced RAP base section (top geocell)
-1
-0.8
-0.6
-0.4
-0.2
0
0.2
0.4
0.6
0 2000 4000 6000 8000 10000
Str
ain
on
ge
oce
ll (%
)
Number of loading cycle
GH1T GH2 GH3
GV1 GV2
Page 112
96
Figure 4.59 The measured strains on the geocell wall in different locations for the 30 cm thick
geocell-reinforced RAP base section (bottom geocell)
The strains at the bottom of the HMA surface were measured by the pavement strain
gauges at distances of 0, 12.5, 25, 50, and 75 cm away from the center as shown in figure 4.60.
The bottom of the HMA surface at the distances of 0, 12.5, 25, and 75 cm from the center was
under compression. The bottom of the HMA surface at the distance of 50 cm from the center was
under tension up to 1,800 cycles and changed to compression up to the end of the test.
-0.4
-0.2
0
0.2
0.4
0.6
0.8
0 2000 4000 6000 8000 10000
Stra
in o
n g
eo
cell
(%)
Number of loading cycle
GH1T GH2 GH3
GV1 GV2 GH1B
Page 113
97
Figure 4.60 The strain at the bottom of the HMA surface versus the number of loading cycles for
the 30 cm thick geocell-reinforced RAP base section
Figure 4.61 shows the measured vertical stresses at the interface between subgrade and
base at five locations (0, 12.5, 25, 50, and 75 cm away from the center) versus the number of
loading cycles. It is shown that the vertical stress at the center or close to the center was much
higher than those away from the center. The vertical stress at the distance of 75 cm away from
the center was negative indicated heave at that location. As discussed earlier, the vertical stress at
the center was used to calculate the stress distribution angle. The stress distribution angle versus
the number of loading cycle is shown in figure 4.62. The stress distribution angle decreased with
an increase of the load cycle in a small rate up to the end of the test.
-0.14
-0.12
-0.1
-0.08
-0.06
-0.04
-0.02
0
0.02
0.04
0 2000 4000 6000 8000 10000
Stra
in (
%)
Number of loading cycle
Center 12.5 cm
25 cm 50 cm
75 cm
Page 114
98
Figure 4.61 The vertical stress at the interface between subgrade and base versus the number of
loading cycles for the 30 cm thick geocell-reinforced RAP base section
Figure 4.62 The stress distribution angle versus the number of loading cycles for 30 cm thick
geocell-reinforced RAP base section
-20
0
20
40
60
80
100
0 2000 4000 6000 8000 10000
Ve
rtic
al s
tre
ss (
kPa)
Number of loading cycle
Center 12.5 cm25 cm 50 cm75 cm
0
10
20
30
40
50
60
0 2000 4000 6000 8000 10000
Stre
ss d
istr
ibu
tio
n a
ngl
e (
°)
Number of loading cycle
Page 115
99
4.4 Analysis of Test Data
Six cyclic plate load tests were conducted following the same construction (except the
test section with the harder subgrade) and testing procedures on unreinforced and geocell-
reinforced pavements with RAP bases in the large geotechnical testing box. The test data for all
the experiments are analyzed together in this section in terms of subgrade and base CBR values,
dynamic deformation moduli, percent of air voids of the HMA surface, permanent deformations,
elastic deformations, strains at the bottom of the HMA, and strains on the geocells, vertical
stresses at the interface between subgrade and RAP base, and stress distribution angles.
4.4.1 CBR Values of Subgrade and Base Course
Figure 4.63 presents the average CBR profiles of all six test sections from the DCP tests
in the subgrade and the bases. It is shown that all the test sections had consistent average CBR
profiles except the 15 cm thick geocell-reinforced RAP base section with the hard subgrade as
discussed earlier.
The test results in table 4.7 indicate that the average CBR values of the subgrade obtained
from the DCP tests were higher than those obtained from the vane shear tests. The reasons for
the higher CBR results from the DCP tests were additional compaction of the subgrade during
the preparation of RAP bases and the DCP tests performed at 24 hours after the preparation of
the base layer.
Page 116
100
Figure 4.63 The average CBR profiles obtained from the DCP tests
0
10
20
30
40
50
60
0 5 10 15 20
De
pth
(cm
.)
Average CBR (%)
15 cm Unreinforced
15 cm Reinforced hardsubgrade( before test)
15 cm Reinforced hardsubgrade (after test)
23 cm Reinforced
30 cm Unireinforced
30 cm Reinforced
15 cm Reinforced
Page 117
101
Table 4.7 Average CBR values of test sections from the vane shear and DCP tests
Base
Thickness
(cm)
Reinforcement
CBR (%) Remarks
Vane shear DCP
Subgrade Subgrade Base -
15 Unreinforced 4.9 5.7 10.5 -
15 Reinforced (hard
subgrade)
5.5 5.9 10.2 Before test
- 9.0 13.8 After test
15 Reinforced 5.1 5.7 10.9 -
23 Reinforced 5.1 5.9 10.7 -
30 Unreinforced 5.1 5.6 9.9 -
30 Reinforced 5.3 6.1 8.9 -
4.4.2 Dynamic Deformation Moduli of Subgrade, Base, and HMA surface
The LWD tests were conducted on the subgrade, the base, and the HMA surface in all the
test sections using three loading plates of 15, 20, and 30 cm in diameter at six locations in each
test section. The dynamic deformation moduli (Evd) obtained from the LWD tests are presented
in table 4.8.
Table 4.8 Dynamic deformation moduli of the test sections
Base
Thickness
(cm)
Reinforcement
Dynamic Deformation Modulus (MN/m2)
Subgrade Combined base and
subgrade layers
Combined HMA, base
and subgrade layers
15 cm 20 cm 30 cm 15 cm 20 cm 30 cm 15 cm 20 cm 30 cm
15 Unreinforced 4.7 4.9 6.8 10.6 15.7 17.2 56.0 66.3 51.5
15
Reinforced
(hard
subgrade)
11.0 12.2 17.1 21.5 28.8 35.2 96.4 201.9 104.1
15 Reinforced 14.1 20.0 29.1 16.4 19.9 26.1 81.1 98.1 82.7
23 Reinforced 7.0 7.4 11.3 15.0 19.9 28.9 81.7 92.7 75.3
30 Unreinforced 8.2 7.7 9.3 18.1 22.4 30.6 86.0 117.7 109.6
30 Reinforced 9.2 10.5 16.9 31.9 38.8 48.3 98.6 98.1 95.2
Page 118
102
The Evd values of the subgrade and the base increased with an increase of the size of the
loading plate for most of the tests. However, the Evd values of the HMA surface were the highest
in most of the test sections when the 20 cm loading plate was used. The Evd values decreased
from the HMA surface, the RAP base to the subgrade in all the test sections.
4.4.3 Percent of Air Void in the HMA Surface
Percent of air void (Va) is an important physical property of compacted dense or open
HMA which is used to correlate with its performance. This parameter affects the overall stability
and durability of the pavement. Lower percent of air void in the mixture can cause excessive
rutting of the pavement due to plastic flow. However, higher percent of air void provides more
permeable surface to the air and water, which can result in a higher rate of oxidation of asphalt
binder and ultimately premature cracking or raveling of the HMA surface. The bulk specific
gravity (GBS) and the theoretical maximum specific gravity (GMS) of the HMA samples obtained
by the core cutter were determined in the laboratory and are provided in table 4.9. The
percentages of air void of the samples were then calculated using Eq. (3.3) and are presented in
table 4.9.
Table 4.9 Percent of air void of the HMA sample
Base
Thickness (cm) 15 15 15 23 30 30
Reinforcement Unreinforced
Reinforced
(hard
subgrade)
Reinforced Reinforced Unreinforced Reinforced
Bulk Specific
Gravity 2.09 2.18 2.08 2.14 2.15 2.16
Maximum
Theoretical
Specific
Gravity
2.26 2.33 2.23 2.31 2.31 2.30
Percent of Air
Void (%) 7.64 6.59 6.81 7.01 7.18 6.08
Page 119
103
The percentages of air void of the HMA samples ranged from 6.08 to 7.64 %, which
show relatively consistent density of the HMA surfaces in all the test sections. It is shown that
the test section with hard subgrade and base had the lower percent of air void. The reinforced test
sections had lower percentages of air void than the unreinforced test sections. These results
indicate that hard subgrade and/or base courses (including geocell-reinforced bases) helped the
compaction of the HMA and resulted in denser HMA surfaces.
4.4.4 Permanent Deformation on the HMA Surface
Figure 4.64 shows the permanent deformations on the HMA surface at the center versus
the number of loading cycles for all six test sections. It is shown that the permanent deformation
increased at a higher rate at the beginning and then increased at a reduced rate after a certain
number of loading cycles. The unreinforced base sections had higher rates of the increase in the
permanent deformations than the geocell-reinforced sections. The thinner base sections had
higher rates of the increase in the permanent deformations than the thicker base sections. In
addition, the test section with hard subgrade and base course had a lower rate of the increase in
the permanent deformations. Figure 4.64 also shows that the 15 cm thick geocell-reinforced base
section had an equivalent or even better performance than the 30 cm thick unreinforced base
section.
The surface permanent deformation of 25 mm is often used as a criterion for a tolerable
deformation of a pavement. The number of loading cycles at the 25 mm permanent deformation
in each test is presented in table 4.10. It is shown that the 15 cm thick reinforced base section
with hard subgrade and base and the 30 cm thick geocell-reinforced base section had the largest
number of load cycles. The 15 cm thick unreinforced base section had the smallest number of
load cycles. The improvement of the pavement performance can be defined as the traffic benefit
Page 120
104
ratio (TRB) at the same pavement thickness reaching the same surface permanent deformation of
25 mm at the center. Table 4.10 shows that the geocell-reinforced base sections have the TBR
values of 10 and 12.5 for 15 and 30 cm thick RAP base sections. This result demonstrates the
benefit of geocell confinement of RAP bases.
Figure 4.64 The surface permanent deformation at the center versus the number of loading
cycles
0
5
10
15
20
25
30
35
40
45
50
0 2000 4000 6000 8000 10000 12000 14000 16000
Pe
rman
en
t d
efo
rmat
ion
(m
m.)
Number of loading cycle
15 cm unreinforced 30 cm unreinforced
15 cm reinforced (hard subgrade) 15 cm reinforced
23 cm reinforced 30 cm reinforced
Page 121
105
Table 4.10 Number of loading cycles at 25 mm surface permanent deformation at the center
Base thickness (cm) Number of loading cycle Traffic Benefit Ratio
(TBR) Unreinforced Reinforced
15 80 750 10
15 (hard subgrade) - 14000 -
23 - 1600 -
30 800 10000 12.5
Figure 4.65 presents the distributions of surface permanent deformations at different
distances to the center when the permanent deformation at the center was 25 mm It is shown that
all test sections had similar distributions, i.e., the permanent deformation decreased with an
increase of the distance.
Figure 4.65 Distributions of surface permanent deformations at the 25 mm deformation at the
center
-5
0
5
10
15
20
25
30
0 10 20 30 40 50 60
Pe
rman
en
t d
efo
rmat
ion
(m
m.)
Distance from center (cm.)
15 cm unreinforced
15 cm reinforced (hardsubgrade)15 cm reinforced
23 cm reinforced
30 cm unreinforced
30 cm reinforced
Page 122
106
4.4.5 Elastic Deformation at the Surface of HMA Layer
Elastic deformation was the surface rebound of the pavement when the applied load was
unloaded from 40 kN to 0.5 kN. The percent of elastic deformation is defined as the percent of
the elastic deformation to the total deformation in each load cycle. Figure 4.66 shows the percent
of elastic deformation varied with the number of load cycles. The general trend is that the
percent of elastic deformation increased with the number of load cycles.
The elastic deformation and percent of elastic deformation at the 25 mm permanent
deformation at the center are presented in table 4.11. It is shown that the percent of elastic
deformation ranged from 55 to 92%.
Figure 4.66 The percentage of elastic deformation versus the number of loading cycles
0
20
40
60
80
100
0 2000 4000 6000 8000 10000 12000 14000 16000
Pe
rce
nt
of
ela
stic
de
form
atio
n (
%)
Number of loading cycle
15 cm unreinforced 30 cm unreinforced
15 cm reinforced (hard subgrade) 15 cm reinforced
23 cm reinforced 30 cm reinforced
Page 123
107
Table 4.11 Elastic deformation and percentage of elastic deformation at 25 mm permanent
deformation at the center
Test 15 cm 15 cm (hard
subgrade) 15 cm 23 cm 30 cm 30 cm
Reinforcement Unreinforced Reinforced Reinforced Reinforced Unreinforced Reinforced
Elastic
deformation
(mm)
3.87 1.96 2.40 2.24 2.93 0.80
Percentage of
elastic
deformation (%)
68 92 67 82 55 57
4.4.6 Permanent Deformations of Pavement Layers
Tell-tales were used to measure the deformations on the top of the subgrade and the base
course for all the test sections except the 15 cm thick geocell-reinforced base section (hard
subgrade) and the 30 cm thick geocell-reinforced base section. The compression of the HMA
surface was determined by subtracting the measured deformation on the top of the RAP base
from the measured deformation on the HMA surface at the center of the loading plate. Similarly,
the compression of the RAP base was determined by subtracting the deformation on the top of
the subgrade from the deformation on the top of the RAP base at the center under the loading
plate. The vertical compressions of the HMA surface, the RAP base (unreinforced or geocell-
reinforced), and subgrade with the number of loading cycles are shown in figures 4.67, 4.68, and
4.69 respectively. The vertical compressions of these layers at the 25 mm permanent deformation
at the center are shown in table 4.12.
Figure 4.67 shows that the compressions of the HMA surfaces in the two unreinforced
RAP base sections were much higher than those in the reinforced base sections. Two
explanations for this result are: (1) the density of the HMA surfaces in the unreinforced base
Page 124
108
sections was lower than that in the reinforced base sections and (2) the HMA surfaces in the
unreinforced base sections carried more concentrated stresses than those in the reinforced base
sections because the base courses in the unreinforced base sections were weaker and softer than
those in the reinforced base sections.
Figure 4.68 also shows that the compressions in the unreinforced bases were higher than
those in the geocell-reinforced bases. The lower compressions in the reinforced bases can be
easily explained that the geocell-reinforced bases had higher stiffness than that in the
unreinforced bases.
Lastly, table 4.12 shows that the compression of the subgrade in the reinforced base
sections at the same surface permanent deformation of 25 mm at the center was much higher
than that in the unreinforced base sections. Due to the larger stress distribution angles in the
reinforced base sections, the influence depths in the reinforced base sections were larger than
those in the unreinforced base sections. Therefore, the contribution of the subgrade compression
to the total surface permanent deformation became more significant in the reinforced base
sections. However, figure 4.69 shows that at the same number of load cycles, the magnitude of
the subgrade compression decreased from the 15 cm thick unreinforced base section, the 15 cm
thick reinforced base section, the 23 cm thick reinforced base section, to the 30 cm thick
unreinforced base section. The fastest increase of the subgrade compression in the 15 cm
unreinforced base section was because the test section was fast approaching failure. The slowest
increase of the subgrade compression in the 30 cm thick unreinforced base section was because
of the large thickness of this section.
Page 125
109
Figure 4.67 Vertical compression of the HMA surface versus the number of loading cycles
Figure 4.68 Vertical compression of the RAP base versus the number of loading cycles
0
2
4
6
8
0 2000 4000 6000 8000 10000 12000 14000
HM
A s
urf
ace
co
mp
ress
ion
(m
m.)
Number of loading cycle
15 cm unreinforced 15 cm reinforced
23 cm reinforced 30 cm unreinforced
0
2
4
6
8
10
12
14
16
18
0 2000 4000 6000 8000 10000 12000 14000
Bas
e c
om
pre
ssio
n (
mm
.)
Number of loading cycle
15 cm unreinforced 15 cm reinforced
23 cm reinforced 30 cm unreinforced
Page 126
110
Figure 4.69 Vertical compression of subgrade layer versus number of loading cycles
Table 4.12 Vertical compressions of the HMA surface, base, and subgrade at 25 mm permanent
deformation at the center
Test 15 cm 15 cm 23 cm 30 cm
Reinforcement Unreinforced Reinforced Reinforced Reinforced
HMA compression( mm) 4.80 0.52 1.12 4.82
Base compression (mm) 9.80 7.30 4.06 9.88
Subgrade compression (mm) 10.40 17.18 19.82 10.30
4.4.7 Maximum Strain on the Geocell
Tensile strain, compressive strain, and tensile strain were developed at the top gauges,
middle gauges, and bottom gauges of the geocell wall respectively for almost all of the
experiments. However, there was compressive strain at the top gauge of the central geocell in the
23 cm thick geocell-reinforced RAP base section and at the bottom gauge of the central geocell
of the lower layer in the 30 cm thick geocell-reinforced RAP base section. The magnitude of
0
8
16
24
32
40
0 2000 4000 6000 8000 10000 12000 14000
Sub
grad
e c
om
pre
ssio
n (
mm
.)
Number of loading cycle
15 cm unreinforced 15 cm reinforced
23 cm reinforced 30 cm unreinforced
Page 127
111
strain was higher for the geocell at the center and lower for the geocell at the distances 25 cm
and 50 cm away from the center respectively. Table 4.13 shows the maximum tensile and
compressive strains developed on geocell.
Table 4.13 Maximum strain on geocell wall
Base thickness (cm) Geocell
height (cm)
Strain (%)
Tension Compression
15 10 0.49 0.63
15 (hard subgrade) 10 0.25 0.44
23 15 1.88 0.86
30 (top geocell) 10 0.41 0.80
31 (bottom geocell) 10 0.66 0.35
4.4.8 Maximum Strain at the Bottom of the HMA Surface
Figure 4.70 shows the strains at the bottom of the HMA surfaces at the center under the
loading plate increased with the number of loading cycles. Tensile strains developed at the
bottom of the HMA surfaces in the 15 cm thick unreinforced base section, the 15 cm thick
geocell-reinforced base sections (normal and hard subgrade), and the 23 cm thick geocell-
reinforced base section. However, there was no strain developed at the bottom of the HMA
surface at the center in the 30 cm thick unreinforced base section.
Page 128
112
Figure 4.70 Strain at the bottom of the HMA surface versus the number of loading cycles
4.4.9 Vertical Stress at the Interface between Subgrade and Base
The vertical stresses at the interface between subgrade and RAP base at the center under
the loading plate versus the number of loading cycles are shown in figure 4.71. The vertical
stresses at the interface between subgrade and RAP base increased with the number of loading
cycles, firstly at a faster rate and then at a slower rate. The vertical stresses in both unreinforced
base sections increased faster than those in all the reinforced base sections. The vertical stresses
in the 23 and 30 cm thick geocell-reinforced base sections were close, but much lower than the
15 cm thick geocell-reinforced base sections (normal and hard subgrade). The comparison of the
vertical stresses in the 30 cm thick unreinforced and geocell-reinforced base sections shows that
the reinforced section had a vertical stress trend of less than half what the unreinforced section
had. This comparison demonstrates the benefit of the geocell confinement.
-0.005
0.000
0.005
0.010
0.015
0.020
0.025
0.030
0.035
0.040
0 2000 4000 6000 8000 10000 12000 14000 16000
Stra
in a
t ce
nte
r (%
)
Number of loading cycle
15 cm unreinforced 15 cm reinforced (hard subgrade)
15 cm reinforced 23 cm reinforced
30 cm unreinforced
Page 129
113
Figure 4.71 Vertical stress at the interface between subgrade and RAP base versus the number of
loading cycles at the center
The distributions of the vertical stresses at the interface between subgrade and RAP base
in all the test sections are shown in figure 4.72. The maximum vertical stresses developed at the
center and the magnitude of the vertical stresses decreased with an increase of the distance.
0
50
100
150
200
250
0 2000 4000 6000 8000 10000 12000 14000 16000
Ve
rtic
al s
tre
ss (
kPa)
Number of loading cycle
15 cm unreinforced 15 cm reinforced (hard subgrade)
15 cm reinforced 23 cm reinforced
30 cm unreinforced 30 cm reinforced
Page 130
114
Figure 4.72 Distribution of the vertical stresses at the interface between subgrade and RAP base
versus the number of loading cycles at 25 mm surface permanent deformation at the center
4.4.10 Stress Distribution Angle
Figure 4.73 shows the stress distribution angles decreased with an increase of the number
of loading cycles. The geocell-reinforced base sections had the higher stress distribution angles
than the unreinforced base sections. This result demonstrates the benefit of geocell confinement
in increasing the stiffness of the base courses so that the stress distribution angles were enlarged.
-20
20
60
100
140
180
0 10 20 30 40 50 60 70 80
Ve
rtic
la s
tre
ss (
kPa)
Distance from center (cm.)
15 cm unreinforced
30 cm unreinforced
15 cm reinforced (hardsubgrade)
15 cm reinforced
23 cm reinforced
30 cm reinforced
Page 131
115
Figure 4.73 Stress distribution angle versus the number of loading cycles
4.5 Summary of Results
The geocell confinement, the increase of base thickness, and the increase of subgrade
CBR significantly improved the performance of the pavement. The geocell-reinforced RAP
bases behaved like semi-rigid mattresses, which resulted in the distribution of the vertical
stresses to wider areas. The geocell-reinforced RAP bases had a higher percent of elastic
deformation, lower compression of HMA and RAP base, and more compression contributed by
subgrade as compared with unreinforced RAP base sections.
0
20
40
60
80
0 2000 4000 6000 8000 10000 12000 14000 16000
Stre
ss d
istr
ibu
tio
n a
ngl
e (
)
Number of loading cycle
15 cm unreinforced 15 cm reinforced (hard subgrade)
15 cm reinforced 23 cm reinforced
30 cm unreinforced 30 cm reinforced
Page 132
116
Chapter 5 Conclusions and Recommendations
The experimental work was carried out on unreinforced and geocell-reinforced flexible
pavements with recycled asphalt pavement (RAP) bases under cyclic loading in the large
geotechnical testing box at the University of Kansas. These tests simulated onsite use of RAP
with geocell as bases overlaid by thin hot mix asphalt (HMA) surfaces to support heavy trucks.
Six experiments were carried out by varying the thickness of the base course with and without
geocell confinement.
5.1 Conclusions
Based on the test results, the following conclusions can be drawn:
1. The vane shear test, dynamic cone penetration test, and light weight deflectometer test
were effective methods for quality control for subgrade, base course, and hot mix asphalt
(HMA) surface during the preparation of test sections.
2. The novel polymeric alloy (NPA) geocell reinforcement significantly reduced the
permanent deformation of the flexible pavement and increased the pavement life by a
factor of 10.
3. The thinner geocell-reinforced base section had equivalent performance to the thicker
unreinforced base section. In this study, the 15 cm thick geocell-reinforced RAP base
was equivalent to the 30 cm thick unreinforced RAP base.
4. The geocell confinement increased the stiffness of the base course and reduced the
compression of the base course.
5. The geocell-reinforced RAP bases provided a solid foundation for better compaction of
the HMA surface and resulted in lower percent of air void in the HMA surface.
Page 133
117
6. The subgrade contributed to most of the total permanent deformation, followed by the
RAP base and the HMA surface.
7. The geocell-reinforced base acted as a semi-rigid mattress foundation, which distributed
the applied load to a wider area on the subgrade with higher stress distribution angle and
resulted in lower compression of subgrade, RAP base, and HMA surface layers as
compared with unreinforced base sections.
5.2 Recommendations
This experimental study of geocell-reinforced flexible pavements with RAP bases is the
original research on the geocell technology for flexible pavement applications. The experimental
results from this study can be used as a basis for numerical modeling and development of a
design method in the future.
The following work should be carried out to further advance the geocell technology for
flexible pavement applications:
1. Investigate the effects of subgrade CBR and HMA thickness on the pavement
performance;
2. Develop a method to quantify the benefit of geocell confinement;
3. Verify the cyclic plate load test results with accelerated moving wheel load tests and/or
field trafficking tests; and
4. Develop a design method for geocell-reinforced flexible pavements with RAP bases.
Page 134
118
References
Alam, T.B., M. Abdelrahman, and S. A. Scharm. 2009. “Laboratory characteristics of Recycled
Asphalt Pavement as a base layer.” International Journal of Pavement Engineering 11, no.
2: 123-131.
Al-Qadi, I.L., S. Carpenter, G. Roberts, H. Ozer, and Q. Aurangzeb. 2009. “Determination of
Usable Residual Asphalt Binder in RAP.” Illinois Center for Transportation (ICT),
FHWA-ICT-09-031.
American Society for Testing and Materials (ASTM D2573 – 08). 2008. "Standard Test Methods
for Field Vane Shear Test in Cohesive Soil.” Available from www.astm.org
American Society for Testing and Materials (ASTM D3203). 2011. "Standard Test Method for
Percent Air Voids in Compacted Dense and Open Bituminous Paving Mixture."
Available from www.astm.org
American Society for Testing and Materials (ASTM D4439-11). 2011. "Standard Terminology
for Geosynthetics.” Available from www.astm.org.
American Society for Testing and Materials (ASTM D6951 – 09). 2009. "Standard Test Methods
for Use of the Dynamic Cone Penetrometer in Shallow Pavement Applications.”
Available from www.astm.org
Attia, M., and M. Abdelrahman. 2010. "Modeling the effect of moisture on resilient modulus of
untreated Reclaimed Asphalt Pavement." Journal of the Transportation Research Board,
2167: 30-40.
Audery, C. 2011. “Reclaimed Asphalt Pavement in Asphalt Mixtures: State of Practice.”
Publication No. FHWA-HRT-11-021, U.S. Department of Transportation, Federal
Highway Administration, Research, Development, and Technology, Turner-Fairbank
Highway Research Center.
Bartnev, G.M. and S. Zuyeb. 1969. Strength and Failure of Viscoelastic Materials. Pergamon
Press.
Becham, W.K. and W. H. Mills. 1935. “Cotton-fabric reinforced roads.” Engineering News
Record, Oct. 3: 453-455.
Bennert, T. and A. Maher. 2005. “The Development of a Performance Specification for Granular
Base and Subbase Materials.” Dept. of Civil & Environmental Engineering, Center for
Advanced Infrastructure & Transportation (CAIT), Rutgers, the State University,
Piscatawav, NJ.
Page 135
119
Berthelot, C., R. Haichert, D. Podborochynski, C. Wandzura, B. Taylor, and D. Guenther. 2010.
"Mechanistic laboratory evaluation and field construction of recycled concrete materials
for use in road substructures." Journal of the Transportation Research Board, no. 2167:
41-52.
Cosentino, P.J., E.H Kalajian, C. S. Shieh, W. J. K. Mathurin, F. A. Gomez, E. D. Cleary, and
A. Treeratrakoon. 2003. “Final Report on Developing Specifications for Using Recycled
Asphalt Pavement as Base, Subbase or General Fill Materials, Phase II.” Report No.
FL/DOT/RMC/06650-7754, Florida Institute of Technology, Civil Engineering
Department.
Collin, J.G., T. C. Kinney, and X. Fu. 1996. "Full scale highway load test of flexible pavement
systems with geogrid reinforced base course." Geosynthetics International, 3, no. 4: 537-
549.
Dash, S. K., S. Sireesh, and T. G. Sitharam. 2003. "Model studies on circular footing supported
on geocell reinforced sand underlain by soft clay." Geotextiles and Geomembranes, 21:
197-219.
Emersleben, A. and M. Meyer. 2008. "The use of geocells in road construction over soft soil:
vertical stress and falling weight deflectometer measurement.” EuroGeo4, Edinburgh,
Paper number 132.
Emersleben, A. and M. Meyer. 2010. "The influence of hoop stresses and earth resistance on the
reinforcement mechanism of single and multiple geocells.” Proceedings of the 9th
International Conference on Geosynthetics, Guaruja, Brazil.
Federal Highway Administration. 2008. “User Guidelines for Byproducts and Secondary Use
Materials in Pavement Construction: Reclaimed Asphalt Pavement.” U.S. Department of
Transportation, Federal Highway Administration, Publication Number: FHWA-RD-97-
148. Retrieved from www.recycledmaterials.org/tools/uguidelines/index.asp
Federal igh ay Administration. 2010. “Reclaiming Roads.” FHWA-HRT-10-001. Retrieved
from http://www.fhwa.dot.gov
Federal Highway Administration. 2010. “Reclaimed Asphalt pavement in Asphalt Mi tures:
State of Practice.” FHWA-HRT-11-021. Retrieved from www.fhwa.dot.gov
Giroud, J.P. and J. Han. 2004. “Design method for geogrid-reinforced unpaved roads – Part I:
theoretical development.” ASCE Journal of Geotechnical and Geoenvironmental
Engineering, 130, no.8: 776-786.
Giroud, J.P. and J. Han. 2004. “Design method for geogrid-reinforced unpaved roads – Part II:
calibration and verification.” ASCE Journal of Geotechnical and Geoenvironmental
Engineering, 130, no. 8: 787-797.
Page 136
120
“Geosynthetic.” E-notes. Retrieved from http://www.enotes.com/topic/Geosynthetic#Geocells
Hass, R., J. Walls, and R. G. Carroll. 1988. "Geogrid reinforcement of granular bases in flexible
pavements." Transportation Research Record, 1188: 19-27.
Han, J., S. K. Pokharel, X. Yang, C. Manandhar, D. Leshchinsky, I. Halahmi, and R. L. Parsons.
2011. “Performance of geocell-reinforced RAP bases over weak subgrade under full-
scale moving heel loads.” ASCE Journal of Materials in Civil Engineering, 23, no.11:
1525-1535.
Keif, O. and K. Rajagopal. 2008. "Three dimensional cellular confinement system contribution
to structural pavement reinforcement." Geosynthetics India '08 Seminar, Hyderabad,
India.
erisel, J. 1985. “The history of geotechnical engineering up until 1700.” Proceedings of the
11th International Conference on Soil Mechanics and Foundation Engineering, Golden
Jubilee Book on History of Geomechanics, 11-12.
Kim, W., J. F. Labuz, and S. Dai. 2007. "Resilient modulus of base course containing Recycled
Asphalt Pavement." Journal of the Transportation Research Board, 2005: 27-35.
Koch, S., and K. Ksaibati. 2010. “Performance of Recycled Asphalt Pavement in Gravel Roads.”
Department of Civil and Architectural Engineering, University of Wyoming.
Latha, G. M., K. Rajgopal, and N. R. Krishnaswamy. 2006. "Experimental and theoretical
investigations on geocell-supported embankments." ASCE International Journal of
Geomechanics, January/February.
Mohamed, A. and A. Magdy. 2010. “Modeling the effect of moisture on resilient modulus of
untreated reclaimed asphalt pavement.” Journal of Transportation Research Board,
2167: 30-40.
Mokwa, R. L., and C. S. Peebles. 2005. “Evaluation of the Engineering Characteristics of
RAP/Aggregate Blends.” The State of Montana Department of Transportation,
FHWA/MT -05-008/8117-24.
Pokharel, S. K. 2010. “Experimental study on Geocell-Reinforced Bases under Static and
Dynamic Loading.” PhD diss., CEAE Department, University of Kansas.
Pokharel, S. K., J. Han, R. L. Parsons, R, Y. Qian, D. Leshchinsky, and I Halahmi. 2009a.
"Experimental study on bearing capacity of geocell-reinforced bases." Proceedings of
the Eight International Conference on Bearing Capacity of Roads, Railways, and
Airfields, University of Illinois at Urbana-Champaign, Champaign, Illinois.
Page 137
121
Pokharel, S. K., J. Han, D. Leshchinsky, R. L Parsons, and I. Halahmi. 2009. "Experimental
evaluation of influence factor for single geocell-reinforced sand." U.S. Transportation
Research Board (TRB) 88th Annual Meeting, Washington, DC.
Presto Products Co. 2009. “Geocells: The early days ith the Army Corps.” Geosynthetics,
October. www.geosyntheticsmagazine.com.
Holtz, R.D. 1990. “Design and construction of geosynthetically reinforced embankments on very
soft soils.” Performance of Reinforced Soil Structure, Proceedings of the International
Reinforced Soil Conference, the British Geotechnical Society, Glasgow.
Singh, V. K., A. Prasad, and R. K. Arrawal. 2007. "Effect of soil confinement on ultimate
bearing capacity of square footing under eccentric-inclined load." The Electronic
Journal of Geotechnical Engineering, 12, no pagination specified.
Sitharam, T. G., G. Srilakshmi, and S. Sireesh, S. 2006. "Numerical modeling of geocell
reinforced sand beds using FLAC3D." Proceedings of the 4th International Conference
in FLAC3D, Madrid, Spain
Thakur, J. K. 2011. Experimental study on Geocell-Reinforced Recycled Asphalt Pavement
(RAP) Bases under Static and Cyclic Loadings. Master’s Thesis, CEAE Department,
University of Kansas.
Thakur, S.C., J. Han, W. K. Chong, and R. L. Parsons, R.L 2011. “Comparison of physical and
consensus properties of RAP aggregate extracted by ignition and centrifuge methods.”
Advances in Geotechnical Engineering, Geotechnical Special Publication No. 211,
Proceedings of GeoFrontiers 2011, Han, J. and Alzamora, D.E. (editors), Dallas, TX,
March 13 to 16, 4525-4534.
Viyanant, C., E. M. Rathje, and A. F. Rauch, A.F. 2007. “Creep of compacted recycled asphalt
pavement.” Canadian Geotechnical Journal,44, no. 6: 687-697.
Webster, S.L. 1992. Geogrid Reinforced Base Courses for Flexible Pavements for Light Aircraft:
Test Section Construction, Behavior under Traffic, Laboratory Tests, and Design
Criteria. Technical Report GL-93-6, ASAE Waterways Experiment Station, Vicksburg,
Mississippi.
Yang, X.M. 2010. Numerical Analysis of Geocell-reinforced Granular Soils under Static and
Repeated Loads. PhD diss., University of Kansas.
Yuu, J., J. Han A. Rosen, A., R.L Parsons, and D. Leshchinsky. 2008. "Technical review of
geocell-reinforced base courses over weak subgrade." Proceedings of the First Pan
American Geosynthetics Conference and Exhibition, Cancun, Mexico.