The Ontario Economic Overview is a quarterly report prepared by the Policy, Analysis & Intelligence Directorate of the Ontario Region of Industry Canada that contains analysis of the current economic and financial performance of industries in Ontario. The analysis is of select economic/industrial issues, and does not contain internal forecasts or policy analysis, assessments, or conclusions. If you have any comments, please email Adam Hayashi, Senior Economist, Industry Canada, Ontario Region, at [email protected]. HIGHLIGHTS IN THIS REPORT Sector overviews: Issues facing the economy: Manufacturing (pg. 4) Finance and Insurance Primary Industries U.S. Economy (pg. 14) Automotive (pg. 4) (pg. 9) (pg. 12) Aerospace (pg. 6) Construction (pg. 10) Clean Energy Biotechnology and Tourism (pg. 11) (pg. 13) Pharmaceutical (pg. 7) Retail and Wholesale ICT (pg. 8) Trade (pg. 12) KEY ECONOMIC INDICATORS Real GDP Employment Unemployment Rate (% change unless otherwise indicated) 2010 2011f 2012f 2010 2011f 2012f 2010 2011f 2012f Ontario 3.4 2.4 2.4 1.7 2.0 1.4 8.7 7.9 7.5 Canada 3.2 2.4 2.3 1.4 1.7 1.1 8.0 7.5 7.3 United States 3.0 1.7 2.5 -0.7 1.1 1.7 9.6 9.0 8.7 Source: Statistics Canada, U.S. Bureau of Economic Analysis; f indicates forecasted data, using median forecasts released in June 2011 or later, where available, from Conference Board of Canada, Scotiabank, RBC Financial, TD Economics, BMO Financial, CIBC World Markets, and Desjardins. Forecasts collected August 2011. Ontario Economic Overview Ontario’s real GDP grew 0.8% in Q1 2011, the seventh consecutive gain since Q3 2009. Manufacturing output increased 1.2%, bringing production closer to pre- recession levels. The addition of almost 8000 jobs raised employment 1.3%. Canada’s five largest banks posted profit of $5.9B in Q2 2011 for a 17.0% gain over the same period last year. Employment in tourism increased 2.3% in Q1 2011. The number of U.S. and international travelers was down while overseas entries from China, Hong Kong and India grew strongly in the first four months of 2011. ICT employment increased 0.8% in Q1 after eight consecutive quarters of decline or no change. RIM continued to face challenges in the market this year due to increasing competition from other smartphone suppliers. Output in Ontario’s automotive sector was up 5.8% and employment grew by 0.9%. Persistent unemployment and supply chain disruptions caused by the earthquake and tsunami in Japan have caused some forecasts to be lowered. The primary sector’s output decreased by 1.0% in Q1 while employment was up 5.7%. Mining exports climbed to $4.4B (+27.3%) in Q1, with gold and silver exports leading the increase. U.S. GDP rose 0.5% in Q1 2011. The credit rating downgrade by S&P contributed to lower growth projections and fears of another recession. Ontario’s economy is forecast to grow 2.6% in 2011 and 2.5% in 2012, slightly behind Canada’s projected growth. September 2011 Update
Transcript
The Ontario Economic Overview is a quarterly report prepared by the Policy, Analysis & Intelligence Directorate of the Ontario Region of Industry Canada that contains analysis of the current economic and financial performance of industries in Ontario. The analysis is of select economic/industrial issues, and does not contain internal forecasts or policy analysis, assessments, or conclusions. If you have any comments, please email Adam Hayashi, Senior Economist, Industry Canada, Ontario Region, at [email protected].
HIGHLIGHTS
IN THIS REPORT Sector overviews: Issues facing the economy: � Manufacturing (pg. 4) � Finance and Insurance � Primary Industries � U.S. Economy (pg. 14) � Automotive (pg. 4) (pg. 9) (pg. 12) � Aerospace (pg. 6) � Construction (pg. 10) � Clean Energy � Biotechnology and � Tourism (pg. 11) (pg. 13)
Real GDP Employment Unemployment Rate (% change unless otherwise indicated) 2010 2011f 2012f 2010 2011f 2012f 2010 2011f 2012f
Ontario 3.4 2.4 2.4 1.7 2.0 1.4 8.7 7.9 7.5
Canada 3.2 2.4 2.3 1.4 1.7 1.1 8.0 7.5 7.3
United States 3.0 1.7 2.5 -0.7 1.1 1.7 9.6 9.0 8.7
Source: Statistics Canada, U.S. Bureau of Economic Analysis; f indicates forecasted data, using median forecasts released in June 2011 or later, where available, from Conference Board of Canada, Scotiabank, RBC Financial, TD Economics, BMO Financial, CIBC World Markets, and Desjardins. Forecasts collected August 2011.
Ontario Economic Overview
� Ontario’s real GDP grew 0.8% in Q1 2011, the seventh consecutive gain since Q3 2009.
� Manufacturing output increased 1.2%, bringing production closer to pre-recession levels. The addition of almost 8000 jobs raised employment 1.3%.
� Canada’s five largest banks posted profit of $5.9B in Q2 2011 for a 17.0% gain over the same period last year.
� Employment in tourism increased 2.3% in Q1 2011. The number of U.S. and international travelers was down while overseas entries from China, Hong Kong and India grew strongly in the first four months of 2011.
� ICT employment increased 0.8% in Q1 after eight consecutive quarters of decline or no change. RIM continued to face challenges in the market this year due to increasing competition from other smartphone suppliers.
� Output in Ontario’s automotive sector was up 5.8% and employment grew by 0.9%. Persistent unemployment and supply chain disruptions caused by the earthquake and tsunami in Japan have caused some forecasts to be lowered.
� The primary sector’s output decreased by 1.0% in Q1 while employment was up 5.7%. Mining exports climbed to $4.4B (+27.3%) in Q1, with gold and silver exports leading the increase.
� U.S. GDP rose 0.5% in Q1 2011. The credit rating downgrade by S&P contributed to lower growth projections and fears of another recession.
� Ontario’s economy is forecast to grow 2.6% in 2011 and 2.5% in 2012, slightly behind Canada’s projected growth.
September 2011 Update
ONTARIO ECONOMIC OVERVIEW – SEPTEMBER 2011 UPDATE 2
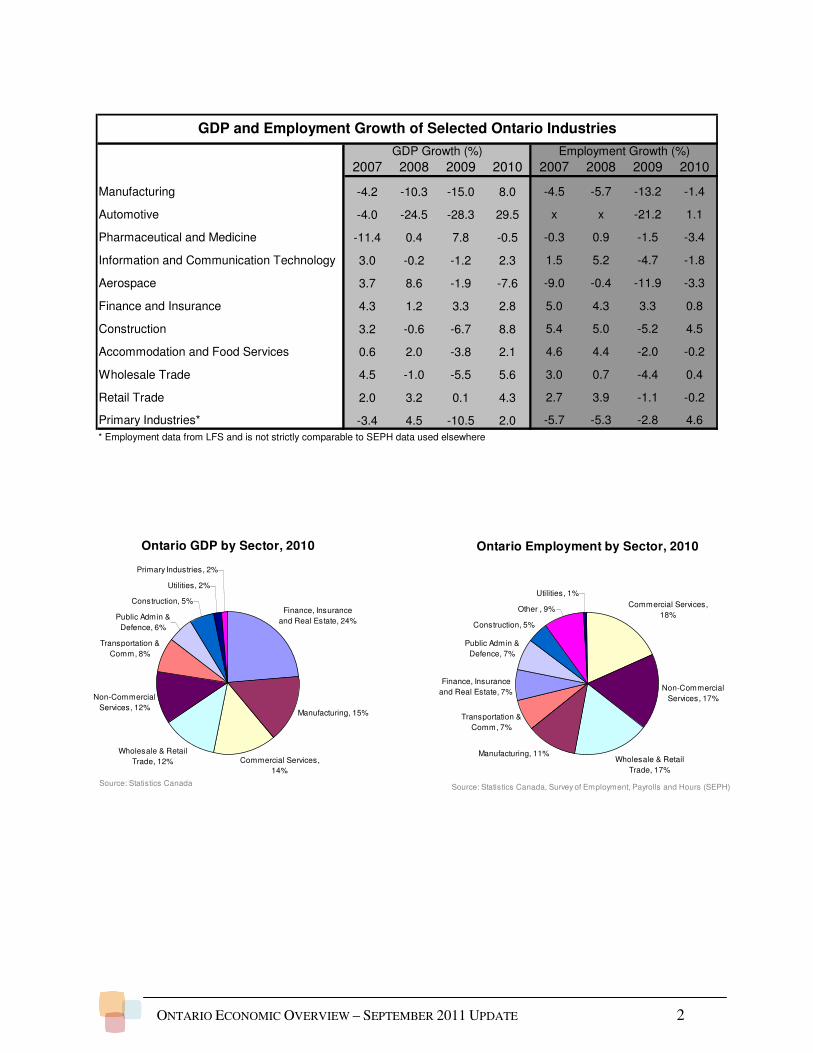
* Employment data from LFS and is not strictly comparable to SEPH data used elsewhere
GDP Growth (%) Employment Growth (%)
GDP and Employment Growth of Selected Ontario Industries
Ontario GDP by Sector, 2010
Finance, Insurance
and Real Estate, 24%
Manufacturing, 15%
Commercial Services,
14%
Wholesale & Retail
Trade, 12%
Non-Commercial
Services, 12%
Transportation &
Comm, 8%
Public Admin &
Defence, 6%
Construction, 5%
Utilities, 2%
Primary Industries, 2%
Source: Statistics Canada
Ontario Employment by Sector, 2010
Commercial Services,
18%
Non-Commercial
Services, 17%
Wholesale & Retail
Trade, 17%
Manufacturing, 11%
Transportation &
Comm, 7%
Finance, Insurance
and Real Estate, 7%
Public Admin &
Defence, 7%
Construction, 5%
Other , 9%
Utilities, 1%
Source: Statistics Canada, Survey of Employment, Payrolls and Hours (SEPH)
ONTARIO ECONOMIC OVERVIEW – SEPTEMBER 2011 UPDATE 3
ECONOMIC FUNDAMENTALS
� Ontario’s real GDP increased 0.8% in Q1 2011 following 1.1% growth in Q4 2010 and extending the trend to seven consecutive quarters of growth.1
� Ontario’s share of the national economy dropped steadily from 41.4% in 2002 to 36.5% in 2008, coinciding with a 32.1% increase in the value of the Canadian dollar against the U.S. dollar.2
� Increases in the Canadian dollar are often driven by rising commodity prices and put pressure on export prices for Ontario manufacturers. While the dollar softened in 2009, and Ontario’s share of national output grew, the currency has strengthened further in 2010 and 2011, remaining above parity with U.S. dollar as of August 2011.3
� The finance, insurance, real estate and leasing sector showed continued strength with 1.1% growth. Output was also up in manufacturing (1.2%) and wholesale trade (1.7%). There were declines in information and culture (-0.9%), primary (-1.0%), and utilities (-4.4%).4
� After gaining 144,000 jobs in Q1 2011 over Q1 2010, the labour market improved again in Q2 2011 with 194,500 more jobs than in Q2 2010. The largest contributors to job growth were health care and social assistance (+54,000 jobs), information, culture and recreation (+36,000) and transportation and warehousing (+26,000).5
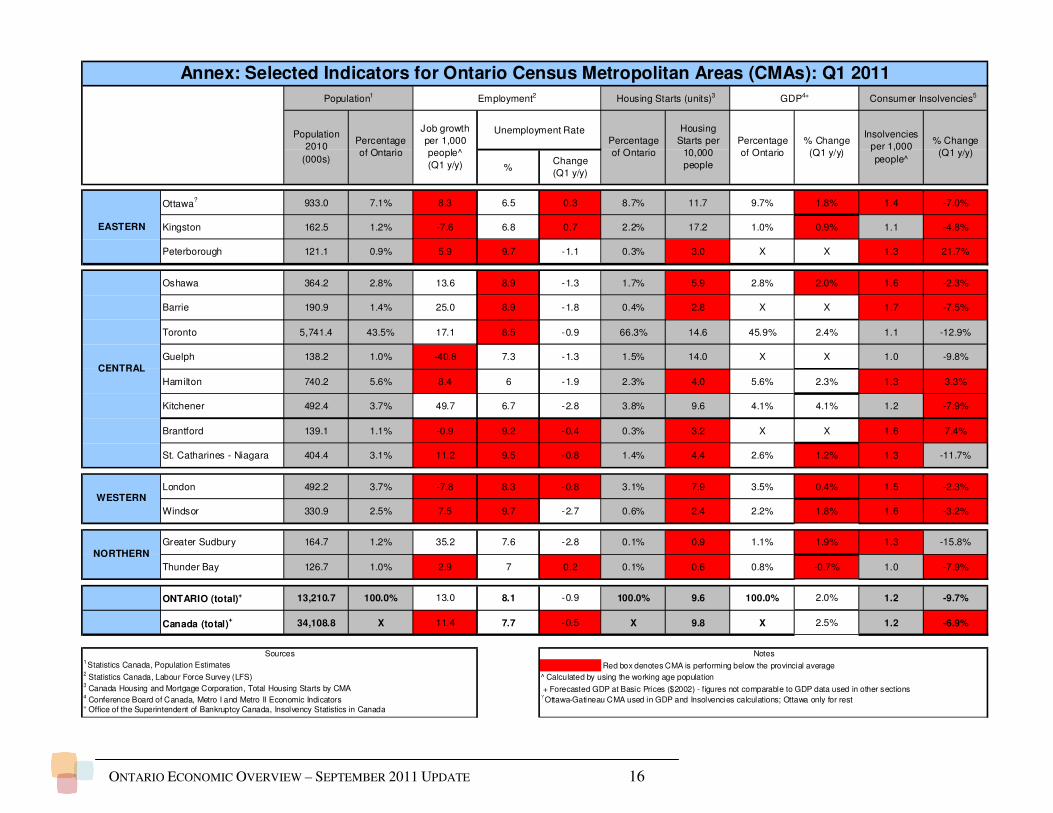
� Ontario’s unemployment rate remained at 8.1% in Q2 2011 after a 0.2% decline in Q1 2011. Meanwhile, national unemployment has remained steady at 7.7% for the past three quarters. Several Ontario Census Metropolitan Areas (CMAs) had some of the highest unemployment rates in
the country, including St. Catharines-Niagara (9.1%), Oshawa (9.3%), and Windsor (10.7%).6
� The Bank of Canada’s Senior Loan Officer Survey showed easing business-lending conditions in Q2 2011. Conditions eased for the eighth consecutive quarter for corporate borrowers, the fifth consecutive quarter for commercial borrowers, and the third consecutive quarter for small businesses. The balance of opinion had the strongest consensus for easing in both price and non-price conditions since the survey began in 1999. Heightened competition among lenders, a more favourable economic outlook, and improved industry-specific conditions continued to be cited as the reasons for easing credit conditions.7
� Consumer insolvencies in Ontario declined 9.4% in Q1 2011 from Q1 2010 compared to the national decline of 6.6%. Insolvencies were down in all Ontario CMAs except Peterborough, Hamilton, and Brantford.8
� Ontario business insolvencies declined 17.9% year-over-year in Q1 2011, ahead of the 12.4% national average. There were 430 business insolvencies in Ontario in Q1 2011, with both bankruptcies and proposals declining.9
� Ontario’s index of consumer confidence dropped sharply in August to 67.8 as the U.S. downgrade and fears of a double-dip recession weighed on consumers. National consumer confidence declined to 74.7.10
ECONOMIC OUTLOOK
� The median private sector forecasts for real GDP growth in Ontario and nationally in 2011 is 2.4%. Both were revised downward from last quarter’s projections. Forecasts ranged from a low of 2.0% (Desjardins) to a high of 3.3% (RBC). Notably, the two highest forecasts had not been updated since June; the others received more recent updates.11
� The median forecast for the previous issue of this report was for 2.6% GDP growth in Ontario in 2011. Three forecasters lowered their projections, two increased theirs, and two were unchanged. The median forecast for national GDP growth was 2.9% in the last issue. Six forecasters lowered their forecasts and one was raised.
� Ontario is the Canadian province most whose economic growth is most closely correlated with U.S. growth. Economic challenges in the U.S. may be expected to affect demand for Ontario exports.12
� Fears over fiscal challenges in Europe and the U.S.
have contributed to market uncertainty. The resulting lower commodity prices have reduced manufacturing input with many manufacturers, now planning to invest in equipment.13
� Ontario’s unemployment rate is expected to drop from an average of 8.7% in 2010 to 7.9% in 2011. The national rate is forecast to drop from 8.0% to 7.5%.14
� U.S. unemployment is forecast to drop from 9.6% in 2010 to 8.8% in 2011,15 remaining well above the five-year pre-recession average of 5.1% from 2004 to 2008.16
� Low consumer confidence and fiscal challenges due to high debt may continue to restrain economic growth and leave the global economy susceptible to further shocks.17
ONTARIO ECONOMIC OVERVIEW – SEPTEMBER 2011 UPDATE 4
SECTORAL ANALYSIS AND OUTLOOK MANUFACTURING
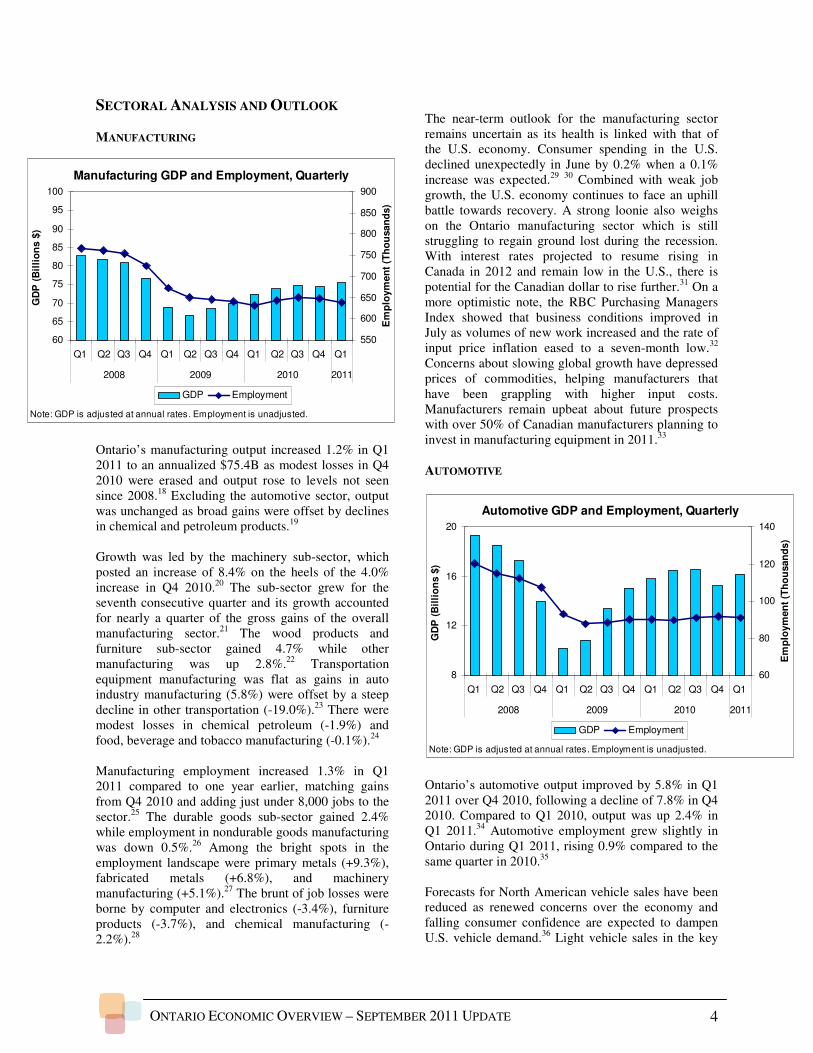
Ontario’s manufacturing output increased 1.2% in Q1 2011 to an annualized $75.4B as modest losses in Q4 2010 were erased and output rose to levels not seen since 2008.18 Excluding the automotive sector, output was unchanged as broad gains were offset by declines in chemical and petroleum products.19 Growth was led by the machinery sub-sector, which posted an increase of 8.4% on the heels of the 4.0% increase in Q4 2010.20 The sub-sector grew for the seventh consecutive quarter and its growth accounted for nearly a quarter of the gross gains of the overall manufacturing sector.21 The wood products and furniture sub-sector gained 4.7% while other manufacturing was up 2.8%.22 Transportation equipment manufacturing was flat as gains in auto industry manufacturing (5.8%) were offset by a steep decline in other transportation (-19.0%).23 There were modest losses in chemical petroleum (-1.9%) and food, beverage and tobacco manufacturing (-0.1%).24 Manufacturing employment increased 1.3% in Q1 2011 compared to one year earlier, matching gains from Q4 2010 and adding just under 8,000 jobs to the sector.25 The durable goods sub-sector gained 2.4% while employment in nondurable goods manufacturing was down 0.5%.26 Among the bright spots in the employment landscape were primary metals (+9.3%), fabricated metals (+6.8%), and machinery manufacturing (+5.1%).27 The brunt of job losses were borne by computer and electronics (-3.4%), furniture products (-3.7%), and chemical manufacturing (-2.2%).28
The near-term outlook for the manufacturing sector remains uncertain as its health is linked with that of the U.S. economy. Consumer spending in the U.S. declined unexpectedly in June by 0.2% when a 0.1% increase was expected.29 30 Combined with weak job growth, the U.S. economy continues to face an uphill battle towards recovery. A strong loonie also weighs on the Ontario manufacturing sector which is still struggling to regain ground lost during the recession. With interest rates projected to resume rising in Canada in 2012 and remain low in the U.S., there is potential for the Canadian dollar to rise further.31 On a more optimistic note, the RBC Purchasing Managers Index showed that business conditions improved in July as volumes of new work increased and the rate of input price inflation eased to a seven-month low.32 Concerns about slowing global growth have depressed prices of commodities, helping manufacturers that have been grappling with higher input costs. Manufacturers remain upbeat about future prospects with over 50% of Canadian manufacturers planning to invest in manufacturing equipment in 2011.33 AUTOMOTIVE
Ontario’s automotive output improved by 5.8% in Q1 2011 over Q4 2010, following a decline of 7.8% in Q4 2010. Compared to Q1 2010, output was up 2.4% in Q1 2011.34 Automotive employment grew slightly in Ontario during Q1 2011, rising 0.9% compared to the same quarter in 2010.35 Forecasts for North American vehicle sales have been reduced as renewed concerns over the economy and falling consumer confidence are expected to dampen U.S. vehicle demand.36 Light vehicle sales in the key
Manufacturing GDP and Employment, Quarterly
60
65
70
75
80
85
90
95
100
Q1 Q2 Q3 Q4 Q1 Q2 Q3 Q4 Q1 Q2 Q3 Q4 Q1
2008 2009 2010 2011
GD
P (
Bil
lio
ns $
)
550
600
650
700
750
800
850
900
Em
plo
ym
en
t (T
ho
usan
ds)
GDP Employment
Note: GDP is adjusted at annual rates. Employment is unadjusted.
Automotive GDP and Employment, Quarterly
8
12
16
20
Q1 Q2 Q3 Q4 Q1 Q2 Q3 Q4 Q1 Q2 Q3 Q4 Q1
2008 2009 2010 2011
GD
P (
Bil
lio
ns $
)
60
80
100
120
140
Em
plo
ym
en
t (T
ho
usan
ds)
GDP Employment
Note: GDP is adjusted at annual rates. Employment is unadjusted.
ONTARIO ECONOMIC OVERVIEW – SEPTEMBER 2011 UPDATE 5
U.S. market increased 12.8% in June 2011 YTD compared to the same period a year ago.37 Retail sales in the first six months of the year improved for many automakers, lessening their reliance on fleet volumes.38 However, the seasonally adjusted annual rate (SAAR) dropped to 11.9M units in May and 11.4M units in June, well below the 13M unit rate expected for the full year.39 The slowdown was primarily due to inventory shortages from Japanese automakers following the March earthquake and tsunami in Japan which crippled production. Higher fuel prices, reduced sales incentives and persistent unemployment in the U.S. economy also contributed to weaker sales.40 As such, some auto analysts have reduced forecasts for full year 2011 U.S. light vehicle sales to approximately 12.5M units.41 New vehicle sales are expected to improve in the second half of the year, as inventories of Japanese automakers return to normal levels and incentive campaigns are renewed by all major auto manufacturers.42 Light vehicle sales in Canada rose 3% in June 2011 YTD compared to last year and are expected to reach 1.59M units for the full year, a level consistent with the 10-year average.43 North American auto production was up 7.8% for the first half of 201144 compared to a year ago, as June marked the 20th straight month with a year-over-year production increase.45 Automotive production in Canada declined by 1.5% during the first six months, however, in large part because production was reduced 56% by Toyota and 31% by Honda at their Canadian plants in Q2.46 General Motors (GM) continued to advance in the U.S. market. U.S light vehicle sales were up 17% for June 2011 YTD,47 with strong retail sales of new cars and trucks, including Canadian-built models such as the Chevrolet Equinox, GMC Terrain, Camaro and new Buick Regal.48 GM reported a US$2.5B net profit for Q2 2011, its largest quarterly operating profit since emerging from bankruptcy.49 In Canada, GM’s production rose 31.6% for the first half 2011 compared to the same period last year.50 The company recently announced a $117M investment to build the new Cadillac XTS at its Oshawa flex assembly line, with production beginning in 2012.51 In July, GM Canada also officially opened its Automotive Centre of Excellence (ACE) at the University of Ontario Institute of Technology in Oshawa. This R&D innovation and testing centre includes one of the largest and most advanced climatic wind tunnels in the world.52 Light vehicle sales at Ford Motor Company were up 9% for June 2011 YTD versus the same period in 2010.53 The company credited strong demand for its
fuel-efficient car and truck line-up.54 In Canada, Ford had its strongest June sales performance in 22 years.55 Compared to 2010, Ford’s Canadian output fell by 2.2% during the first six months of the year, due in part to the winding down of its St. Thomas operation.56 The company recently confirmed plans to manufacture cylinder blocks for the 5.0-litre V8 at Ford's Essex Engine plant. Production of the engine blocks, which currently come from a plant in Michigan, will add up to 80 new jobs.57 Ford posted a $2.4B Q2 profit, down 8% from a year earlier.58 Chrysler Group LLC’s U.S. light vehicle sales improved significantly in the first half of 2011, up 21.4% compared to the same time last year.59 While Chrysler relied heavily on fleet sales in the past, its recent sales improvement comes mostly from strong retail volumes.60 Chrysler’s Canadian output was down 9.1% for the first half of the year, with lower production at both the Brampton and Windsor facilities.61 Fiat recently increased its stake in Chrysler to 53.5%, after completing the purchase of the U.S. government’s remaining 6% share, as well as the remaining 1.5% share held by the governments of Canada and Ontario.62 Chrysler Group reported a Q2 loss of $370M, largely as a result of repaying its government debts from the 2009 bailout and bankruptcy.63 In June the Windsor-built Town and Country and the Brampton-made Dodge Challenger earned the highest rank for initial quality in the J.D. Power and Associates annual survey.64 Toyota Motor Co. posted a 4% decline in its U.S. light vehicle sales for the first half of 2011 compared to the same time last year.65 Production disruptions and vehicle shortages following the Japanese earthquake and tsunami contributed to U.S. sales declines of 33% in May and 21% in June.66 Toyota’s total Canadian factory output was down 16% for June 2011YTD compared to the same period last year, with June production down significantly year-over-year at both the Cambridge (-42%) and Woodstock (-76%) operations.67 Since the Japan disaster in March, Toyota, like other Japanese automakers, has restored parts supplies and production. Toyota confirmed that all its North American plants would be at full production levels by September.68 The automaker posted a net profit for Q2, citing a stronger than expected recovery. Despite challenges from a rising yen, Toyota raised its full year profit forecast nearly 40% from earlier this year.69 In Canada, Toyota announced it would manufacture the RAV4 electric vehicle at its Woodstock plant as part of the company’s Project Green Light, which also includes a major upgrade to the paint shop at its Cambridge plant. Toyota plans to invest up to $506M in the
ONTARIO ECONOMIC OVERVIEW – SEPTEMBER 2011 UPDATE 6
project, while the Canadian and Ontario governments each contributed $70.8M.70 U.S. light vehicle sales for Honda Motor Co. were also significantly affected by the Japan earthquake. Compared to the same period in 2010, the company posted a small gain of 2.3% for June 2011 YTD, but monthly sales were down sharply in May (-22.5%) and in June (-21.3%).71 Honda expected its North American factories to restore production levels by August for all vehicle models, except the new Civic which is built in Alliston, Ontario, and Greensburg, Indiana.72 The Alliston plant is expected to return to full operation in September.73 The spring launch of the redesigned 2012 Civic suffered from supply disruptions and Honda plans to re-launch the vehicle in the fall.74 Despite gloomier economic forecasts, auto parts manufacturers anticipate an increase in vehicle production volumes for the second half of the year. Suppliers expect increased output from Japanese automakers as they replenish inventories, and from the Detroit Three automakers which have improved market share.75 However, the industry remains concerned that some second and third tier manufacturers may not be able to sustain a sharp rise in production demand, leading to further supplier consolidation.76 Higher raw material costs and currency pressures, including a strong Canadian dollar, will continue to negatively affect supplier profitability.77 AEROSPACE
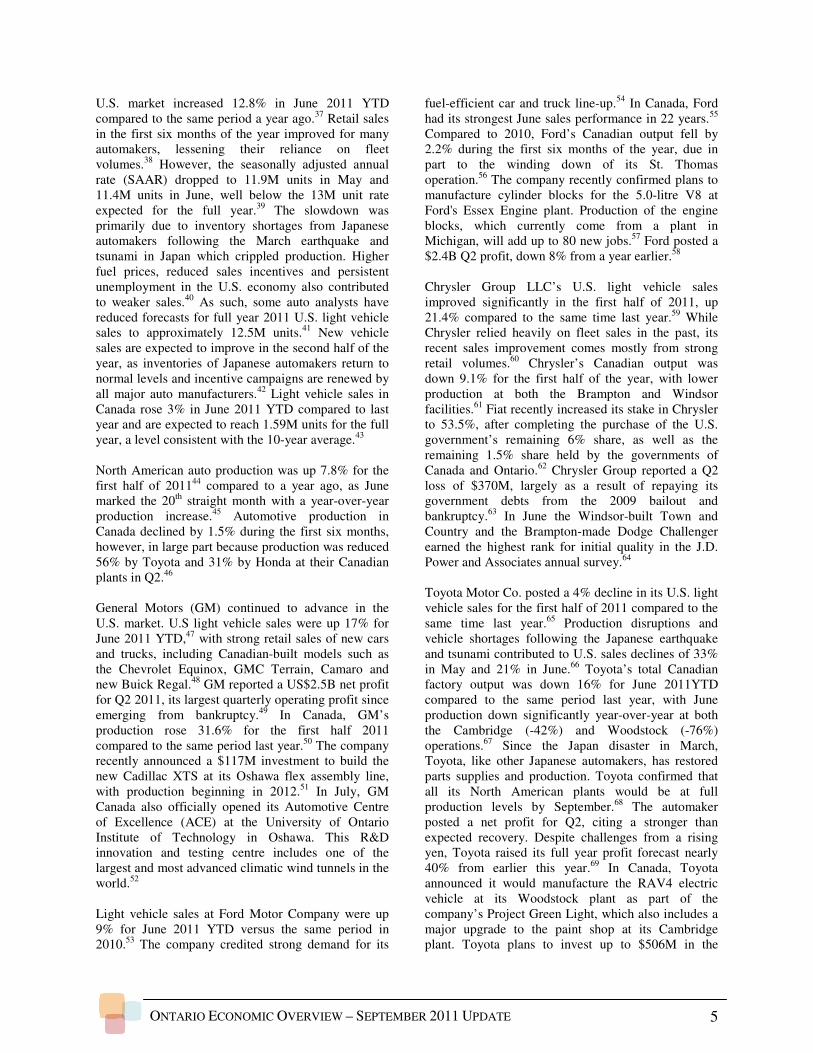
Ontario’s aerospace industry, which produces aircraft parts and systems, accounted for 28.1% of Canadian aerospace GDP in 2010, second in Canada behind Quebec (59.8%).78 79 There are approximately 200
aerospace companies in Ontario, including Bombardier Aerospace, Pratt & Whitney Canada, Honeywell Canada, L-3 Electronic Systems, Magellan, and Northstar Aerospace.80 While Ontario’s share of national GDP in 2010 was up slightly from 27.7% in 2009, this increase was the result of Ontario’s aerospace production declining less than Canada’s production; the sector’s GDP fell 9.0% nationally and 7.6% in Ontario.81 82 Exports also dropped slightly in Q1 2011, down 1.1% from Q1 2010.83 Employment, however, was up 2.3% in Q1 2011 in Ontario compared to Q1 2010.84 Aerospace shipments were also higher, increasing 4.8% for the period.85 Bombardier’s recent annual forecast projected a smaller business jet market globally with deliveries of 24,000 units (valued at $626B) over the next 20 years. Its own share was forecast at 10,000 units ($260B) in the next ten years and then 14,000 ($366B) in the following ten years. The company predicted improvements in the global commercial airliner market to 13,100 deliveries in the 20-149 seat sector (valued at $693B through 2030), with growing demand in China and India and increased interest in new technology. Bombardier estimated its share of the 100-149 seat range aircraft at 7,000 units ($423.7B) over the next 20 years; 5,800 units ($208.6B) in the 60-99 seat category; and 300 ($6.5B) in the 20-59 seat category. The company is planning new products in order to be ready when business conditions improve. Bombardier’s forecast echoed those of others in the business.86 Peterborough-based Flying Colours, which completes and maintains private jets for Bombardier, has also benefited from improving economic conditions. Although the company was affected by the recession, sales have recently been growing. Flying Colours is now looking to Asia (specifically China and India) and the Middle East as potential long-term markets. The company hopes to capitalize on the recent runway upgrade at Peterborough airport to finish larger aircraft such as the Global from Bombardier and corporate jets from Airbus and Boeing.87 Heroux-Devtek Inc., a designer and builder of aircraft landing gear and structural parts, has also been booking new orders as a result of increases in the production of some commercial aircraft programs.88 News for the aerospace sector this quarter has mainly been driven by the industry’s success at the 2011 International Paris Air Show held June 20 to 26 at Le Bourget Airport, Paris, France. Highlights for Ontario
Aerospace Employment, Quarterly
8
9
10
11
Q1 Q2 Q3 Q4 Q1 Q2 Q3 Q4 Q1 Q2 Q3 Q4 Q1
2008 2009 2010 2011
Em
plo
ym
en
t (T
ho
usan
ds)
Employment
Note: Employment is unadjusted.
ONTARIO ECONOMIC OVERVIEW – SEPTEMBER 2011 UPDATE 7
companies included: an order by Korean Air for ten Bombardier CSeries planes valued at US$1.01B, with an additional ten options and ten purchase rights on Bombardier CS300 airliners; an order by VistaJet of Switzerland for ten Bombardier Global 8000 jets valued at US$650M; and an order by AVWest of Australia for four Bombardier Global 7000 and two Global 8000 ultra long-range jets, totalling about US$400M.89 Boeing’s planned 737 narrowbody aircraft featuring a more efficient Leap-X engine could increase competition for Bombardier’s CSeries. The recently launched Airbus A319neo may also challenge the CSeries. Though American Airlines chose Boeing and Airbus for its new orders, Bombardier hopes that Delta will order CSeries jets.90
The Ontario government announced several investments in the aerospace sector in Q2 2011. In June, the Ministry of Training, Colleges and Universities announced an investment of $2M in the University of Windsor toward a state-of-the-art clean room to allow students to conduct controlled-environment research.91 In July, the Ministry of Research and Innovation announced a planned $1.9M through the Innovation Demonstration Fund for Messier-Dowty’s development of green processes for applying and removing chemical coatings from landing gear.92 BIOTECHNOLOGY AND PHARMACEUTICAL
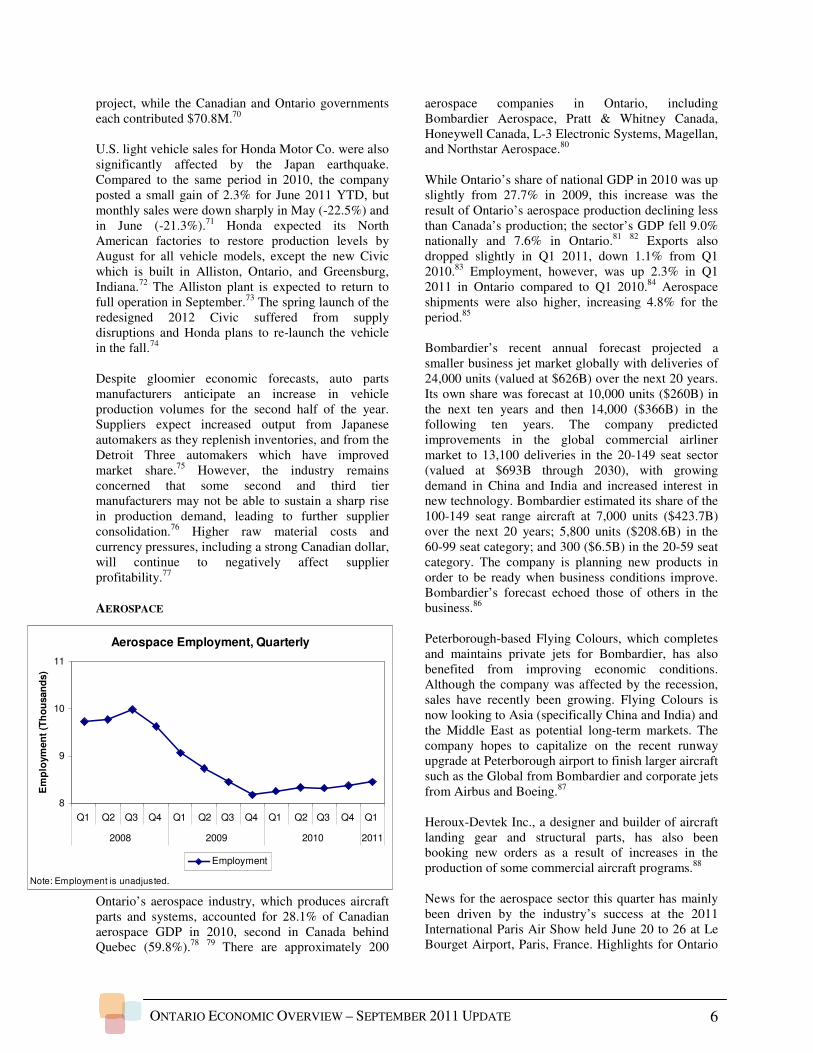
Ontario’s pharmaceutical and bio-technology industries employ more than 16,000 people, generate close to $10B in annual revenue and are comprised of major companies such as Bayer, GlaxoSmithKline, Pfizer, Amgen and Sanofi Pasteur Ltd. Ontario’s
medical and assistive devices industry is comprised of approximately 700 companies employing more than 20,000 people while producing close to $4B in revenue.93 These companies continue to face a demanding business environment driven by expiring patents, reduced R&D spending, and potential intellectual property (IP) regulatory reform. The output for Canada’s pharmaceutical and medicine manufacturing sector, of which Ontario accounts for over 60%, dropped by 3.6% in Q1 2011 compared to Q4 2010, the fourth consecutive decrease. While the quarterly decrease is less severe than the previous quarter’s drop, output for Q1 2011 was 15.7% lower than the same quarter in 2010.94 Ontario’s pharmaceutical shipments also fell, dropping by $157M, or 9.8%, in Q1 2011 compared to the previous year.95 While Ontario’s pharmaceutical and medicine exports increased by 2.2% in Q1, they were down 8% YTD as of May 2011. Comparatively, national exports for the same category were down 19% YTD.96 Looking forward, the Conference Board of Canada’s Leading Indicator of Industry Profitability for the national pharmaceutical sector, which predicts short-term movements in corporate profitability, was down for the fourth consecutive month.97 Ontario’s average employment in the sector dropped by 0.7% (just over 100 jobs) in Q1; this was the eighth consecutive year-over-year quarterly drop.98 Venture capital (VC) funding for Ontario’s life sciences industries continues to lag following the 63.3% decrease in funding in 2009 from 2008 levels. Funding in 2010 was $85.2M, well behind the high of $189.0M invested in 2007. Funding for Q1 2011 totalled $20.1M, a 37.4% decrease from Q1 2010 but a 41.7% increase from Q4 2010. Funding for Ontario’s biopharmaceuticals sub-sector decreased by 54.1% from Q1 2010, but only dropped 4.7% from the previous quarter.99 Toronto-based medical device company Profound Medical announced in June that it raised $9.4M in VC funding for advance clinical trials.100 Profound Medical was also one of four Ontario bioscience companies awarded up to $1M from the provincial government’s Investment Accelerator Fund to finance clinical trials and facilitate commercialization. The funds are part of $7M in single round special financing for Ontario-based bioscience companies.101 Ontario’s life sciences sector stands to gain a boost from the province’s recent announcement of a partnership with Quebec. The two provinces are creating the Québec-Ontario Life Sciences Corridor, a key initiative of the Ontario-Québec Trade and Cooperation Agreement. The trade corridor will
Pharmaceutical and Medicine Manufacturing
Employment, Quarterly
14000
14500
15000
15500
16000
16500
17000
Q1 Q2 Q3 Q4 Q1 Q2 Q3 Q4 Q1 Q2 Q3 Q4 Q1
2008 2009 2010 2011
Em
plo
ym
en
t
Employment
Note: Employment is unadjusted.
ONTARIO ECONOMIC OVERVIEW – SEPTEMBER 2011 UPDATE 8
contain 1,139 life sciences companies and approximately 65,000 employees, making it one of the largest bioclusters in the world.102 In conjunction with the corridor announcement, Life Sciences Ontario and BiopolisQuébec, the alliance of leading life sciences regions in Quebec, signed a memorandum of understanding (MOU) that outlines measures for the sharing of best practices, the identification of joint projects and the defining of growth strategies.103 The provincial government also announced in June $3.6M in funding for GlaxoSmithKline’s expansion of its manufacturing facility in Mississauga. The $30M plus expansion is expected to create 70 new jobs.104 INFORMATION AND COMMUNICATIONS
TECHNOLOGY
The ICT sector is a significant contributor to Ontario’s economy. Approximately 50% of Canada’s total ICT industry is located in Ontario and more than 16,000 ICT firms are concentrated mainly in three large Ontario technology clusters: Toronto, Ottawa and Kitchener-Waterloo.105 Ontario also has the highest concentration of ICT industry leaders in Canada such as IBM Canada, RIM, Rogers, Celestica and OpenText. In addition, Ontario’s ICT sector is an enabling sector which significantly increases the productivity of other industries. The Canadian ICT sector grew 0.5% in Q1 2011 over Q4 2010, its sixth consecutive quarterly increase. In comparison, real GDP for all Canadian industries grew by 1.0% for the period.106 Ontario’s ICT sector contributed $27.3B to Ontario’s GDP in 2010, accounting for 5.6%. After falling 1.2% in 2009, the province’s ICT output rose 2.3%, based mainly on 10.3% growth in ICT manufacturing.107,108 Canada’s ICT output, of which Ontario accounts for
almost half, continued to grow in Q1 2011, rising 0.7% over Q4 2010.109 Ontario’s ICT manufacturing shipments in Q1 2011 were up 7.0% over Q1 2010.110 ICT manufacturing exports were also higher for the period, rising 1.7% based mainly on continued strong growth in exports to Hong Kong.111 While the Canadian ICT sector continued to trend upwards following the recession, growing 5.8% since Q3 2009, weak export numbers have stalled job growth. However, after eight consecutive quarters in which employment declined or remained flat, employment in Ontario’s ICT industry was up 0.8% in Q1 2011 compared to Q1 2010. Despite job losses in manufacturing, overall employment was up due to an increase in services employment.112 Through the first two quarters of 2011, there were 100 venture capital (VC) investments in the ICT sector in Ontario worth a total of $180.4M. These figures represent a 9.9% drop in the number of investments in the sector, but an 18.4% increase in the amount invested compared to the first two quarters of 2010. Most of the investment was concentrated in the software and internet focused sub-sectors. The ICT sector accounted for 70.8% of VC invested over the period, up from 67.6% in the same period of 2010.113 RIM has faced serious competition from Apple’s iPhone and Google’s Android platforms this year, contributing to declines in market share, revenues, and share value. The company’s Q1 2011 share of the global smartphone market was 14%, down from 19% in Q1 2010, placing RIM third behind Apple and Nokia (measured by shipments).114 RIM’s shipments grew 31% over the period, compared to 80% for the smartphone market overall.115 From the release of fiscal 2011 Q4 results in March 2011 until July 28, RIM’s share price declined by 61%, reducing the company’s market capitalization to $12.6B.116 RIM reported revenues for Q1 (ending May 31, 2011) of its fiscal year 2012 of US$4.9B, down 11.7% from the previous quarter. Net income was down 25.6% to US$695M.117 To explain the decline in revenue, RIM indicated that sales had shifted towards lower average selling price (ASP) handsets and that sales had been lower than expected in the US and Latin America, reducing smartphone shipments.118 RIM planned the introduction of the BlackBerry 7 handsets in late August which, the company hoped, would improve sales. The first BlackBerry QNX-based Superphone should be available in early 2012. Meanwhile 4G PlayBook tablets are expected in the fall. Revenue for
ICT Employment, Quarterly
220
225
230
235
240
245
Q1 Q2 Q3 Q4 Q1 Q2 Q3 Q4 Q1 Q2 Q3 Q4 Q1
2008 2009 2010 2011
Em
plo
ym
en
t (T
ho
usan
ds)
Employment
Note: Employment is unadjusted.
ONTARIO ECONOMIC OVERVIEW – SEPTEMBER 2011 UPDATE 9
Q2 of fiscal 2012 (ending August 31, 2011) is expected to be in the range of US$4.2B to US$4.8B.119 In an effort to remain competitive, RIM announced plans to cut 11% of its global workforce (2,000 jobs) and change its senior management structure. The company’s first major layoffs in almost a decade would reduce RIM’s workforce to 17,000.120 Ontario’s Ministry of Training, Colleges and Universities announced it would allocate $100,000 directly to Communitech for retraining and job search support for the laid-off RIM workers.121
RIM, as part of a consortium of companies, agreed in July to acquire the remaining patents and patent applications of Nortel Networks for US$4.5B. RIM’s share of the purchase price was US$770M and the transaction was expected to close in Q3 2011. 122
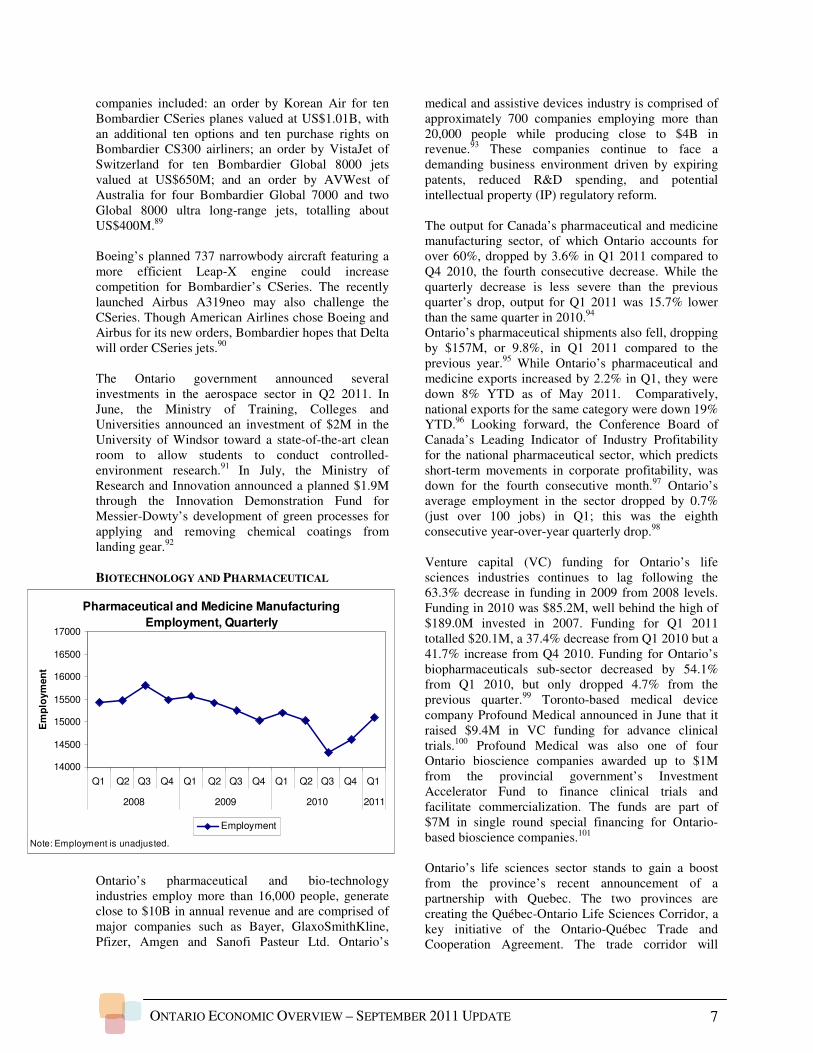
FINANCE AND INSURANCE With 2010 output of $31.9B, the finance and insurance sector in Ontario accounted for 6.6% of the province’s overall GDP and 38.2% of Canada’s finance and insurance GDP.123 124 Nationally, GDP was up 1.0% in Q1 2011 over the previous quarter, to nearly $85B annualized.125
Employment in the sector averaged just over 300,000 jobs in Ontario in 2010, up 0.8% from 2009.126 In Q1 2011, however, employment dropped by roughly 1% from Q1 2010 due to job losses in the insurance sub-sector.127 Most of the province’s financial services jobs are in Toronto, home to the headquarters of many of the larger financial services firms.128 In the most recent Global Financial Centres Index, Toronto tied for 10th position among global financial centres and was categorized as one of nine “Global Leaders”
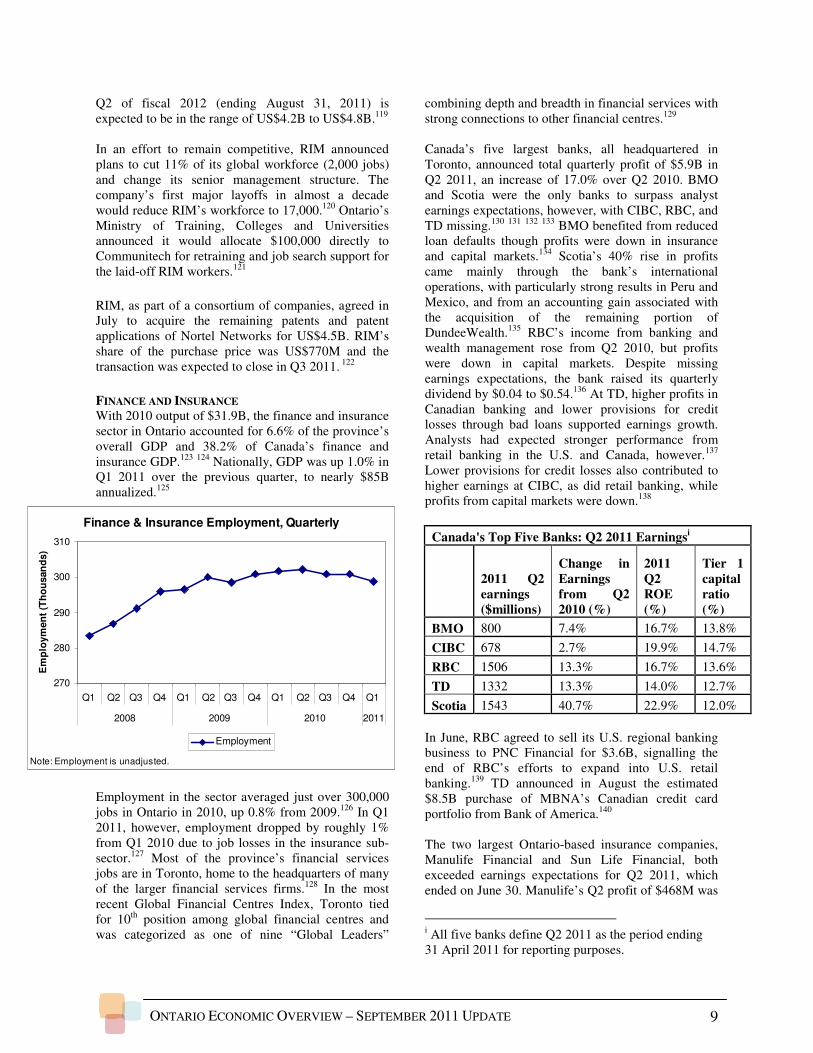
combining depth and breadth in financial services with strong connections to other financial centres.129 Canada’s five largest banks, all headquartered in Toronto, announced total quarterly profit of $5.9B in Q2 2011, an increase of 17.0% over Q2 2010. BMO and Scotia were the only banks to surpass analyst earnings expectations, however, with CIBC, RBC, and TD missing.130 131 132 133 BMO benefited from reduced loan defaults though profits were down in insurance and capital markets.134 Scotia’s 40% rise in profits came mainly through the bank’s international operations, with particularly strong results in Peru and Mexico, and from an accounting gain associated with the acquisition of the remaining portion of DundeeWealth.135 RBC’s income from banking and wealth management rose from Q2 2010, but profits were down in capital markets. Despite missing earnings expectations, the bank raised its quarterly dividend by $0.04 to $0.54.136 At TD, higher profits in Canadian banking and lower provisions for credit losses through bad loans supported earnings growth. Analysts had expected stronger performance from retail banking in the U.S. and Canada, however.137 Lower provisions for credit losses also contributed to higher earnings at CIBC, as did retail banking, while profits from capital markets were down.138
In June, RBC agreed to sell its U.S. regional banking business to PNC Financial for $3.6B, signalling the end of RBC’s efforts to expand into U.S. retail banking.139 TD announced in August the estimated $8.5B purchase of MBNA’s Canadian credit card portfolio from Bank of America.140 The two largest Ontario-based insurance companies, Manulife Financial and Sun Life Financial, both exceeded earnings expectations for Q2 2011, which ended on June 30. Manulife’s Q2 profit of $468M was
i All five banks define Q2 2011 as the period ending 31 April 2011 for reporting purposes.
Canada's Top Five Banks: Q2 2011 Earningsi
2011 Q2 earnings ($millions)
Change in Earnings from Q2 2010 (%)
2011 Q2 ROE (%)
Tier 1 capital ratio (%)
BMO 800 7.4% 16.7% 13.8%
CIBC 678 2.7% 19.9% 14.7%
RBC 1506 13.3% 16.7% 13.6%
TD 1332 13.3% 14.0% 12.7%
Scotia 1543 40.7% 22.9% 12.0%
Finance & Insurance Employment, Quarterly
270
280
290
300
310
Q1 Q2 Q3 Q4 Q1 Q2 Q3 Q4 Q1 Q2 Q3 Q4 Q1
2008 2009 2010 2011
Em
plo
ym
en
t (T
ho
usan
ds)
Employment
Note: Employment is unadjusted.
ONTARIO ECONOMIC OVERVIEW – SEPTEMBER 2011 UPDATE 10
supported by strong mutual fund sales in Canada and growth in mutual fund deposits in the U.S.141 Sun Life’s quarterly profit of $408M was aided by its U.S. operations and investments.142 The company also announced that its CEO since 1998, Donald Stewart, would retire in November and be replaced by current COO, Dean Connor.143 The TMX Group, owners of the Toronto Stock Exchange, and the London Stock Exchange (LSE) announced plans to merge in February. In May, amid concern that control of the merged exchange would reside in London, a group of Canadian financial institutions called the Maple Group launched a competing bid for the TMX Group.144 After both groups raised their offers for the TMX Group in June,145 it became clear that TMX shareholders would not approve the proposed LSE merger in a vote scheduled for June 30. As a result, the merger plans were abandoned. Maple Group expressed interest in pursuing a friendly deal with TMX and to merge it with Canada’s second largest exchange, the Alpha Group, which is owned by many members of the Maple Group.146 CONSTRUCTION
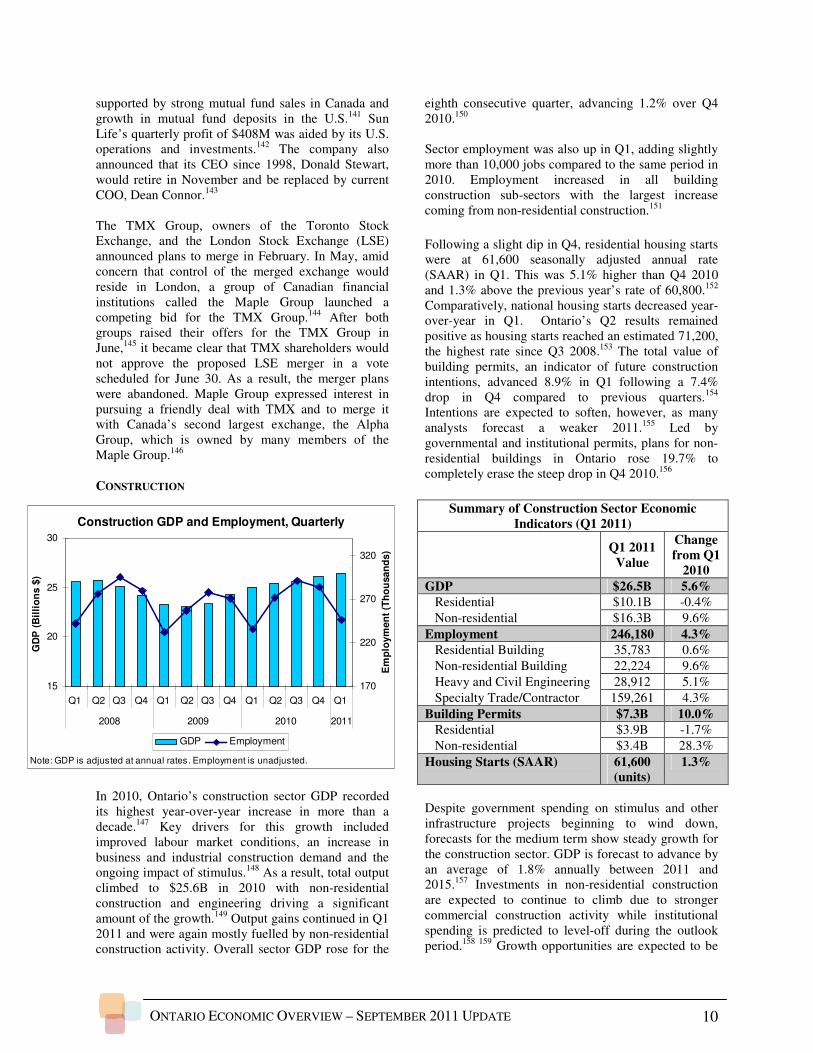
In 2010, Ontario’s construction sector GDP recorded its highest year-over-year increase in more than a decade.147 Key drivers for this growth included improved labour market conditions, an increase in business and industrial construction demand and the ongoing impact of stimulus.148 As a result, total output climbed to $25.6B in 2010 with non-residential construction and engineering driving a significant amount of the growth.149 Output gains continued in Q1 2011 and were again mostly fuelled by non-residential construction activity. Overall sector GDP rose for the
eighth consecutive quarter, advancing 1.2% over Q4 2010.150 Sector employment was also up in Q1, adding slightly more than 10,000 jobs compared to the same period in 2010. Employment increased in all building construction sub-sectors with the largest increase coming from non-residential construction.151
Following a slight dip in Q4, residential housing starts were at 61,600 seasonally adjusted annual rate (SAAR) in Q1. This was 5.1% higher than Q4 2010 and 1.3% above the previous year’s rate of 60,800.152 Comparatively, national housing starts decreased year-over-year in Q1. Ontario’s Q2 results remained positive as housing starts reached an estimated 71,200, the highest rate since Q3 2008.153 The total value of building permits, an indicator of future construction intentions, advanced 8.9% in Q1 following a 7.4% drop in Q4 compared to previous quarters.154 Intentions are expected to soften, however, as many analysts forecast a weaker 2011.155 Led by governmental and institutional permits, plans for non-residential buildings in Ontario rose 19.7% to completely erase the steep drop in Q4 2010.156
Summary of Construction Sector Economic Indicators (Q1 2011)
Q1 2011
Value
Change from Q1
2010
GDP $26.5B 5.6% Residential $10.1B -0.4%
Non-residential $16.3B 9.6%
Employment 246,180 4.3% Residential Building 35,783 0.6%
Non-residential Building 22,224 9.6%
Heavy and Civil Engineering 28,912 5.1%
Specialty Trade/Contractor 159,261 4.3%
Building Permits $7.3B 10.0% Residential $3.9B -1.7%
Non-residential $3.4B 28.3%
Housing Starts (SAAR) 61,600 (units)
1.3%
Despite government spending on stimulus and other infrastructure projects beginning to wind down, forecasts for the medium term show steady growth for the construction sector. GDP is forecast to advance by an average of 1.8% annually between 2011 and 2015.157 Investments in non-residential construction are expected to continue to climb due to stronger commercial construction activity while institutional spending is predicted to level-off during the outlook period.158 159 Growth opportunities are expected to be
Construction GDP and Employment, Quarterly
15
20
25
30
Q1 Q2 Q3 Q4 Q1 Q2 Q3 Q4 Q1 Q2 Q3 Q4 Q1
2008 2009 2010 2011
GD
P (
Bil
lio
ns $
)
170
220
270
320
Em
plo
ym
en
t (T
ho
usan
ds)
GDP Employment
Note: GDP is adjusted at annual rates. Employment is unadjusted.
ONTARIO ECONOMIC OVERVIEW – SEPTEMBER 2011 UPDATE 11
concentrated in the Greater Toronto Area,160 due in large part to the projected $2.4B investment costs associated with hosting the 2015 Pan/Parapan American Games. 161 And while input costs such as labour and materials are rising along with demand,162 Canada is poised to become the fifth largest construction market by 2020163 with some high-profile projects in Ontario related to the energy, transportation and mining all contributing to improved private investment in the medium term.164 TOURISM
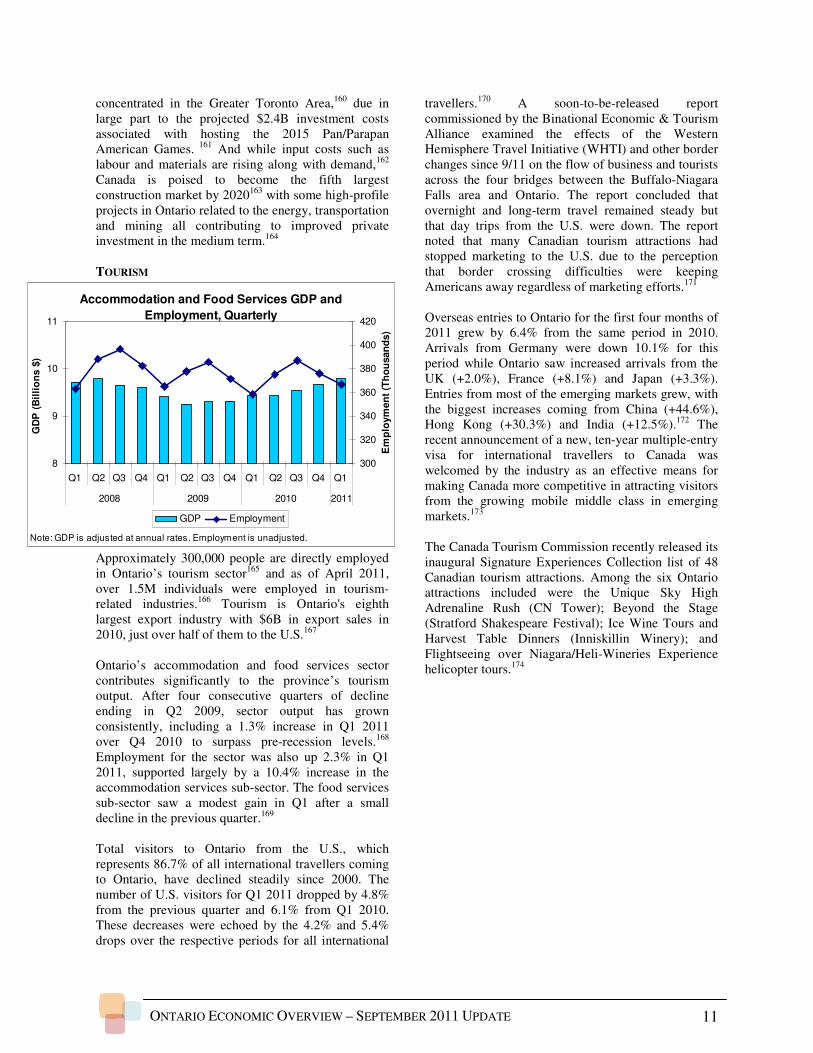
Approximately 300,000 people are directly employed in Ontario’s tourism sector165 and as of April 2011, over 1.5M individuals were employed in tourism-related industries.166 Tourism is Ontario's eighth largest export industry with $6B in export sales in 2010, just over half of them to the U.S.167 Ontario’s accommodation and food services sector contributes significantly to the province’s tourism output. After four consecutive quarters of decline ending in Q2 2009, sector output has grown consistently, including a 1.3% increase in Q1 2011 over Q4 2010 to surpass pre-recession levels.168 Employment for the sector was also up 2.3% in Q1 2011, supported largely by a 10.4% increase in the accommodation services sub-sector. The food services sub-sector saw a modest gain in Q1 after a small decline in the previous quarter.169 Total visitors to Ontario from the U.S., which represents 86.7% of all international travellers coming to Ontario, have declined steadily since 2000. The number of U.S. visitors for Q1 2011 dropped by 4.8% from the previous quarter and 6.1% from Q1 2010. These decreases were echoed by the 4.2% and 5.4% drops over the respective periods for all international
travellers.170 A soon-to-be-released report commissioned by the Binational Economic & Tourism Alliance examined the effects of the Western Hemisphere Travel Initiative (WHTI) and other border changes since 9/11 on the flow of business and tourists across the four bridges between the Buffalo-Niagara Falls area and Ontario. The report concluded that overnight and long-term travel remained steady but that day trips from the U.S. were down. The report noted that many Canadian tourism attractions had stopped marketing to the U.S. due to the perception that border crossing difficulties were keeping Americans away regardless of marketing efforts.171 Overseas entries to Ontario for the first four months of 2011 grew by 6.4% from the same period in 2010. Arrivals from Germany were down 10.1% for this period while Ontario saw increased arrivals from the UK (+2.0%), France (+8.1%) and Japan (+3.3%). Entries from most of the emerging markets grew, with the biggest increases coming from China (+44.6%), Hong Kong (+30.3%) and India (+12.5%).172 The recent announcement of a new, ten-year multiple-entry visa for international travellers to Canada was welcomed by the industry as an effective means for making Canada more competitive in attracting visitors from the growing mobile middle class in emerging markets.173 The Canada Tourism Commission recently released its inaugural Signature Experiences Collection list of 48 Canadian tourism attractions. Among the six Ontario attractions included were the Unique Sky High Adrenaline Rush (CN Tower); Beyond the Stage (Stratford Shakespeare Festival); Ice Wine Tours and Harvest Table Dinners (Inniskillin Winery); and Flightseeing over Niagara/Heli-Wineries Experience helicopter tours.174
Accommodation and Food Services GDP and
Employment, Quarterly
8
9
10
11
Q1 Q2 Q3 Q4 Q1 Q2 Q3 Q4 Q1 Q2 Q3 Q4 Q1
2008 2009 2010 2011
GD
P (
Bil
lio
ns $
)
300
320
340
360
380
400
420
Em
plo
ym
en
t (T
ho
usan
ds)
GDP Employment
Note: GDP is adjusted at annual rates. Employment is unadjusted.
ONTARIO ECONOMIC OVERVIEW – SEPTEMBER 2011 UPDATE 12
RETAIL AND WHOLESALE TRADE
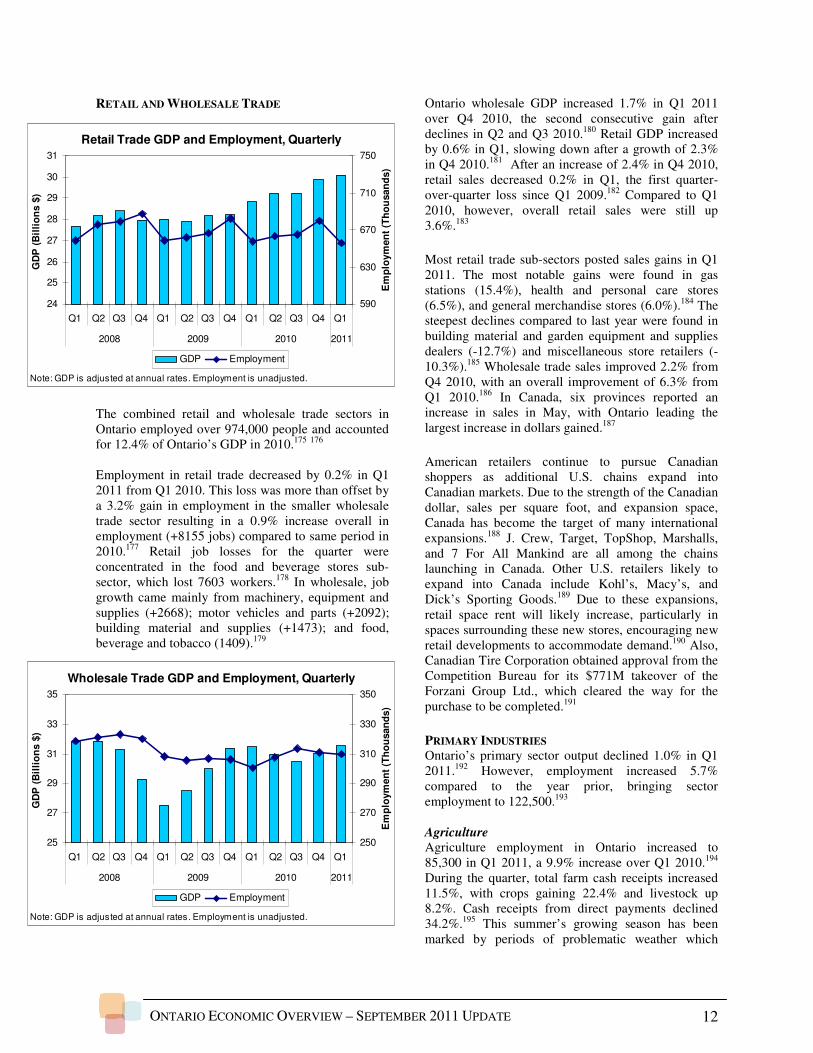
The combined retail and wholesale trade sectors in Ontario employed over 974,000 people and accounted for 12.4% of Ontario’s GDP in 2010.175 176 Employment in retail trade decreased by 0.2% in Q1 2011 from Q1 2010. This loss was more than offset by a 3.2% gain in employment in the smaller wholesale trade sector resulting in a 0.9% increase overall in employment (+8155 jobs) compared to same period in 2010.177 Retail job losses for the quarter were concentrated in the food and beverage stores sub-sector, which lost 7603 workers.178 In wholesale, job growth came mainly from machinery, equipment and supplies (+2668); motor vehicles and parts (+2092); building material and supplies (+1473); and food, beverage and tobacco (1409).179
Ontario wholesale GDP increased 1.7% in Q1 2011 over Q4 2010, the second consecutive gain after declines in Q2 and Q3 2010.180 Retail GDP increased by 0.6% in Q1, slowing down after a growth of 2.3% in Q4 2010.181 After an increase of 2.4% in Q4 2010, retail sales decreased 0.2% in Q1, the first quarter-over-quarter loss since Q1 2009.182 Compared to Q1 2010, however, overall retail sales were still up 3.6%.183
Most retail trade sub-sectors posted sales gains in Q1 2011. The most notable gains were found in gas stations (15.4%), health and personal care stores (6.5%), and general merchandise stores (6.0%).184 The steepest declines compared to last year were found in building material and garden equipment and supplies dealers (-12.7%) and miscellaneous store retailers (-10.3%).185 Wholesale trade sales improved 2.2% from Q4 2010, with an overall improvement of 6.3% from Q1 2010.186 In Canada, six provinces reported an increase in sales in May, with Ontario leading the largest increase in dollars gained.187
American retailers continue to pursue Canadian shoppers as additional U.S. chains expand into Canadian markets. Due to the strength of the Canadian dollar, sales per square foot, and expansion space, Canada has become the target of many international expansions.188 J. Crew, Target, TopShop, Marshalls, and 7 For All Mankind are all among the chains launching in Canada. Other U.S. retailers likely to expand into Canada include Kohl’s, Macy’s, and Dick’s Sporting Goods.189 Due to these expansions, retail space rent will likely increase, particularly in spaces surrounding these new stores, encouraging new retail developments to accommodate demand.190 Also, Canadian Tire Corporation obtained approval from the Competition Bureau for its $771M takeover of the Forzani Group Ltd., which cleared the way for the purchase to be completed.191
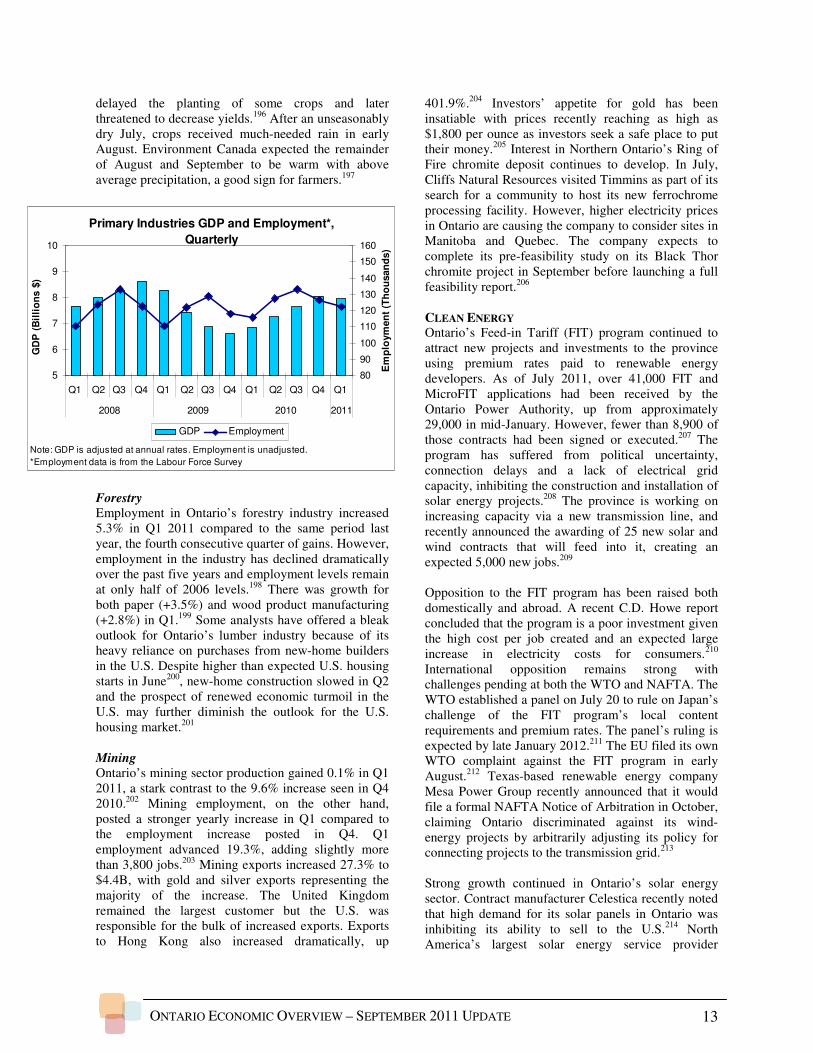
PRIMARY INDUSTRIES Ontario’s primary sector output declined 1.0% in Q1 2011.192 However, employment increased 5.7% compared to the year prior, bringing sector employment to 122,500.193 Agriculture
Agriculture employment in Ontario increased to 85,300 in Q1 2011, a 9.9% increase over Q1 2010.194 During the quarter, total farm cash receipts increased 11.5%, with crops gaining 22.4% and livestock up 8.2%. Cash receipts from direct payments declined 34.2%.195 This summer’s growing season has been marked by periods of problematic weather which
Retail Trade GDP and Employment, Quarterly
24
25
26
27
28
29
30
31
Q1 Q2 Q3 Q4 Q1 Q2 Q3 Q4 Q1 Q2 Q3 Q4 Q1
2008 2009 2010 2011
GD
P (
Bil
lio
ns $
)
590
630
670
710
750
Em
plo
ym
en
t (T
ho
usan
ds)
GDP Employment
Note: GDP is adjusted at annual rates. Employment is unadjusted.
Wholesale Trade GDP and Employment, Quarterly
25
27
29
31
33
35
Q1 Q2 Q3 Q4 Q1 Q2 Q3 Q4 Q1 Q2 Q3 Q4 Q1
2008 2009 2010 2011
GD
P (
Bil
lio
ns $
)
250
270
290
310
330
350
Em
plo
ym
en
t (T
ho
usan
ds)
GDP Employment
Note: GDP is adjusted at annual rates. Employment is unadjusted.
ONTARIO ECONOMIC OVERVIEW – SEPTEMBER 2011 UPDATE 13
delayed the planting of some crops and later threatened to decrease yields.196 After an unseasonably dry July, crops received much-needed rain in early August. Environment Canada expected the remainder of August and September to be warm with above average precipitation, a good sign for farmers.197
Forestry
Employment in Ontario’s forestry industry increased 5.3% in Q1 2011 compared to the same period last year, the fourth consecutive quarter of gains. However, employment in the industry has declined dramatically over the past five years and employment levels remain at only half of 2006 levels.198 There was growth for both paper (+3.5%) and wood product manufacturing (+2.8%) in Q1.199 Some analysts have offered a bleak outlook for Ontario’s lumber industry because of its heavy reliance on purchases from new-home builders in the U.S. Despite higher than expected U.S. housing starts in June200, new-home construction slowed in Q2 and the prospect of renewed economic turmoil in the U.S. may further diminish the outlook for the U.S. housing market.201 Mining
Ontario’s mining sector production gained 0.1% in Q1 2011, a stark contrast to the 9.6% increase seen in Q4 2010.202 Mining employment, on the other hand, posted a stronger yearly increase in Q1 compared to the employment increase posted in Q4. Q1 employment advanced 19.3%, adding slightly more than 3,800 jobs.203 Mining exports increased 27.3% to $4.4B, with gold and silver exports representing the majority of the increase. The United Kingdom remained the largest customer but the U.S. was responsible for the bulk of increased exports. Exports to Hong Kong also increased dramatically, up
401.9%.204 Investors’ appetite for gold has been insatiable with prices recently reaching as high as $1,800 per ounce as investors seek a safe place to put their money.205 Interest in Northern Ontario’s Ring of Fire chromite deposit continues to develop. In July, Cliffs Natural Resources visited Timmins as part of its search for a community to host its new ferrochrome processing facility. However, higher electricity prices in Ontario are causing the company to consider sites in Manitoba and Quebec. The company expects to complete its pre-feasibility study on its Black Thor chromite project in September before launching a full feasibility report.206 CLEAN ENERGY Ontario’s Feed-in Tariff (FIT) program continued to attract new projects and investments to the province using premium rates paid to renewable energy developers. As of July 2011, over 41,000 FIT and MicroFIT applications had been received by the Ontario Power Authority, up from approximately 29,000 in mid-January. However, fewer than 8,900 of those contracts had been signed or executed.207 The program has suffered from political uncertainty, connection delays and a lack of electrical grid capacity, inhibiting the construction and installation of solar energy projects.208 The province is working on increasing capacity via a new transmission line, and recently announced the awarding of 25 new solar and wind contracts that will feed into it, creating an expected 5,000 new jobs.209 Opposition to the FIT program has been raised both domestically and abroad. A recent C.D. Howe report concluded that the program is a poor investment given the high cost per job created and an expected large increase in electricity costs for consumers.210 International opposition remains strong with challenges pending at both the WTO and NAFTA. The WTO established a panel on July 20 to rule on Japan’s challenge of the FIT program’s local content requirements and premium rates. The panel’s ruling is expected by late January 2012.211 The EU filed its own WTO complaint against the FIT program in early August.212 Texas-based renewable energy company Mesa Power Group recently announced that it would file a formal NAFTA Notice of Arbitration in October, claiming Ontario discriminated against its wind-energy projects by arbitrarily adjusting its policy for connecting projects to the transmission grid.213 Strong growth continued in Ontario’s solar energy sector. Contract manufacturer Celestica recently noted that high demand for its solar panels in Ontario was inhibiting its ability to sell to the U.S.214 North America’s largest solar energy service provider
Primary Industries GDP and Employment*,
Quarterly
5
6
7
8
9
10
Q1 Q2 Q3 Q4 Q1 Q2 Q3 Q4 Q1 Q2 Q3 Q4 Q1
2008 2009 2010 2011
GD
P (
Bil
lio
ns $
)
80
90
100
110
120
130
140
150
160
Em
plo
ym
en
t (T
ho
usan
ds)
GDP Employment
Note: GDP is adjusted at annual rates. Employment is unadjusted.
*Employment data is from the Labour Force Survey
ONTARIO ECONOMIC OVERVIEW – SEPTEMBER 2011 UPDATE 14
SunEdison recently announced a partnership with Newmarket-based solar panel manufacturer Flextronics to increase production, creating 400 new jobs for the area.215 Toronto-based solar panel manufacturer Eclipsall opened a new manufacturing facility in Scarborough in June, which is expected to create 200 jobs.216 A slowdown in business linked to Ontario’s capacity issues and delayed approval process was blamed for Siliken Canada’s recent announcement that it would be cutting two shifts, laying off 70 workers.217 Siliken announced a week later that one of the shifts was recalled and that the other might return in the near future.218 The global wind energy sector grew 22% in 2010, down from 32% in 2009. Growth in the sector is expected to remain strong, resulting in a global industry worth $153B by 2017, up from $56B in 2010.219 Ontario’s wind industry is also expected to experience strong growth in the coming years. According to a recent report by ClearSky Advisors, Ontario’s wind energy sector will attract more than $16B in private-sector investment and create over 80,000 person-years of employment in the next eight years.220 Ottawa-based wind energy company Wind Works Power Corp. recently announced that it had raised $15M in new financing for new and existing projects in Ontario and abroad.221 The company also announced the recent acquisition of two new wind energy projects in Germany, an investment totalling approximately US$50M.222
ECONOMIC ISSUES U.S. ECONOMY The U.S. has highly integrated supply chains with Ontario and is the largest foreign consumer of the province’s goods and services. Exports from Ontario to the U.S. were up 1.2% from Q2 2010 to Q2 2011, reaching over $35B and accounting for just over 80% of Ontario exports. At the same time, Ontario imported $36.6B from the U.S., an increase of 2.0% over Q2 2010 and accounting for 56.7% of Ontario’s imports.223 Following real GDP growth of 3.0% in 2010, U.S. GDP was revised downward in the latest release. According to the second estimates of the second quarter U.S. national accounts, U.S. real GDP increased 1.0% in Q2, down from the advance estimate of 1.3%. Q1 2011 growth was revised down to 0.4% from 1.8% while Q4 2010 growth was adjusted up for final estimates. The latest estimate for Q2 2011 growth marked the eighth consecutive quarter of real growth. Although personal
consumption expenditures were up only 0.4% and spending by state and local governments declined (0.9%), GDP grew thanks to increases in non-residential fixed investment, private inventory, exports, and federal government spending.224 Government employment continued to decline in July 2011, but non-farm payroll actually increased by 117,000 thanks mainly to growing employment in healthcare, retail trade, manufacturing, and professional and technical services. The national unemployment rate dropped slightly from 9.2% in June to 9.1% in July, though this decline was actually the result of a shrinking labour force.225 July’s unemployment rate remained below the October 2009 peak of 10.1% but well above the average rate of 4.6% in 2007.226 Sales in retail and food services were up 0.5% in July over June 2011, though the increase was not statistically significant. Compared to July 2010, sales were up 8.5%. The strongest growth from June to July was in electronics and appliance stores (1.4%), gas stations (1.6%), and miscellaneous store retailers (2.4%).227 In July, with the U.S. government approaching the debt ceiling beyond which it could not incur further debt, negotiations between Republicans and Democrats took place. As discussions continued with no agreement on the terms of an increase to the limit, observers raised concerns over the consequences of the debate and of the potential failure to raise the debt ceiling. Though an agreement was reached on July 31, global financial uncertainty was heightened as a result of the drawn-out nature of the negotiations and the failure to convince markets that there was a plan to effectively address U.S. debt in the longer term.228 229 In response to concerns that the U.S. government was not effectively addressing the country’s debt challenges based on “difficulties in bridging the gulf between the political parties over fiscal policy” that had been highlighted by the debt ceiling negotiations, Standard & Poor’s downgraded its long-term sovereign credit rating for the U.S. from AAA to AA+ on August 5.230 The downgrade, along with the debt ceiling negotiations themselves and continuing fears over the fiscal situation in several European countries, caused additional turmoil in financial markets. The Dow Jones Industrial Average, for example, dropped from a close of 12,724 on July 21 to 10,720 on August 10.231 Consumer sentiment according to the Thomson Reuters/University of Michigan Index also suffered,
ONTARIO ECONOMIC OVERVIEW – SEPTEMBER 2011 UPDATE 15
dropping to a 54.9 in August from 63.7 in July, the lowest level since 1980. The index of consumer expectations also dropped, down from 56 in July to 45.7 in August, suggesting future declines in consumer spending.232 As a result of these recent challenges, a number of forecasters have downgraded their growth projections for the U.S. economy and suggested that the probability of another recession has increased.233 234
ONTARIO ECONOMIC OVERVIEW – SEPTEMBER 2011 UPDATE 16
Canada (total)+ 34,108.8 X 11.4 7.7 -0.5 X 9.8 X 2.5% 1.2 -6.9%
1 Statistics Canada, Population Estimates Red box denotes CMA is performing below the provincial average2 Statistics Canada, Labour Force Survey (LFS) ̂Calculated by using the working age population3 Canada Housing and Mortgage Corporation, Total Housing Starts by CMA + Forecasted GDP at Basic Prices ($2002) - figures not comparable to GDP data used in other sections4 Conference Board of Canada, Metro I and Metro II Economic Indicators ? Ottawa-Gatineau CMA used in GDP and Insolvencies calculations; Ottawa only for rest5 Office of the Superintendent of Bankruptcy Canada, Insolvency Statistics in Canada
NotesSources
Consumer Insolvencies5Employment2
WESTERN
NORTHERN
EASTERN
CENTRAL
Annex: Selected Indicators for Ontario Census Metropolitan Areas (CMAs): Q1 2011
Percentage
of Ontario
Population1
Population
2010
(000s)
GDP4+
Unemployment Rate Insolvencies
per 1,000
people^
% Change
(Q1 y/y)
Percentage
of Ontario
Job growth
per 1,000
people^
(Q1 y/y)
Housing
Starts per
10,000
people
Housing Starts (units)3
Percentage
of Ontario
% Change
(Q1 y/y)
ONTARIO ECONOMIC OVERVIEW – SEPTEMBER 2011 UPDATE 17
ENDNOTES 1 Ontario Ministry of Finance, Ontario Production by Industry, Seasonally Adjusted at Annual Rates, July 2011. 2 Bank of Canada, Monthly and Annual Exchange Rates; Statistics Canada, Table 384-0002, Gross domestic product (GDP), expenditure-based, provincial economic accounts, annual (accessed 30 August 2011). 3 Exchange rate data from www.xe.com. 4 Ontario Ministry of Finance, Ontario Production by Industry, Seasonally Adjusted at Annual Rates, July 2011. 5 Employment data from LFS and is not strictly comparable to employment data used elsewhere. Statistics Canada, Labour Force Survey, Employment by Detailed Industry, Unadjusted (accessed 30 August 2011). 6 Conference Board of Canada, “Unemployment rate,” August 2011. 7 Bank of Canada, Senior Loan Officer Survey, Vol. 4.2, 11 July 2011. 8 Office of the Superintendent of Bankruptcy of Canada, Insolvency Statistics in Canada — First Quarter of 2011. 9 Office of the Superintendent of Bankruptcy of Canada, Insolvency Statistics in Canada — First Quarter of 2011. 10 Conference Board of Canada, “Index of Consumer Confidence,” August 2011 11 Forecasts released between June and August 2011 by Conference Board of Canada, Scotiabank, RBC Financial, TD Economics, BMO Financial, CIBC World Markets and Desjardins. 12 CIBC, Provincial Forecast, 30 August 2011. 13 Royal Bank of Canada, “RBC Canadian Manufacturing Purchasing Managers’ Index™ finds overall conditions strengthen modestly in July with gains in new order growth,” http://www.rbc.com/newsroom/pmi/2011/0802-pmi.html, 2 August 2011. 14 Median rates based on forecasts released between May and August 2011 by Conference Board of Canada, Scotiabank, RBC Financial, TD Economics, BMO Financial, CIBC World Markets and Desjardins. 15 Median rates based on forecasts released between February and May 2011 by Conference Board of Canada, Scotiabank, RBC Financial, TD Economics, BMO Financial, CIBC World Markets, IHS Global Insight and Desjardins. 16 Bureau of Labor Statistics, “Annual average unemployment rate, civilian labor force 16 years and over (percent)”. 17 Scotiabank Group, “Global Forecast Update”, Global Economic Research, 1 September 2011. 18 Ontario Ministry of Finance, Ontario Production by Industry, Seasonally Adjusted at Annual Rates, July 2011. 19 Ontario Ministry of Finance, Ontario Production by Industry, Seasonally Adjusted at Annual Rates, July 2011. 20 Ontario Ministry of Finance, Ontario Production by Industry, Seasonally Adjusted at Annual Rates, July 2011. 21 Ontario Ministry of Finance, Ontario Production by Industry, Seasonally Adjusted at Annual Rates, July 2011. 22 Ontario Ministry of Finance, Ontario Production by Industry, Seasonally Adjusted at Annual Rates, July 2011. 23 Ontario Ministry of Finance, Ontario Production by Industry, Seasonally Adjusted at Annual Rates, July 2011. 24 Ontario Ministry of Finance, Ontario Production by Industry, Seasonally Adjusted at Annual Rates, July 2011. 25 Statistics Canada, Table 281-0023 Survey of Employment, Payrolls and Hours, Unadjusted for Seasonal Variation, CANSIM (accessed 27 July 2011). 26 Statistics Canada, Table 281-0023 Survey of Employment, Payrolls and Hours, Unadjusted for Seasonal Variation, CANSIM (accessed 27 July 2011). 27 Statistics Canada, Table 281-0023 Survey of Employment, Payrolls and Hours, Unadjusted for Seasonal Variation, CANSIM (accessed 27 July 2011). 28 Statistics Canada, Table 281-0023 Survey of Employment, Payrolls and Hours, Unadjusted for Seasonal Variation, CANSIM (accessed 27 July 2011). 29 Lucia Mutikani, “Faltering U.S. consumer spending to weigh on growth,” Reuters, 2 August 2011. 30 Bloomberg, “Economic Calendar”, http://www.bloomberg.com/markets/economic-calendar, 4 August 2011. 31 Michael Babad, “Loonie at highest since 2007, Canada seen as ‘safe harbour’,” Globe and Mail, 21 July 2011. 32 Royal Bank of Canada, “RBC Canadian Manufacturing Purchasing Managers’ Index™ finds overall conditions strengthen modestly in July with gains in new order growth,” http://www.rbc.com/newsroom/pmi/2011/0802-pmi.html, 2 August 2011. 33 Dave Hall, “Manufacturers to invest more in equipment,” Windsor Star, 4 August 2011. 34 Ontario Ministry of Finance, Ontario Production by Industry, Seasonally Adjusted Rates, April 2011. 35 Statistics Canada, Table 281-0023 survey of Employment, Payrolls and Hours, Unadjusted for Seasonal Variation, CANSIM (accessed 19 April 2011). 36 David Phillips, “Analysts Lower Forecasts for U.S. Light Vehicle Sales in 2011, 2012”, Automotive News, 11 August 2011. 37 Automotive News Data Center, U.S. Light Vehicle Sales by Nameplate, June & 6 Months 2011.
ONTARIO ECONOMIC OVERVIEW – SEPTEMBER 2011 UPDATE 18
38 Jesse Snyder, “Fleet fades; 1st -half gains were from retail”, Automotive News, 18 July 2011. 39 Carlos Gomes, Auto News Flash, Scotia Bank Group, 4 July 2011; Bill Vlasic and Nick Bunkley, “Soft results at Chrysler and Ford”, New York Times, 27 July 2011. 40 Bill Vlasic and Nick Bunkley, “Soft results at Chrysler and Ford”, New York Times, 27 July 2011; Supplier Business, “Mixed messages from Traverse City for Suppliers”, IHS Global Insight, August 8, 2011. 41 David Phillips, “Analysts lower forecasts for U.S. Light Vehicle Sales in 2011, 2012”, Automotive News, 11 August 2011. 42 Scotiabank Group, Global Auto Report, by Carlos Gomes, 28 July 2011; Aaron Bragman ,“US Light-Vehicle Market Rises 7% Y/Y in June As Small Cars and Pick-Ups Make Gains”, IHS Global Insight, 4 July 2011; TD Economics, Data Release: Canadian New Vehicle Sales Deliver a Stellar Performance in June , Shahrzad Mobasher, 15 August 2011. 43 Scotiabank Group, Global Auto Report, by Carlos Gomes, 28 July 2011. 44 Automotive News Data Center, North American Car and Truck Production, June and YTD 2011. 45 Debi Domby, “A Slight Rise in June Output”, Automotive News, 18 July 2011. 46 Automotive News Data Center, North American Car and Truck Production, June and YTD 2011; John Morrissy, “Auto-sector profits may jump tenfold, U.S. demand rises; Conference Board sees price increase”, Postmedia News 17 June 2011. 47 Automotive News Data Center, U.S. Light Vehicle Sales by Nameplate, June & 6 Months 2011. 48 Aaron Bragman ,“US Light-Vehicle Market Rises 7% Y/Y in June As Small Cars and Pick-Ups Make Gains, IHS Global Insight, 4 July 2011; Market News Publishing Inc., “General Motors Co – June Sales Improve 11 Percent on Strong Retail Demand for Fuel-Efficient Vehicles, 4 July 2011. 49 General Motors Co., GM Net Income Increases 89 Percent to $2.5 Billion, 4 August 2011; Mike Colias, “GM gets help from all regions in posting $2.5B profit”, Automotive News, 4 August 2011. 50 Automotive News Data Center, North American Car and Truck Production, June and YTD 2011. 51 The Canadian Press, “GM to invest $117 million in Oshawa assembly plant”, Waterloo Region Record, 5 August 2011. 52 SCBN Business Information Group, 5 July 2011. 53 Automotive News Data Center, U.S. Light Vehicle Sales by Nameplate, June & 6 Months 2011. 54 Aaron Bragman, “US Light-Vehicle Market Rises 7% Y/Y in June As Small Cars and Pick-Ups Make Gains”, IHS Global Insight, 4 July 2011. 55 Scott Deveau, “Ford has its best June sales in 22 years, Auto gas prices spur sales in efficient vehicles”, Financial Post, 5 July 2011. 56 Automotive News Data Center, North American Car and Truck Production, June and YTD 2011. 57 Ellen Van Wageningen, “Essex engine plant lures 80 new jobs”, Windsor Star, 27 July 2011. 58 Ford Motor Co., “Ford Earns $2.4 Billion Net Income in Second Quarter 2011; Strengthens foundation for continued Global Growth”, 26 July 2011; Jamie LaReau, “Ford Q2 net profit falls 8% to $2.4 billion on higher costs”, Automotive News, 26 July 2011. 59 Automotive News Data Center, U.S. Light Vehicle Sales by Nameplate, June & 6 Months 2011. 60 Aaron Bragman, “US Light-Vehicle Market Rises 7% Y/Y in June As Small Cars and Pick-Ups Make Gains”, IHS Global Insight, 4 July 2011. 61 Automotive News Data Center, North American Car and Truck Production, June and YTD 2011.
62 Department of Finance and Ministry Of Finance, Ontario, Governments of Canada and Ontario Announce the Divestiture of the Government of Canada’s Remaining Interests in Chrysler Group LLC , July 21, 2011; Alex Boekestyn and Matteo Fini “What does the handover of Chrysler to Fiat mean for suppliers?”, SupplierBusiness : News & Analysis, HIS Global Insight, 25 July 2011.
63 Bill Vlasic and Nick Bunkley, “Soft results at Chrysler and Ford”, New York Times, 27 July 2011; Deepa Seetharaman, “Chrysler Q2 net loss widens after debt repayment”, Reuters, 26 July 2011. 64 Ellen Van Wageningen, “Chrysler numbers best since 2005; Minivan sales at record high”, Canwest News Service, 5 July 2011. 65 Automotive News Data Center, U.S. Light Vehicle Sales by Nameplate, June & 6 Months 2011. 66 Alan Ohnsman, “Toyota Says U.S. Sales Rebound Won’t Begin Until September”, Bloomberg News, 28 July 2011. 67 Automotive News Data Center, North America Light Vehicle Production by Assembly Plant, June 2011 and six months
ONTARIO ECONOMIC OVERVIEW – SEPTEMBER 2011 UPDATE 19
68 Toyota Canada Inc., Updated Statement Regarding Earthquake and Tsunami in Japan, 16 June 2011.
69 Yoshio Takahashi, “Defying the Quake and Yen, Toyota Stays in the Black, Hoists Fiscal Year Outlook 40%”, Dow Jones and Company, 2 August 2011; Hiroko Tabuchi, “Toyota, Rebounding from Quake, Sees Rosier Future”, New York Times, 3 August 2011. 70 Tony Van Alphen and Robert Benzie, “Toyota sparks Canadian market; Automaker teams up with upstart Tesla Motors from California to build RAV4 EV in Woodstock”, Toronto Star, 5 August 2011; Industry Canada - Office of the Honourable Christian Paradis, Minister of Industry Highlights Federal Investment in Toyota to Support Jobs in Canada, 5 August 2011. 71 Automotive News Data Center, U.S. Light Vehicle Sales by Nameplate, June & 6 Months 2011; Reuters, “Update2: Table - May U.S. Light Vehicle Sales by Major Automakers”, 1 June 2011. 72 Ellen Van Wageningen, “Chrysler numbers best since 2005: Minivan sales at record high”, Canwest News Service, 5 July 2011. 73 Canadian Manufacturing Daily Staff, “Honda spending $800 million for new plant: Automaker will increase production by adding second shifts at North American facilities”, Canadian Manufacturing, 15 August 2011. 74Mark Rechtin, “Honda Weighs Civic Relaunch in the Fall”, Automotive News, 4 July 2011.
75 SupplierBusines : News & Analysis, “Mixed messages from Traverse City For Suppliers”, IHS Global Insight, August 8, 2011; Scott Deveau,, “Canadian parts makers to get lift from Detroit; Strong C$ a drag”, Financial Post, 4 August 2011. 76 SupplierBusiness: News & Analysis, “Mixed messages from Traverse City for Suppliers”, IHS Global Insight, 8 August 2011; Mark Clothier, “Magna, Lear May Lead Global Consolidation of Automotive Interior Suppliers”, Bloomberg News, 11 August 2011. 77 Supplier Business: News and Analysis, “Editorial – Suppliers post positive quarter, but the challenges are mounting”, IHS Global Insight, 1 August, 2011. 78 Statistics Canada, Table 379-0025 GDP at basic prices by NAICS and province, CANSIM (accessed 29 July 2011). 79 Statistics Canada, Table 379-0027 GDP at basic prices by NAICS, montly, CANSIM (accessed 29 July 2011). 80 Location Canada, Canadian Industry’s Recipe for Success, by Lisa A. Bastian, 10 April 2010. 81 Statistics Canada, Table 379-0025 GDP at basic prices by NAICS and province, CANSIM (accessed 29 July 2011). 82 Statistics Canada, Table 379-0027 GDP at basic prices by NAICS, montly, CANSIM (accessed 29 July 2011). 83 Industry Canada, Trade Data Online. Accessed 29 July 2011. 84 Statistics Canada, Table 281-0023 Survey of Employment, Payrolls and Hours, Unadjusted for Seasonal Variation, CANSIM (accessed 29 July 2011). 85 Statistics Canada, Table 304-0015 Manufacturing Sales, by NAICS and Province, Monthly, Seasonally Adjusted, CANSIM (accessed 29 July 2011). 86 Kerry Lynch, “BizJet Forecast Numbers Cut By Bombardier,” Aviation Week, 22May 2011. 87 Murdo Morrison, “Canada special: Flying Colours looks to burgeoning business jet completions market in Asia,” Flight International, 24 May 2011. 88 Postmedia News, “Aerospace gains give lift to Heroux-Devtek,” Financial Post, 5 August 2011. 89 Industry Canada, “Minister Paradis Congratulates Canadian Aerospace Firms on a Successful International Paris Air Show,” http://www.ic.gc.ca/eic/site/ic1.nsf/eng/06544.html, 21 June 2011. 90Ross Marowits, “Bombardier CSeries faces another rival after Boeing moving to re-engine 737,” Canadian Press, 20 July 2011. 91 Dylan Kristy, Province investing $2M in U of W aerospace, Windsor Star, 10 June 2011. 92 Ralph Benmergui, McGuinty Government Supports 500 Jobs In Ajax, Office of the Minister of Research and Innovation, 7 July 2011. 93 Government of Ontario, Invest in Ontario: Life Sciences, accessed 04 August 2011. 94 Statistics Canada, Table 379-0027 GDP at Basic Prices, by NAICS, monthly, CANSIM (accessed 29 July 2011). 95 Statistics Canada, Table 304-0015 Manufacturing Sales, by NAICS and Province, Monthly, Unadjusted, CANSIM (accessed 29 July 2011). 96 Industry Canada, Trade Data on-line (accessed 29 July 2011). 97 Conference Board of Canada, Leading Indicator of Industry Profitability, July 2011.
ONTARIO ECONOMIC OVERVIEW – SEPTEMBER 2011 UPDATE 20
98 Statistics Canada, Table 281-0023 Survey of Employment, Payrolls and Hours, Unadjusted for Seasonal Variation, CANSIM (accessed 29 July 2011). 99 Thompson Reuters, “Q1 2011 Overview of Canada’s Venture Capital Industry”, (accessed 2 August 2011). 100 Edward Keenan, “Profound Medical closes $9.4 million venture round, will hire 15”, Yonge Street Media, 8 July 2011. 101 Ontario Bioscience Industry Organization News Release, “CEO-Led Advocacy Wins $3-Million Financing”, 27 July 2011. 102 PwC, Combining Strengths, Maximizing Impact: The Quebec –Ontario Life Sciences Corridor, June 2011. 103 Rx&D statement, BiopolisQuébec and Life Sciences Ontario to work together within the Quebec-Ontario Corridor, 28 June 2011. 104 Government of Ontario, Investing In Innovation To Create 70 New Jobs And Protect 300 Jobs, 9 June 2011. 105 Statistics Canada, Business Register, 2010. 106 Statistics Canada, Table 379-0027, GDP at basic prices, by North American Industry Classification System (NAICS), Chained 2002 dollars, CANSIM (accessed 29 August 2011). 107 Statistics Canada, Table 379-0026, GDP at basic prices, by North American Industry Classification System (NAICS) and province, Chained 2002 dollars, CANSIM (accessed 28 July 2011). 108 Statistics Canada, Table 379-0025, GDP at basic prices, by NAICS and province, Chained 2002 dollars, CANSIM (accessed 28 July 2011). 109 Statistics Canada, Table 379-0027, GDP at basic prices, by NAICS, Monthly, Seasonally Adjusted at Annual Rates, Chained 2002 dollars, CANSIM (accessed 28 July 2011). 110 Statistics Canada, Table 304-0015, Manufacturing sales, by NAICS and province, Monthly, Unadjusted; for NAICS 3333, 3341, 3342, 3343, 3344, 3345, and 33592. 111 Industry Canada, Trade Data Online; for NAICS 3333, 3341, 3342, 3343, 3344, 3345, and 33592. 112 Statistics Canada, Table 281-0023, Survey of Employment, Payrolls and Hours, unadjusted for seasonal variation by type of employee for selected industries classified using the North American Industry Classification System (NAICS), monthly (persons), CANSIM (accessed 28 July 2011). NAICS include 3333, 334, 3359, 4173, 4179, 5112, 517, 518, 5324, 5415, 8112. 113 Thomson Financial, VCReporter (accessed 8 August 2011). 114 IDC, Worldwide Mobile Phones Quarterly Tracker – Final Data – Q1 2011. 115 IDC, Worldwide Mobile Phones Quarterly Tracker – Final Data – Q1 2011. 116 Google Finance, www.google.com/finance, accessed 8 August 2011. 117 Research in Motion, “Research in Motion Reports First Quarter Fiscal 2012 Results and Revises Full Year Guidance”, 16 June 2011. 118 Research in Motion, “Research in Motion Reports First Quarter Fiscal 2012 Results and Revises Full Year Guidance”, 16 June 2011. 119 Jim Balsillie, RIM Q1 2012 Earnings Call Transcript,16 June 2011. 120 Alastair Sharp, “RIM adjusts to new reality by slashing 2,000 jobs”, Reuters, 25 July 2011. 121 The Record, “Provincial funding aids former RIM workers”, 12 August 2011. 122 Research in Motion, “RIM Participates in Winning Bid for Nortel's Patent Portfolio”, 1 July 2011. 123 Statistics Canada, Table 379-0027 GDP at basic prices by NAICS, monthly, CANSIM (accessed 3 August 2011). 124 Statistics Canada, Table 379-0025 GDP at basic prices by NAICS and province, annual, CANSIM (accessed 3 August 2011). Note: GDP data does not include firms dealing primarily in securities or non-depository credit intermediation, while employment data does include these firms. 125 Statistics Canada, Table 379-0027 GDP at basic prices by NAICS, monthly, CANSIM (accessed 3 August 2011). 126 Statistics Canada, Table 281-0023 Survey of Employment, Payrolls and hours, unadjusted for seasonal variation, CANSIM (accessed 3 August 2011). 127 Statistics Canada, Table 281-0023 Survey of Employment, Payrolls and hours, unadjusted for seasonal variation, CANSIM (accessed 3 August 2011). 128 Toronto Financial Services Alliance, “Financial Services in Toronto”, Toronto Financial Services Alliance, http://www.tfsa.ca/financial/index.php (accessed 5 May 2011). 129 Z/Yen Group, Global Financial Centres Index 9, by Mark Yeandle, March 2011. 130 Canadian Press, “BMO Q2 profit rises to $800m”, 25 May 2011. 131 David Friend and David Paddon, “Scotiabank Q2 profit rises to $1.54 billion; share of Canadian banking grows”, Canadian Press, 31 May 2011. 132 David Friend, “Royal Bank Q2 profit rises to $1.5 billion”, Investment Executive, 27 May 2011.
ONTARIO ECONOMIC OVERVIEW – SEPTEMBER 2011 UPDATE 21
133 Sunny Freeman, “TD Bank Q2 profit strengthens to $1.33 billion”, Investment Executive, 26 May 2011. 134 David Friend and Sunny Freeman, “Bank of Montreal Q2 profit grows as fewer customers default on loans”, Canadian Press, 25 May 2011. 135 Grant Robertson, “Scotiabank books best gains in sunnier climes”, Globe & Mail, 31 May 2011. 136 David Friend, “Royal Bank Q2 profit rises to $1.5 billion”, Investment Executive, 27 May 2011. 137 Sunny Freeman, “TD Bank Q2 profit strengthens to $1.33 billion”, Investment Executive, 26 May 2011. 138 John Greenwood, “CIBC Q2 earnings less than expected”, Postmedia News, 26 May 2011. 139 Martin Mittelstaedt, “RBC retreat from U.S. leaves earnings more volatile”, Globe & Mail, 20 June 2011. 140 Postmedia News, “TD buying MBNA credit-card business for $8.5B”, 15 August 2011. 141 John Greenwood, “Manulife poised for buying; 'Our powder dry'”, National Post, 12 August 2011. 142 Tara Perkins, “Sun Life, Great-West results top expectations; Insurers chalk up profits despite slumping markets and lagging interest rates”, Globe & Mail, 4 August 2011. 143 John Greenwood, “Sun Life's Stewart retiring; Steered insurer away from risk”, National Post, 5 July 2011. 144 Boyd Erman, “Maple Group launches hostile bid for TMX”, Globe & Mail, 25 May 2011. 145 Boyd Erman, Grant Robertson, and Tara Perkins, “Bidding war for TMX heats up”, Globe & Mail, 22 June 2011. 146 Boyd Erman and Karen Howlett, “Shareholders reject proposed merger of TMX and LSE”, Globe & Mail, 29 June 2011. 147 Statistics Canada, Table 379-0025, Gross domestic product (GDP) at basic prices, annual (dollars), CANSIM (accessed 11 May 2011). 148 Ontario Construction Secretariat, “Construction Outlook: Steady As She Goes,” OSC State of the Industry and Outlook Conference, March 2, 2011. 149 Statistics Canada, Table 379-0025, Gross domestic product (GDP) at basic prices, annual (dollars), CANSIM (accessed 11 May 2011). 150 Ontario Ministry of Finance, Ontario Economic Accounts - First Quarter of 2011, July 2011. 151 Statistics Canada, Table 281-0023, Survey of Employment, Payrolls and Hours, unadjusted for seasonal variation, CANSIM (accessed 25 July 2011). 152 Statistics Canada, Table 027-0055, CMHC, housing starts, seasonally adjusted at annual rates; quarterly, CANSIM (accessed 25 July 2011). 153 Statistics Canada, Table 027-0055, CMHC, housing starts, seasonally adjusted at annual rates; quarterly, CANSIM (accessed 25 July 2011). 154 Statistics Canada, Table 026-0006, Value of building permits, by province and territory, seasonally adjusted, CANSIM (accessed 25 July 2011). 155 Staff Writer, “Canadian developers take a pause,” Toronto Star, 6, June, 2011. 156 Statistics Canada, Table 026-0006, Value of building permits, by province and territory, seasonally adjusted, CANSIM (accessed 25 July 2011). 157 IHS Global Insights, Ontario Construction, GDP at Basic Prices, Chained 2002 dollars (forecast 2011-2015), (accessed 13 May 2011). 158 Ontario Construction Secretariat, Construction Outlook: Steady As She Goes,” OSC State of the Industry and Outlook Conference, March 2, 2011. 159 Conference Board of Canada, Canadian Industrial Outlook - Canada’s Non-Residential Construction Industry, by Michael Burt, Winter 2011. 160 Ontario Construction Secretariat, Construction Outlook: Steady As She Goes,” OSC State of the Industry and Outlook Conference, March 2, 2011. 161 PwC, Global Construction 2020, 5 May 2011. 162 Conference Board of Canada, Canadian Industrial Outlook - Canada’s Non-Residential Construction Industry, by Michael Burt, Winter 2011. 163 PwC, Global Construction 2020, 5 May 2011. 164 Ontario Construction Secretariat, Construction Outlook: Steady As She Goes,” OSC State of the Industry and Outlook Conference, March 2, 2011. 165 Investing in Ontario, Ontario Ministry of Tourism and Culture, http://www.mtc.gov.on.ca/en/invest/invest.shtml. 166 Tourism-Related Industries Employment in Ontario, Ontario Ministry of Tourism & Culture, released July 2011. 167 Ontario’s International Travel Account, Ontario Ministry of Tourism & Culture, released June 2011. 168 Ontario Ministry of Finance, “Ontario Economic Accounts – First Quarter of 2011”, July 2011. 169 Statistics Canada, Table 281-0023 Survey of Employment, Payrolls and Hours, Unadjusted for Seasonal Variation, CANSIM (accessed 3 August 2011).
ONTARIO ECONOMIC OVERVIEW – SEPTEMBER 2011 UPDATE 22
170 Statistics Canada, Table 427-0005 Number of international travellers entering or returning to Canada, by province of entry, seasonally adjusted, monthly (accessed 27 July 2011). 171 Syracuse.com, “US-Canada tourism partners examine issues along the New York-Ontario border”, 11 March 2011. 172 Ontario Ministry of Tourism and Culture, “Tourism Performance Bulletin”, April 2011. 173 Tourism Industry Association of Canada News Release, “Canada’s Travel and Tourism Industry Welcomes Introduction of Ten-Year Visas”, 20 July 2011. 174 Signature Experiences Collection, Canadian Tourism Commission, http://en-corporate.canada.travel/sites/default/files/pdf/sec-ced/sec_member_list_en.pdf. 175 Ontario Ministry of Finance, Ontario Production by Industry at 2002 Prices, July 2011. 176 Statistics Canada, Table 281-0023 Survey of Employment, Payrolls and Hours, Unadjusted for Seasonal Variation, CANSIM (accessed 26 July 2011). 177 Statistics Canada, Table 281-0023 Survey of Employment, Payrolls and Hours, Unadjusted for Seasonal Variation, CANSIM (accessed 26 July 2011). 178 Statistics Canada, Table 281-0023 Survey of Employment, Payrolls and Hours, Unadjusted for Seasonal Variation, CANSIM (accessed 26 July 2011). 179 Statistics Canada, Table 281-0023 Survey of Employment, Payrolls and Hours, Unadjusted for Seasonal Variation, CANSIM (accessed 26 July 2011). 180 Ontario Ministry of Finance, Ontario Production by Industry, Seasonally Adjusted at Annual Rates, July 2011. 181 Ontario Ministry of Finance, Ontario Production by Industry, Seasonally Adjusted at Annual Rates, July 2011. 182 Statistics Canada, Table 080-0020 Retail trade by NAICS, monthly, seasonally adjusted, CANSIM (accessed 26 July 2011). 183Statistics Canada, Table 080-0020 Retail trade by NAICS, monthly, seasonally adjusted, CANSIM (accessed 26 July 2011). 184 Statistics Canada, Table 080-0020 Retail trade, sales by the North American Industry Classification System (NAICS), monthly, CANSIM (accessed 26 July 2011). 185 Statistics Canada, Table 080-0020 Retail trade, sales by the North American Industry Classification System (NAICS), monthly, CANSIM (accessed 26 July 2011). 186 Statistics Canada, Table 081-0011 Wholesale trade, sales by the North American Industry Classification System (NAICS), monthly (dollars), CANSIM (accessed 26 July 2011). 187Statistics Canada, Catalogue no. 63-005-X, vol. 83, no. 5, Retail Trade May 2011. 188 BMO Financial Group, “BMO Report: Canadian Retailing a Changing Picture”, Marketwire, 20 May 2011. 189S. John Tilak, “Analysis: U.S. retailers fire up Canada's real estate space”, Reuters Canada, 17 August 2011. 190 S. John Tilak, “Analysis: U.S. retailers fire up Canada's real estate space”, Reuters Canada, 17 August 2011. 191 The Canadian Press, “Canadian Tire gets green light to buy Forzani”, Globe and Mail, 3 August 2011. 192 Ontario Ministry of Finance, Ontario Production by Industry, Seasonally Adjusted at Annual Rates, July 2011. 193 Statistics Canada, Labour Force Survey, Employment by Detailed Industry, Unadjusted (accessed 29 July 2011). 194 Statistics Canada, Labour Force Survey, Employment by Detailed Industry, Unadjusted (accessed 29 July 2011). 195 Statistics Canada, Table 002-0002 Farm cash receipts, quarterly, CANSIM (accessed 29 July 2011). 196 Michael DeRuyter, “Rainy day welcomed, especially by farmers”, TheRecord, 10 August 2011. 197 Michael DeRuyter, “Rainy day welcomed, especially by farmers”, TheRecord, 10 August 2011. 198 Statistics Canada, Table 281-0023 Survey of Employment, Payrolls and Hours, Unadjusted for Seasonal Variation, CANSIM (accessed 29 July 2011). 199 Statistics Canada, Table 304-0015 Manufacturing Sales, by NAICS and Province, Monthly, Seasonally Adjusted, CANSIM (accessed 29 July 2011). 200 Bloomberg, “Economic Calendar”, http://www.bloomberg.com/markets/economic-calendar, 19 July 2011. 201 David Ebner, “Lumber sector slumps on sluggish U.S. housing”, Globe and Mail, 27 July 2011. 202 Ontario Ministry of Finance, Ontario Production by Industry, Seasonally Adjusted at Annual Rates, July 2011. 203 Statistics Canada, Table 281-0023 Survey of Employment, Payrolls and Hours, Unadjusted for Seasonal Variation, CANSIM (accessed 29 July 2011). 204 Industry Canada, Trade Data Online (accessed 29 July 2011). 205 Jonathan Leff and Jan Harvey, “Gold Tops $1,800”, Globe and Mail, 10 August 2011. 206 Northern Ontario Business staff, “Timmins still pitching for Ring of Fire processing”, Northern Ontario Business, 26 July 2011. 207 Ontario Power Authority, Bi-Weekly FIT and microFIT Report, Data as of 22 July 2011.
ONTARIO ECONOMIC OVERVIEW – SEPTEMBER 2011 UPDATE 23
208 Monica Wolfson, “Grid Capacity Stymies Solar Sector”, The Windsor Star, 24 June 2011. 209 Government of Ontario, New Clean Energy Projects Creating 5,000 Jobs, 4 July 2011. 210 C.D. Howe Institute, Power Glut: Why Ontario Residents Pay for Costly Electricity They Don’t Need, and What to Do About It, 19 July 2011. 211 AFP, “WTO to rule on Japan's green energy complaint against Canada”, 20 July 2011. 212 Robert Benzie, “Ontario’s green energy policies break trade rules, EU says”, Toronto Star, 11 August 2011. 213 Mesa Power Group News Release, “Mesa Power Group Files Legal Action Against Canadian Government for NAFTA Infractions”, 14 July 2011. 214 Christine Dobby, “Solar panel demand bright light for Celestica”, Financial Post, 20 June 2011. 215 Jameson Berkow, “With FIT future in question, Ontario solar industry gets 400 new jobs”, Financial Post, 18 July 2011. 216 Eclipsall Energy Corp. News Release, “Eclipsall Celebrates Opening of Toronto Facility” 23 June 2011. 217 Don Lajoie, “Windsor Siliken Canada Plant lays off two shifts”, The Windsor Star, 7 July 2011. 218 Dylan Kristy, “Siliken recalls staff”, The Windsor Star, 16 July 2011. 219 Pike Research, Global Wind Power Capacity to Triple by 2017, 12 July 2011. 220 ClearSky Advisors, The Economic Impacts of the Wind Energy Sector in Ontario 2011-2018, July 2011. 221 Wind Works Power Corp. News Release, “Wind Works Power Corp. Signs Agreement for $15 Million Financing”, 18 July 2011. 222 Wind Works Power Corp. News Release, “Wind Works Power Corp. Acquires 2 New Wind Projects in Germany”, 20 July 2011. 223 Industry Canada, Trade Data Online, accessed 18 August 2011. 224 Bureau of Economic Analysis, “Gross Domestic Product: Second Quarter 2011 (Second Estimate)”, 26 August 2011. 225 Bureau of Labor Statistics, “The Employment Situation-July 2011”, 5 August 2011. 226 Bureau of Labor Statistics, “Aggregate Economy (Critical Variables)”, December 2009. 227 U.S. Census Bureau, “Advance Monthly Sales for Retail and Food Services - July 2011”, 12 August 2011. 228 Ted Wieseman, “Global Economic Forum: United States Review and Preview”, Morgan Stanley, 23 August 2011. 229 Paul Krugman, “The President Surrenders”, New York Times, 31 July 2011. 230 Standard & Poor’s, “United States of America Long-Term Rating Lowered To 'AA+' Due To Political Risks, Rising Debt Burden; Outlook Negative”, 5 August 2011. 231 Google Finance, www.google.com/finance, accessed 23 August 2011. 232 Jillian Berman, “U.S. Consumer Confidence Drops to Three-Decade Low Amid Economic Headwinds”, Bloomberg, 12 August 2011. 233 David Greenlaw and Ted Wieseman, “US Forecast Update: A Faltering Recovery”, Morgan Stanley, 19 August 2011. 234 Vincent Del Giudice and Tom Keene, “U.S. Economy Is ‘On the Precipice’ of Recession, Rosenberg Says”, Bloomberg, 22 August 2011.