NRMT 2270, Photogrammetry/Remote Sensing Lecture 8 Ontario Forest Resource Inventory. Ontario Ecological Land Classification. Tomislav Sapic GIS Technologist Faculty of Natural Resources Management Lakehead University
Transcript
NRMT 2270, Photogrammetry/Remote Sensing
Lecture 8
Ontario Forest Resource Inventory. Ontario Ecological Land Classification.
Tomislav Sapic GIS Technologist
Faculty of Natural Resources Management Lakehead University
Ontario Forest Resource Inventory
1 1
2 2
3
3
FRI Delineation on Hard Copy Frame Stereo Aerial Photographs
x x x x
x x x
x x
PP PP
PP
CPP CPP CPP CPP
CPP CPP
Effective Area (no overlap)
• Analog, hard copy method, rapidly replaced by so-called ‘soft copy’, done through computer software, on digital images, in a stereo environment.
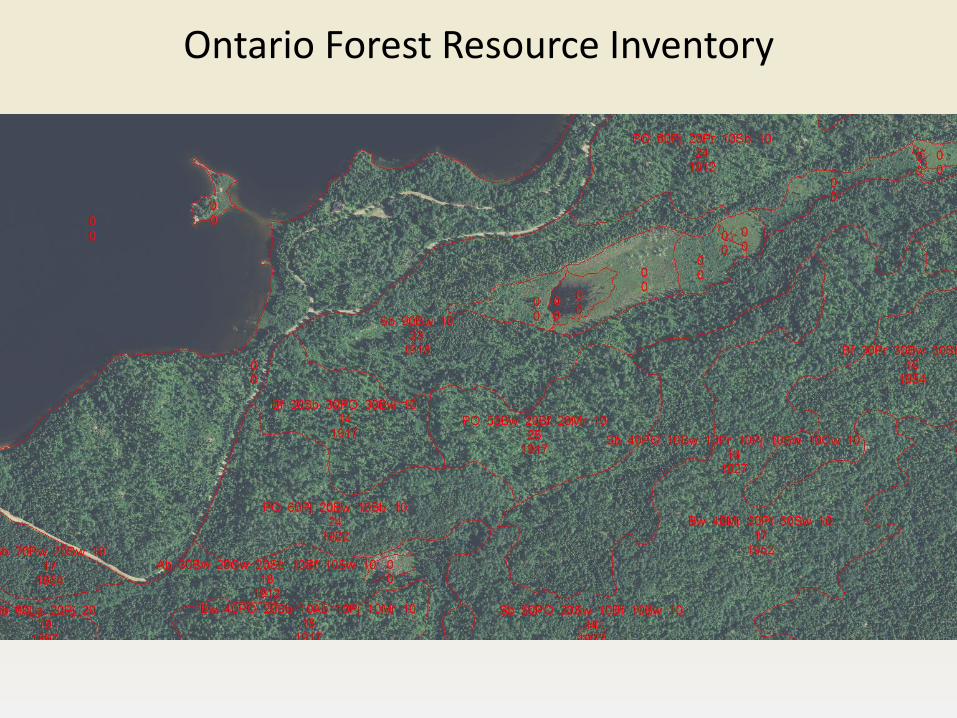
Ontario Forest Resource Inventory
FRI Definition (Forest Information Manual): “The Forest Resources Inventory (FRI) is a spatial product that provides description of all areas within a forest management unit and provides a snapshot in time of the characteristics of water and land base geography.” (OMNR, 2009)
• FRI is intended to support forest management planning at various scales: individual forest stands, forest management unit, landscape extents.
• An FRI represents the area within a forest management unit, classified, based on its geographic features and characteristics, into homogeneous water and land types called polygons. Polygons contain spatial (geographic location) and tabular (natural and geographic characteristics) attributes.
• The FRI program is currently transitioning from a 20-25 year production rotation cycle to a 10 year cycle, and from a periodic inventory to a continuous inventory that is ecologically based.
• The FRI program will cover all lands within the Area of Undertaking, not just those involved in forest management planning under Forest Management Planning Manual and Forest Information Manual.
Source: OMNR (2009).
Ontario Forest Resource Inventory
• The MNRF is responsible for creating the forest resources inventory (FRI) and providing it to Licensees.
• The MNRF will retain the overall stewardship role, policy responsibility, scheduling, priority setting, standard setting, quality control and information management of the FRI.
• The Licensee is responsible for checking the FRI for completeness as well as for maintaining and updating the FRI for their own purposes throughout its ten year life cycle.
• In 2006 North West Group from Calgary was awarded a 5 year digital imagery contract for the OMNRF, to collect base imagery during 2006 to 2010 , with a maximum contract value of $25M, for an FRI area covering aprx. 500,000 sqkm (~$50/sq.km), using at first ADS 40 and then ADS 80 aerial camera system technology.
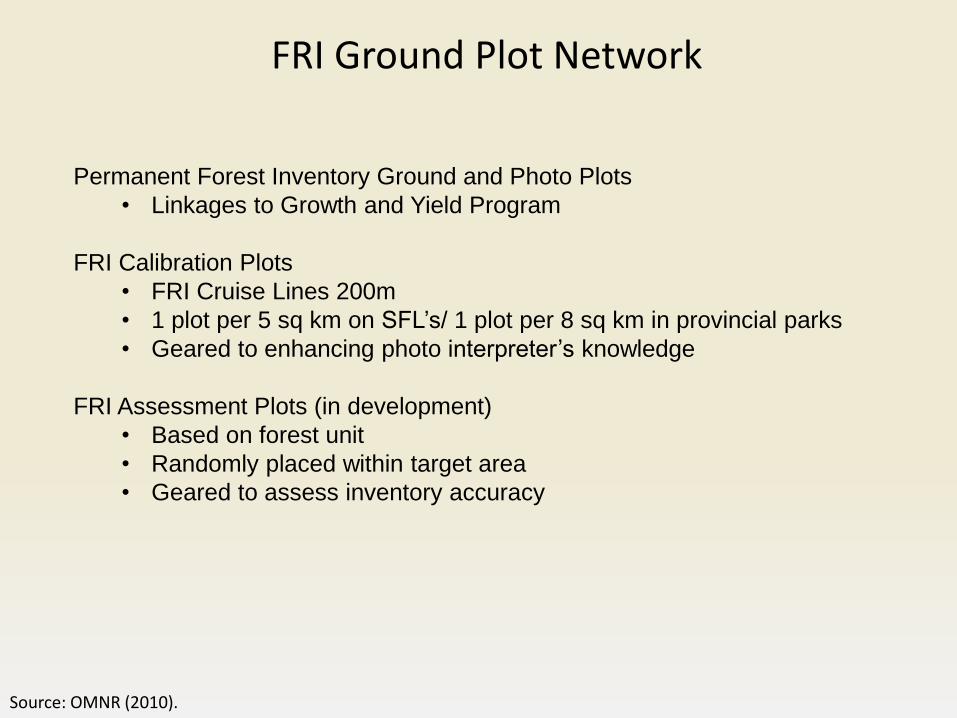
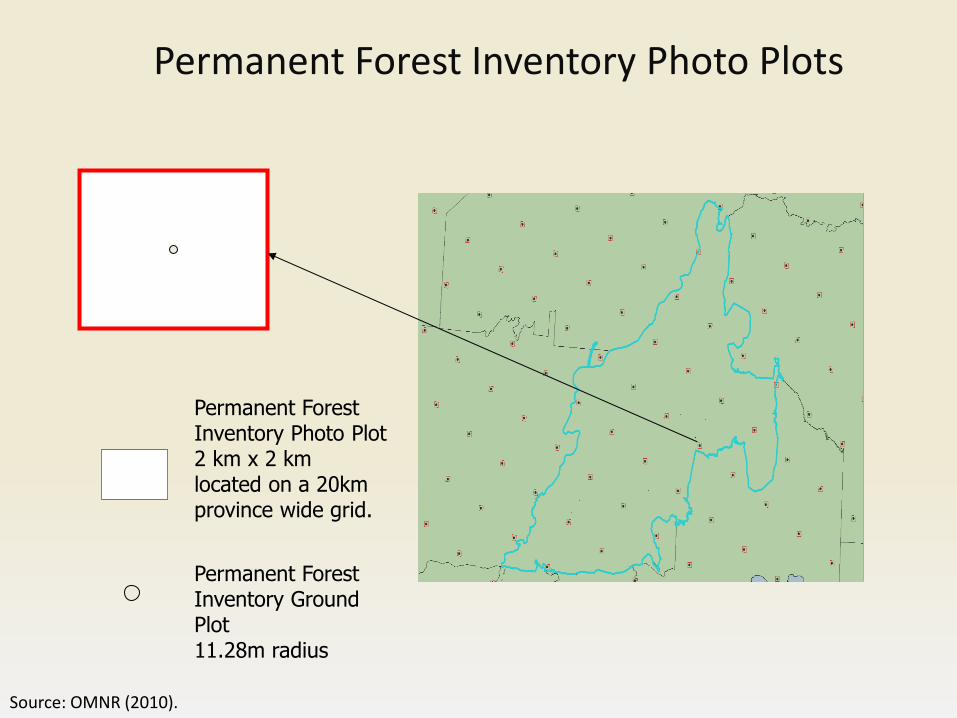
• Intended to calibrate photointerpretation of photo interpreters by providing ground truth data.
• Provide data on species composition, age, height, site information (soil type, mositure regime, soil depth), stand structure. • Help in identifying two-tier and complex canopy structures.
FRI Interpretation Process
• Calibration plot surveying and FRI photointerpretation is done through contractors, mostly small companies.
• Photo interpreters must pass a mandatory ELC/FRI training course and a species identification test.
• Supplemental data in photointerpreting a forest management unit: o Calibration Plot data o Natural disturbances, such as forest fire, blow-down, insect damage. o Soils, landforms (Northern Ontario Engineering Geology Terrain Study – NOEGTS) o Harvest data o Silvicultural treatments
• Water classified through a semi-automated approach – manual component includes stereo editing of, e.g., true islands vs. floating vegetation, cleaning up shorelines due to shadows, etc.
Source: OMNR (2010).
FRI Audit Process
• MNRF runs FRI audit.
• First, quality assurance routine is run to ensure compliant with the Forest Information Manual (FIM) attribute content and structure. Errors found are returned to contractor for correction.
• Once the FIM check is passed, 10% of the polygons – 9% forested and 1% non-forested – are randomly chosen for the interpretation audit.
Source: OMNR (2010).
Stand (Polygon) Delineation
• Polygons (stands) are delineated based on the following criteria:
a) Ecosite classification (soil texture and depth, moisture, vegetation cover, etc.).
b) Forest management functionality (species composition, age/height, crown
closure).
Ecosites of Ontario
• There has been a need in Ontario for standardized and consistent ways to identify, describe, name and map ecosystems at different scales, to, among other things, allow for clear communication between different levels of government and diverse non-government organizations.
• The goal of the provincial Ecological Land Classification (ELC )is to meet this need by creating a standardized classification at varying scales for all areas on the landscape – no “holes” in map.
• The ecosite level in the ELC hierarchy has been developed specifically to meet the needs of meso scale (i.e. 1:8,000 to 1:50,000) forestry and planning applications.
Source: OMNR (2009a).
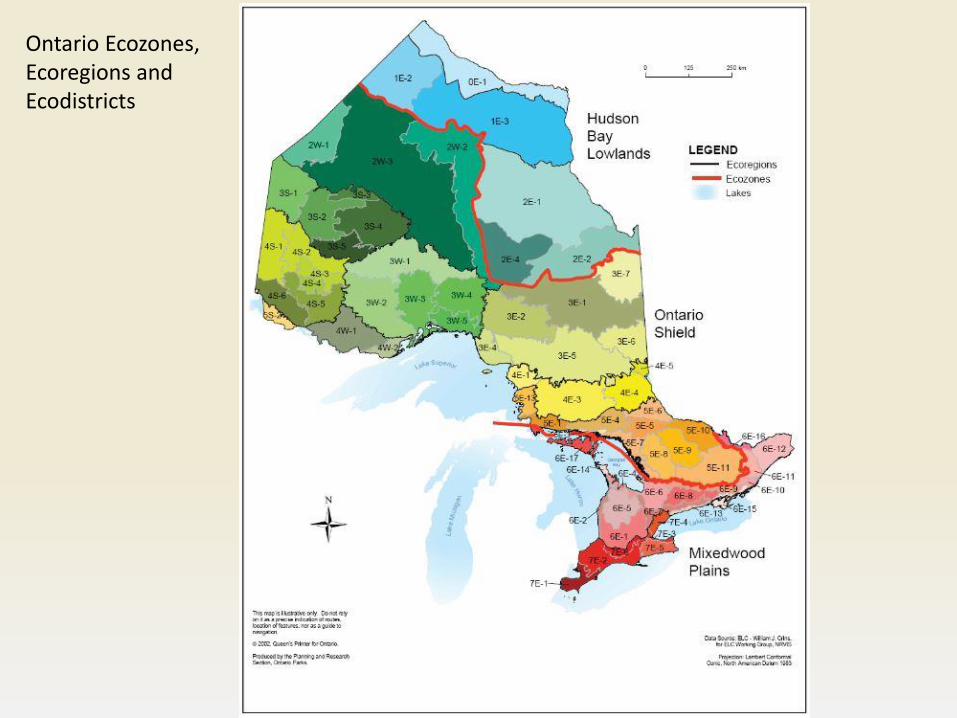
Ontario Ecozones, Ecoregions and Ecodistricts
Ecosites of Ontario
Definition: Ecosites are landscape areas consisting of typical, recurring associations of vegetation types (v-type) and substrate types (s-type) combinations (v-type x s-type = ecoelement).
• Ecosites have been developed as an operational classification to identify and delineate the patterns we observe on aerial imagery (photos).
• Ecosites are above all based on the stable features of the physical landscape (substrate depth, texture, landform and nutrient regimes).
• Ecosite polygons are primarily delineated using those physical features – so called ‘ecological drivers’ – which most affect the distribution and character of the vegetation. Finally, polygon is delineated based on the varying character of the vegetation, which is responding to not only the physical environment, but disturbance and succession as well.
Source: OMNR (2009a).
Ecosites of Ontario • A province wide approach to ecosite classification posses some unique challenges when it comes to ecosites found, e.g. in the north and the south of the province.
• To address differences due to climatic and bio-physical context, along with the plant species associations typical of such physical conditions, four main geographic ranges have been established: Sub-arctic, Boreal, Great Lakes-St. Lawrence, and Southern.
• Geographic ranges’ boundaries follow a combination of ecozones, ecoregions and ecodistricts boundaries
Source: OMNR (2009a).
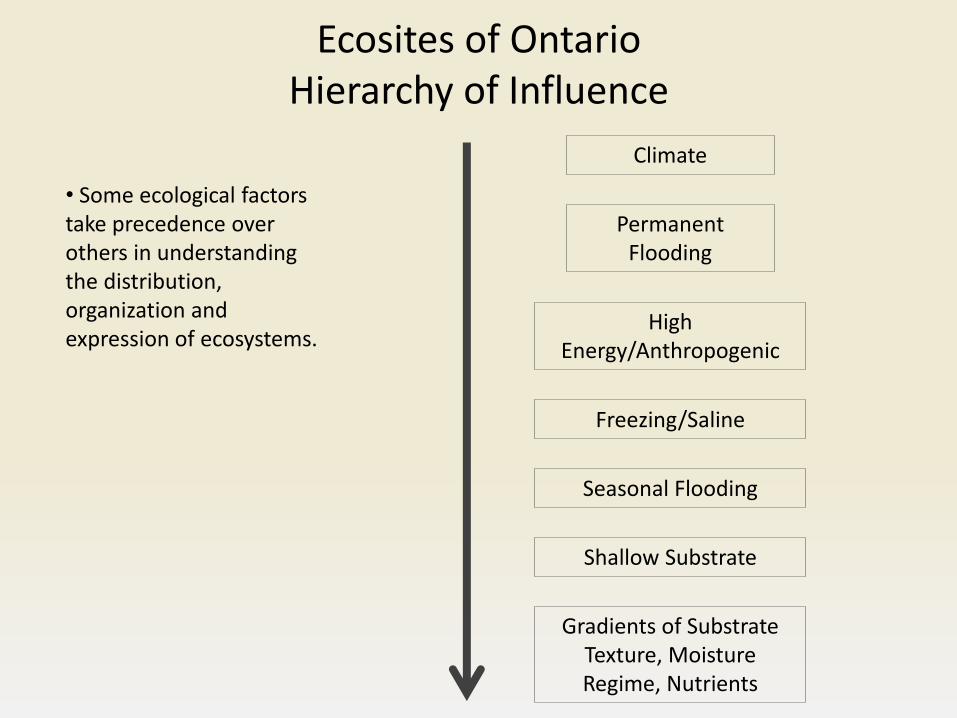
Ecosites of Ontario Hierarchy of Influence
Climate
Permanent Flooding
High Energy/Anthropogenic
Freezing/Saline
Seasonal Flooding
Shallow Substrate
Gradients of Substrate Texture, Moisture Regime, Nutrients
• Some ecological factors take precedence over others in understanding the distribution, organization and expression of ecosystems.
Resources: OMNR. 2009. Forest Information Manual – Forest Resources Inventory Technical Specifications. OMNR. 2009a. Forest Ecosystem Classification Guide. Chapter 2 – Ecosites of Ontario. OMNR. 2010. Presentation delivered by Ian Sinclair, OMNR. North West Group. 2011. http://www.nwgeo.com/company/news.php