ID '207 792 ABTE01 TITLE INSTITOTION SPOTS AGENCY DATE IORA NOTE oocsult Nilson SE 033 653 Melton, Roger Functions, tnalytic Geoletry, Probability and Statistics. A Study Guide of the .ScienCe and Engineering Techivician -Curriculum. Saint Louis Comannity Coll. at Florissant Valley, No. Rational Science Foundation, Washington, dtc. 76 NSF-GE-337B; NSF -1E574 -22204 -A01; NSF -SED17 -17935 101p.; For related documents, see SE 031'647-657. Not available in paper copy due to copyright dttons. Contains occasional margin lity. 1 Science Teachers Association, 1742 icut Ave., N.V., Washington, DC 20009 (sr rrect price). restr legib AVAILABLE ?ROB Natio Conn ,for c 11DIS PRICE BF01 Plus Postage. PC Not Aviilable from £DES. DESCRIPT1Rs Algebra; *College Science; Engineering Education; Geometry; Graphs; Interdisciplinary Approach; *Mathematics; *Postsecondary Education; Probability; Science COWIN Improvement Projects; *Technical Education; Trigonometry IDENTIFIERS *Science and Engineering Technician Curricalq Aesstact This study guide is part of an interdisciplinary course entitled the Science and Engineering technician (SET) Curricular. The course integrates elemints iron the disciplines of __dhenistry, physics, mathematics, aechanical technology, and electronic technology, with the objective of training technician In _the use of electronic instruments and th r applications. This g de -rpm that part of the mathonatics co tint ent related to functions, analytic geoaetry, probability, and- stat tics.; The following topics are inclwded:.(1) variation; (2) polynomial equations of higher degree; (3) analytic geometry= (4) grape( of the trigonometric functions; (5) counting and probability; land (6) statistics and curve fitting. (Author/Sr) . \ \, ***********4********************************************************** P Reproductions supplied by EDIS are the best that can be made * * from the original document. * ***********************************************************************
Transcript
ID '207 792
ABTE01TITLE
INSTITOTION
SPOTS AGENCYDATE
IORANOTE
oocsult Nilson
SE 033 653
Melton, RogerFunctions, tnalytic Geoletry, Probability andStatistics. A Study Guide of the .ScienCe andEngineering Techivician -Curriculum.Saint Louis Comannity Coll. at Florissant Valley,No.Rational Science Foundation, Washington, dtc.76NSF-GE-337B; NSF -1E574 -22204 -A01; NSF -SED17 -17935101p.; For related documents, see SE 031'647-657. Notavailable in paper copy due to copyright
IDENTIFIERS *Science and Engineering Technician Curricalq
AesstactThis study guide is part of an interdisciplinary
course entitled the Science and Engineering technician (SET)Curricular. The course integrates elemints iron the disciplines of
__dhenistry, physics, mathematics, aechanical technology, andelectronic technology, with the objective of training technician In_the use of electronic instruments and th r applications. This g de
-rpm that part of the mathonatics co tintent related to functions,analytic geoaetry, probability, and- stat tics.; The following topics
are inclwded:.(1) variation; (2) polynomial equations of higherdegree; (3) analytic geometry= (4) grape( of the trigonometricfunctions; (5) counting and probability; land (6) statistics and curvefitting. (Author/Sr) .
\
\,
***********4**********************************************************P Reproductions supplied by EDIS are the best that can be made *
S. TideFobtions, Analytic Geometry, Probability and Statistics: .
Study Guide of the Science and Engineering Technician Curriculum
3. termbsabon DataJuly 31, 1979
Amount$70,400 (Cum. Amt.)
S. TypeFinal Technical Report
7. Performing Organisationmrr ProjectRt. Louis Community College at Florissarit Valley
St. ,Louis, MO 63135
8. Pagination99 pages
9. Accession Number
00313
11. Principal investigator: Field or SpeciakyDonald R. Mowery eii/Lai.oe4et LT Cu'olf
ansTarOgrani Manager
Gene D'Amour
14. SEDR Subprogram
10. Performing OrganizationReport Number
13. SEDR Program
DISE
4
11. AbstractThis study,guide is part of an interdisciplinary course of :Andy entitled the Science
rind 'witnessing Technician Curriculum (SET). The curriculum integrates.elemonts from the
disciplines ofchemistry, physics, mathematics, mechanical technology, and electronic
technology, with the objective of training technicians in the use-of electronic instruments
and their applications.- .
This guide provides that part of the mathematics content related-to functiomeo analytic
geometry,robability, and statistics. 'The following topics are included: (1) variation;
(2) polynomial equations of higher degrees (3) analytic geometry: (4) graphs of the
trigonometric funetions, (5) counting and probability:A:IA(6) statistics-curve fitting.
ii. ors
Stu Guides
Ins tional Materials
Juni r CollegesAs 'Ate Degrees
Math tics
College MathematicsMathematics CurriculumProbability TheoryStatisticsGeometry
nce and Engineering Technician Curricului (SET)
e.
Ma ematies, General / Mathematical Sciences
19. Target Audience
Two-Year College Students
-409Ry
ted number of copies available from St.Community College at Florissant Valley
Louis, MO 63135
81. Supplemental NotOne copy
(
k
/
FUNCTIONS, ANALYTIC GEOMETRY,
PROBABILITY AND STATISTICS
A STUDY GUIDE
OF
THE SCIENCE AND ENGINEERING TECHNICIAN
CURRICULUM
00'
Author: Roger MeltonSt. LOuis Community College at Florissant Valley
N
Project Directors: Bill G. 'AldridgeDonald R. Mowery
. Lawrence J. Wolf
Study Guide Editor: Peggy DixonfMontgomery College, Tatt.:- Park, MD
y
Address: SET ProjectSt. Louis Community College at Florissant VilleySt. Louis, Missouri 63135
C-opytight 1978,by St. Louis Community College at Florissant Valley.Pridted in United, States of America. All rights reserved. This bookor irirts thereof may-not be reproduced in any form without permission.
The terials contained hereii were developed under Grant Numbers DEC i 2 1980HEST -22284 A01, GZ-3378, and ISED77- 17935. c
4
4.
CHAPTER I -
SectionSectionSection
CHAPTER II
TABLE OF CONTENTS -
VARIATION.
1 - Direct Variation12 - Inverse Variation
3 7 Joint Variation
3
- POLYNOMIAL EQUATIONS OF HIGHER DEGREE . 7
-Section-
SectionSectionSectionSectionSectionSection
1 - Polynomial Functions in One VariableQ - Roots and Zeros3 - The Graph of a Polynomial-Function4 - The Remainder Theoreb and Synthetic Division5 - The Factor Theorem6 - Roots of Higher Degree Polynomial Equations. .
7 - Irrational Roots of Polynomial Equations
7
7
7
10
13
20
CHAPTER III - ANALYTIC GEOMETRY 21
S4ction 1-ft.-Linear Equation in Two Unknowns --The Line 21
Section 2 - distance Between Two Points and,Slope of a Line 22
Section 3 Equations of G Line 24
Section 4 - The Circle 27
Section 5 - The Parabola 31
Section 6 - The Ellipse 36
Section 7 - The Hyperbola % . .42
CHAPTER Iv GRAPH4,0F/THE TRIGONOMETRIC FUNCTIONS . . ......... 48
Section 1 - Graphs of y = asin 1:10 and y = acos be 48.
Section 2 - Graphs of y = asin (be + c) and y = a'cos (be + c). . .55
Section 3- Grarths of y = tan 8, y rl cot 8; y = sec 8, y = csb 8 . .58",
CHAPTER V - COUNTING AND PROBABILITY 63
Section 1 - Counting: The Multiplication Principle 63
Section 2 - Counting: The Addition Principle 66
.:section 3 - The Multiplication and Addition Principles Together. . 46
Section 4 - Curve Fitting - Linear Empirical Equation 80
ANSWERS TO EXERCISES
INDEX 95
85
_1_
CHAPTER I
VARIATION
Section 1 - Direct Variation
The following table shown some corresponding values of the distance "s",-74iven in meters, a body-falls dibe---N gravity and the time "t" of fall insecondi. The -square of the time, t4, is eso given because it xnlatesto s in a significant way.
t 0 1 2 3. 4 5 6 10
s 0 '4:9 19.6 44.1 78.4 122.5 176.4 490.0
t2 0 1 4 9 16 25 36 100
A comparison,',Uttween corresponding values of s and t 2 shows that thequotient s/e is a constant 4.9 meters per second squared. That is,
Thus, s/t2 = 4.9 and s = 4.9t2. This relationship can be stated:
"s varies directly as the square of t."
In general, fotwo quantities x.and y, if the ratio y/x is constant, sayk, then y is said to'vary directly di3 x, written y/x = k or y_= kx. The
-:constant k is called the'constant of variation.
Examples.
1.1 The statement "y varies directly as
a. the square root of x "'is written y = k- & .
b. the cube of t" is writteny = k- t.3
c. -the absoluteovalue of z" is written y = k- Izi
1.2 Suppose R varies, irectly as the fourth power of C. Empirically,it is found that R = 32 when C = 2. Find the equation ofdirect variation. Then, fiom'the given data, determine theconstant of vatiaii66k:Wevirtte the equation as a formulain tetnm of R and C.
Step 1. The equation is R = kC4
-N.
1/-A
-1-4"""
-2-
Step 2., Substituting R = 32 and C = 2 into R = kC4gives 32 = 24. Solving for k gives k = 2.
Step 3. R = 2. C4.
1.3_ M varies direct as the square root of N. If N increases
by a factor of ixteen, what corresponding change occurs
fin M?
Step 1. The direct variation equation is M = k- .
Step 2. Let the increase in N be given by N' = 16 N.
Step 3. Let M' be the value of M which corresponds to N'.
Step 4. M' =kVF.
M' = k-
m. k 4.4.
M' = 4-k- hi.
mr 4 M.
Step 5. Conclusion: The value of M increases by a factor .
of four then N increases by a factor of sixteen.
1.4 The period T or a simple' penduluM varies directly as the
square root of its'length L. If the period is 2 seconds.for a pendulum 64 centimeters long, find the period for a
pendulum 121 centimeters long.
Step 1. The direct variation equation is T = k. /E.
Step 2. Substitute T = 2 and L = 64 into T = k. IE to find
the value of k.
2 = k.
Step 3. Thus A:.
Step Substitute L = 121 to find T:
T= ,t-i ATI
11 ftT = s
-3-
Section 2 Inverse Variation
The relationship between. the_pressure P and the volume V of a gas is
such that as the pressure increases, the volume decreases, and as the
pressure decreases, the volume increases. Specifically, the product of
the pressure and volume is olonstant, written symbolically as PV = k.
Hence, P = k1 and V = k 11= The pressure and volume are said to varyP.
inversely.
1In generalr for two quantities x andy, if y = k -.i,.. then y is said to
vary inversely as x where k is the constant-of variation.vary
Examples.
2.1 It is known that F = 5 when G = 1000. If F varies inversely
as the cube root of G, find. F for G = 0.008.
Step 1. The'inverse variation equation is F = k1
Step 2. Substitute F = 5 and G = 1000 into the equation
to find k.
Step 3. 5 = k1
V1000
Step 4.
Step 5.
Step 6.
k = 50
Thus, F
Substitute
F = 50
50
= 50 1
3r-
G = 0.008 to find F.
1
057-07g
f
F =0.2
F = 250.
2.2 The intensity of light I at a point varies inversely as the
square of the distance d the point is from the source of
light. It is known that the intensity is 25 units at a dis-'
tance of 10 centimeters. What is the distance from the light
source when the light intensity is 4 units?
.
8
a
-4-
Step 1. The inverse variation &illation is
1I = k 2-
d
Step 2. Substitute I = 25 and d = 10 to, find the value of
k.
25 =k1
10
k. = 2500
Step 3. Thus, I = 25001
.
Step 4. Substitute I = 4 and solve for d.
4 = 25001
-5-
2500
4
d = 25 CM.
Section 3 - Joint Variation
It is possible that one quantity varies directly and/or inversely as two
or more other quantities. In this-case, the quantities are_said to vary'
jointly.
Examples.
3.1 C varies directly as A and inversely as the square root
of B. If A increases by a factor of six and B decreases
by a factor of one-fourth, what change occurs in the cor-
responding value of C?
Step 1. The variation equation is C =1-
.
Step 2. Let C' ba the value of C which corresponds to 6 A
and1- B.4
ti
- -
=
4
-5-
44,
e
Step 3. C' =lc. 6A
V Ti
1
C-'= k 61
1
C' = 12 et AJET
C' r- 12 C
Step'4. Conclusion: The value Mf C increased by a factorof 12.
Exer ise Set 1
1. Translate each statement inta variation equation.
a. T varies inversely as the cube root of S squared.4.7
b. A quantity y varies directly as x and inverselyas the cube of z.
c. The power P in a jet of water varies directly as thecube of the water's speed s and directly as the cross-sectional area A of the jet.
2. The heat developed in a resistor H varies directly as thetime t and the square of the current i in the resistor.
A
a. Write tie variation equation..
b. Fhe hat if k = 2, ^t = 40, and i = 0.5.
3. The area of a circle varies directly as the square of its radius.
a. What is the constant of variation in the above relationship?
b. If the radius of a circle is increased to four times itsoriginal length, what corresponding change occurs in thearea?
7-
-6-
4. In each-Mt --ttie following types of variation, assume that x
doubles in value and z decrease. by a factor of:one -thiid.
Find the corresponding change in y.
a. y = kx- z b. y= k x. c.
z
5. The electrical resistance of a-wire varies directly as its
leng d inversely as the square of its cross-sectional areas
One t e of wire= of length 150 m and cross-sectional area
0.12 cM24has a tesistance of 0.3 ohms. A second wire,
made of the same metal,:h s a length of 300 m and a cross-
sectional area of 0.24 cm . What is the electrical resist-_.:.
ance of the second wire? II
r
I
-
-7-C
CHAPTER II--
POLYNOMIAL EQUATIONS OF HIGHER DEGREE-
'
Section 1 - Polynomial Functions in One Variable c
A function f1(x) =a0 xn + a,xn-1
+ a2xn-2
+ +an -1x +a where a0,
mare real numbers, a0 0 6, and n is a nonnegat.ve integer, is called a 4
polynceiail function of degree n.
If n = 0,Ithen ffx).= ao is a constant function,. For n =1, f(x) = a0x :flaiais a linear function; for n = 2, f(x) = -xl iaix + a2s a quadratic f on
1.-u
This chapter will deal\primarily with polynomial functions foY n k 3, calledpolynomial ,functions of\higher degree.
Examples.
4r 1.1 f(x) = 5x3, written; i4 3x can be n the formf(x) = 5x3 + Ox2 + 3x - 4 in which a0 = 5, al = 0,a2 = 3, and a3 = -4. The degree is 3.
1.2 's(t) = t5 - 2t2 t has degree 5, with a0 = 1, a1= 0, a
2= 0,
a - -2'a4= -3, and a
5= O.
Section' 2 - Root. and Zeros
If a polynomial function f(x) of degree n is set equal to some value, sayd, the equation f(x), = d is called a polynomial equation of degree n. Solu-
tions of f(Xl, = d are called roots. If*d = .0, then the roots of f(x) = 0are called zeics of f(x).
Examples.
2.1 A root of f(x) = 4x3 - 3x + 5 = 490 is 5\ becaude f(5) 490.
2.2 A zero of f(x) = x4 + 2x3 - 27 is -3 because f( -3) O.
2.3 Roots of x3 - 3x2 + 4x + 2 = 6 are the roots of x3 - 3x2 + 4x - 4 = O.
They are also the same III the zeros of x 3 - 3x2 + 4x - 4.
Section 3I- The Grapy gf a Polynomial Function
The graph of.a. polynomial-function f(x) is the set of all points whose
cooraTnatesIX,y) the--equation T. foc1.- The graph-is-made-1r/passing a "smooth "curve through a few selected solutions of this equation.
12
do.
-8-
Eximples.
3.1 Graph the function y = f(x) = x3 - 3x2 + x 3.
'Step 1. Using- a table an,' given values of x, find thecorresponding values of y, (Figure 2.1)
xl- 1 - 2 1-110 I 1 1_2 1 1
y I -60 -8 1-3 1-4 1-5 IC 117 I 52
Step-2. Entries-in the table correspond to solutions of the.
given equation. Graph these solutions.
60
45
30
.15
- 45
- 60
Figure 2.1
Step 3. Form the graph of y = f(x) by joining the graphsof the solutions from Step 2 by a smooth curve.
(Figure 2.2)
-6 -5 -4 -3 -2
Y
-45
aP30
0'15
1it
Figure 2.2
14
3.2 Approximate (o th41-nearest tenth) the roots-of,
f(x) x3' x 61i=1,d,for d = 0 and d = -5
graphically.
Step 1. Graph y = f (A) =Thus;
x
x3 - x2 - 6x as done in 3.1.
0 1 2 3 4
y = f(x) I --56t--18 1-02 I 0 -6 -8 0 24
41,15
-10
-15
-20
Figure 2.3
14
0
Step 2. The roots of f(x) = 0 are the x-coordinates
Of the points of intersection of y = f(x) and
the x-axis: These roots are -2.0, 0.0, and 3.0.
Step 3. Project the points of intersection of the, line
y = 5 and the graph of y = f(x) onto the x-axis
as shown in Figure 2.3. The corresponding x-
coordinates are the roots of f(x)= -5; namely,
-2.4, 0.7, and 2.4Nto the nearest tenth.
Exercise Set 1
1. Determine which of the:given values of the vaiiable are roots of the
equation.
a. x3 - 5x2 + x + 10 = -5; x = -2, 0, 3, 4
3 27 3 1 1
b. t t =-- -8 2 9 2
-
c. 4x4 2
- x + 3 = 610 = -2, 3, 1,
2. Determine which of the given values of the variable are Leros of the
function.
1141
a. f(x) = 5x3 - I5x; x = -3, 13, 2, 7
b. g(s) = s4 - Is
3 - 8s2
- 7s -\L.1,57-r= 0, -5, 2, 5
c. f(t) = t8 - 5t7 - t4 + 3t2 - 8; t = -2, 0, 1, -1
s
3. Find the zeros of f(x) = x3 + x
2 - 6x graphically.
4. Approkimate to the nearest'tenth the root(s) of f(x) = x3+ x
2- 6x = 10
from the graph in viercise 3._
Section 4 - The Remainder Theorem and Synthetic Division
In order to find roots of a polynomial equation or zeros of a polynomial
function, it is important to be able to find the value of a function cor
a specific value of the variable as quickly and easily as possible. One
method of evaluating a function is by substitution. For example, to,deter-
gne if 3 is a zero of f(x) = x - 2x - 5x + 11, let x = 3 to get
3 - 2-)2 - 5.3 + 11 = 5. Since f(3) = 5 and 1(3) # 0, 3 is not a zero
of, f(xY.
as.
4
. second method of evaluating f(x) for a specific value of x, say 3,involves dividing f(x) by x-3. The division process shows that the re-maindeg 5 is the value of f(x) when x = 3.
2. x + x 2
x-3 b2 .412x2- 5x + 11
, 2x - 3x
x2 5x
x2 -
- 2x + 11'- 2x + 6 4
54-remainder equals f(3).
Sinde x3 - 2x2 - 5x + al e (x-3)(x2 x - 2) + 5 (i.e. dividend equals_divisor times .0ot/eft plus remainder), letting x = 3 shows that
33 - 2.3
2- 5.3 + 11 = (3-3)(3
2 + 3-2) + 5,
f(3) = 0 (32 + 3 - 2) + 5,
and f(3) = 5, the remainder.
In general, the remainder theorem states that if a polynomial functionf(x) is.diided by x-r, then the remainder is the value of f(x) when x=r.
tiExamples.
4.1 Dividing f(xl = x3+ x
2- x-+ 7 by x j ( -3) or x + 3 i lds
a qudtient x - 2x + 5 and a remainder of'-8*. Thus
x + x2- x + 7 = (x + 3) (x2 - 2x + 5) -8,
f(-3) = (-3\+ 3)`. D-3)2 -2 ( -3) - 8,
f(-3) =
4.2 Find the value of f(x) = 3x3 - 2x2 + 4x - 'or x = 5.
Step 1. Divide f(x) by x-5.
3x2 +13x + 69
r.--53x 3 - 2x2
+ 4x - -23x3.-15x2
13x2 + 4x13x2 -65x
69x - 2
69x - 3453434-remainder
-12-
I
Step 2. By the remainder theorem, f(5) =,343.
, .
1
There appears to be,no advantage to evaluating a polynomial function using
the remainder theorem because of the tedious division involved. An abbre-
viated form of division, called synthetic division, will make the task
easier.
Examples.
4.3 Divide f(x) = 2x -3
7x2
+ 12 by x-2 synthetically and
find f(2).
S(ie1;71.----Write the coefficients of the terms of f(x) left
to right beginning with the highest aegree term
followed by-each successive lower degree term.
Step 2. Separate the coefficients-of f(x) from,the numbdr
2 (taken from the divisor x-2) and draw a line ,
as shown below.
2 -7 10 -12
Step 3. Write the first coefficient below the line and
multiply it by the 2 froM the divisor. Place
the product 4 above the line in the second column
and add. The sum (-3) appears below the line.!
31 2 -7 20 -12
4
2
Step 4. Multiply 2 from the divisor and the sum (-3) of
the numbers in the second column. Place the pro-
duct (-6) in the third column above the line.
Continue this process.
2j 2 -7 10/, -12
4 -6 8
2 -3 4 - 4
Step 5. The first three numbers below the line are the
coefficients Of -the quotient in descending power
order. The quotient is 2x2 - 3x + 4. The last
nu Der -4 is the remainder. By the remainder
theorem, f(2) -4.
0
-13-
4.4 Evaluate f(x) 5x4- 3x2 - 4x + 7 for x -5
Step 1. Divide f (x) by x (-5) or x+5
5 0 3 - 4 7
-25 125 -610 3070
5 -25- 122 -614 -3077 4- remainder
Step 2. By the cemainder theorem, f (-5) 3077.
4.5 Determine if - is a zero of f(x)4
7x 18#2
Step 1. Diyide f(x) by x-6
61 1 -76
G-6
3
0
-1818
1 -1 0 3 0*remainder
Step 2. By the remainder theorem, f (6) .1 0. Thus, 6 is
a zero. of f(x).
Exercise Set 2
synthetic`division and the remainder theorem to evaluate the function
tfor tha- given 'value of the variable,
'1. f(x) 2. 4x3
- 3x2 + 4x - 6; x = 2
2. g(tl_= -4t4
+ t3
- 5t2+ 3t + 4;-t = -2
13. F(m) m
3- - m
2+ 4m - 1; m 2.
6 6
4. f(t) 3t-2
5t3 + 2t - 1; t
f(s) la6
- 384 + 3s3- 15; s = -3
Section 5 - The Factor Theorem
Stippose r is a zero of f(x). By the remainder theorem', if f(x) is divided
4%, by x-r, the remainder is zero. That is,
f(x) , (x-r) S? (w) where -Q (x). is the quotient.
e
The factor theorem states that if r is a zero- of-:f(x), then *x-r is a factor
\of (z) Conversely, if x-r divides f(x) exactly, then r is a zero of fix).
18
-14-
4
A factor of the form x-r is called a linear factor.
Examples.
5.1 Determine ifx+7\is a factor of f( ,4x4 + 27x 3 - 4x2 + 19x - 14.If it is a factor\ find the quotient of f(x) divided by x+7.
Step 1. Divide f( i by x+7 to see if 17 is a zero of f(x).
2.1 4 -4 19 -14-21 14
4- remainder
Step 2. Since the remainder, is 0, f(-7) = 0 and -7 is a zeroof f(x). By the factor theorem, f(x)= (x+7)-(4x3-x2+3x-2
Therefore, x+7 is a factor of f(x).
Step 3. The quotient of f(x) +(x +7) is 4x 3 - x2 + 3x - 2.
35.2 Show that x I.- is not a factor of x3 - 3x2 + 4x + 1.
Step 1. Divide
3
f(x) = x3
I 1 /3 4
3 9
3- 3x
2+ 4x + 1 by x - -2-
-1-
75
3
2.
254
8N3
0 + remainder
Step 2
i3
. Since is not a zero of f(x), x - is not a fabtorof f(XT. g
Exercise Set 3A
Use the factor theorem to determine if the linear fac or is actor.of the
Apron polynomial.
:1. x3 7x2 + 15x + I; x + 3
A 12. x - 7x3 - llx + 28; x- 7
A* 3. y3.+ 1; y 1
D4. 2mS O+ 3m2 m + 6; m - 3
5. t5 - 32; t - 2
4
-15-
LeEticaoiSts of Higher Degree Polynomial Equations
The remainder and factor theorems are important in the process of finding
roots of higher degree equations. However, more information about roots is
needed to makel.the job of solving an equation less than a horrendous job.
An important idea involving rational roots of polynomial equations is the
rational root theorem:
Any rational root of a0xn + a
1xn- + + a
n-1x + a
n= 0 can he
expressed as a fraction 2 in lowast terms where p is an integral
factor of the constant term anand q is an integral factor of the
coefficient of the highest power term, a0.
In addition to the rational'roots theorem, some helpful facts in determining
the roots of a polynomial equation f(x) = 0 are
(1) A polynomial f(x) divided by x-rhas a remainder R = f(r) Remainder Theorem
(2) If r is a zero of f(x), thenx-r is a factor of f(x) Factor Theorei
(3) A polynomial Ovation f(x) =0of degree n has,exactly n realor imaginary roots Number of Roots
(4) The number of positive roots off(X):= 0 is no more than thenumber of changes in sign fromone term to the next in f(*) Positive Roots .
'.
\
(5) The number of negative roots off(x) = 0 is no more than thenumber of char es in sign from -4
one term to th next in f(-x) Negative Roots
, .
liao
(6)' If an imaginer number a + bj*is a'root of a ' lynom4a1equation,'then a ,- lajrcalledits coniiagate, is alsoa root Imo luaiy Roots
,,,N tl
An quation may have a ritiot occurs more than once in the so vingprocess.
For example, the equalop x3=4x2-3x+18 = 0, which can be,written in the
equivident Paim (x+2)(x-3)2 = 0, has exactly three solutions'of -2,/3,
and 3. The solUtibn 3,is said to have multiplicity two. If a root occurs
k times it has LiatosAr. k.
*Recall that jD 47f: called,the imaginary unit.0 .
20
Examples.
6.1 Determine the maximum number 0; pia sitive and negative rootsof f(x) = 4x5 - 3x4 + 7x3 + 2x- 4 x - 5 = 0.
Step 1. f (x) has 3 changes in /the signs of adjacent terms.
+4x5 3x4 + 7x3/+ 2x2 - x - 5
/ t
#1 #2 #3
/ The maximum number of positive roots is 3.
Step 2. Evaluate f (lc). -x.-
f(-x) = -4x5
3x4- 7x
3+ 2x
2* x - 5
Step 3. The numberot changes in sign of f (-x) is 2.
-4x5-/3x
4- 7x
3+ 2x
2+ x - 5
t
#1 #2
Step 4. The mad mum number of negative roots is 2.
6.2 The equation x4 - 6x3k 51x2 + 28x = 0 can be expressed as
x. (x - 8) - kx/ + 71* (x = What are the, roots of this
equation? /
Step 1. /There are 4 roots.
Step 2. By repeatei application of the factor theorem, whichsiSm, if x -r is a factor of a polynomiil f(x), thenr is i'ziro of (x1 or root of f(x) = 0 , the roots
are 0, 8, -7, and 2...2
6.3 One root of f(x) = x3 - 2x2 - 9x + 18 = 0 is 3. Find .the
remaining two roots.
Step 1. Because 3 is a ,root of f (x) = 0, 3 is it:per° of POO .By the factor theorem/ x-3 is a factor of f (x) .
Divide f (x) by x-3 synthetieally.
21.1 1 -2 -9 18
3 3 -18
1 1 -6 0
-17-
Step 2. The given equation can be written(x - 3) (x2 +-x - 6) = 0. Factoring
x2 + x - 6 gives (x - 3)(x + 3)(x - 2) =0.
Step 3. The roots, by the factor theorem, are 3, -3, and 2.
6.4 Two roots of x4- 6x
3- 14x
2- 6x + 13 = 0 are 3-2j and j.
Solve the equation.
Step 1. Since 3-2j is a root, its conjugate 3+2j is also aroot. Similarly, j being a root implies that -j is
also a root.
Step 2. The roots are 3-2j, 3+2j, j, and -j.
6.5 Solve f(x) = x4 + 4x3- 22x
2- 84x + 261 = 0
r-
StmTL1- The number of chaAges in sign in f(x) is 2; there
are at most 2 positive roots. The number of changesof sign of f(-x) is 0; there are no negative roots.Since there are,4 roots, at least two are imaginary.
-
:root of f(x) = 0 by substitution)(Step 3. Determine if x = a 1.
Step 2. The possible rational roots are positive integralfactors of 261 or 1, 3, 9, 29, and 261.
/
This will show that 1 is not a root.
Step 4. Determine if 3 is a root by dividOg f(x) by x-3.
21 1 43
-22
21
-84
- 3
261
'-261
1 7 - 1 -87 0
Chus, (x - 3) (x3 +.7X2 x - 87) = 0.
Step 5. Since the,root 3 may have multiplicity 2, determine.if x-3 is a factor of x3 + 7x2 --x-- 87.
21 1 7 -873 30 87
A 1 10 29 .0
Thus, (x - 3) (x - 3) (x2 + 10x + 29) = 0.
Step 6. The remaining 2 roots are roots x2 + 10x + 29 = 0,
a quadratic equation. Solving by the quadratic formula
gives x = -5-2j and x = -5+2j.
0n
-18-
Step 7. The roots are 3, 3, -5 -2j, and -52j.
6.6 Solve 8x3 - 26x
2= 9x - 45
Step 1. Write the given equation as 8x3 - 26x2 - 9x + 45 = O.
There are a maximum of 2 positive and 1 negative roots.The factors of 45 divided by the factors of 8 give thepossible rational roots.
±1,
15
2'
4--5
-8'
±3, ±5, ±9, ±15, ±45,
45 1 3 5 9±-2-, ±74,
15- ,45+-9
4---8' 8'
and 4'
8'
1±-2-,
15
4'
3
2'±-,
,454'
5 9
41 43
Step 2. Possible rational roots are tested by sxntheti5 divi-sion or substitution until a zero of 6x33 - 20x - 9x + 45
is found. One zero is 3 as shown below.2
3
2 8 -2612
- 9
-21
45
-45
8 -14 -30 0
Step 3. The equation can now be writte
(x -3
(8x2
- 14x - 30) --.-
Or
(x - -3e1.2.144x + 5) (x -
2
Step 4. The roots are3 5
d 3.
6.7 Squares the same size_ar cu' from the corners of a 10 by 12
decimeter piece of sheet 1. A topless tray is formed by
bending up the sides and,s dering the seams. What two dif-
ferent size squares can be cut from the corners to form a tray,
with a volume of 72 cubic, decimeters?
ITx
no mom alSA,
Dr d 111I
x 4
11=111111011111012 ======44
Step 1.
Step 3
Step 3.
Step 4.
T10
-19-
Figure 2.6
Let x represent the length ofThe volume of the tray can be
x(12 - 2x)(10 - 2x) = 72
x(-2)(x 6)(-2)(x - 5) =V
x(x - 6) (x - -5) = 18.
x3 - 11x
2+ 30x - 18
There are 3 roots with0 negative roots. e
1, 2, 3, 6, 9, and
= 0.
the square cut.expressed by
from which
72
a maximum of 3 positive andpossible rational roots are
It can be shown by substitution or the remaindertheorem that 1 an 2 are not roots. Testing the
number 3 as a pos ible root gives
1 1 -1/- 30 -18/3 -24' 18
1 - 8 6 0
from which (x - 3)(X2 - 8x + 6) = 0.
Solving x2 - 8x + 6 = 0 by the quadratic formula
yields xj= 4 + V16 or approximately 7.16 and
x = 4 -1,66 or about 0.84.
Step 5. The sizes of cuts can be 3or 0.84 decimeters(7.16 decimeters is not possible.)
2t.
1.
p
-20-
Exercise Set 4
a
1. Determine the maximum number of. positive and negative roots of each
equation.
a. 4x3- 3x 2 + x - 6 = 0 b. x3- 5 = 0
c. -4x4
- x2 3x + 7 = 0 d) 7x
3+ 3x
2+ 5x + 2 = 0
2. List the possible rational roots of the following, equations.
a. x4y 3x 2 - 2 = 0 b. x3- x +44 c. 4x3 - 3x + 8 = 0
1. Solveeach equation given a root(s).
a. x3 - 2x2 - 5x + 6 = Os x = 3
b. x3 - 4x + 341 0; x= 1
c. x4+ 2x
3- 6x
2- 22x + 65 = 0; x = 2-j, -3+2j
d. x4+.10x
3+ 26x
2+ 10x + 25 = 0; x = -5 of multiplicity two
4. Solve the following equations.
a. x3- 10x
2+ 31x = 30
b. x3 + 6x2 + llx + 6 = 0
c. 2x3+ 15x
2+ 24x - 16 = 0
d. x4- 7x
3+ 16x
2- 10x = 0 k
e. 6x5 - 7x4- 16x
3+ 12x
2= 0
Sections') - Irrational Roots of Polynomial' Equations
A higner degree polynomial equation having three or more irrational roots
cannot. be salved by the method presented in the chapter. It is suggested
that computer programs, if available, be used which find roots of all types
Ito a specified degree of accuracy. -
One such program is "ROOTER" designed to be used with a BASIC language
computer. This program approximates rational and irrational roots to the
nearest hundrel-thousandth.
25401
CHAPTER III
ANALYTIC GEOMETRY
Section 1 - Linear Equation in Two Unknowns - The Line.
'dine and equations of a line have been dealt with previously in thestudy guide Algebraic and Trigonometric Equations With:IOications. The'
isjportant concepts related to, lines introduced4igain but with ldis
edphasii apd detail.
A linear equation in two unknowns x and y has the standard fotm ax + by c" d
wherea; b,.icand c arb constants.
,A solutiOn of linear equation is an ordered pair (x,') which-satisfies the
"equation:
Thee of a linear equation 0 a line whose points have coordinates whichsitaikthe linear equation.
Examples.
1.1 The equations 3x - y = 5, y = 3 - 2x, "y - 4 = 0, x = 9, and
3y- 2x - 4 = 0 are linear equations.
81.2 Some solutions of the equation 2x - 5y = 10 are (0,-2), (1,-- 5 )
(5,0), and (10,2).
1.3 The graph 6f 5x + 3y =115 is the line which passes throughthe graphs of two soluaons of the equation. See Figure 3.1.
Figure 3.1
1.4 The equation y = -2 has,solutions of the form (x, -2). where x isany real number. The graph of y = -2 is A horitontal line havinga y -intercept of -2. See Figure 3.2.
1.5 The equation,x - 5 = 0 has solutions of the form (5,y) where ynumber. The graph of x - 5 = 0 is a vertical line
with a x-intercept of 5. See Figure 3.2.
MED
OOP
=11111106.
x- 5=0
51 R x
y = -2 -2
,
Fig-ire 3.2
Exercise Set 1
1. Write five solutions of each equation.
(a) _4x - 3y = 12 (b) x + y = 0 (c) x = -8
(d) x = y'+ 10 (e) 4y + 1 = 0
. 2. Graph each ...inear equation.
(a) 4x - 3y = 12 (b) x - y = 8
(d) 0.5x - 0.2y = 4 (e) 2y + 5 = 0
(c) 4x =
Section 2 - Distance setweei_ Pwo Points and Slope of a Line
The undirected distance between two points Pl (x1,y
1) and P
2x
2,y
2) in
the plane, written IP1P21, is
I P1P2 I =
2,
-23-
A directed distance from dne point to anther on a horizontal or vertical
line may be'defined. For two points Pit tx1410 and P (x ,k) on the horizontal
line y = lo"with P1to the left of P
2, the directed distaace from P to P
2(left to right) is the positive value P
1P2= x
2xi. The directea
distance from P2to P
1(right to left) is the negative value P2P1 = xl- x
2'
Similarly, if P1 (h,y1) and P2 (h,y2) are on the vertical line X = h withP2above P
1'the directed distance from P1 to P
2(upward) is the positive
----- value P1P2 = y2 - yi 1 2
The ditectkl distance from P
Y1 Y 2
Example.
(downward) is the negative value P2P1 =
2.1 The following distances arederived from Figure 3.3.
A Y
P2(-3,3)
3(5,3)
P1P2 - 3 -(-4) 7 X
P2P1= -4 - 3 = -
P1P4= 5 -(-3)
P3P2 -3 _ 5=-
P1( -3, -4) p4 (5, -4)
P1P3 = /(5-(-3)) 2 + 3-(-4))2 6 T47719
a
Figure 3.3
If P1
(x1,y ) and P
2(x
2,y
2) are any two points on a nonvetical line, the
slope m of the line is
Y2 Yl Y1 Y2m =
x2 - xi xi - x2
Two lines having slopes ml and m2 are parallel if and only if mi. = m2.
Two lines having slopes mi. and m2 are perpendicular if and only if
m1
or, equivalently, m1.m
2= -1.
sm2
Example.
2.2 Show that the lines having equations 4A_+ 3y = -6 and3x - 4y = 8 are perpendicular.
28
-24-
Step 1. Complete a table of values for each equation.
4x + 3y = -6:
x I 0 I 3
y -2 -6
3x - 4y = 8: v
x I 0 1-4y .1 -5
Step 2. Two solutions of 4x + 3y = -6 are (0,-2) and(3,-6). The equation 3x - 4y = 8 has thesolutions (0,-2) and (-4,-5).
Step 3. The slope mi of equation 4x + 3y = -6 is
-6 -(-1) -43 - 0 3
The slope m2 of 3x - 4y = 8 is
-5 -(-2) -3 3
-4 -0 -4 4
Step 4., The product ml m23 4
=3
= -1. Thus the linesare perpendicular.
Exercise Set 2
1'. Given the four points P1 (-6,2), P2 (5,3), P3 (7,2), and P4 (5,0),find the following distances.
(a) I P1P2 I (b) IP4 1P I (c) P(d) P
4P2
2, Find the slope of the line having the given equation.
(a) x - y = -3
(d) y - 3'= 0
(e)P2P4
(b) 211%- 3y = 6 (c) y - 3 = 4x
(e) 0.6x - 1.2y- 1 = 0
3. Determine if the following pairs of lines are parallel, perpendicular,or neither.
(a) y = x - 3, x - y = 5
(c) 2x - y = -2, 2y = -x
section 3 - Equations of a Line
An equation of a line can be determined if two points on the line are known.If P
1(x ,y1) and P
2(x
2,y
2) are two particular points and P (x,y) represents
any point on the line, then
(b) 3x + 2y = 0, 4x = 6y - 1
(d) y = -4, x+ 5 = 0
I
2"
a
-25-*
2Y1
Y Y - x )1 x2 - xi 1
is called the two-point form of an equation of a line.
Knowingthe slope m and a partitular point Pi (xi,y1) of a line, the
equation
y - y1= m (x - x
1)
is an equation of the line called the slope-point form.
The y-coordinate of the point of intersection of a line and the y-axis iscalled the y-intercept of the line, represented by b." .
If the slope m and y-intercept b of a line are known, an equation of theline can be expressed as
called the slo
y = mx + b,
-interce form.
Certain lines have special forms of equations. A vertical ,line passing
through'the point (h,k) has an_equation of the form x = h and a horizontal
line through (h,k) has an equation y = k.
Lines which contain the origin, (0,0),with a slope of m have the form y = mx.
Examples.
3.1 Aline contains the points P1 (-4,7) and P2 (3,5). Find an
equation of the line.
Step 1. Using the two-point form where P (x,y) is any point
on the line,
5 - 7(y,- 7) -
3 -(-4)(x-(-4)) which simplifies into
2x + 7y = +41.
3.2 A line contains-the point P1 (-4,6) and has a slope3
What is an equation of the tine?
Step 1. Substituting the coordinates (-4,6) and slopeinto the point-slope form gives
3- 6 = ---4 -(x -(-4))y
3x + 4y = 12.
3
4
which simplifies to
3.3 A horizontal line, vertical line, and a line which contains theorigin pass through the point P1 (-8,7). Write an equation ofeach line.
, Step 1. The horizontal line has an equation y = 7..
Step 2. An equation of the vertical line is x = -8.
Step 3. The slope of the line containing the origin and the' point P1 (-8,7) has a slope
7 - 0 7m
Thus, an equation of this line is y =7x + 8y = 0.
x or
3.4 'Write an equation of the line perpend4cular to the line5x + 12y = 2 which passes through the point P1 (0,6).
Step 1. Expressing 5xgives y =
12and the slopereciprocal of
Step 2. The point Pl
Step 3. The equation
+ 12y = 2 in .the slope-intercept form+ 1, The slope of this line is "Lt
6 12of the requited linv
2is the negative
-5 . That is, m = I1 5
(0,6) implies that the y-intercept is 6.
can be written in the slope-intercept form
Y x12x
+ 6 or 12x - 5y'= -30.
3.5 If the acceleration of an object is constant, its velocity vvaries linearly as the time t. The veldcity of an object after3 sec is 46 m/s and after 8 seconds it is 61 m/s. What wasthe initial velocity at t = 0 and the velocity after 12 s?
--51001881P"'
t
Step 1. Solutioni of the form (t,v) will satisfy the linearequation relating velocity. and time. Two such.solutions are (3,46) and (8,61).
Stnp 2. The slope of the requirid equation is
61 - 46 15 ,m
8 - 3 5
Step 3. Using the point-slope foist of an equation,
v - 46 = 3 (t - 3) or 3t - v = -37,
AT'
IL4'"At SA
Step 4. Letting t = 0 in 3t - v = -37 gives the initial velocity.
v = 37 m/s.
Step S. Substituting t = 12 into 3t v = -37 yields v = 73.
Thus, the velocity after 12 seconds is 73 m/s.
Exercise Set 3
. .1, Write an equation of the line which satisfies the following conditions.
a. Passes through-P, (-8,3) and P2 (4,7).
b. Parallel to 5x - y = 8; y-intercept 8.
2c. Passim throughwil (-4,-2); slope -3 .
d. Perpendicular to y 3x - 4; passes through PI (0,5).
e. Slope 0.9; y-intercept -1.
f. Vertical; passes through (5,9).
g. Horizontal; y-intercepC4.
h. Passes through P1 (-6,5) and the origin.
i. Parallel to y - 8 = 0; passes through the origin.
j. Passes through P1 (4,-8); has no slope.
2. In example 3.5, after how many seconds will the vellety of the object
be 98 m/s.
3. Assume that the length of a spring varies linearly as the force applied
in stretching it. A force of 4 newtons resulted in a spring length of;
14 cm. The length was 23 cm when the force was 7 newtons. How long is
the spring when no force is applied? If the spring is 32 cm long* what
is the force?.
Section 4 - The Circle
Geometrically, a circle is defined to be the set of all points P (x,y) whose1 i
distance from a.ttme point is constant.
The fixed point is cane the center of the circle and the constant distance
is the radius of the ciibIe. .
To
32
A
1
-29-
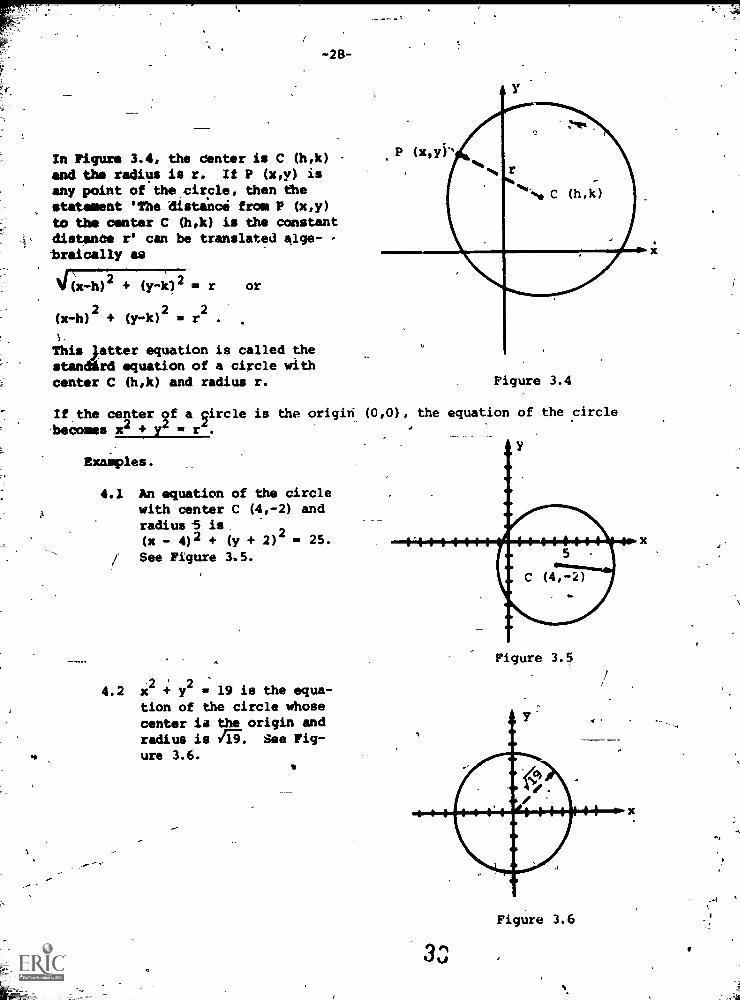
In Figure 3.4, the Center is C (h,k) -
and the radios is r. It P (x,v) isany point of the circle, then thestatement 'The distince from P (x,y)to the center C (h,k) is the constantdistends r' can be translated alge-braically as
N6x-h42 + (y-k) 2 - r or
(x-h)2+ (y-k)
2= r
2.
This latter equation is called thestandard equation of a circle withcenter C (h,k) and radius r. Figure 3.4
If the center 2f a qircle is the origin (0,0), the equation of the circlebecomes x2 + y' =
Examples.
4.1 An equation of the circlewith center C (4,-2) andradius-5 is.(x - 4)2 + (y + 2)' = 25.See Figure 3.5.
4.2 x2+ y
2 = 19 is the equa-tion of the circle whosecenter is the origin andradius is hi. See Fig-ure 3.6.
Figure 3.
Figure 3.6
s e
, -297
4.3 A circle has a diameter whose endpoints are P, (-6-,5)' and
P2
MS). What is anequation of the circle?'
Step 1: The diameter is aline segment passingthrough the center ofthe circle. The center
is theladOdibt-of thediameter. See Figure
3.7.
Step . The coordinates of the 1(-6center C are the aver-age of the correspondingcoordinates of P1 andP2.
Thus,1_
C(6 5),5 +8)
or2
1
fir`2r Figure 3.7
Step 3. The distancefrom the center C to either point P1or P2
is the radius. Therefore,
r = 14- 1 - 5)2-+ (8 - 13)22
v55 4154 2
1 2Ste0/4.Anequationofthecircleis(x+ -z+(y
13 2 625
4.4 An equation of a circle is x2+ y
2 - 10x + 4y + 4 = O. 'Determine
tliel'center and radius and sketch the graph of the circle.
Step 1. The given equation can be written in standard form by
completing the squares for the x- and y- terms.'
Step 2. Express the equation in the form
(x2 - 10x ) + (y2 + 4y ) = -4
4 t.
Step 3. Complete the square in x by adding the square of one -half
of the coefficient of x or 25 to both sides of the equation.
Complete the square in y by adding the squaw' of one-half '
of the coeffidient of y or 4 to both Sides.The result appears as
(x2- 10x + 25) + (y
2 + 4y + 4) -4 + 25 + 4
34.
Al
0
-30-
Step 4. 'Rewrite the equationfrom Step 1 in standardform as
5)2+ (y + 2)2 = 25.
Step 5. The center is Cand radius is 5. Thegraph appears in Fig-ure 3.8.
Figure 3.8
Exercise Set 4
1. Determine the center and radius of each circle whose equation is given.
of satisfying2. Write equation a circle the following conditions.
(a) C (3,0); r = 25 ,(b) C (0,0i; r'.,66
(c) C (4,-9); r = 7 (d) Passes through P1(-4,6); C (4,0)
(e) Endpoints of a diameter are Pi (-6,-2) and P2 (3,5)
(f) Radius of 6; coordinates of the center are a solution of thesystem of equations 2x - 3y = 1 and -4x +'Sy =-1.
3. Is the point P (5,3) on the circle is
(x - 3)4 + = 6)2 go 13?
35
-31-A A,
Section 5 -'The Parabola
A parabola is defined to be those points in aplans whose distance from a fixed line and afixed pant not on the line are equal. Figuxe3.9 stows three points Pi, P2,-and P3 ,on aparabola whose distances from a fixed line Land point P are-d
l'd2'and d3, respectively.
The'fixed line L_is called the directrix.
The fixed pant is called the focus.
A line throii4h the focus perpendicular tothe directrix is called the axis of symmetry.
The point of intersection of the parabola andits, axis of symmetry im'Called the vertex.
Standard eqiutions of pailbalas_whichsatisfy various conditions shown inFigures 3.11 -3.14 re given below.Each, equation can,e derived from theleometricldefinition of a parabola wherep is the directed distance from thevertex to the focus of the parabola.
a'
V(o,o) Focus
Vertex Flp,o)
1
Id2
Figute 3.9
Focus
IdI
L
FOCUS Axii--
rtex
Figure 3.10
0
tt
X
V(o,o)
P(P,o) Vertex
31,2= 4px; p > 0 y
2= 4px; p < 0
Figure 3.11 Figure 3.12
36
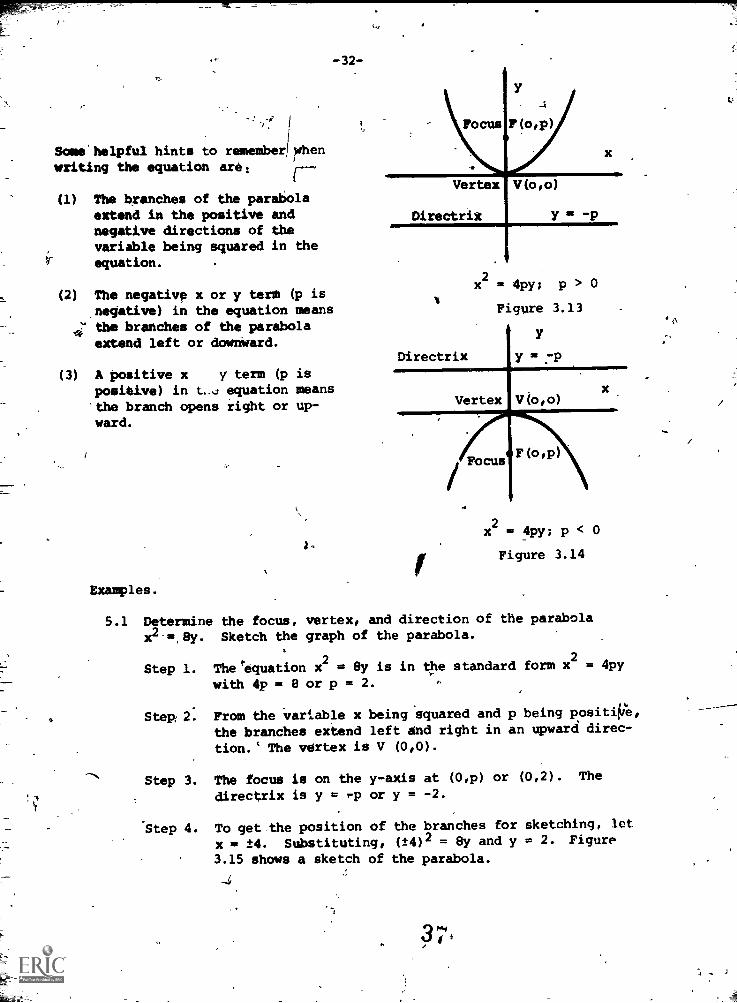
Some' helpful hints to remember/thenwriting the equation are:
(1) The branches of the parabolaextend in the positive andnegative directions of thevariable being squared in theequation.
(2) The negative x or y term (p is_negative) in the equation meansthe branches of the parabolaextend left or downward.
(3) A positive x y term (p is
positive) in t., equation meansthe branch opens right or up-ward.
I .
Examples.
-32-
Focus F(o,p)
x
Vertex V(o,o)
Directrik Y -P
Directrix
f
x2= 4py; p > 0
Figure 3.13
Vertex V(o,o)
FocusFt/3,p
x2= 4py; p < 0
Figure 3.14
5.1 Determine the focus, vertex, and direction of the parabola
x2 =,8y. Sketch the graph of the parabola.
Step 1. The'equation x2 = 8y is in the standard form x
2= 4py
with 4p = 8 or p = 2.
Step 2. From the variable x being squared and p being positiPe,
the branches extend left and right in an upward direc-
tion.` The vertex is V (0,0).
Step 3. The focus is on the y-axis at (0,p) or (0,2). The
directrix is y = rp or y = -2.
Step 4. To get the position of the branches for sketching, let
x = ±4. Substituting, ( ±4)2 = 8y and y = 2. Figure
3.15 shows a sketch of the parabola.
3"4
p,
*as
1r.
-33-
6
(-4,2 FoCus4 F(0 2)2 (4,2)
10 8 -6 4 2 2 4 '6 8 10Directrix -2 Y. -2
-4-6-8
Figure 3.15
5.2 A parabola has the vertex V (0,0)an equation of the parabola.
and focus F (-6,0), Write
Step 1. Since the focus is left of the vertex, the parabolahas a graph extending to the left with an equation
form y r 4px.
Step 2. From,the focus F (-6,0), the value of p is -6.
Step 3. The equation is y2 =4(-6)x -24x.
5.3 Find an equation parabola whose directrix is y = 6 and
focus ,-6).
Step 1. The focus is below the directrix. Thus, the parabola
opens downward. The vertex is midway between the foiTand directrix at the origin.
Step 2. The standard form of the equation is x2= 4py where p
is the distance from V (0,0) to F (0,-6) or -6.
Step 3. The equation is x2= 4(-6)y or x
2= -24y.
For the vertex of a parabola located at some-point (h,k) other than the origin,
the same equation analysis presented earlier applies. However, the x and y
in the equation are replaced by x - h and y - k, respectively.
Examples.
5.4 Sketch the graph of the parabola (y - 6)2
= 24(x + 3).
38
-34-
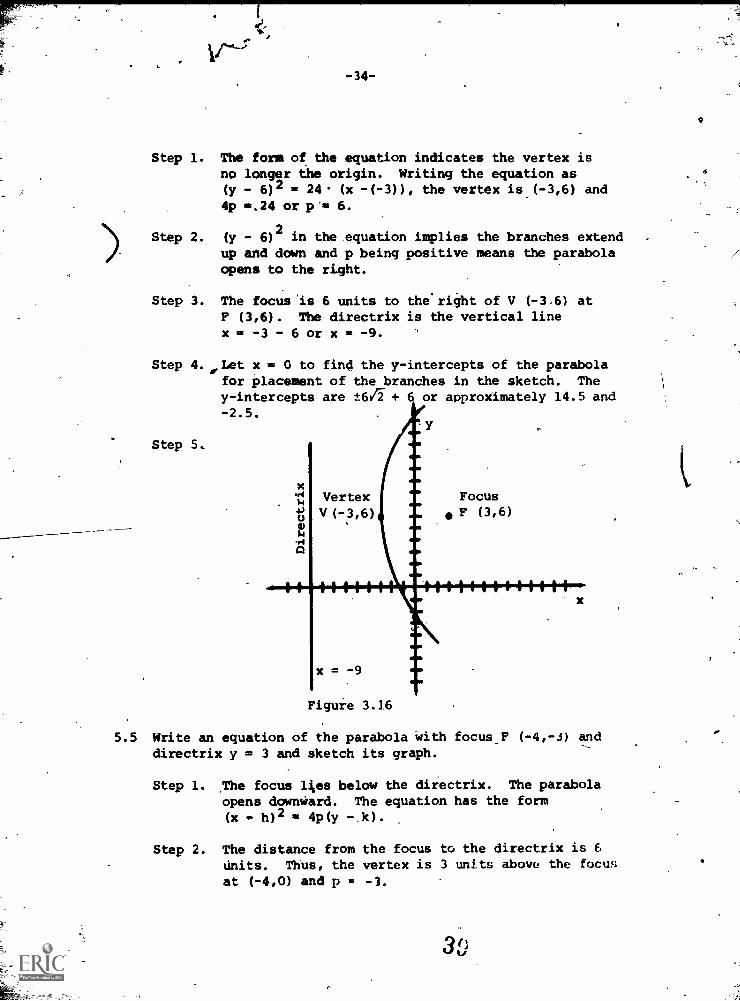
Step 1. The form of the equation indicates the vertex isno longer the origin. Writing the equation as(y - 6) 2 = 24* (x -(-3)), the vertex is ( -3,6) and
4p =.24 or p*ma 6.
Step 2. (y - 6)2
in the equation implies the branches extendup and down and p being positive means the parabolaopens to the right.
Step 3. The focus is 6 units to the right of V (-3,6) atF (3,6). The directrix is the vertical linex = -3 - 6 or x = -9.
Step 4. Let x = 0 to find the y-intercepts of the parabolafor placement of the branches in the sketch. They-intercepts are ±6VT + 6 or approximately 14.5 and-2.5.
Step 5.
It
VertexV (-3,6)
x = -9
Figure 3.16
FocusF (3,6)
1111411-1+4-4il
5.5 Write an equation of the parabola with focus_F (-4,-3) anddirectrix y = 3 and sketch its graph.
Step 1. The focus lies below the directrix. The parabola
opens downward. The equation has the form
(x h)2 401, - k).
Step 2. The distance from the focus to the directrix is 6
units. Thus, the vertex is 3 units above the focusat (-4,0) and p = -3.
\\\ 1
S ep 3. Substituting V (-410) and p =-3 into the standard
form gives (x + 4)4 = -12y. .
Figure 3.17
5.6 DeterMine the focus, vertex and directrix of the parabola
whose equation is 4x - y2 - 44= 0.
.Step 1. Express the equation in the,form y2 4y r 4x and
complete the square for the y variable.
4y + 4) = 4x + 4
(y 4- 2)2= 4(x + 1)
Step 2. The vertex is V (-1,-2) withOp = 4 or p = 1.
Step 3. Since y is the squared variable and p is positive,the parabola opens to the right. Knowing this, the-
focus is kuml,t = 1) to the right of the vertex
(0,-2 ). Ike directrix is the vertical line x = -2.
Eiercise Set 5
1. Determine the focus, vertex, and equation of the directrix for the
parabola with the given equation and sketch its graph.
(a) y2 = 10x (b)
(d) 4)2 4 -4(y - 5)
x2 = -28y
(e) (y + 6)2= 12x
(c) y2
= -x
-36-
2. Write. an equation, for the parabola satisfying the given conditions.
(a) V (0,0); F (0,3)- (b) V (0,0); directrix x = -10
(0,-2); directrix y.= 2 (d) V (5,3); F (10,3)
(e) V (-4,6); diractrix x = 1 (f) F (-5, 2); directrix y = -10'
3. Assume that a cable in theshape of a pirabola is supported onJevelground by two pillars, 80 meters-high and 200 'meters apart. The lowestpoint on the cable is 20 meters above the base of the pillars and mid- .
'br. between them. How high is the cable above the ground at a point 30meterr from a pillar?
ction 6 - The Ellipse,.
An ellipse is a set of points which satisfies the following condition;
4 The sum of the distances from two fixed points to any pointof the ellipse is constant.
In Figure 3118, the point P1 on theellipse is a distance 'd1 and d2 fromtwo fixed'poihts F1 and F2 withd1
d2+ d. = kis
a constant. Another'point P2 s a distance of el and e2from Fi and F2, respectively. Bydefinition, e, + e2 = k.
Important quantities-associated withtheellipse and represented in Figure3.19 are described below.
(1) Each of the fixed points F (-c,0)_and F (c,0) is a focus
.11he plural of focus is foci.
(2) The two vertices V1 (-a;0) andV2 (a,0) are the intersection ofthe ellipse and the line passingthrough the foci.'
(3) The center C (0,0),is the mid-point of Fin%
p. ellipse
Figure 3.18
,(4) The line segment V1V2 is the major Vertex
axis, 2a in length. ti
(5) The minor axis is the line segmentjoining (0,b) and (0,-b), the pointwhere the ellipse intersects they-axis.
(6) The relatibnship among the coordinatesa, b, and c-is a2 = b2 c2.
Figure 3.19
-37-
The standard equation of an ellipse whose foci lie on the x-axi with
center C (0,0) is
2 2
+ 1= 1 where a2
b2
.2
x y
a b
The standard equation of an ellipse with foci on the y-axis and centerC (0,0) is _
2 2
+ = 1 where a2
> b2x
.
b2 a
Examples.
6.1 Find the foci, vertices, center and lengths of the majorand minor axis of the ellipse x4 xf...
36 9
Sketch the graph of the ellipse.
Step 1. Since 36 > 9, a2= 36 and b
2= 9. Thus, a = 6
and b = 3. The vertices are V1
(-6,0) and V2 (6,0).
The center is C (0,0).
2Step 2: Froma2 =b2 +c2;c2 =a2 -b= 36 - 9 27 and
C = = 3/i. The foci are F1
(-3.5-,0) and F2 (3)/Y,0).
Step 3. The major axis is 2a = 2-6 = 12 units long.The minor axis is 2b = 2.3 = 6 units long.
Step 4.
Figure 3.20
42. A )\, . .
-38-
6.2 Write an.egtiation of the ellipse having its center at the origin,a vertex V (0,-15) and a focus F
2(0,10). Sketch the graph
of the ellipse.
Step 1. From V (0,-15), -a = -15 or a = 15. From the eocusF2 (0,10), c = 10.
Step 2. Since a2b2 c2, 152 = b2 + 102 and b2 = 125.
Step 3. Because the foci lie on the y-axis, the ellipse iselongated in the vertical direction with the equation
''''
x22
125+
2251
Step 4.Y -
(0,15)
(-5/3,0) (5/3,0)
-15 15
Figure 3.21
(0,-15)
6.3 Sketch the graph of the ellipse 9x2+ 81y
2= . 100.
Step 1. In an effort to express the equation in standard form,divide both sides of the given equation by 100.thus,
9x2
81y2
+ = 1.100 100
Step 2. Multiply the numerator and denominator of the term9x2/100 by 1 and, similiarly, the numerator and
9 1denominator of the term 81y
2/100 by . The final
81form is
2x2
1.100 1009 81
10Step 3. By inspection of the above equation, a = 7 and
b = 109
Figre 3.22
If the center of an ellipse is located at some point (h,k) with its verticesand foci on d horizontal line, the standard equation of the ellipse is
2
- h) (y - k)2 =1a
,
b2
where a2> b
2.
If thf-, center is (h,k) and the vertices and/or foci lie on a vertical line,
the 4tandard equation of the ellipse is
b2
2 2- h) (y
a2
k)= where a
2> b
2.
Examples.2 2
1696.4 For the ellipse +
361, write the coordinates
.
of the center, vertices, and foci. Determine the lengths of -
the major and minor axes. Sketch the graph of the ellipse.
'Step 1. The center is C (4,-2).
-Step 2. Because 169 > 36, a2 = 169 or a = 13 and b2= 36 or
b = 6, The vertices are 13 units left and right of -
the center on the horizontal line y = -2. The .
vertices are V1 (-9,-2} and V2
(17,-2).
-40-
.
Step 3. c2= a
2- b
2= 169 - 36
The foci are units
at F (4 - -2) and
= 133. Thus,,c =left and riot of the centerF (4 + /133,-2).
1. 2
Step 4. The major axis is 2 13 = 26 units long. The minor
axis is 2 6 = 12 units long.
Step 5.
Figu\4 3.23
6.5 An ellipse --has vertices (-3,11) and V2
(-3,1). The minor
axis is 6 units long. W i e equation of the ellipse and
sketch its graph.
Step 1. ribe vertices lie on the vertical line x = -3. The
major axis is the line segment V1V2 whose length is10 units. Thus, a = 5.
Step 2. The center is the midpoint of the major a is with
coordinates (-3,6).
Step 3. From the minor axis length 6, b = 3.
Step 4. The equation is
6)2
(x + 3)2 (y 6) 1.9 25
4 ^.-
(17,-2)
Step 5.
-41-
Figure 3.24
Exercise Set 6
1. Sketch the graph of the given ellipse. Label the vertices and foci.
(a)
(c)
(e)
2 2x.....
36
2
4
'6)2
100
36x2
49
(x
49
I-
=
1
(b)
(d)
(f)
2
x2 4. Y... = 1'16
x2+ 25y
2=
(x + 6)2
625
2+ 3) = 1
64
2. Write an equation of the ellipse satisfying the given conditions.
(a) C 1'0,0); V1 (8,0); minor axis 4 units long
(b) Major axis 7 units long coinciding with the y-axis;Minor axis 4 units long; C (04)
(c) V1
f-9,0); V2
(9,0); F1
(-7,0)
(d) C (0,0 V1
(-9,0); passes through (0,-4)
-(e) C (4,7); V1
(0,7); minor axis 2 units long
(f) C F2(0,-4); V2(0,-3)
(g) V2
(3,12); V1
(3,4); F1(3,5)
46
1
tiction 7 - The Hyperbola
-42.;
A hyperbola is a set of points-in which the positive difference between thedistances from any point of the hyperbola to two fixed' points is constant.
This definition is illustrited for twopoints P1 and P2 on a hyperbola in Fig-ure 3.25. The point P is at distancesof d1 and d2 from the fixed' points Fland 102, respectively. Similarly, P2lies el and e2 units from Fl and F2,respectively. By definition of thehyperbola, di - d21=16
1e21= k. e2/
- 1F2d°F1
Ai Important ideas associated with the
e hyperbola are shown in Figure 3.26 anddescribed below.
(1) The two fixed points Fl (-c,0)and F
2(c,0) are called foci. \
Figure 3.25
(2) The vertices V1
(-a,0) and.
V2 (a,0) are the points of intersection'ofthe hyperbola and the x-axis.
(3) The center C (0,0) is the midpoineof the line segment joining thevertices;
(4) The tiansverse axis is the line segment 2a units long joining thevertices.
(5) The conjugate axis'is the line segment 2b units lonq joining thepoints (0,b) and (0,-b).
(6) For large values of Ixl, the 'branches' of the hyperbola approachtwOlines called asymptotes.' Equations of the asymptotes are = P x and
_ by = x.
(7) The reference rectangle is used to sketch, the graph of.a hyperbola.Its dimensions are 2a and 2b. The asymptotes pass through its verticesand intersect at the center of the hyperbola.
2 't, (8) The relationship among the constants a, b, and c is c
2= a + P
4""4
-43-
(0,b)
F
AARIPAWikk(0,-b)
conjugate axis transverse axis
Is
Figure 3.26
The star rd equation of a hyperbola with its center at the origin and
loci o #fie x-axis is
2 2_
a2
b2
The standard aquatic:it; of a hyperbola with its center at the origin and
foci on the y-axis is
Examples.
2 2
- x = 1a2
b2
2 2
7.1 The hyperbola - 1 has
(a) vertices Vl (-5,0) and V2(5,0) and transverse axis
V1V2
of 10 units.
OW' a conjugate axisipoin (0,2) to (0,-2) of length 4 units.
(c) foci F., (-61,0) and F1 (fii3O) determined from c2=a24-b2
where 12 m 25 and b2 ±`4.
32 2
(d) asymptotes whose equations are y is x and y = - x.5
(e) the graph shown below.
18
it
-44-
Figure 3.272 2
7.2 The hyperbola100 64
= 1 has
4
4s) vertices V2
(0,10) and Vi (0,-10) and transverse axisV1V2of 20 unite.
(b) a 16 unit long conjugate axis from (-8,0) to (8,0).
(c) foci F1 10,2141) and F2 (0,7241). The y-coordiniteof a focus point is c or - found by c = /171575747Ti
(d) asymptotes whose equations are5 5
y = x and y = - x.
(e) the graph in Figure 3.28.
F2
(0,2141.
10)
, -10)
0,-2
5x
4
5y - x
Figure 3.28
x
If the center of a hyperbola has the coordinates (h,k) with a horizontaltransverse axis, the standard equation of the hyperbola is
(x - n)2
(y - k)2
a2
b2
If the center'of a hyperbola has the coordinates (h,k) with a verticaltransverse axis, its equation in standard form is
IY....:11L2 (x hr-,
- 1.
a2
b2
40
Examples.
7.3 Write the coordinates of the verticessketch the graph of
(x - 5)2
( + 4)16 r 49
Step 1. The center is C (5,-4).
Step 2. Since a2 = 16 and a = 4, the verti s are 4 units
to the right and left of the center on the horipntalline y = -4. The vertices are V1 (1;-4j, and Vir(9,=-4).
Step3. go find .c and -c, coordinates of the foci, c2 = a2 + b2
3* )6 + 49 = 65. Thus., c = Ai and -c = -;r6E. The
foci are F1
(5 - 65, -4) and F2
(5 + AT, -4).
foci, and center and
1.
Step 4. The graph:
F1
Figure 3.29
2
7.4 The graph of 1Y9'3)
2 (x 1 is
(9,74)
Figure 3.30
x
_
-46-
A special fokm of an eqUmtion of a hyperbola is xy = k.
If,k is positives the hyperbola lies in the first and third quadrants with
foci on the line y = x.
If k is negative, the hyperbola lies in the second and fourth quadrants.
?le foci lie on the line y = -x.
Example.
7.5 Graph the hyperbola xy = 6.
Step 1. Expresstxy = 6 in the form y =6- to facilitate
completing a table of values. Knowing that the
graph is a hyperbola, fewer points than normallyare required to locate a graph will be used.
11 3 6 9 -1 -31,
2y - 6 1 2 1 -6 -2 1 -1
2
3
Figure 3.31
Exercise Set 7
1. IleterMine the vertices, foci,,and cent' or eachkgiven hyperbola
and sketch its graph.
x2 y!2 2 2
(b) x2 - Y- -4x = 1(a) T6- - 7 1 2
4Y- = 1 (c)
25
2?(d)
64 41(e) IL :I-9 0
2
x -- 1 (f) xy 369
51\
-47-
42. Write an equation of a hyperbola satisfying the following bonations.
(a) V2. (4,0); C (0,0); F2 (5,0),
(b) V1
(012); V2
(0,-12); C (0,0); conjugate axes 16 units long
(c) Passes through P (-1,4); asymptotes are the coordinate axes
(d) F2
(0,10); C (0,0); transverse axis 8 units long
(e) C (3,5); Fi (-3,5); a = 5
(f) y2(3,4); F2 (3,7); transverse axis 8 units long
52
-48-
CHAPTER IV
GRAPHS OF THE TRIGONOMETRIC FUNCTIONS
Section 1 - Graphs of y = asin be and y = a,00s be
The trigonometric functions have been used PrimarilY in dealing with appli-cations of right triangles and vectors. In this chapter, the graphs of these
-
functions will be considered.
The graphs of the'sine and cosine functions can be determined in the samealgebraic way as most other graphs of functions. That is, a table of valuesis completed, points of the graph corresponding to entries in the table areplotted, and a smooth curve is passed through the points.
Examples.
1.1 Graph y = sin 13
Step 1. A tabDe of values is completed for 0° < e c 360 oat intervals of 30°. The corresponding values ofsin e are found using a calculator.
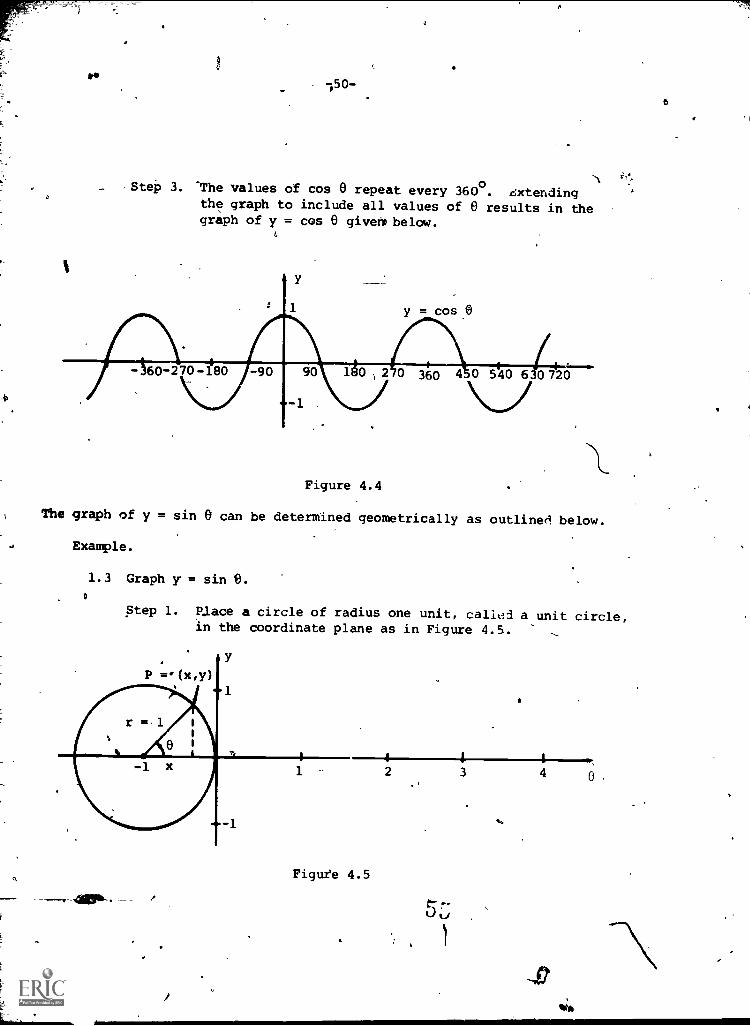
The graph of y = sin 0 can be determined geometrically as outlined below.
Example.
1.3 Graph y = sin 13.
Step 1. Place a circle of radius one unit, callei a unit circle,in the coordinate plane as in Figure 4.5.
Figute 4.5
2 3 4 0
-51-
Step 2. As the radius r of the circle rotates counterclock-wise from the standard position at 0° to some ter-minal position, it forms an angle 0. The y-coordina.V
of 'the endpoint P,(x,y) of the radius is the value ,f
sin 6 where the radius is 1 unit. It follows that
sin 6= = = y.kr 1
Step 3. To graph y = sin 6 for,0o
< 8 < 90o
, selected points
P 4x,y) on the circle are projected to the corresponding0 value on the 0-axis. See Figure 4.6. A projectedpoint has the coordinatess(0,y) and lies on the graph
of y'= sin 0.
Figure 4,6
Step 4. For clarity, the graph of y = sin 0 through quad-rants II, III, and IV are shown separately.
9oo
180o e
5E
Figure 4.7
Step 5._ Thelgraph of,y = sin 8 appears in Figures 4.1 and 4.2.NN
The function values of sin 8 and cos 'l& repeat every 360° or 2r radians.These functions are said to have a perkod of 271., In'general, if P is the,smallest positive number for which a function F(x) = F(x + P), then P iscalled the period of F.
The graph of a function over an interal of one period is an oscillation.The graph of the sine function completes 3 cycles over an interval of 6rradians. The cosine function completes 1/2 cycle in r radians.
The range of values of both the sine and cosine functions is from -1 to 1.If these values are multipiiied by some constant a, the values ofasin and acos 8 range from -a to a. lft\number lal is called theamplitude of the function.
Examples.
1.3 y = 2 sin 8amplitude = 2.
Figure 4.8
1.4 y = -1*
o cos 01
amplitude =
ma'
-53--
Figure 4.9
Consider the function y = sin 20. As e ranges from 0 to 2n, twice the
angle 0 or 2e ranges from 0 to 41T. Thus, sin 20 completes 2 periods for
0 < 0 c 2T making the period of sin 20 equal to 1r. , The graph of y = sin 20
completes 2 cycles every 27r radians or one cycle every n radians.
In general, if y = sip be, the period is2n
or the period of sin 0 divided
by b. The graph y = sin b0 completes b cycles every 2n radians. Similiarly,
if y = cos be, the period is gland its graph completes b cycles in one
revolution.
Examples.
1.5 The function y = sin 48 has period of 2'ff i 4 or2
radians.
The graph completes 4 cycles per revolution.
Figure 4.10
* A negative value of 'a' inverts the graph.
-54-
11.6 The function y =12 cos 6 has a period of 27r
1Or 6ff. Its
graph,*ompletes 43
. cycle withevery revolution wi an amplitudeof 2.
y1
= 2 cos 5. 6
y = cos e
Figure 4.11
1.7 The verticedisplacement y in centimeters of an object oscil-lating at the end of a spring is f = 2 sin 3fft where t is in
seconds. Sketch the graph of displacement versus time for0 < t < 1.
2ff 2
3Step 1. The period is
3ff= radians (approximately 38.2°).
.
The amplitude is 2..
Step 2. On a coordinate system, the value of t = 1 represents1 radian of angular measure. The graph y = 2 sin 3lrt
will complete one cycle every 2 radians (or 2 seconds)3
and 1.5 cycles in 1 radian (or31 second).
Step 3. The graph of y.= 2 sin 3fft is
Figure 4.12 50
t(sec)
-55-
44,
Exercise Set 1
1. Sketch the graph/of each function for 0 1 8_1 2w.
(a) y = 3 sin
2. Sketch the graph of the given function for, 0 < eat.<,6w.
3(b) It
4cbs 0
a
(c) y = -4 sin 8
(a) y = sin 38 (b) y1
e
1 1(d) y = 4 sin
3e (e) y= -cos
3- 0
(c) y = - sin 8
3. Write an equation of the form y = a sin be given the following.
(a) a = 7.
P
(b) a =3
(c) a = -3
P = 609' P-gn
(d) a = 1
- P
4. ,A "40 cycle" alternating current qiir cui4 has current i at time t giveni = 5 sin 80111 where i is in ampeies and t sf11n seconds. Graph thisfunction for 0 1 t 1 0.1. 4
'4,
Section 2 - Graphs of y = asin (be +-a) knd a. cos ()8 + c)
lir
The previOus section presented varia Ions in e amplitude and period ofthe graph of y = a sin be catied different lues of a and b. A thirdtype of change occurs by -introd ng the constan c to form the functiony = a sin (be + c). 4Vo see th effects of c upon graph, consider theexample below.
Example. 0
2.1 Sketch the graph of y = sin (20 + 600) where a 2,
and c = w 4
Step 1. A table of values is prepared for 0'< e < 180° atintervals of 15°.
Step 2. Plotting the points from the table, the graph ofy = sin (2e + moo) is compared to the graph ofy = sin 28. - -
GO
I
-56-
sin 28 r= sin (28 + 600)
180°
Figure 4.13
Step 3. The graph of y = sin (20 +.60) is thethe grAph of y = sin 2e except that it
(displaced) 60° 2 or 30° to the left.
I general, theo y = a.sin be
d right § if
Examples.
graph of y = asin ODe c)* is
except that it is shifted to the
c is negative. The quantity § is
same asis shifted
the same as the graph
left g if c is positive
called the displacement.
2.2 Determine the amplitude, period, and displacement of
3sin (20 - lb and sketch its graph.2
2nStep 1. Amplitude = 3, periog = F- IT, and the displace-
ment.
ment is - -2- 7 2 = - ti to the right.
Step 2. By lightly-sketching the graph of y = 3sin 2e,
the graph can be found by displacing this
graph units to the right or, equivalently, moving
.ethe y-axis Ti units to the left and relabeling the
coordinates on the 0-axis.
* This statement applies to the cosine function as well.
VL
ti
- -
-57-
Figure 4.14.w2.3 Graph y = -20cos (-1 0 + -i and state the asplitude, period,
2_and displacement. .
. 1Step 1. Aawlitude = 2., period = 2w 7 I = or , and'displaoessent
= 1 1 = 271. to the left.3- T 3
Step 2. The grapt
Figure 4.15
2.4 Write an equation of the form y = a-cos (bx + c) if a = -2,
P = Lr- , and the displacement is .
2 3
21T 21Step 1. Since P = 17- and b , b 2w s I. 4.
2
Step 2. The displacement = where b = 4. Thus, c = 4 .
Step 3. The equation is y -2cos (48 +
62
Exercise Set 2
1. State the amplitude, period, and displacement\of the given functibns.\
1
(4) = sin 6 (b) 'y = 4 sin (30 (c) y = 7i cos,1
2. Walt* an equation of the form y = a cos (b6 + c) of\the function having
the following properties.
(a) a = 14-15 = it; displacement 1 to the right
(b) a = -2; P = 4ff; diiplacement IT to the left
(c) a = -1
P -o - -o t the right2'
3. Sketch theaph of each function.
(a) y = sin ce
(c) y = -cos (26 )
(b) y = 2 cos (20 + 60°)
(d) y =1
sin (6 + 410
Section 3 - Graphs of y = tan e, y'= cot 0, y = sec 0, y = csc 0
ti
A__-
The graphs of the trigonometric functions not already_ presented- -are included
in this section. Also included are graphing techniques which can be used
to find the graph of a function from its reciprocal. In this way, the,
graphs of y = cot 6, y = sec 0, and y = csc 0 are ckpermined from the graphs
of y = tan 0, y = cos 0, and y = sin 0, respectively.,
Example.
3.1 Graph y = tan e.
1 Step 1. Form a table of values for 0 < 0 < 360°.
0
tan 0
0 30 60 90 120 150 180 210 240 270 300 330
0 .58 1.73 - 1.73. -.58 0 .58 1.73 -1.73 -.57
Step 2. Plot the points from the table and connect them with
a"smooth"curve.
360
0
The vertical lines at 6 = 900 and 8 = 270° arecalled asymptotes. The graph of y = tan 8 approachesthe asymptote 6 = 90° as 8 assumes values close to 90°.
Step 3. Extending the graph above to include all values of e,the graph of y,= tan 8 appears in Figure 4.17.
Figure 4.17
The period of the tangent function is 360o or 27 radians. It has noamplitude.
To arrive at the graph of a trigonometric function from the graph of itsreciprocal, certain notions about function values and their reciprocals areneeded as well as some helpful notation. Listed below are some "variablebehaviors" and the symbolism used to denote this behavior.
(1) Values/Of y approach zero through positivenumbers (from \the right, graphically) y4.0
(2) Values of y approach -4 through values lessthan -4 (from the left, graphically) y
()) Values of y increase without bound
(4) Values of y decrease without bound
I
y
(5) Values of y approach seven from left and right
4I"' 7
10.
A
-60-
Some ideas relating the values of a variable and the corresponding valuesof its reciprocal are:
(1) y + 3, 1-13of
Y 3
(3) y 0 , +03Y
(5)- y+ 1+
,
-1-+ 1
- +(2) y -8 , -
Y 8
- 1(4) y -+ 0 , - -+ -co
7(6) y -+ +co, -+ 0+
These ideas can now be applied to find the sketches of the secant, cosecant,
and cotangent functions.
Examples.
3.1 Graph y = sec 8.
Step 1. Lightly sketch the graph-of y = cos e. As the values
of. cos 8 range from -1 to 1, the corresponding valuesof their ripiprocals (values of sec 8) behave according
to the notions above. Representing these graphicallyleads to the y = sec 8 graph.
Figure 4.18
13.2 Graph the function given the graph of y = f(x) in Figury 4.19.
Figure 4.19
1Step 1. A sketch of y = follows immediately from the 'reciprocal
relationships. See Figure4.20
Exercise Set 3
1. Complete the following.
1
iY(a) y4. 5,
Y4. (b)
3
Zi '
14.y
14.
1
Y(c) y 4. 1,
Y(d) y 4. -4+, 4.
(e) y 4. -2 ,
Y
1 4. (f) y 4. +CO y4_
er'
= f (x)
-62-
2. Sketch the graph of y = csc e.
3. Sketch-the graph of y = cot e.
4. Shketch the graph of.y = F1
Ix)r- from the graph of y ='
Fx)
2
1
F(x)given below.
Figure 4.21
6 S
-63-
CHAPTER V
COUNTING AND PROBABILITY
Section 1 - Counting: The Multiplication Principle
The solution of many probability problems depends a great, deal upon theability to count the number of ways.something can occur. This ability to
count stems from two basic principles: The multiplication principle,presented in this section, and the addition principle of Section 2.
Examples:
,1.1 How many 3-digit numbers can be formed using the digits1, 5, 8, and 9 if rib digit can appear more than once in the
Stage 1
Stage 2
number?
The following is the "tree diagram" of the possible 3-digit
numbers.' A stepwise construction of the tree follows:\
5 8 9
Stage 3... 8 9 5 9 5 8
158 159 etc.
1 8 9
A I\ A8 9 1 9 1 8
Figure 5.1
8
5
9 1 9 1 5 5 8 1 8 1 5
Step 1. Each stage Of the tree diagram lists the possibledigits for one place position in a 3-digit number 1
t branching from the po sibilities in the previousI
stage",
Step A path in the tree constitutes one of the possible-3-digit numbers.
Step{ t. The 24 paths give the total 3-digit numbers possible.
Two bolts of different lengths are threaded using threedifferent types of threads. Eitber a square or hexagonalnut with appropriate threads is used with a bolt. How manydifferent combinatiJns of bolts and nuts are possible?
Step 1. A tree diagram can illustrate the various combina-tions. Let b
1and b
2represent bolts,tl, t2, and
t3be threads, and n
1and n
2be nuts.
Stage
Stage 2
Stage 1
a
4,n (b t n )
tl
n2
(b1t1n2
)
__ni (bit2n1)
(blt2n2)
n (b t n )1 11 3 1
3n2
(b n2
)
n1
(p2 1t-n
1)
n2
-n1
(b2t2n1
)
2(b
2t2 2
)
Figure 5.2
3n2
(b2t3n2
)
n1
(b2t3n,)
-65-
Step 2. Stage 1: Possible bolts
Step 3. Stage 2:' Possible threads for each possible bolt
Step 4. Stage 3: Possible nuts for each possible order of
bolts and threads.
Step 5. The 12 paths of the tree diagram represen the total
9ossible combinations of bolts, nuts, threads.
What happens when the number of selections becomes so great that a tree dia-
gram is no longer practical? The above examples illustrate the multiplication
principle of counting which says
"If a selection can be made in p ways and another selectiOn in
q ways, then both of the selections can be made p q way."
This principle,abbreviated MP, can be extended to include mo a than two
selections. See examples 1.3-1.6 below. -'
Examples.
1.3 In example 1.1, the number of three-digit numb rs can be found
using the MP. The first choice of a dig4.t c be done in 4
ways, the second in 3 ways, and the thirdin ways. By the
MP, the total number of ways is 4 3 2 = 4.
1.4 The number of combinations of bolts, nuts, and threads in
Example 1.2 is 2 3 2 = 12 by the MP.
1.5 How many different identification plates re possible if each
plate has two letters from the English a phabet followed by
three digits. The letters may. be the sa but a digit can-
not appear twice.
Step 1. By the MP, the total number of different ide-tifi-
cation plates is 26 26 10 9 8 = 486,720.
1.6 How many odd counting numbers are there between 30,000 and
40,000 if no digits are repeated?
Step 1. Determine the number of ways of selecting a digit
Sn the restricted positions first.
Place-Value No. of CLoic.:..r Explanation
ten-thousands 1 the digidi 3
ones 4 choices are 1, 5, 7, or 9
tegs 8 no repetitionhuAdreds 7 no repetitionthousands .,6 no repitition
Step 2. By the MP, the number of odd counting numbers is
1 4 8 7 6= 1344.
70
-66-
Exercise Set 1
1. If six, technicians misplace four handtools each, how many items arelost?
2. How many 3-digit numbers are there? Do not consider 036 = 36 or007 = 7 to be 3-digit numbers.,
3. How many odd nth/lbers are there between 200 and 600?
4. How many different identification plates using 3 letters from theEnglish alphabet are possible if
(a) no letters repeat? (b) repetition of letters is allowed?
5. A coin register contains 7C in pennies, 80C in nickels, and 70e; indimes. How many different sets of coins'make the following amountsif the least number of coins is used?
(a) (b) 6C (c) 11<'
Section 2 - Counting: The Addition Principle
(d) l9 (e)
The multiplication principle involves the number of ways two or more selec-tions can be made. A second type of counting process is used when oneselection is to be made but there is more than one way to make the selection.The addition principle of counting, abbreviated AP, says that
"If a seleqion can be made in p ways or q ways, the total num-ber of waysto make the selection is p + q ways."
Exampl.
2.1 h new car is to be purchased from LUXURY MOTORS which has73 cars in stock or MINI MOTORS which has 46 cars in stock.The new car selection can be made in 73 + 46 = 119 waysaccording to AP.
Section 3 - The Multiplication and ddition Principles Together
Counting can involve both the MP and t 0 AP. The AP is for one selectionand the MP is used in cases of two or re selections. Be alert for the
key words "and" and "or". These word re usually translated as "times"
and "plus", respectively. r
1 .1
-67-
Examples
3.1 Two selections are being made. The first selection can be
made in m or n ways and the second in p, q,2or r ways. The
number of ways the selections can be made (m + n)(p + q + r).
3.2 How many positive integers with at least/three digits can be
formed using the digits 3, 5, 6, 7, or 7, without repetition.
Step 1. Three, four, or five digit numbers are posgible-.-----
Interpret this as one seiectiOnj1..._yllietr-Cliv be done
in three ways. Apply the AP.
444'.44N' Step 3. The total number of integers is 5 - 5 5 + 5 - 5 5 5
+ 5 5 5 5 - 5 = 3875.,,
Step 2. The three digit number is formed using three selec-tions of digits, four digit number using four_selec-tions, etc. Apply the MP.-
3.3* Determine the number of identification cards possible if ex-
A actly three digits or exactly two letters are used without
epetition.
Step 1. The identification numeral is selected using either
digits or letters. Use the-AP.
Step 2. The letter numeral requires two selections and thedigit numeral requires three selections. Use the
MP.
Step 3. The total number of cards is 26 25 + 10 9 8 = 1370.0
3.4 Product M is available in 3 models and product N comes in 5
models. Nine different colors are used in ma'ing M and 7 colors
used in manufacturing N. There are 3 - 9 + I. 7 = 62 dif-
ferent models and colors of products.
Exercise Set 2
1. How many different integers can be formed using the digits 1, 2, 4, 5,
and 9 if the integers have
(a) no more than 3 digits and,repetition is allowed?
.-(b) no more than 2 digits and repetition is allowed?
(c) at least 3 digits with no repetition?
72
-68-
2. How many telephone numbers can be formed using 2 letters and 5 digits
if no letters or digitsrepeat?
3. There are 4, 6, and 2 models of each of the products A, B, and C,
respectively. Product A comes in 7 colors, B in 5 colors, and C in 10
colors. Each color can be chosen in either flat or enamel paint. How
many different selections of kinds of product are possible?
Section 4 - Permutations and Combinations
Counting the number of ways in which selections can be made depends upon
whether the selections are made with regard to the order of each selection
or without regard to the order of each selection.
Examples
4.1 If 2-digit numbers are formed using the digits 5, 8, and 9
without repetition, the number of ways this can be done is 6. tiThe possible selections are 58, 85, 59, 95, 89, and 98 where,
of course, 58 1 8$; 59 95, and 89 98.
On the otter hand, selecting 2 digits from among 5, 8, and 9
whereorder of the digit - selections is not important yields
58, 59, and 89., The pair 58 is considered the same as the
pair 85 and it is counted only once.
4.2 A nine member baseball team is required to batin a special
order. There are 9 8 7'- 6 5 4 - 3 2 1 = 362,880
different batting orders possible using the MP.
4.3 The announcer of a basketball game introduces the five players
one at a tire with order. There are 5 4 3 2 1 = 120
ways to do this. If the ouncer decides that the order
of the player introdu t'on is not needed, he(she) makes one
intr9Uction of all fi layers as a team.
As seen in example 4.2, the produc 8 7 6 5 4 3 2 1
can be very awkward to express. Thisoduct can be written as 9!, called
nine factorial: Thus, 9! = 362,880.
In general, if n is a positive integer, then n factor
n! = n (n-I) (n-2)... . 4 -.3 2 . 1. For n eq
7 1,4
is writtenzero, 0! = 1.
Q
I
Examples
-69-
4.4 The value of 7! is '7 6 5 4 3 2 1, = 5040.
4.5 A large factorial number has a smaller factorial number as
a factor. Thus, 12! has the factors 11!, 10!, 2!, and
1! . To express 10! as a factor of 12!, write 12! = 12-11.10!.
--0 13! 4!4.6 Evaluate
10! 5!
Step 1:13! 4! 13.121110!44 343.210! 5! 10!* s.4!
A permutation is an orderekarrangement
of things. If the things_are determinedby a.selection prodedure, they must be
selected one at a time to establish theorder required of a permutation.
`! Example
4.7 Three letters are to beselected from among a, b,
c, and d. If 3 selec-tions of 1 letter eachare made, all possible 3-member permutations arelisted below.
a b cb
b a cb c ac a bb a
a b da d b,b a d
b dd a bd b
acda d-cc a dc d ad a cd c a
A combination is an unordered)set of things. If the things
are determined by a selectionprocedlire,..they are all selected
at one timit so that no order can
be established.J....,
.
4.8 Three letters are selectedfrom among a, b, c, and d.If 1 selection of 3 lettersis made, the possiblecombinations are listed
below.
---abd
a c d
4
b c db d cc b dc d bd b cd c b
-70-
c d
When r things are selected with order from a group of n things, the num-ber of r-,-member permutatioas is written nPr where
Pn:
n r (n-r):
If r things are selected from a group of_n things without order, the num-ber of r-member combinations is written
nC where
C =n r r! (n-r) !
Example
4. In'example 4.2 , each batting order is a permutation. Nine
batters are selected from a team of 9 players with order.The number of batting orders is
9: 9! 9!P - = 362,880
9 9 (9 -9): 0: 1
4.8 A bag contains 9 beads. In how many different ways can 4
beads be selected?
Step 1. The 4 beads are selected at one time without regardto order. Each selection is a cOmbiilation.
Step 2. The numbei of combinations of 9 beads taken 4 at a
i time is9! 9!
C =9 4 4!(9 -4)! 4!5!
- 126
4.9 In how many weirs can 2 co-captains be selected from a team of9 players? In how many wayscan a'captain and co-captain,beselected?
Step 1. The co-captains can be selected in 9C2 ways.
9! 9!C = - 36
9 2 2:(9-2): 2:7:
7t.J
-71-
Step 2. The captain and co-captain can selected one at a
time in9P2
different ways. 4
9! 9!= - =72
9P2 (9-2)! 7!
4.10 A box contains 12 good items and 9 defective-items. If 6
-v
items are selected at one time, in how many ways can 4 ofthese be good items and 2 be defective items?
Step 1. There are 12C4 ways of selecting good items and
9C2ways of selectiv defective items.
Step 2. By the MP, there are 12C4 9C2 ways of selecting4 good and 2 defective.
2! !
C =12 4 9C2 41:8! 29:71
Exercise Set 3
1. Evaluate the'Yollowing.
(a)d,7C3
(e)8P1
°
(b). lej (c)5e5
(f) 4C35C2 (g) 4C2
- 495
5P1
- 36
(d)
(h)
= 17,820
8C1
12C3 10C2
2. How many T-member. executive councils can be selected from a 30 mem-ber organization? How many different executive councils are pOssibleif the organization selects a president, vice-president, and treasurer?
3. In how many ways can 4 beads be selected one at a time from a bagcontaining 9 beads? If all 4 beads are selected at one time, how manydifferent sets of 4 beads are pOssible? (Note: Things sAected oneat a time implies order.)
//5. A box contains 10-/red beads, 8 green beads, and 4 blue beads. In how
many ways can 4 red, 2 green, and 1 blue bead be selected?
Section 5 - Mathematical Probability
0-mmon words such as "chance", "probable ", and "likely"notion of the meaning of the probability that somethingsection will endeavor to attach a number measure to, thesomething may happen.
7G
express a vaguemay occur. Thisprobability that
-72-
The sample space S is the set containing all possible ways something can
occur. Each occurrence (member of S) is called an outcome of the action
or experiment.
The measure of,the sample space is the number of possible outcomes of S,written hAS).
An event E is the set of all outcomes of some action whose probability ofoccurring is to be determined. The measure of E, n(E), is the number of
outcomes in the event.
The probability that an event E may occur is the measure of E divided bythe measure of the sample space S. Writing the probability of E as P(E),
then
P (E) -
--Examples
n (E)
n (S)
5.1 Find the probability that exactly 2 heads will occur if acoin is tossed 3 times.
Step 1. Representing a head toss by H and a tail by T, thelist of all possible ordered outcomes is
14 H HH H TH T HT H HH T TT H TT T.HT T T
The sample space contains 8 outcomes. Thus
n(S) = 8.
Step 2 The outcomes of the event "exactly 2 heads occur"are
H H TH T HT H H
The event set contains 3 outcomes. Thus, n(E& 3.
._n(E)Step 3. P(E
n(S)
-73-
5.2 The pitigabitity-of-tossing all heads or all tails when a coin
is tossed 3 times is 1 + 1 1
8 4
5.3 A die is rolled 2 times. By the MP, the total number of out-
comes is the number of face values possible on the first toss
(6) times the 6 face values posSible on the second toss.
Thus n(S). 6 6 = 36. If *axe probability of "the sum of
the face values is 9" is desired, then E contains the outcomes
(6,3), (5,4), (4,5), and (3,6) where the first member is the
first toss value and the second member is t'ie second toss
value. Therefore, P(E) = 4 = 1
36 9
5.4 What is the probability of being dealt 3 jacks and 2 queens
from an Ordinary deck of bridge cards?
Step 1. There are 52C5 ways of selecting 5 cards without
order from a deck of 52 cards. Thus, n(S) = 52C5.
Step 2. There are 4 jacks in the deck and 4C3 ways to select
3 of the jacks. Similarly) there are 4 queens and
4C2 ways okbeing dealt 2 queens. By the MP, the
number of ways to get 3 jacks multiplied by the num-
ber of ways to get 2 queens is the total number of
ways of getting 3 jacks and 2 queens. Thus, n(E) =
C4C3 4C2'
n(E) 4c3 4
c2 4 6
Step 3. P(E) = = 0.00000923.n(S) 52
C5
2,598,960
5.5 A machine is known to have produced 7 defective items among
30 items made. lea sample of 10 items is taken, what is the
probability to the nearest ten-thousandth that exactly one
defective item is in the sample?
Step 1. n(S) =30C10
.
Step 2. The event set contains each defectile item combined
with all'of the combinations of 9 good items taken._
from the.23 good items produced. By the MP, the
tota4 number of 1 bad and 9 good item combinations
is C C Therefore n(E) = C C7 1 23 9. 7 1 23 9.
n(E)
)
7c1 23
c9
Step 3. P(E) = - 0.1904.n(S
30c10
-74-
Exercise Set 4
1. A coin is tossed 3 times: What is pe probability of getting exactly1 tail? No heads?
4. A (:oin is tossed 4 times. What is the probability of getting exactlyheads? 4 tails?
3. A die is rolled twice. Find the probability that the sum of the faces'is 7.
4. Find the probability of being dealt 5.hearts from a bridge deck ofcards. '
5. Find the probability of getting 2 kings, 2 jacks, and 1 nine dealtfrom a bridge deck of cards.
6. A box contains 7 white, 2 green, and 4 red beads. If 3 beads areselected at random, what is the probability that each bead is a dif-ferent color?
-7. A machine produced 10. items of which 5 were defective. A sample of
4 of the items is selected. What is the piobability that exactly2 of the items are defective?
Section 5 - Empirical Probability
Statements made about the probability of an event are not always based up-on equally likely outcomes (this was the case in the last section). In-
stead, the probability of events used in making weather forecasts, pre-dicting outcomes of athletic events, etc. is based upon past performances,observations, and/or experiments. This type of probability is calledempirical probability.
Example
6.1 The toss of a biased coin does not result in equally likelyoutcomes of a head or tail; P head will occur more or lessoften than a tail.
A biased coin is tossed 1000times and a tail 308 times.the empirical probability ofand getting a tail is 2_92._' =
1000
times. A head comes up 692Based upon this exmiment,iletting a head is
1000= .692
.308. s_
-75-
6.2 The following table shows the number of hand powersaws still
in operation after different years of use. The empirical
probability of a saw lasting from year X to year Y is
Number of powersaws in use after Y yearsNumber, of powersaws in use after X years
Powersaws in Use Years of Service
37 0
32 1
29 2
21 3-
11 4
2 5
0 6
The empirical probability of a saw being used for
(1) 4 years is 21 = 0.297 (neates4 thousandth)37
0(2) 6 years is = 0.000
37
2(3) 3 years after 2 years of service is 29
= 0.069
(4) 5 years after 1 year of service is = 0.000
Exercise Set 5
1. If a student has a grade of B in 15 out of 25 courses taken. what
is the empirical probability of the student receiving a B in the
next course?
2. A college student traveled 1313 miles during which time he had 13
flat tires on his car. Each flat tire caused the student to miss
1 class period. On this particular day he must drive 13 miles be-
fore arriving at the college. What is the empirical probability
that the student misses a class?
3. Use the table in examplejn 6.2 to find the empirical probability that
(a) a year old saw will still be in use in 3 years.
(b) a new saw lasts 2 years.
(c) a 4 year old saw lasts another year.
so
-76-
CHAPTER VI
STATISTICS - CURVE FITTING
Section 1 - Tabulation of Data
This chapter introduces the mathematics involved in the computation of cer-\
tain statistical measures. The study of statistics involves the tabulation
and interpretation of numerical data and the study of measure of central
tendency including the mean, median, mode, and standard devi tion.
One set of data is used throughout the chapter to illustra by example the
various statistical procedures. Consider the 30 items of data below:
17
34
-43
23
28
,36 21 33' 28 c 1
37 31 29 32 35
34 29 33 38 ,26
36 41 32, 27 40
31 34 42 34 23
Table 6.1
Data in this form does not allow for any immediate interpretation. General
.chartcteristics of the data can be more readily seen if the data is tabulated
into group* or,Classes.
The difference between the greatest and least item of data is 43 21 = 22,
cal]ied the range. Five classes are chosen to be 20-24, 25-29, 30-34, 35-39,
and 40-44 where theoretically, the class boundaries are 19.5-24.5,
24.5-29.5, 29.5-34.5, 34.5-39.5, ani 39.5-44.5.
_ The selection of classes is done arbitrarily and depends in some cases upon
'.he desired analysis of the data.
Each data item is recorded in a specific class using a tally mark. The num-
ber of data items within each class is called the frequency f of the class.
Class Tallies Frequency
20-24 111 3
25-29 11/1 6
30-34 Mil 21-11 1 11
35-39 1111 1 60 40-44 1111 4
Table 6.2'
This type of tabulation is called a frequency distribution. The data begins
to have meaning when derived from this form of tabulation. For example, thegreatest- concentration of data appears in the middle of the range of valueswith the center class having a frequency of f = 11.. The data Seems evenlyspread on either side of the center class with gradually less frequency.
The frequency distribution of the data can be expressed graphically by meansof a histogram. The classes are represented on a horizontal axis whilp the
frequency f is designated on a vertical axis.
Af
'16
141210
219.5 24.5 29.5 34.5 39.5 44.5
22.0 27.0 32.0 37.0 42.0
Figure 6.1,
The class mark is:theeaverage of the class boundaries. The class marks
are indicated by arrows in-Figure 6.1 and graphically they represent the
middle of each class.
The frequency polygon is another form of the graph of the frequencr-distri7
_bution of data. Line segments are used to join the midpoints of the topsides of the histogram rectangles as shown in Figure 6..2. Two line segmentsare extended to the class marks on the data axis which have frequency zero..
In this way, the polygon is complete.
82
-78-
17.0 22.0 27.0 32.0 37.0 42.0
Figure 6.2
Exercise Set I
47.0
1. Tabulate the given data using a frequency dist-A. Aim. Use 7 classes,
each one 4 bits wide beginning at 55.5. State the class boundariesand class marks. Construct a histogram and frequency polygon.
73 64 63 78 70 69 73 58
83 75 63 72 73 67 56 80
74 66 61 73 75 70 67 71
70 69 76 81 56 69 72 73
Section 2 - Mean, Medial., Moae
The frequency aistribution and graphical histogram tend to be general intheir description of the data. A n.-e specific statistical technique forderiving information from data is the arithmetic !glean oraverage.
The arithmetic mean (average) of a set of data is tne sum ur: the data divided
by the number of data. 'SymboliCally, if d1
, d2
, d,, do do are n data
items,. then the average x (reacLx-bar) can be found as
d1 + d2+ d
3+ + d
n-1 dox -
n
The 30 data items being used to'present ideas in this chapter have a sumof978 so that their average is
978x = = 32.630c
-79--
A mean ran be calculated from a frequency distribution by adding together
the class mark. of each class times the class frequency and dividing this
sum by the total frequency of the classes. If xi and fi are the class mark
and frequency of the ith class where i = 1, 2, 3, ... n, then
xl-fl + x2-f2 + + xri'fn
x-f1
+ f2+ + f
nV
The class marks of the classes in Table 6.2 are 22, 27, 32, 37, and 42 with
frequencies 3, 6, 11, 6, and 4, respectively. Thus, the mean_is
x =22-,3 + 27.6 + 32.11 + 37-6 + 42.4 970 32.31.
30 30
The discrepancy tha_ occurs between the mean of the raw data/(32,60) and the
mean derived from the frequency-distribution (32.33) arises because the data
within a(class is assumed to have an average equal to the class mark.
The median of a set of data is a number such that half oftthe data has values
greater than it and the other half less than it. Listing the data from Sec-
tion 1 in order of magnitude in columns left to right,
21 28 32 34 37
23 29 32 34 38
23 29 33 35 40
26 31 33 36 41 1
27 31 34 36 42
28 31 34. 37 43
The median is the average of the 15th and 16th data since there is no single \
data item in the middle. Hence, the median is (33 + 33) 2 = 33.
The mode is the data item(s) that occurs most often. The mode :for the given
data is 34.
The modal class is the class in the frequency distribution having the greatest
frequency. From Table 6.2/ the modal ci.ass is 30-34 (theoretically 9.5-
34.5).
Exercise Set 2
1. Using the data from Exercise Set 1, find the mean iristwo ways, median,
mode, and modal class.
es-
411
-80-
Section 3 - Standard Deviation
A numerical measure of the amount of aispersion or scatter of the 4ta from
the mean is called standard deviation, abbreviated s. In some instances,
a large standard deviation would mean that the data has Less meaning or
significance than 1 set of data with a smaller standard deviation.
The standard deviation s is fo d using the following steps:
(1) Find the arithmetic mean.(2) Subtract the mean from each data item.(3) Square these differences.
(4) Find the average of the squares from (3).
(5) Calculate the square root of the average found in (4).
Symbolically,
;c)2+ (d
2-)
2+ + (d
n-)
2
for i = 1, 2, n.
n
'Taking the 30 data items and their average x = 32.6,
1/1
(37-32.6)2+ (36-32.6)
2+ ... + (34-32.6)
2+ (23-32.6)
2
30
s = 5.5 (nearest tenth.
Exercise Set 3
1. Find the standard-deviation of the data given in Exercise Set 1.
TSection - Curve Fitting - Linear Empirical Equation
Data obtained from obseivations and experiments1 involving two quantities 1
may reveal that a linear relationship exists between the quantities. Very
rarely, because.of errors in measurements, do ail the data satisfy a
particular linear equation in two variables nor do the point - graphs of the
data lie on a straight line. The purpose of this section is-to determine
a linear equation whose graph does not
vary significantly from the point-graphs
of the data (see Figure 6.3). Such an
equation is called an empirical equationsince it is derived from experimentaldata, not from purely mathematical pro-
cesses.
y
Figure 6.3
-81-
The method of least squares is used to derive the.linear empirical equa-
tion.
The difference between the y-coordinate ofand the y-coordinaDe_of a data-point for aa deviation as shown in Figure 6.4.
The sum of all the squares of thedeviations of data-points from theempirical equation derived fromthe least squares method is lessthan for any other line in the
plane. Thus, by this method,the "best-fitting" line is Be-
te ned.
The empirical equation of the least
square line requires that the average
of the x-coordinates y-coordinates y,
and the product of the coordinates xy
be found. The equation can be expressed
as y = mx = b where the slope
x -m
y2
Sx
with
_2 _2Sx
x - x
and the y-intetcept
b =
. Examples.
a point on the graph of a line
particular value of x is - alley:
data graph
eviationt!
} deviation
kdata graph
deviation
data graph
,\Figure 61.4
4.1 The following data was recorded in an experiment to de-
termine the possible relationship between current i and
//voltage V in a circuit.
i (milliamperes) 2.00 3.56 6.14 I 6.50 8.61
1.1 (volts) 13.65 20.68 35.21 41.23 55.00
Graph the data expressing current as a function of voltage.
If the data-points reveal that a linear relationship may
exist between and V, find and'graph a linear empirical
equation in V and i by the least squares method..
Rg
A
40)
-82-
Step 1. The graph of the data:
\i (milliampheres)
50
40
30
20
10
The relationship between V and i appears to be
linear.
Step 2. A table can provideV6ome of the input needed to write
the empirical equation.
1
V i V-i V2
..
2.00 13.65 27.30 4.00
3.56 20.68 73.62 12.67
6.14 35.21 216.19 37.70.
6.50 41.20 267.80 42.25
8.67 55.00 476.85 75.14-
26.87 165.74 1073.76 171.79
-v 26.87
5
165.74 q,- .
= (5.37)(33.15) = 178.02
10615 .76212.35
TOTAL
=c8.8
2 171.79V = - 34.36
5
2 2 2= V - V' = 34.36 - 28.84 = 5.52
1
Step 3. The slope m is
m=
-83-
V- i - V- i
sV2
212.35 - (5.37)(33.15)
5.52
= 6.22
Step 4. The y-intrrcept is
b = T -
= 33.15 (6.27) (5.37)
= -0.52.
Step 5. The empirical equation is i = 6.27V - 0.52 and %t
graph is shown below.
V
1 2 3 4 5 6 7 8 9
IP
4.2 Predict the current in milliamperes for 15.20 volts in the
circuit of example 4.1.
Step 1. Let V = 15.20 in the equation i = 6.27V - 0.52.
i = (6.27) (15.20) - 0.52
i = 94.78 milliamperes
V&
%or
41111100"
684-
Exercise Set 4
I
1. Find the equa on of the least squares line for the given data.Graph the dat' points and the equation on the same graph.
t
y13.0 1 7.1 9.6 10.9-
x CO.) 1 2.0 [23.13-1-5116.5 10.0
2. An experiment resulted in the following values of the mass m inkilograms on aspring and the length L of the spring in centimeters.
mi 0.00 I 1.00 I, 2.501 a .251 5.26LI 20.00 26.32 34.80 4(. 50 T 54.80
a. Find an empirical equation relating m and L using the leastsquares method.
b. If 7.50 kilogram mass were put on the spring, estimate the' gth of the spring using the equation from part a.
c. How much mass needs to be placed on the spring to stretch thespring 9.60 centimeters beyond equilibrium?
4
8
a, A
A
-85-
ANSWERS TO EXERCISES
Set 1 (Page 5)
11. a. T = K
2. a. H = K t.2
'CHAPTER I
b y = K. x c. P = Ks3-A
Z
b. 20
3. a. n b. increase 16 ti
4. a. decrease by factor of 2/3 b. a. crease by factor of 6
c. increase by factor of /08
fJ
5. 0.15 ohms
Set 1 (Page 10)
1. a. 3 b.3
-3-
2. a. Iii b. 5
3. -3, 0, 2
4. 2.7
Set 2 (Page 13)
Set 3 (Page 14)
1. yes
CHAPTER II
c. 1, -1
c. -1.
12. -94 3-
4.. -4681 _ 390
2. No 3. No 4. No 5. Yes
Set 4 (Page20)
1. a. 3 positive, 0 negative b. 1 positive, 0 negative
c 1 positive, 1 negative d. 0 positive, 3 negative
2. a. 1, -1, 2, -2 b. 1, -1, 2, 3, -3, 6, -6, 9, -9, 18, -18
0'
1c. 1, -1, 2, -2, 4, 8, -8,
2 2 4
1 1
4
90
3.
4.
a. -2, 1, 3
c. 2-j, 2+j,
a. 2, 3, 5
d. 0, 1, 3+j,
Set 1 (Page 22 )
1. Answers vary.
(c)2.
-86-
+ VE -b. 1,
-1
2,
-1
2
-Vii
-3+2j, -3-2j d. -5, -5, j, -j
1b. -1, -3, -2 c. -4, -4, -I
I 0, -3 2
-33-j e. 0, 0 2 -i-I f
CHAPTER III
.0.
Set 2 (Page 24 )
T. a. 122 13. -VIZ-5- c.
2. a. 42
b. -3". c.
3. a. parallel b. perpendicular
1.
Y
20
15
10
52015105
-5
-10
-15
-20
(d)
x(e)
e. -313 a7--3
14 d. 0 e.
2
c. perpendicular d. perpendicular
Set 3 (111.9221
1. a. x-3y = -17
d. x+ 3y= 15
b. 5x-y = -8 c. 2x + 3y = -14
e. 9x - lOy = 10 f. x = 5
g. y = 4 h. 5x + 6y = 0 i. y = 0
/
2. 201
sec 3. 2 cm;'10 newtons3
1. x = 4
-87-
Sit 4 (Page 30)
//
1. a. (0,0); 8 b. (4,0); 1 c. (2,3); 50
d. (0.7, -3.6); / e. (8,-1); 7
2. a. (x-3) 2+ y2 = 625 b. x2 +y2 = 10 c. (x-4)2 +(y+9)2 = 49
d. (x-4) 2+y2 = 10
f. (x+4)2
+(y+3)2
=
3. yes
Set 5 (Page 35)
1. a. F(2.5,0)V(0,0)x = -2.5
3e. (x+2)2+(y--2
)2 = 130
2
36
b. F(0,-7) c. F(-0.25,0)V(0,0) V(0,0)Y = 7 x = 0.25
Y
r`7
I
d. F(4,4)V(4,5)y = 6
e. F(3,-6)V(0,-6)x = -3
F (-.25,0)
F(0,-7)
Y
1 . p
lst
-88-
2. a. x2= 12y b. y
2= 40x c. x
2= -8y
e. (y-6)2= -20(x+4) f. (x+5)
2= 24(y+4)
2
3. 49.4 meters
..ct Cis CP tqf- 11,
b.
C. d.
6
e.
V1(-1,0)
V2 (13,0)
F2 (6 +3/,0)P (6-3A,01
d. (y-3) 2 = 20(x-5)
I
f.
V (4.6,5)
F](76/-34E5) 1
F2 (-6,-3-A5)
V2(-6,-11)
2. a.
d.
f.
2 2
64 4
2 2x81 16
1
x2 (y+8)2
9 25
Set 7 (Page46)
1. a.
c.
b.
e.
1
-89-
2 2
4 12.25 1
(x-4)2 (y-7) 2
16 + 4
2 2x y_c 81 32
(x-3) 2(y-8)
2= 17 16
d.
F2
(0,-6W5-13)
v1(0, -13)
C(0,-6)
(0,-6-48)
94
6.
1. a.
d.
2 2x -16 9
2 2y_ x =116 84
Set._ 1.....1Pa ;`,/
1. a.
C.
b.
e.
-90-
2 2y x144 64
= 1
(x-3)2 -5j225 11 7
b.
c. xy = -4
2f. y (x-3)216 33
2, a.
47r 6ar
c.
e.
W
-9l-
1
r.3. a. y = 7 sin 40 b. y = -3- sin 60
4.
/ 1
_
-
\..
4
-
c. y = -3 yin le d. y = sin 0
I
';
-
Set 2 (Page 58)
1. a. 1; 27r; 0 b. 4; ; -- right27 7 C.1
3 3-2- ; 67T; 7T right
1 7T
2. a. y = cos (20 - 7)2
b. y = -2 cos (T0 + 2)
C.
3. a.
OS/ =
1
12 cos(60 - 90°) 4
.
...
/
-
i
\
I1
..
,
.
g.. d.
o
.
.
9G
Set 3 (Page 61 )
1. a. 1
4.
11
1
1
-92-
10 1- 1+c. c.1 d. - e.
1
127T 1371
Y
1
3.
Set 1 (Page 66 )
1. 24 2.
5. a. 210 b.
Set 2 (Page 67)
1. a. 155 b.3. 156
-1
f. 0
-e
CHAPTER-,'
900 3. 200 4. a. 15600 b. 17576
112 c. 49 d. 3,920 ,e 11,760
30 c. 300 2. 19,656,000
-93-
Set 3 (Page 71)
1. a. 35 b. 151,200 c. 120 d. 8 e. 8
f. 40 g. 30 h.. 9,900
2. 4060; 24,360 3. 3024; 126
4. a. 720 b. 360 c. 20,160
S. 23,520
#16
Set 4 (Page 74)
3 7 1 1 1
1. ,
8 82.
16-3. 4. 0.00495
5. 0.0000544 6. 0,196 7. 0.476
Set 5 (Page 75) 6
31. -5- 2. 0.129 3, a.
11 29b. -37
2
c. 11
CHAPTIT. VI
Set 1 (Page 78)
Class Tallies Frequency Class Boundries Class Marks