Page 1
The Debrosse Memorial Report 2014 Oil & Gas Activity in Ohio
68th Annual Winter Meeting
Prepared by:Marty Shumway - Shumway Resources, LLCBill Arnholt - Northwood Energy CorporationTim Knobloch - James Knobloch Petroleum Consultants, Inc.
Page 2
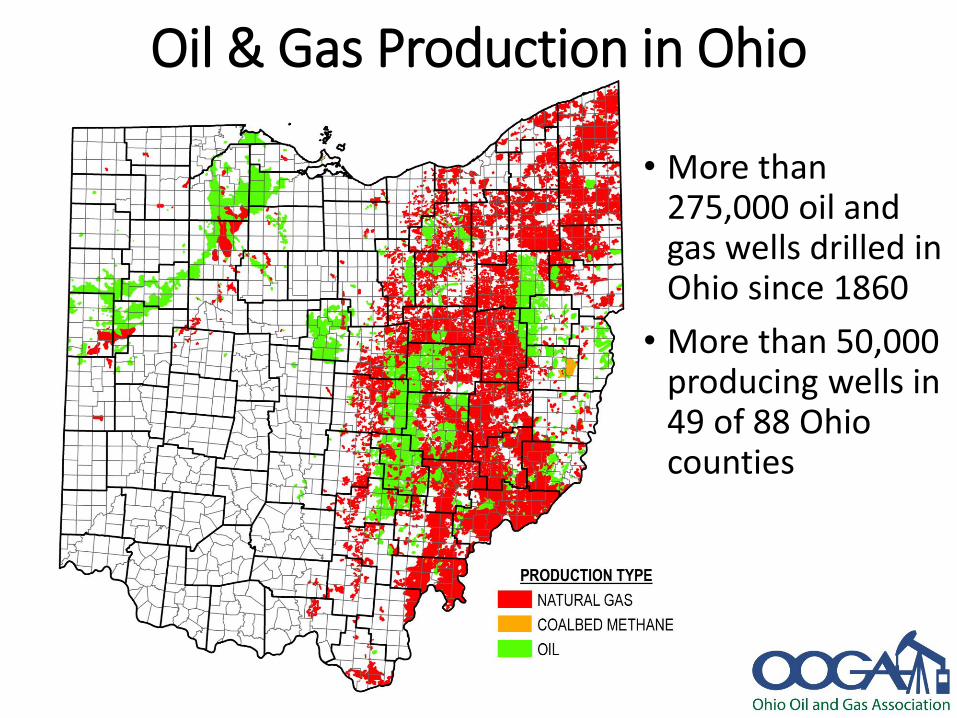
Oil & Gas Production in Ohio
• More than 275,000 oil and gas wells drilled in Ohio since 1860
• More than 50,000 producing wells in 49 of 88 Ohio counties
Page 3
0
1000
2000
3000
4000
5000
6000
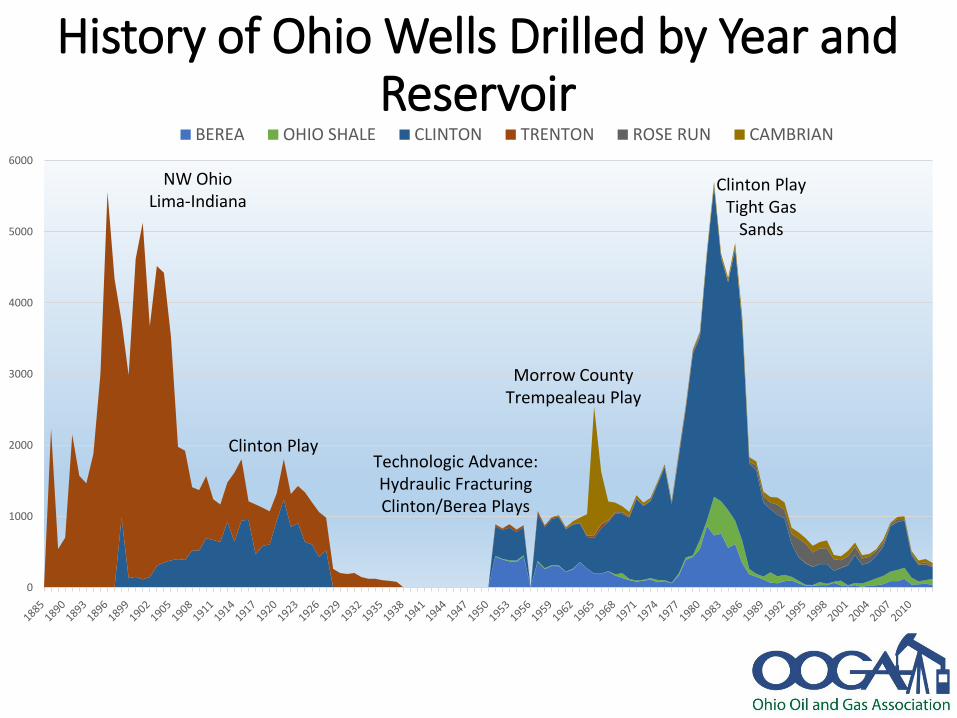
BEREA OHIO SHALE CLINTON TRENTON ROSE RUN CAMBRIAN
NW Ohio Lima-Indiana
Technologic Advance: Hydraulic FracturingClinton/Berea Plays
Morrow County Trempealeau Play
Clinton PlayTight Gas
Sands
Clinton Play
History of Ohio Wells Drilled by Year and Reservoir
Page 4
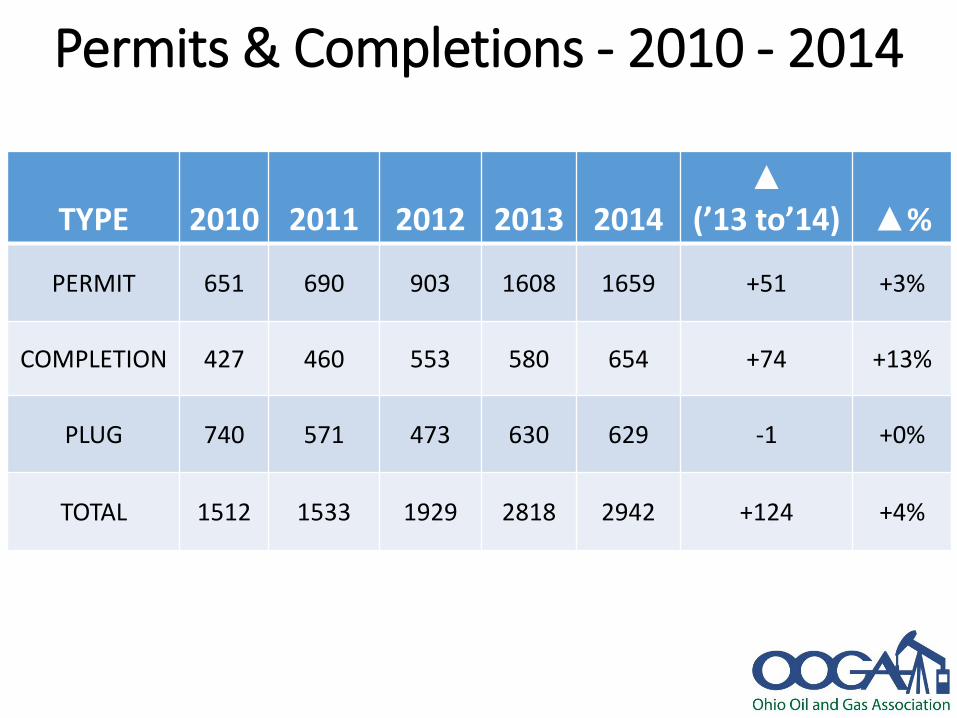
Permits & Completions - 2010 - 2014
TYPE 2010 2011 2012 2013 2014▲
(’13 to’14) ▲%
PERMIT 651 690 903 1608 1659 +51 +3%
COMPLETION 427 460 553 580 654 +74 +13%
PLUG 740 571 473 630 629 -1 +0%
TOTAL 1512 1533 1929 2818 2942 +124 +4%
Page 5
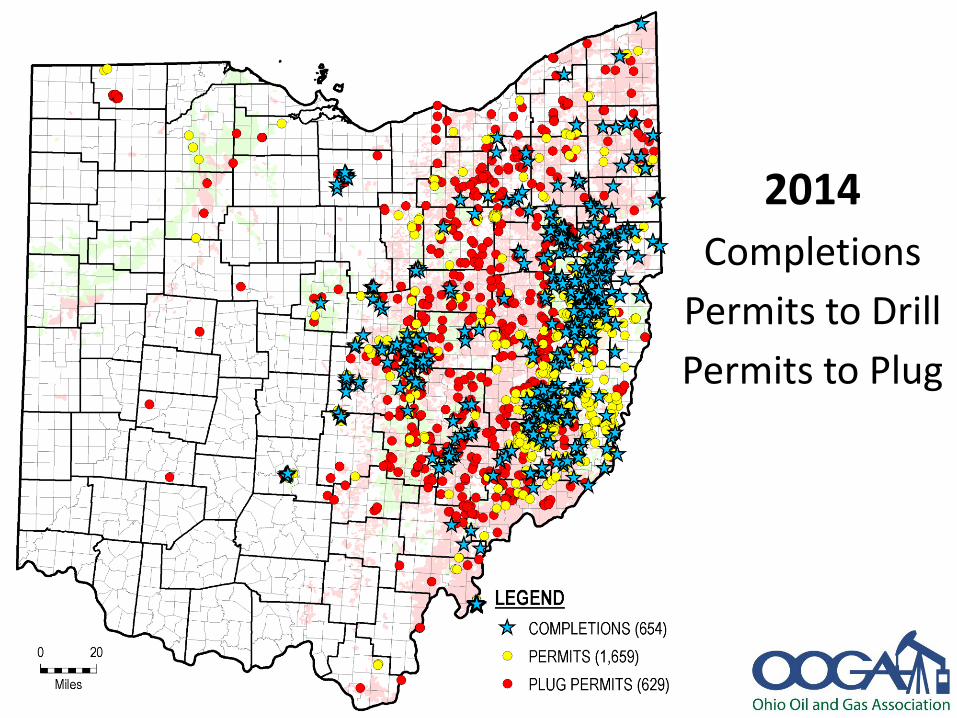
2014
Completions
Permits to Drill
Permits to Plug
Page 6
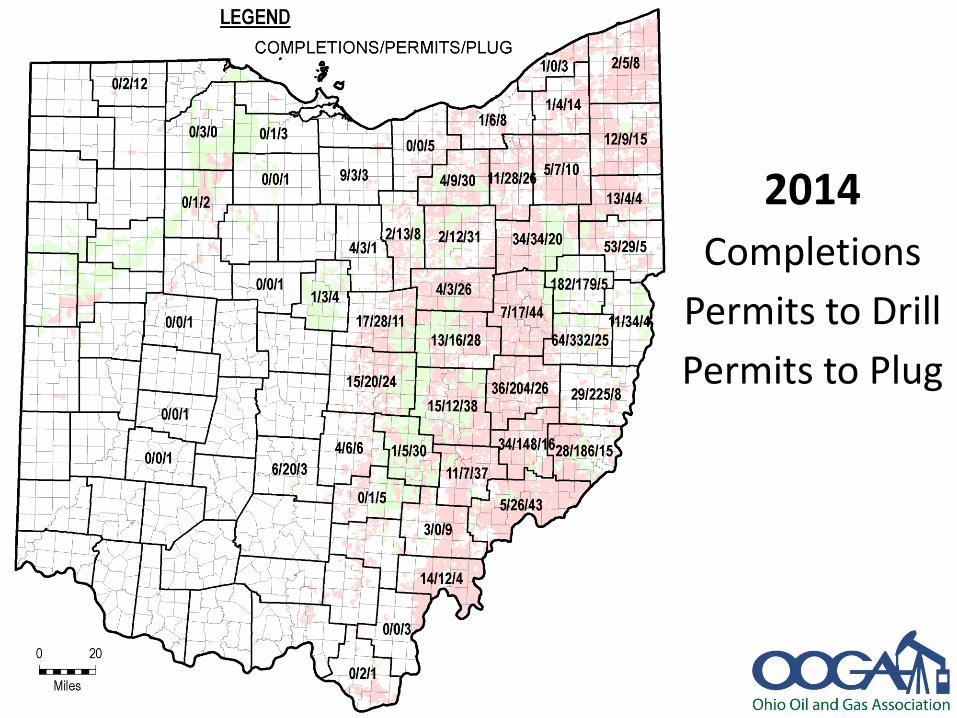
2014
Completions
Permits to Drill
Permits to Plug
Page 7
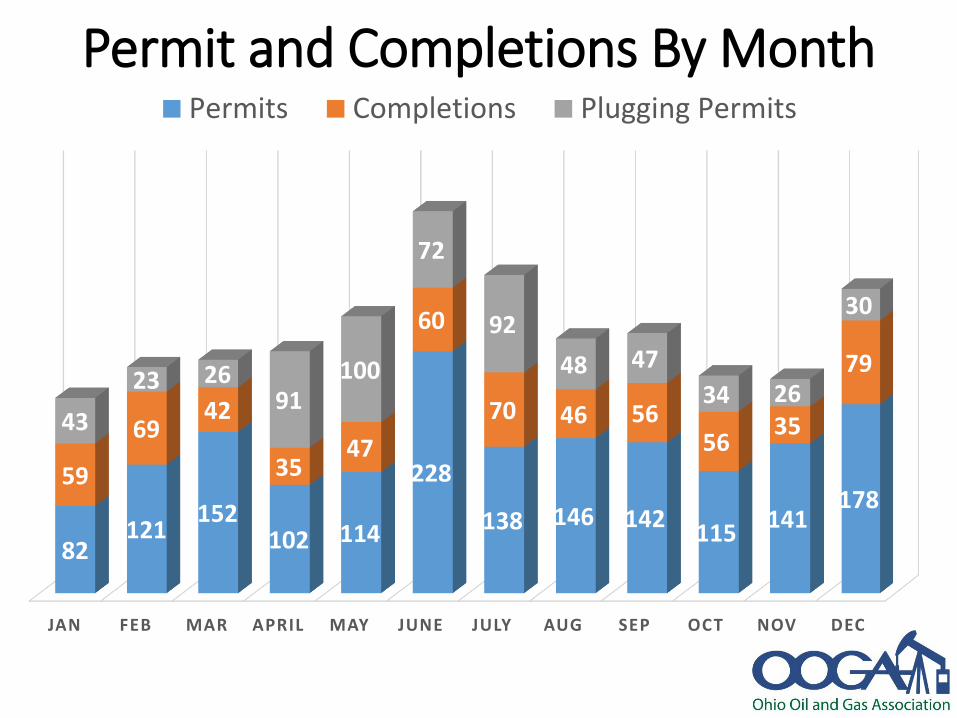
Permit and Completions By Month
JAN FEB MAR APRIL MAY JUNE JULY AUG SEP OCT NOV DEC
82121
152102 114
228
138 146 142115
141178
59
6942
3547
60
70 46 5656
35
79
43
23 2691
100
72
92
48 47
34 26
30
Permits Completions Plugging Permits
Page 8
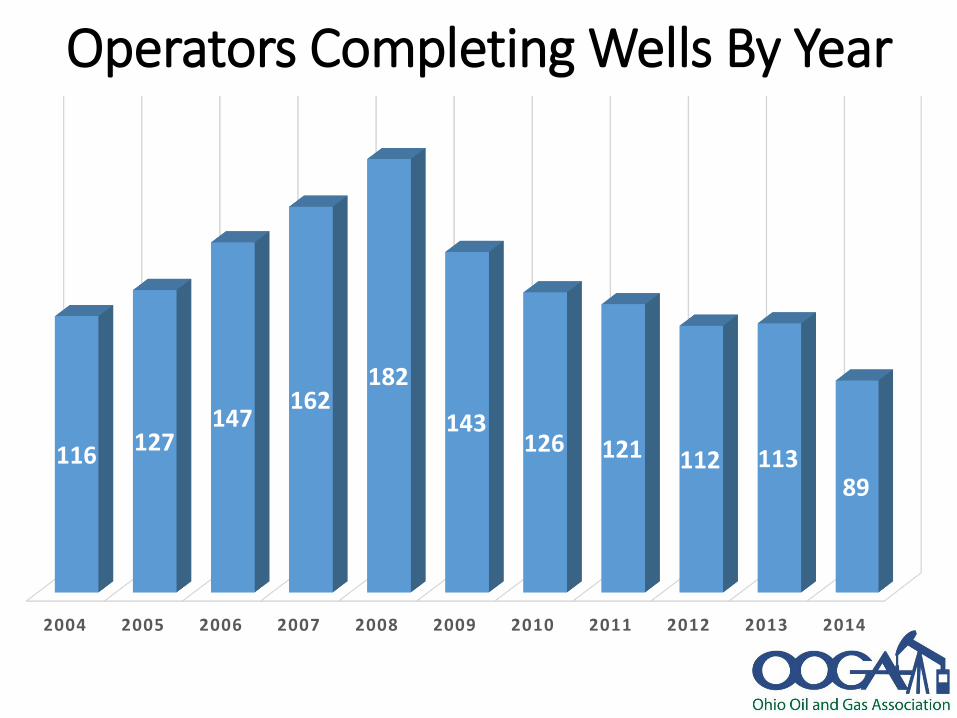
Operators Completing Wells By Year
2004 2005 2006 2007 2008 2009 2010 2011 2012 2013 2014
116 127147
162182
143126 121 112 113
89
Page 9
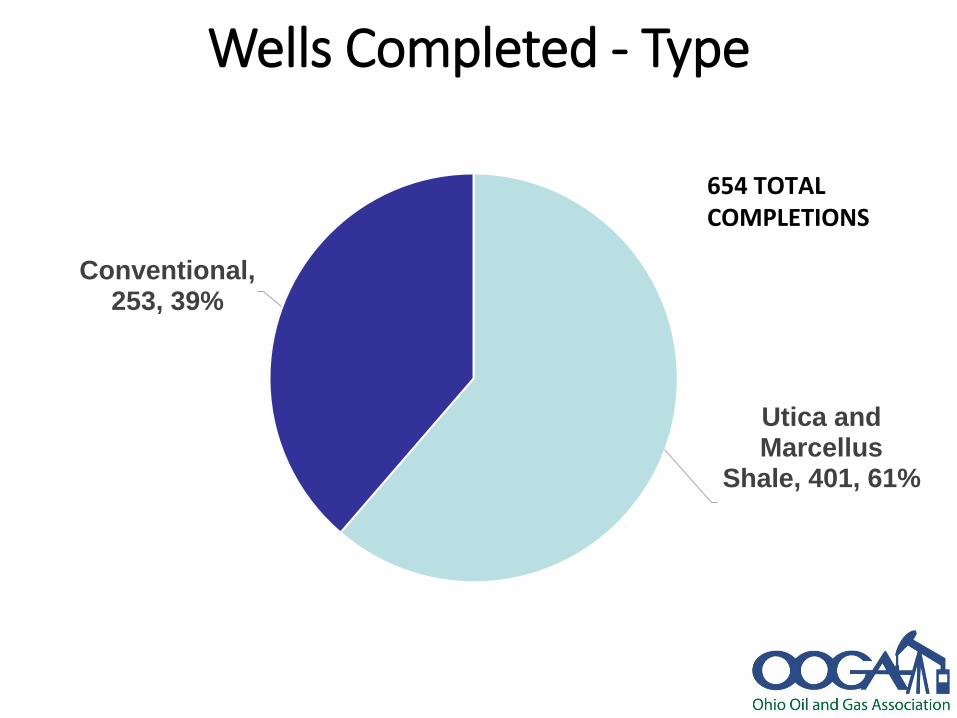
Wells Completed - Type
Utica and Marcellus
Shale, 401, 61%
Conventional, 253, 39%
654 TOTAL COMPLETIONS
Page 10
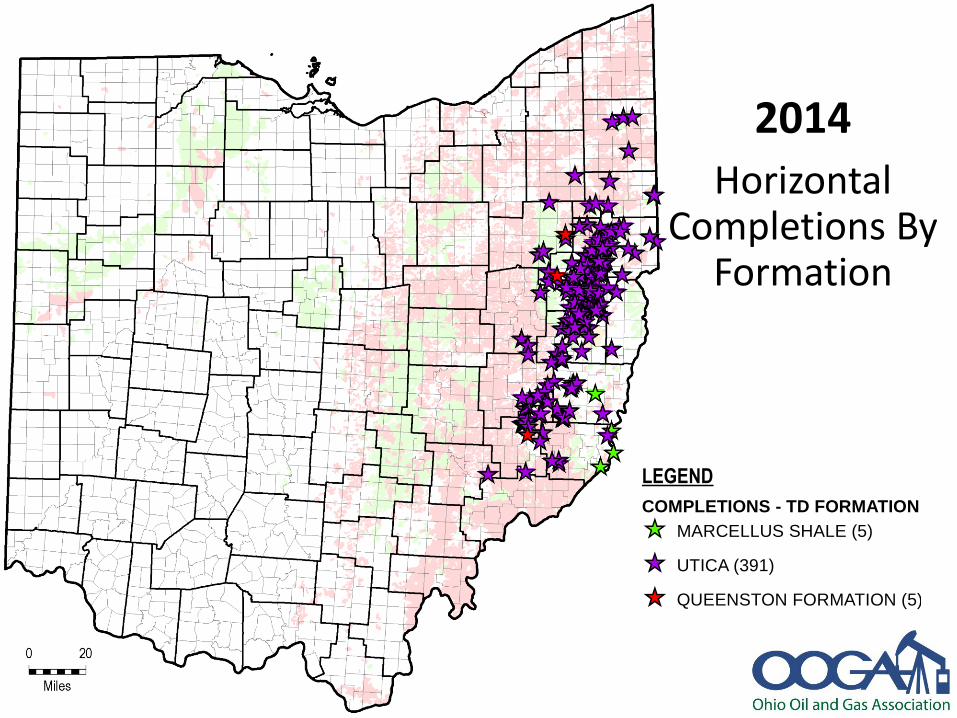
2014
Horizontal Completions By
Formation
LEGEND
COMPLETIONS - TD FORMATION
_̂ MARCELLUS SHALE (5)
_̂ UTICA (391)
_̂ QUEENSTON FORMATION (5)
Page 11
2014
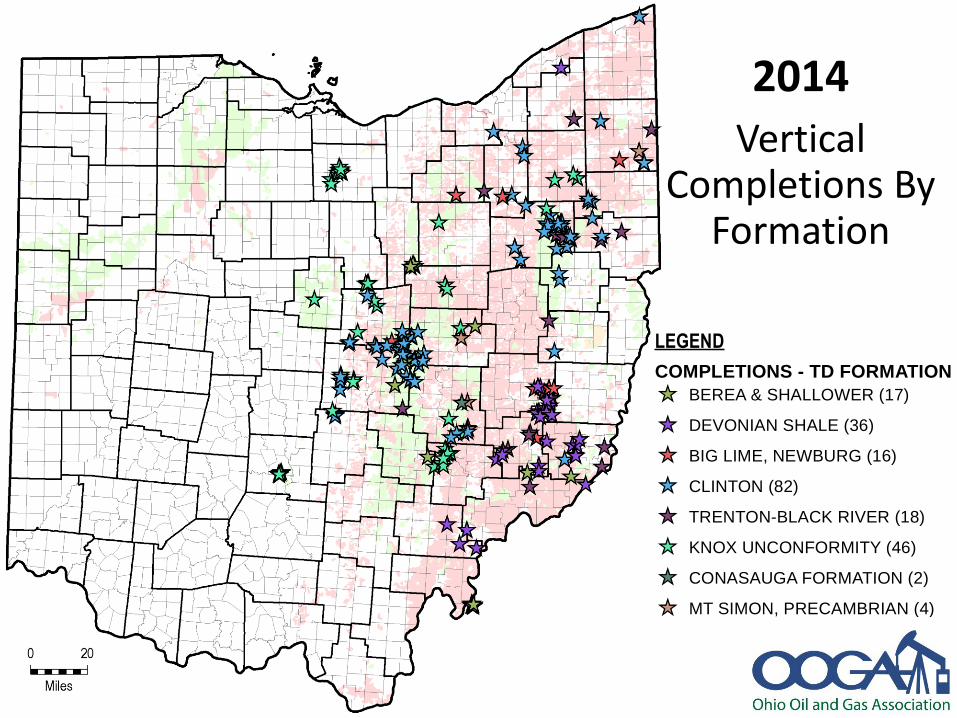
Vertical Completions By
Formation
LEGEND
COMPLETIONS - TD FORMATION
_̂ BEREA & SHALLOWER (17)
_̂ DEVONIAN SHALE (36)
_̂ BIG LIME, NEWBURG (16)
_̂ CLINTON (82)
_̂ TRENTON-BLACK RIVER (18)
_̂ KNOX UNCONFORMITY (46)
_̂ CONASAUGA FORMATION (2)
_̂ MT SIMON, PRECAMBRIAN (4)
Page 12
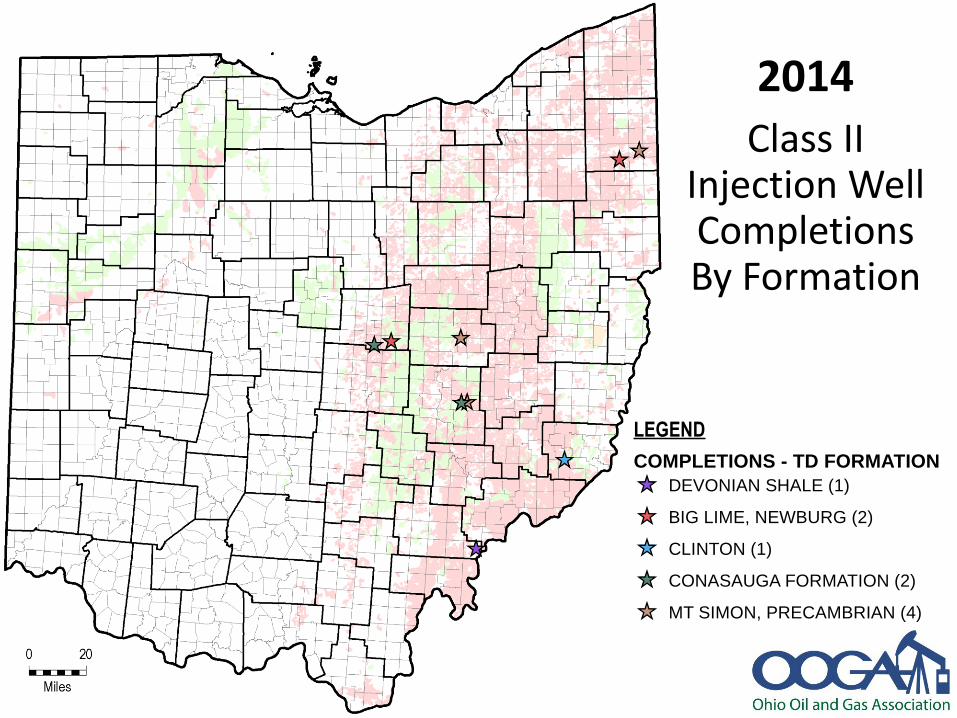
2014
Class II Injection Well Completions By Formation
LEGEND
COMPLETIONS - TD FORMATION
_̂ DEVONIAN SHALE (1)
_̂ BIG LIME, NEWBURG (2)
_̂ CLINTON (1)
_̂ CONASAUGA FORMATION (2)
_̂ MT SIMON, PRECAMBRIAN (4)
Page 13
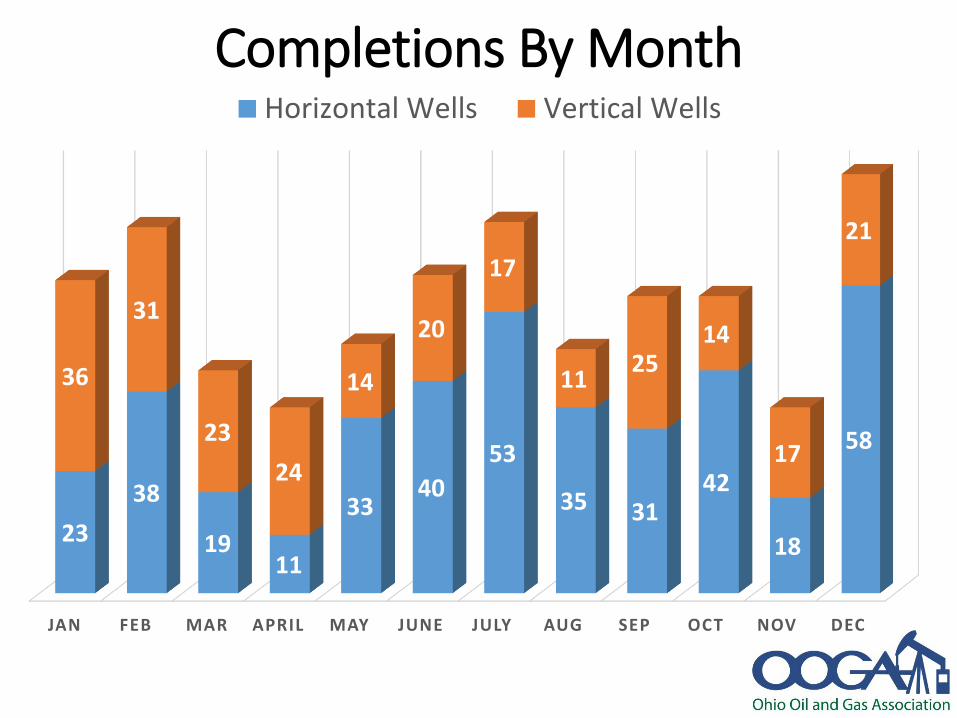
Completions By Month
JAN FEB MAR APRIL MAY JUNE JULY AUG SEP OCT NOV DEC
23
38
1911
3340
53
35 3142
18
58
36
31
23
24
14
20
17
1125
14
17
21
Horizontal Wells Vertical Wells
Page 14
Completions – Top 10 Counties
COUNTY COMPLETIONSPERCENT
HORIZONTAL
CARROLL 182 97%
HARRISON 64 95%
COLUMBIANA 53 79%
GUERNSEY 36 67%
NOBLE 34 50%
STARK 34 15%
BELMONT 29 97%
MONROE 28 61%
KNOX 17 0%
MUSKINGUM 15 0%
Page 15
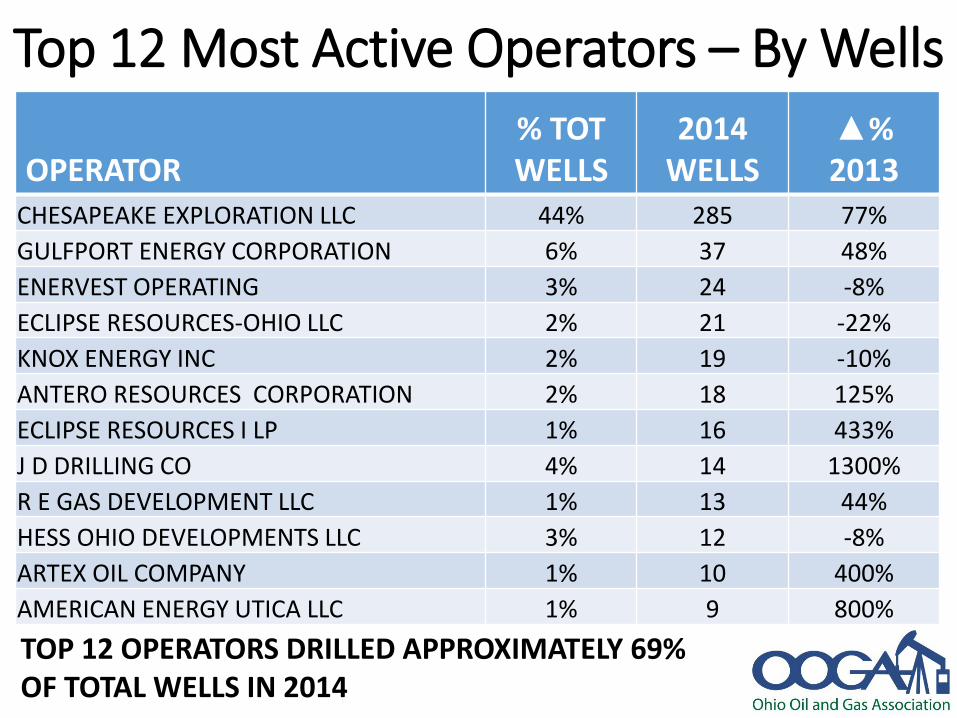
Top 12 Most Active Operators – By Wells
OPERATOR% TOTWELLS
2014WELLS
▲%2013
CHESAPEAKE EXPLORATION LLC 44% 285 77%
GULFPORT ENERGY CORPORATION 6% 37 48%
ENERVEST OPERATING 3% 24 -8%
ECLIPSE RESOURCES-OHIO LLC 2% 21 -22%
KNOX ENERGY INC 2% 19 -10%
ANTERO RESOURCES CORPORATION 2% 18 125%
ECLIPSE RESOURCES I LP 1% 16 433%
J D DRILLING CO 4% 14 1300%
R E GAS DEVELOPMENT LLC 1% 13 44%
HESS OHIO DEVELOPMENTS LLC 3% 12 -8%
ARTEX OIL COMPANY 1% 10 400%
AMERICAN ENERGY UTICA LLC 1% 9 800%
TOP 12 OPERATORS DRILLED APPROXIMATELY 69% OF TOTAL WELLS IN 2014
Page 16
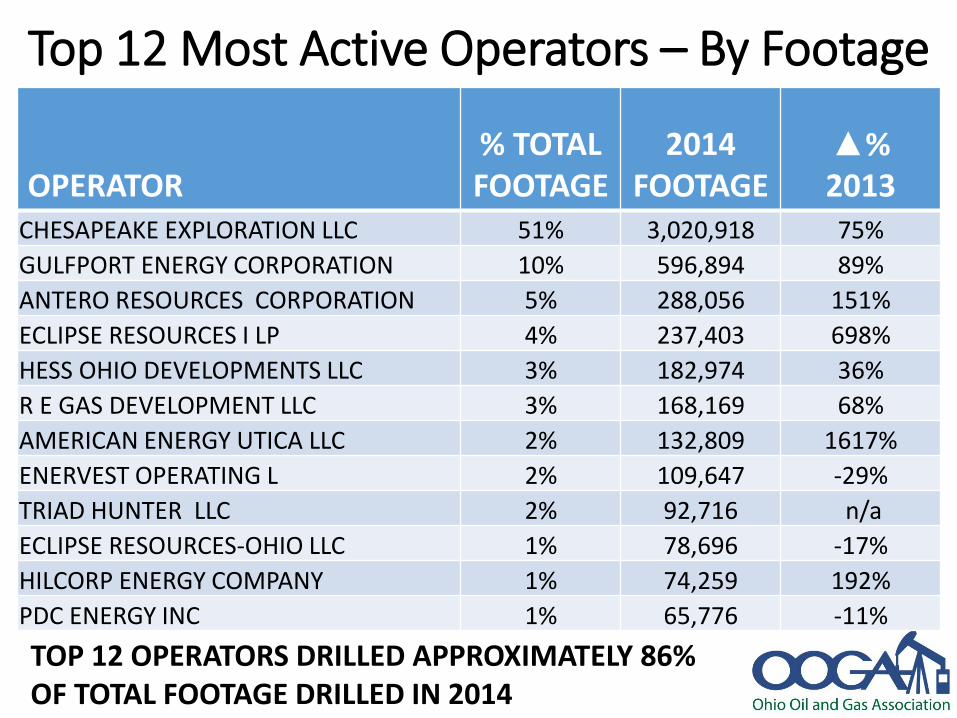
Top 12 Most Active Operators – By Footage
OPERATOR% TOTALFOOTAGE
2014FOOTAGE
▲%2013
CHESAPEAKE EXPLORATION LLC 51% 3,020,918 75%
GULFPORT ENERGY CORPORATION 10% 596,894 89%
ANTERO RESOURCES CORPORATION 5% 288,056 151%
ECLIPSE RESOURCES I LP 4% 237,403 698%
HESS OHIO DEVELOPMENTS LLC 3% 182,974 36%
R E GAS DEVELOPMENT LLC 3% 168,169 68%
AMERICAN ENERGY UTICA LLC 2% 132,809 1617%
ENERVEST OPERATING L 2% 109,647 -29%
TRIAD HUNTER LLC 2% 92,716 n/a
ECLIPSE RESOURCES-OHIO LLC 1% 78,696 -17%
HILCORP ENERGY COMPANY 1% 74,259 192%
PDC ENERGY INC 1% 65,776 -11%
TOP 12 OPERATORS DRILLED APPROXIMATELY 86% OF TOTAL FOOTAGE DRILLED IN 2014
Page 17
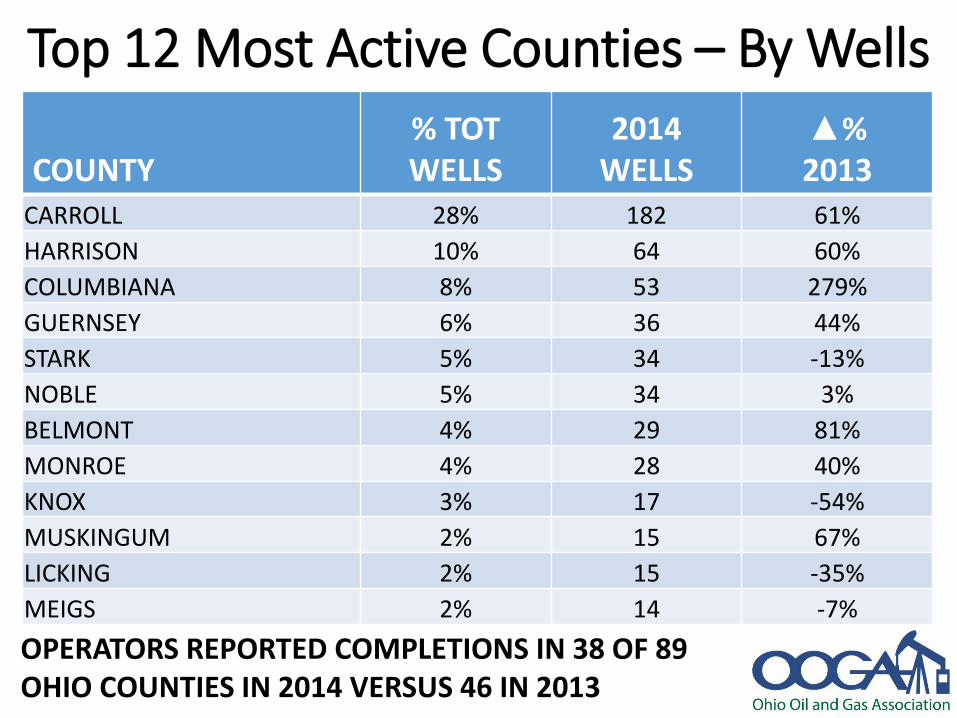
Top 12 Most Active Counties – By Wells
COUNTY% TOTWELLS
2014WELLS
▲%2013
CARROLL 28% 182 61%
HARRISON 10% 64 60%
COLUMBIANA 8% 53 279%
GUERNSEY 6% 36 44%
STARK 5% 34 -13%
NOBLE 5% 34 3%
BELMONT 4% 29 81%
MONROE 4% 28 40%
KNOX 3% 17 -54%
MUSKINGUM 2% 15 67%
LICKING 2% 15 -35%
MEIGS 2% 14 -7%
OPERATORS REPORTED COMPLETIONS IN 38 OF 89 OHIO COUNTIES IN 2014 VERSUS 46 IN 2013
Page 18
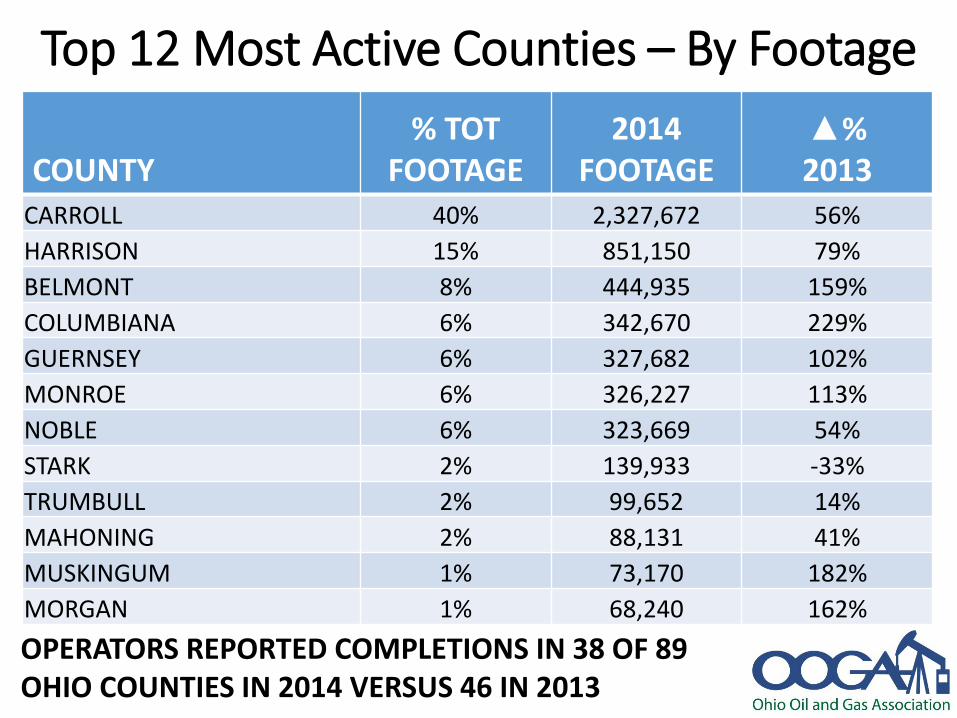
Top 12 Most Active Counties – By Footage
COUNTY% TOT
FOOTAGE2014
FOOTAGE▲%2013
CARROLL 40% 2,327,672 56%
HARRISON 15% 851,150 79%
BELMONT 8% 444,935 159%
COLUMBIANA 6% 342,670 229%
GUERNSEY 6% 327,682 102%
MONROE 6% 326,227 113%
NOBLE 6% 323,669 54%
STARK 2% 139,933 -33%
TRUMBULL 2% 99,652 14%
MAHONING 2% 88,131 41%
MUSKINGUM 1% 73,170 182%
MORGAN 1% 68,240 162%
OPERATORS REPORTED COMPLETIONS IN 38 OF 89 OHIO COUNTIES IN 2014 VERSUS 46 IN 2013
Page 19
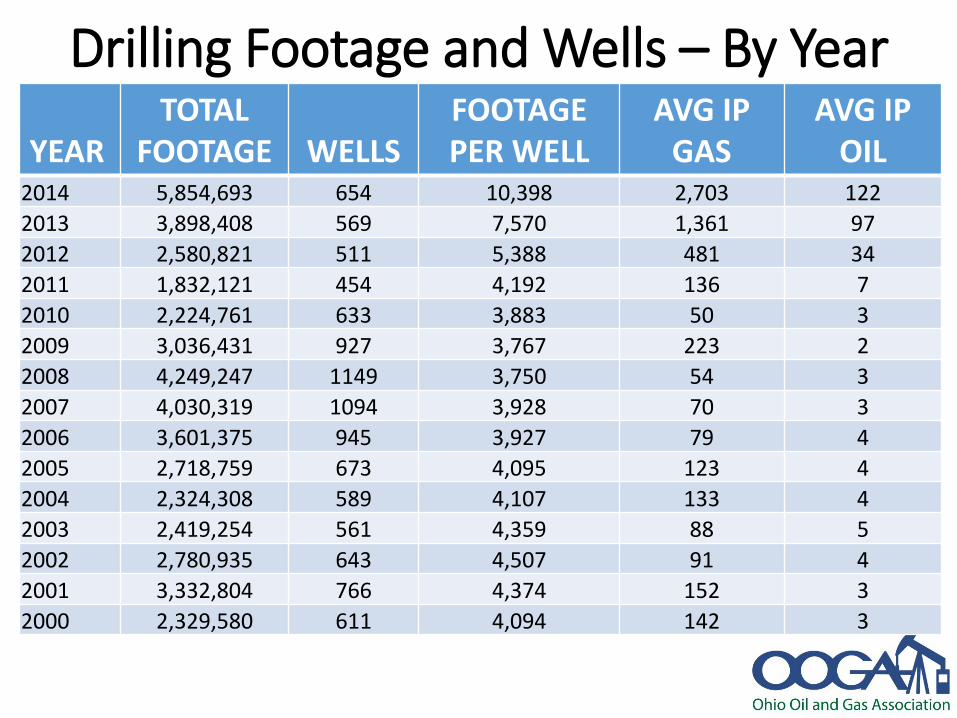
Drilling Footage and Wells – By Year
YEARTOTAL
FOOTAGE WELLSFOOTAGEPER WELL
AVG IP GAS
AVG IP OIL
2014 5,854,693 654 10,398 2,703 122
2013 3,898,408 569 7,570 1,361 97
2012 2,580,821 511 5,388 481 34
2011 1,832,121 454 4,192 136 7
2010 2,224,761 633 3,883 50 3
2009 3,036,431 927 3,767 223 2
2008 4,249,247 1149 3,750 54 3
2007 4,030,319 1094 3,928 70 3
2006 3,601,375 945 3,927 79 4
2005 2,718,759 673 4,095 123 4
2004 2,324,308 589 4,107 133 4
2003 2,419,254 561 4,359 88 5
2002 2,780,935 643 4,507 91 4
2001 3,332,804 766 4,374 152 3
2000 2,329,580 611 4,094 142 3
Page 20
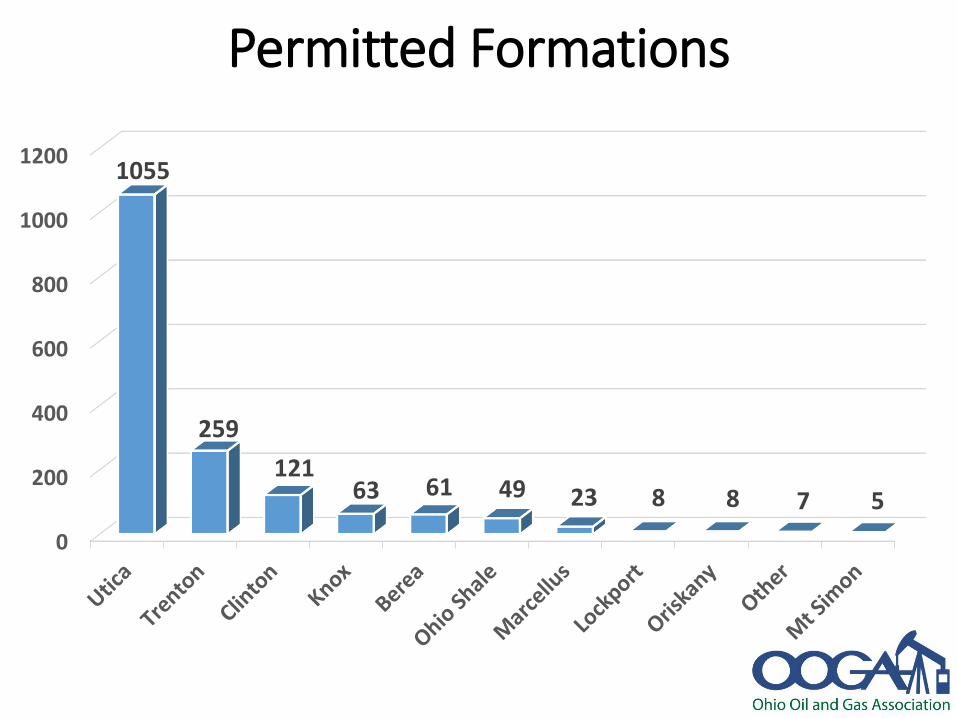
Permitted Formations
0
200
400
600
800
1000
12001055
259
12163 61 49 23 8 8 7 5
Page 21
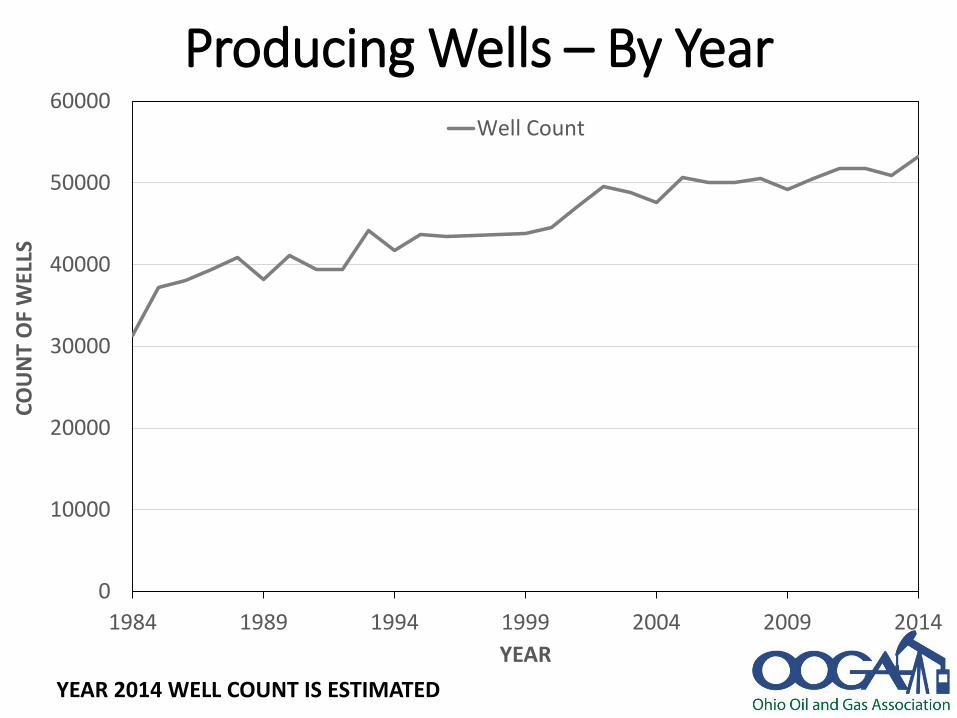
Producing Wells – By Year
0
10000
20000
30000
40000
50000
60000
1984 1989 1994 1999 2004 2009 2014
CO
UN
T O
F W
ELLS
YEAR
Well Count
YEAR 2014 WELL COUNT IS ESTIMATED
Page 22
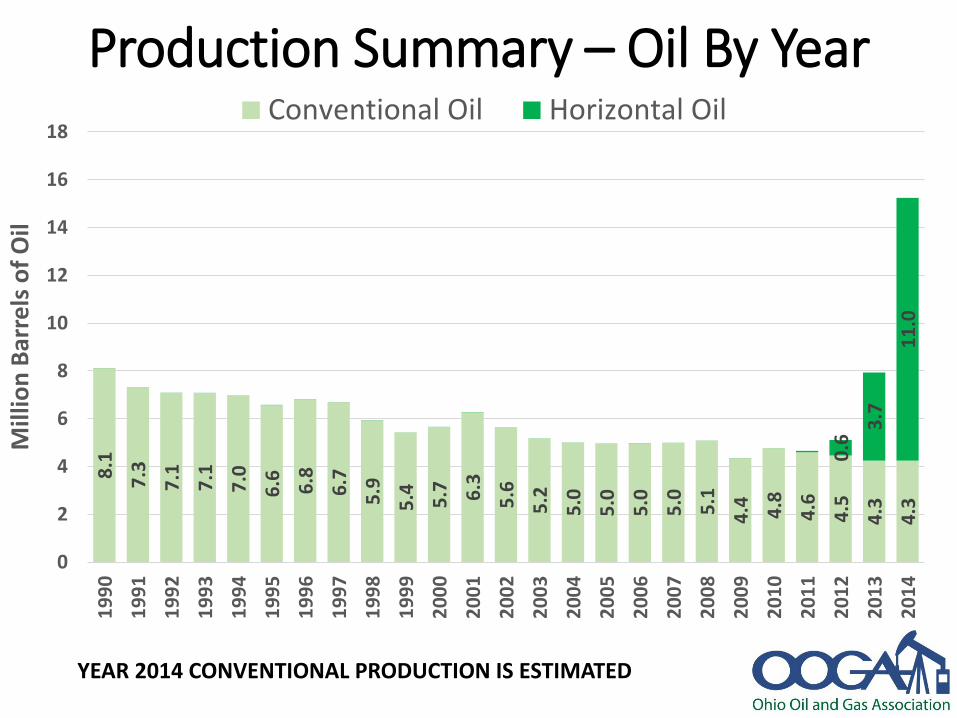
Production Summary – Oil By Year8
.1
7.3
7.1
7.1
7.0
6.6 6.8
6.7
5.9
5.4 5.7 6.3
5.6
5.2
5.0
5.0
5.0 5.0 5.1
4.4 4.8
4.6
4.5
4.3
4.3
0.6
3.7
11
.0
0
2
4
6
8
10
12
14
16
181
99
0
19
91
19
92
19
93
19
94
19
95
19
96
19
97
19
98
19
99
20
00
20
01
20
02
20
03
20
04
20
05
20
06
20
07
20
08
20
09
20
10
20
11
20
12
20
13
20
14
Mill
ion
Bar
rels
of
Oil
Conventional Oil Horizontal Oil
YEAR 2014 CONVENTIONAL PRODUCTION IS ESTIMATED
Page 23
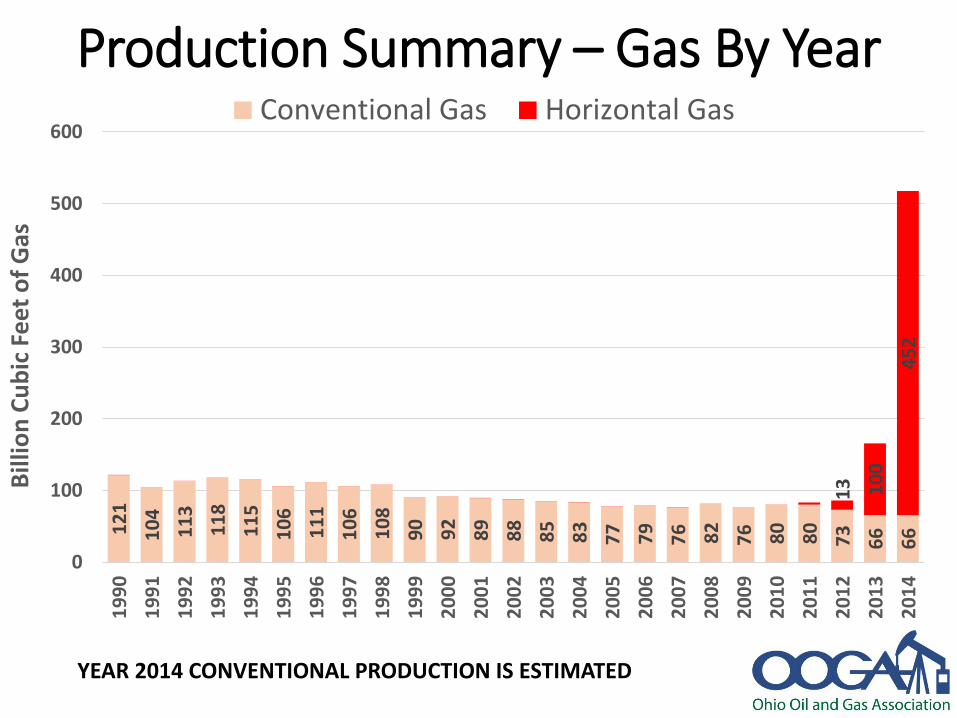
Production Summary – Gas By Year1
21
10
4
11
3
11
8
11
5
10
6
11
1
10
6
10
8
90 92
89
88
85
83
77 79
76 82
76 80
80
73
66
66
13 10
0
45
2
0
100
200
300
400
500
6001
99
0
19
91
19
92
19
93
19
94
19
95
19
96
19
97
19
98
19
99
20
00
20
01
20
02
20
03
20
04
20
05
20
06
20
07
20
08
20
09
20
10
20
11
20
12
20
13
20
14
Bill
ion
Cu
bic
Fe
et o
f G
as
Conventional Gas Horizontal Gas
YEAR 2014 CONVENTIONAL PRODUCTION IS ESTIMATED
Page 24
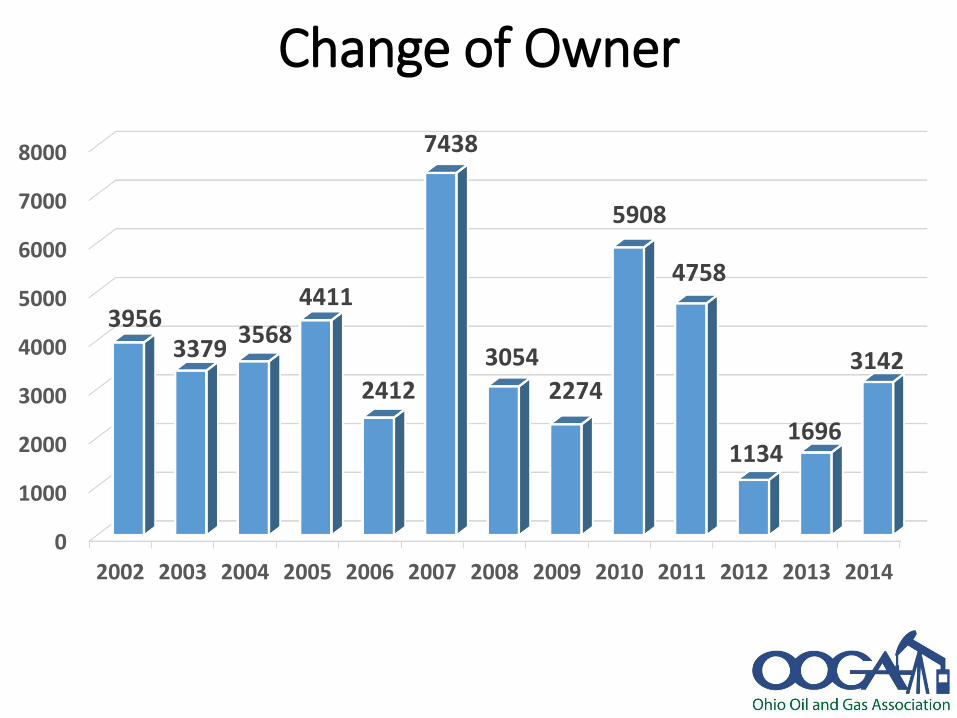
Change of Owner
0
1000
2000
3000
4000
5000
6000
7000
8000
2002 2003 2004 2005 2006 2007 2008 2009 2010 2011 2012 2013 2014
39563379
3568
4411
2412
7438
3054
2274
5908
4758
11341696
3142
Page 25
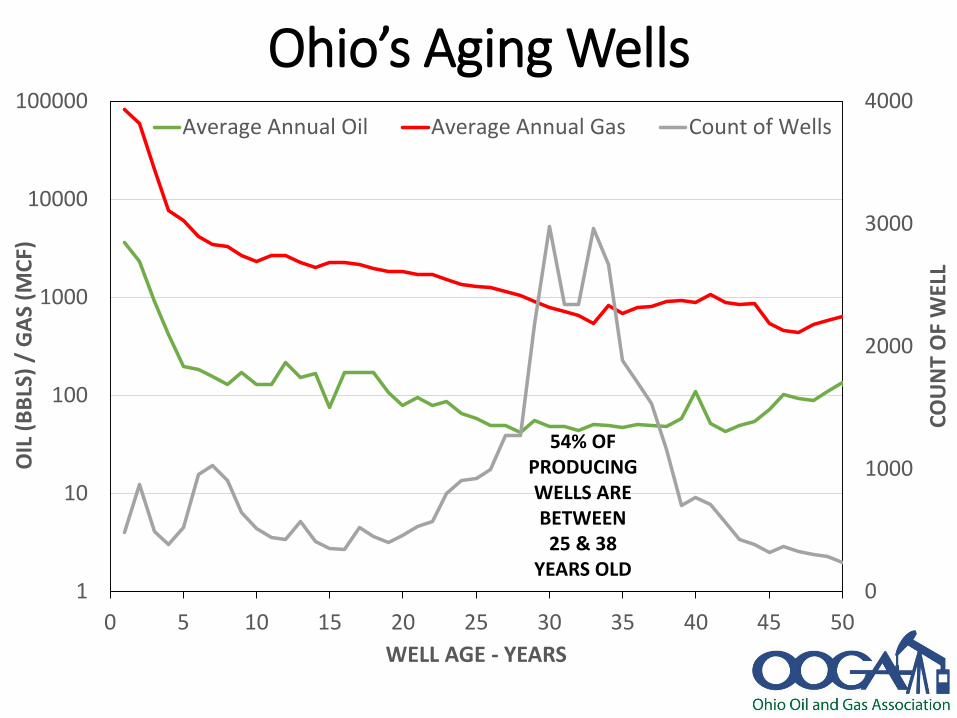
Ohio’s Aging Wells
0
1000
2000
3000
4000
1
10
100
1000
10000
100000
0 5 10 15 20 25 30 35 40 45 50
CO
UN
T O
F W
ELL
OIL
(B
BLS
) /
GA
S (M
CF)
WELL AGE - YEARS
Average Annual Oil Average Annual Gas Count of Wells
54% OF PRODUCING WELLS ARE BETWEEN
25 & 38 YEARS OLD
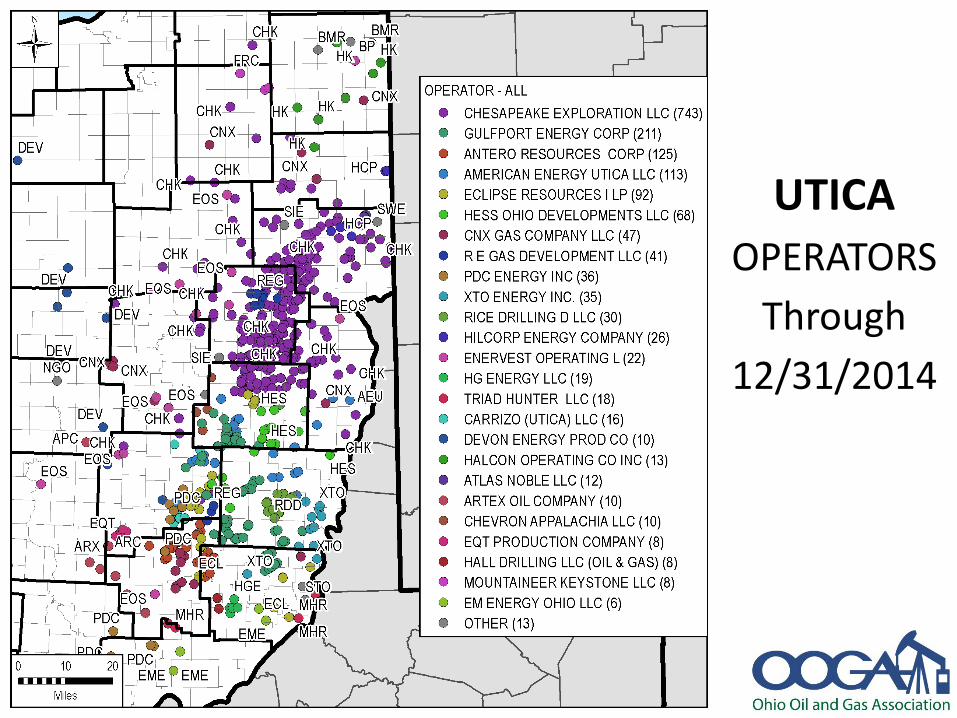
Page 26
UTICA
OPERATORS
Through
12/31/2014
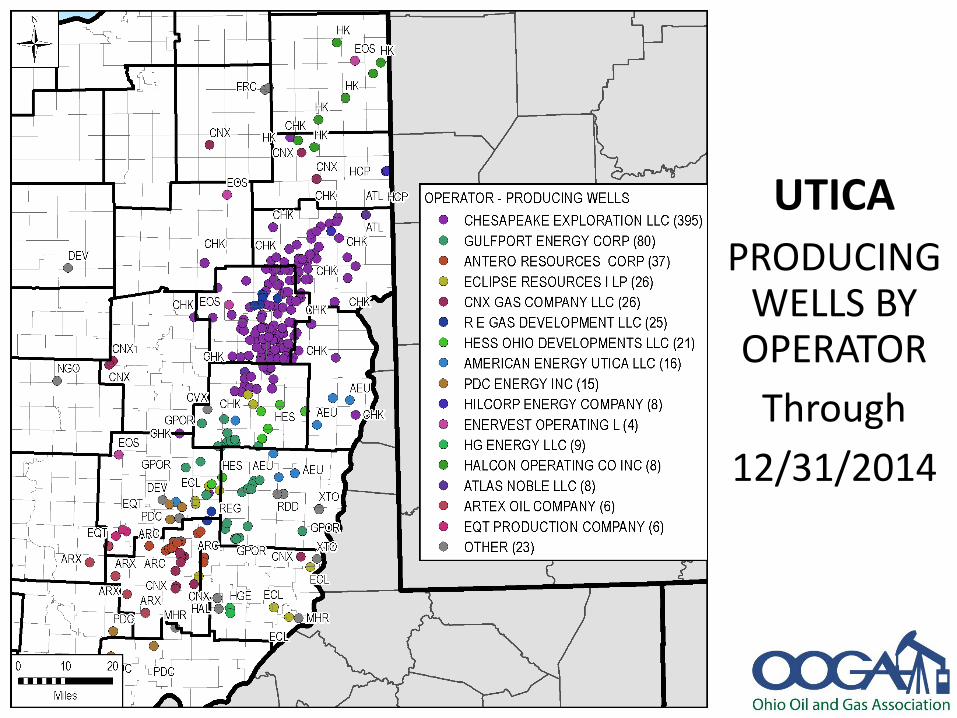
Page 27
UTICA
PRODUCING WELLS BY
OPERATOR
Through
12/31/2014
Page 28
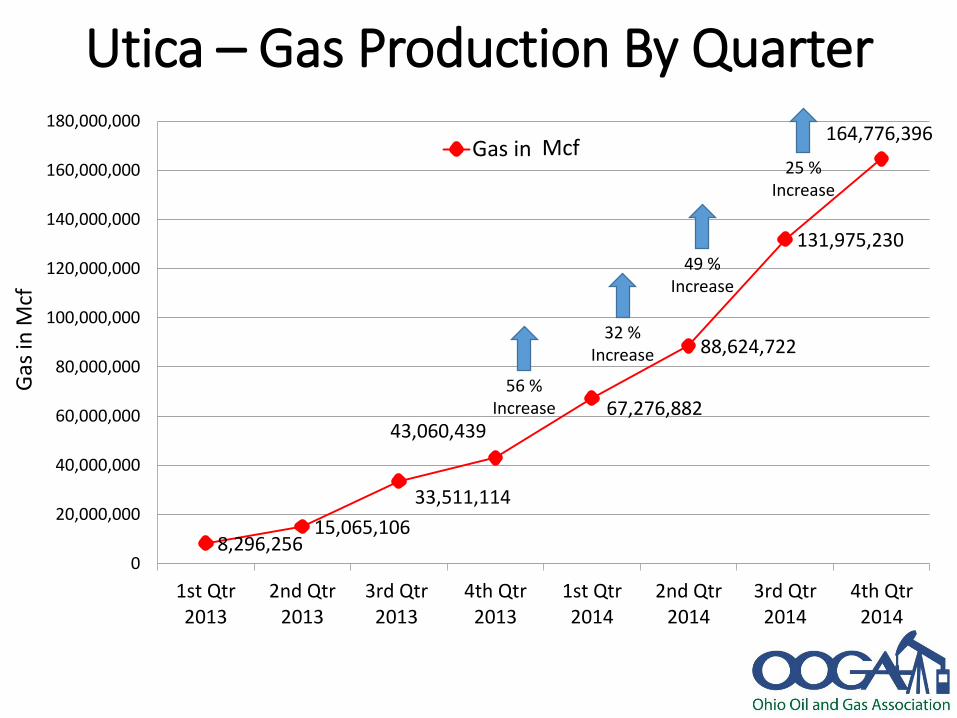
Utica – Gas Production By Quarter
8,296,25615,065,106
33,511,114
43,060,43967,276,882
88,624,722
131,975,230
164,776,396
0
20,000,000
40,000,000
60,000,000
80,000,000
100,000,000
120,000,000
140,000,000
160,000,000
180,000,000
1st Qtr2013
2nd Qtr2013
3rd Qtr2013
4th Qtr2013
1st Qtr2014
2nd Qtr2014
3rd Qtr2014
4th Qtr2014
Gas
in M
cf
Gas in Mcf'sMcf25 %
Increase
49 %Increase
32 %Increase
56 %Increase
Page 29
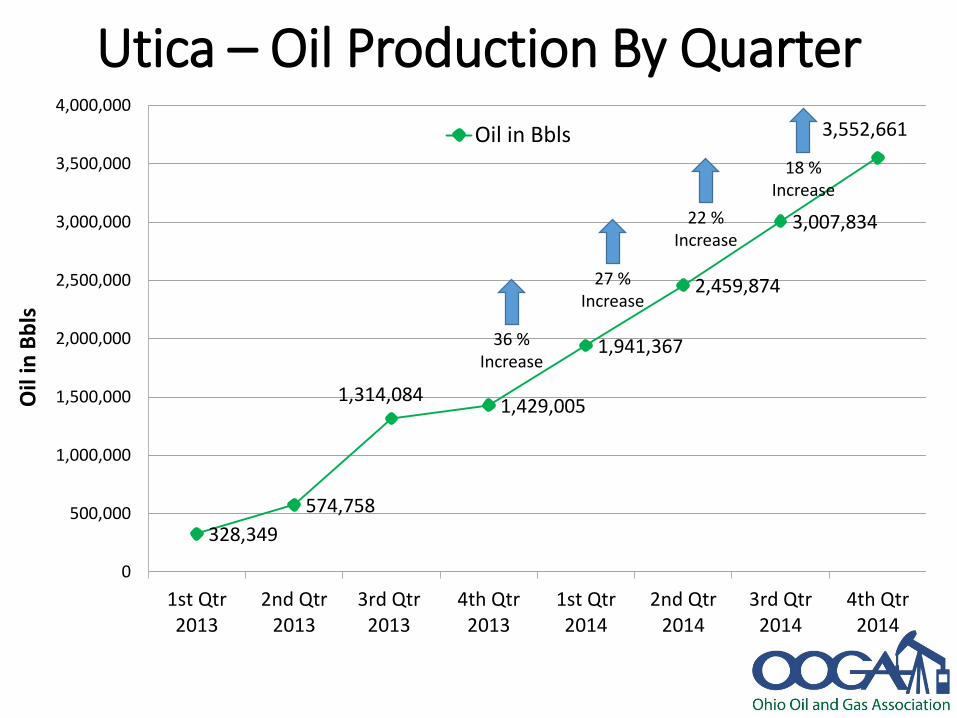
Utica – Oil Production By Quarter
328,349
574,758
1,314,0841,429,005
1,941,367
2,459,874
3,007,834
3,552,661
0
500,000
1,000,000
1,500,000
2,000,000
2,500,000
3,000,000
3,500,000
4,000,000
1st Qtr2013
2nd Qtr2013
3rd Qtr2013
4th Qtr2013
1st Qtr2014
2nd Qtr2014
3rd Qtr2014
4th Qtr2014
Oil
in B
bls
Oil in Bbls
18 %Increase
22 %Increase
27 %Increase
36 %Increase
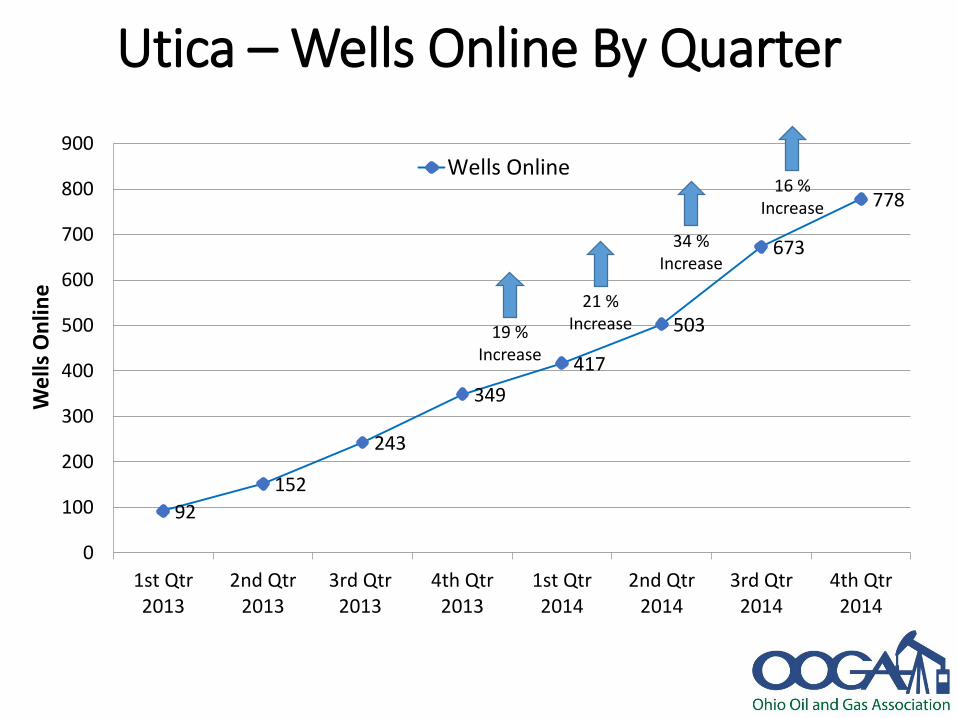
Page 30
Utica – Wells Online By Quarter
92
152
243
349
417
503
673
778
0
100
200
300
400
500
600
700
800
900
1st Qtr2013
2nd Qtr2013
3rd Qtr2013
4th Qtr2013
1st Qtr2014
2nd Qtr2014
3rd Qtr2014
4th Qtr2014
We
lls O
nlin
e
Wells Online16 %
Increase
34 %Increase
21 %Increase19 %
Increase
Page 31
Utica EUR Estimation
• Used operator reported production to ODNR through 3rd Qtr 2014
• Calculated EUR values for each well
• Adjusted EUR to barrels of oil equivalent (BOE)• used GAS/OIL ratio of 15:1 (based on current market prices)
• Used composite type curve from several shale plays
Page 32
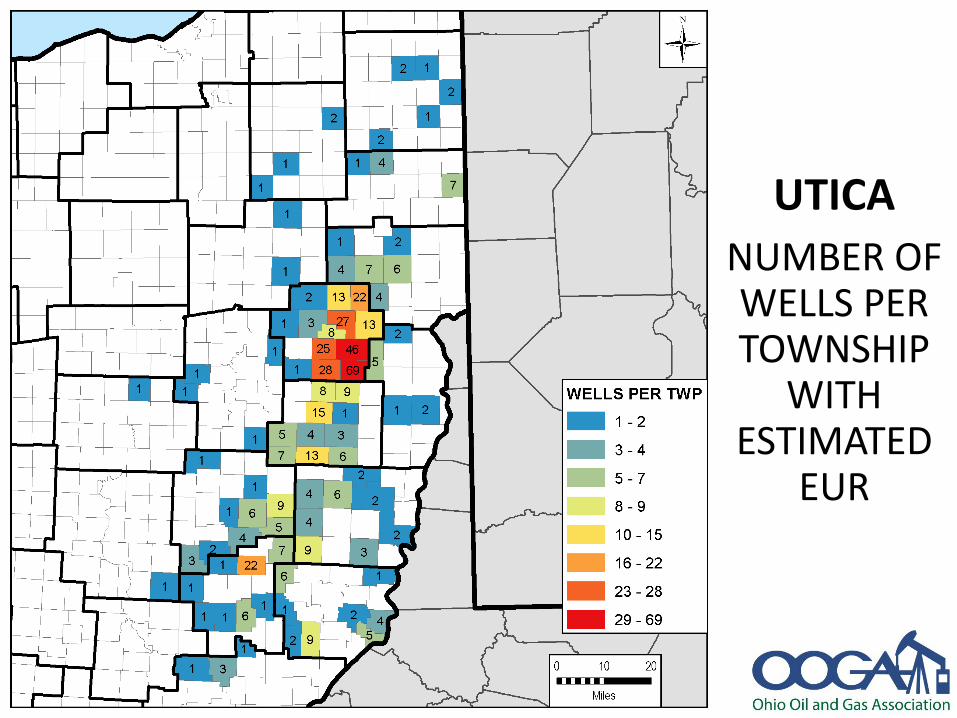
UTICA
NUMBER OF WELLS PER TOWNSHIP
WITH ESTIMATED
EUR
Page 33
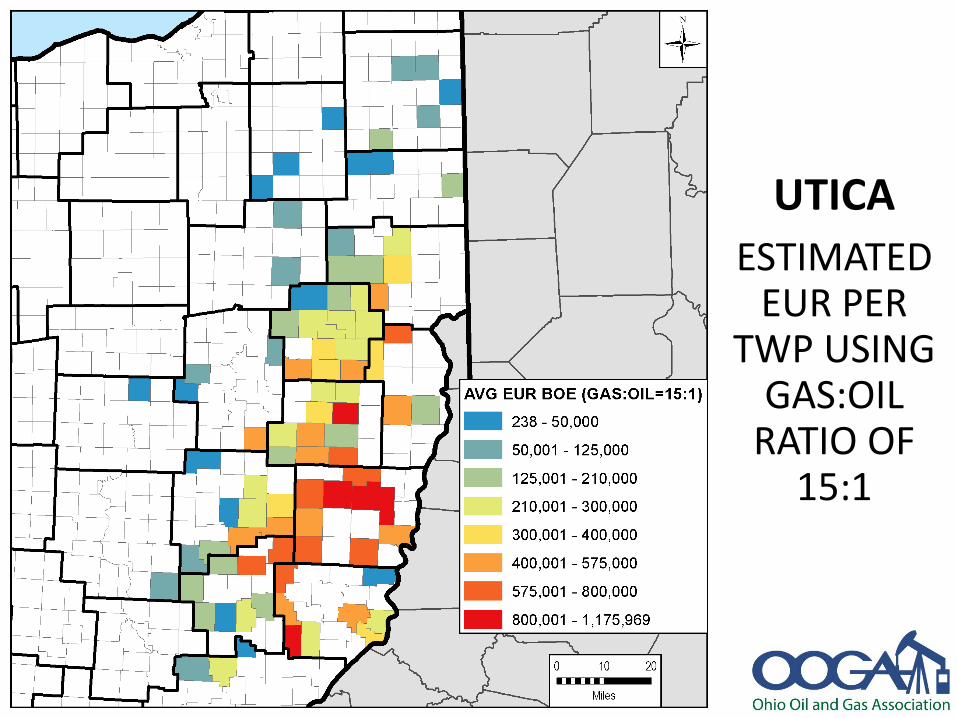
UTICA
ESTIMATED EUR PER
TWP USING GAS:OIL
RATIO OF 15:1
Page 34
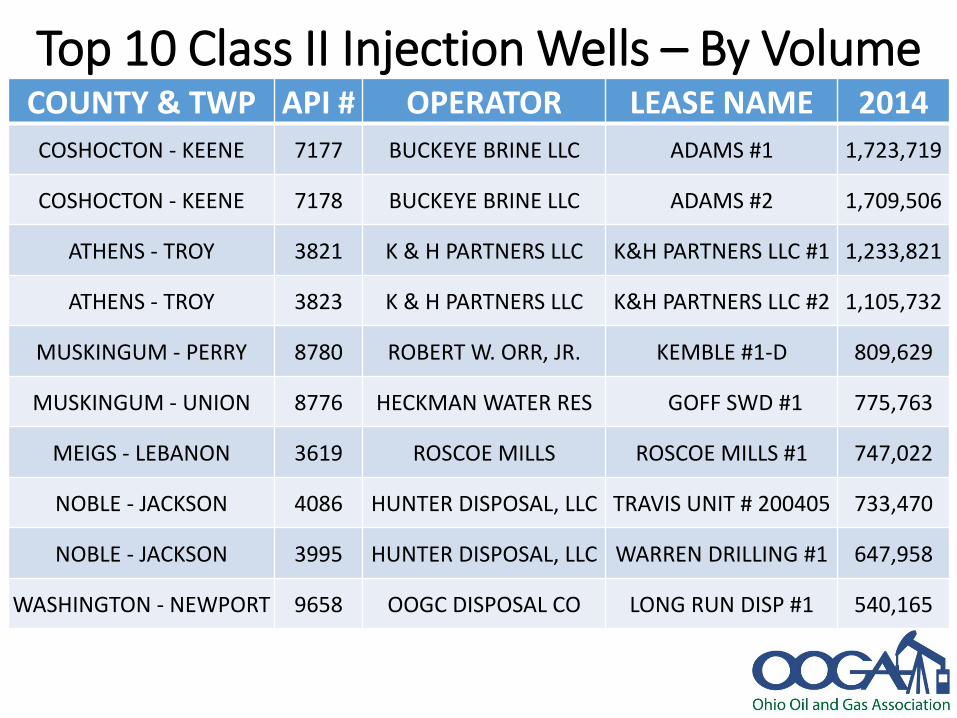
Top 10 Class II Injection Wells – By VolumeCOUNTY & TWP API # OPERATOR LEASE NAME 2014
COSHOCTON - KEENE 7177 BUCKEYE BRINE LLC ADAMS #1 1,723,719
COSHOCTON - KEENE 7178 BUCKEYE BRINE LLC ADAMS #2 1,709,506
ATHENS - TROY 3821 K & H PARTNERS LLC K&H PARTNERS LLC #1 1,233,821
ATHENS - TROY 3823 K & H PARTNERS LLC K&H PARTNERS LLC #2 1,105,732
MUSKINGUM - PERRY 8780 ROBERT W. ORR, JR. KEMBLE #1-D 809,629
MUSKINGUM - UNION 8776 HECKMAN WATER RES GOFF SWD #1 775,763
MEIGS - LEBANON 3619 ROSCOE MILLS ROSCOE MILLS #1 747,022
NOBLE - JACKSON 4086 HUNTER DISPOSAL, LLC TRAVIS UNIT # 200405 733,470
NOBLE - JACKSON 3995 HUNTER DISPOSAL, LLC WARREN DRILLING #1 647,958
WASHINGTON - NEWPORT 9658 OOGC DISPOSAL CO LONG RUN DISP #1 540,165
Page 35
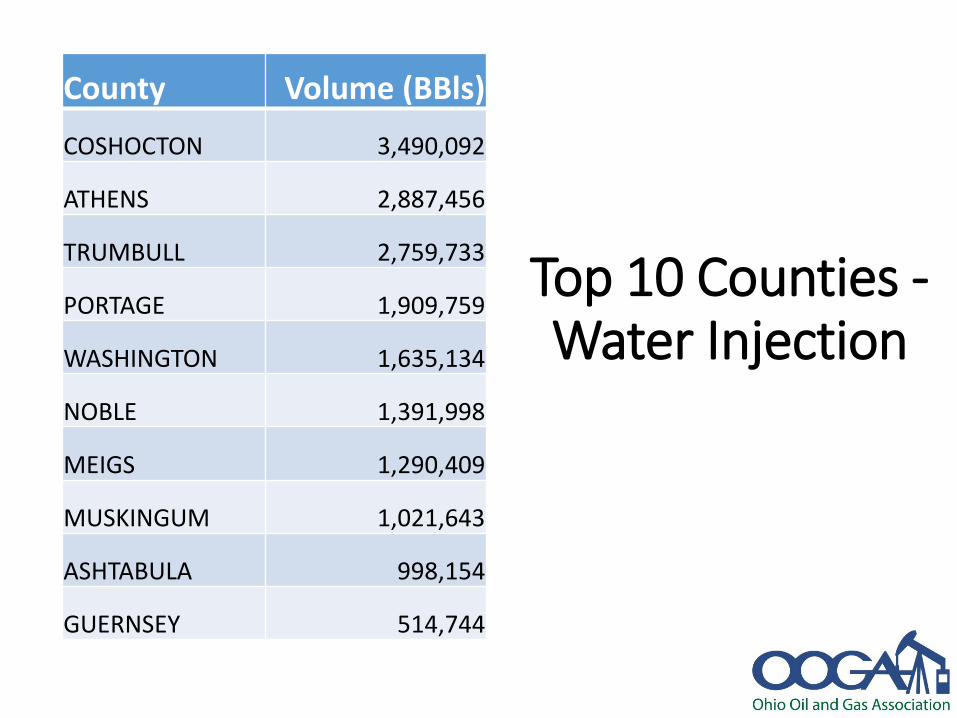
Top 10 Counties -Water Injection
County Volume (BBls)
COSHOCTON 3,490,092
ATHENS 2,887,456
TRUMBULL 2,759,733
PORTAGE 1,909,759
WASHINGTON 1,635,134
NOBLE 1,391,998
MEIGS 1,290,409
MUSKINGUM 1,021,643
ASHTABULA 998,154
GUERNSEY 514,744
Page 36
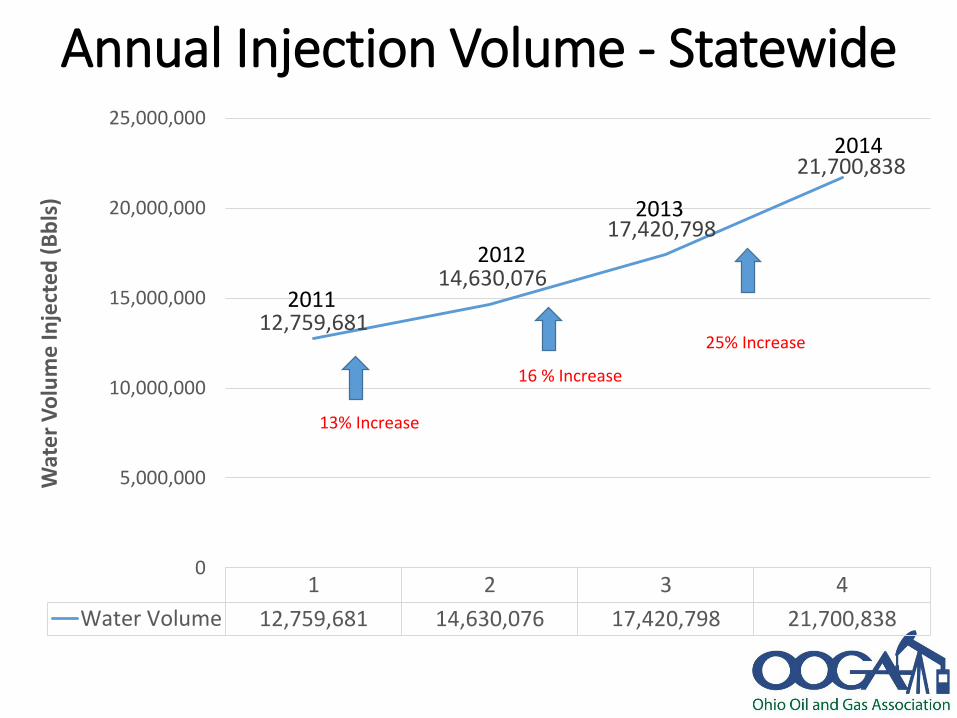
Annual Injection Volume - Statewide
1 2 3 4
Water Volume 12,759,681 14,630,076 17,420,798 21,700,838
12,759,681
14,630,076
17,420,798
21,700,838
0
5,000,000
10,000,000
15,000,000
20,000,000
25,000,000
Wat
er
Vo
lum
e In
ject
ed
(B
bls
)
2014
2013
2012
2011
16 % Increase
13% Increase
25% Increase
Page 37
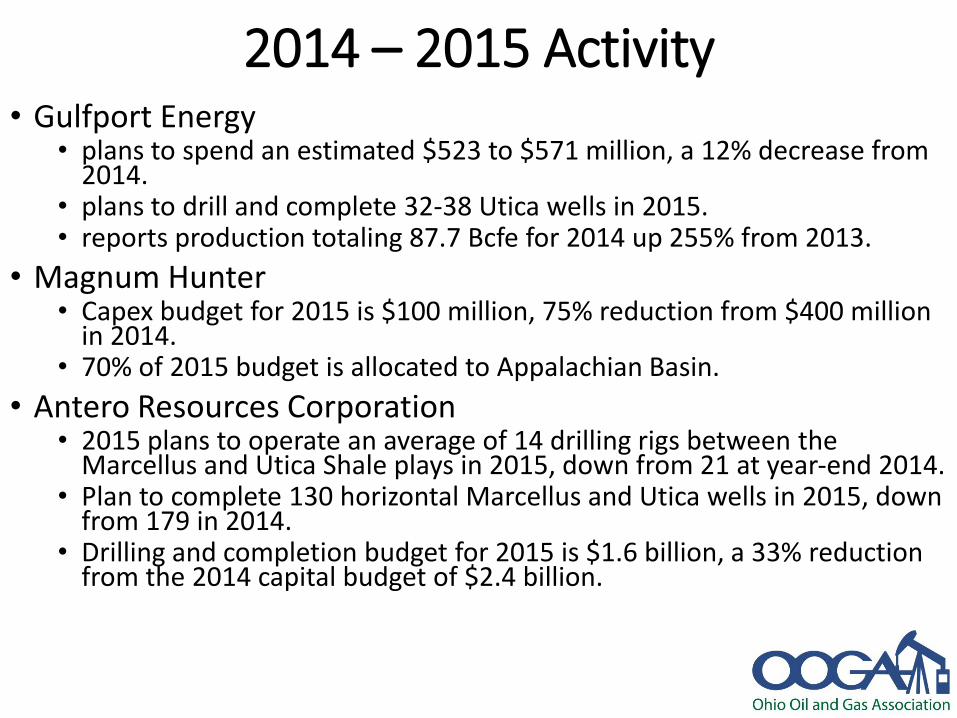
2014 – 2015 Activity• Gulfport Energy
• plans to spend an estimated $523 to $571 million, a 12% decrease from 2014.
• plans to drill and complete 32-38 Utica wells in 2015. • reports production totaling 87.7 Bcfe for 2014 up 255% from 2013.
• Magnum Hunter• Capex budget for 2015 is $100 million, 75% reduction from $400 million
in 2014. • 70% of 2015 budget is allocated to Appalachian Basin.
• Antero Resources Corporation • 2015 plans to operate an average of 14 drilling rigs between the
Marcellus and Utica Shale plays in 2015, down from 21 at year-end 2014.• Plan to complete 130 horizontal Marcellus and Utica wells in 2015, down
from 179 in 2014. • Drilling and completion budget for 2015 is $1.6 billion, a 33% reduction
from the 2014 capital budget of $2.4 billion.
Page 38
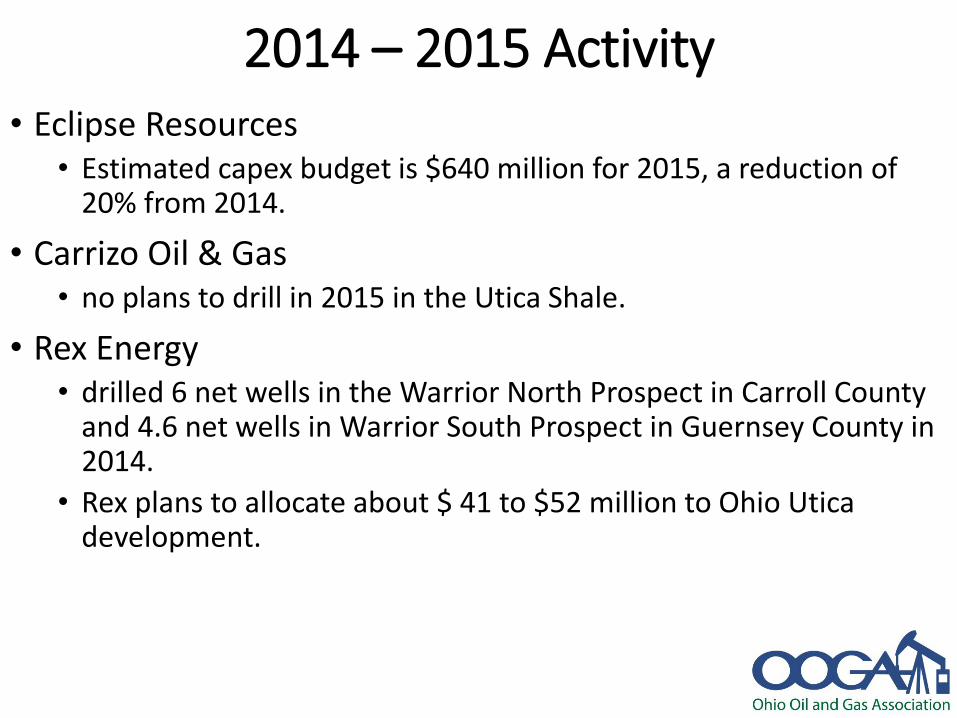
2014 – 2015 Activity• Eclipse Resources
• Estimated capex budget is $640 million for 2015, a reduction of 20% from 2014.
• Carrizo Oil & Gas • no plans to drill in 2015 in the Utica Shale.
• Rex Energy• drilled 6 net wells in the Warrior North Prospect in Carroll County
and 4.6 net wells in Warrior South Prospect in Guernsey County in 2014.
• Rex plans to allocate about $ 41 to $52 million to Ohio Utica development.
Page 39
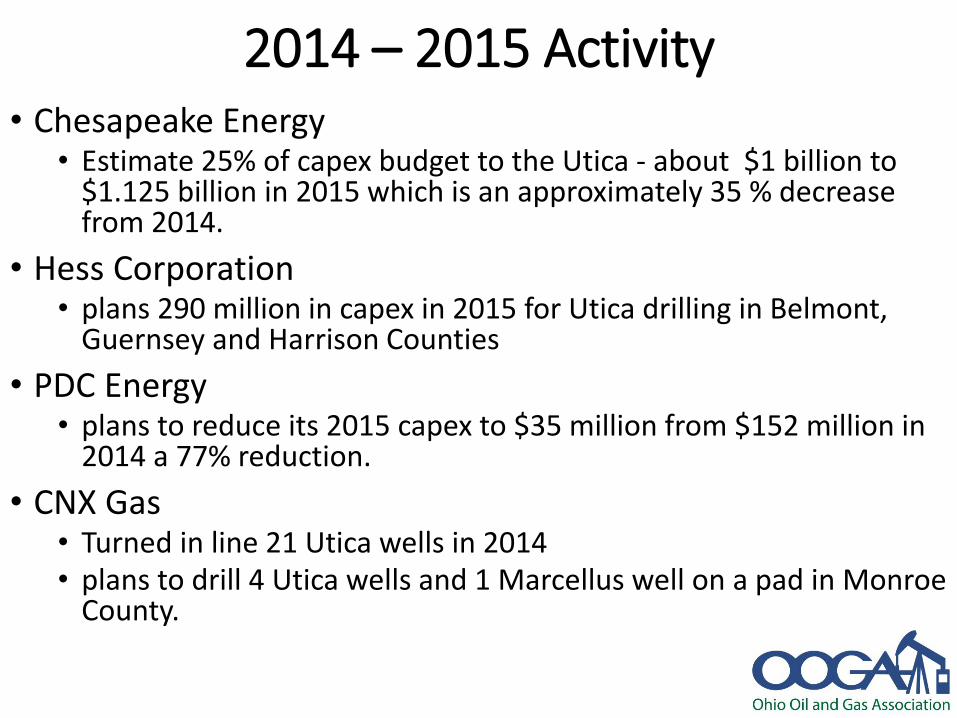
2014 – 2015 Activity• Chesapeake Energy
• Estimate 25% of capex budget to the Utica - about $1 billion to $1.125 billion in 2015 which is an approximately 35 % decrease from 2014.
• Hess Corporation• plans 290 million in capex in 2015 for Utica drilling in Belmont,
Guernsey and Harrison Counties
• PDC Energy• plans to reduce its 2015 capex to $35 million from $152 million in
2014 a 77% reduction.
• CNX Gas • Turned in line 21 Utica wells in 2014• plans to drill 4 Utica wells and 1 Marcellus well on a pad in Monroe
County.
Page 40
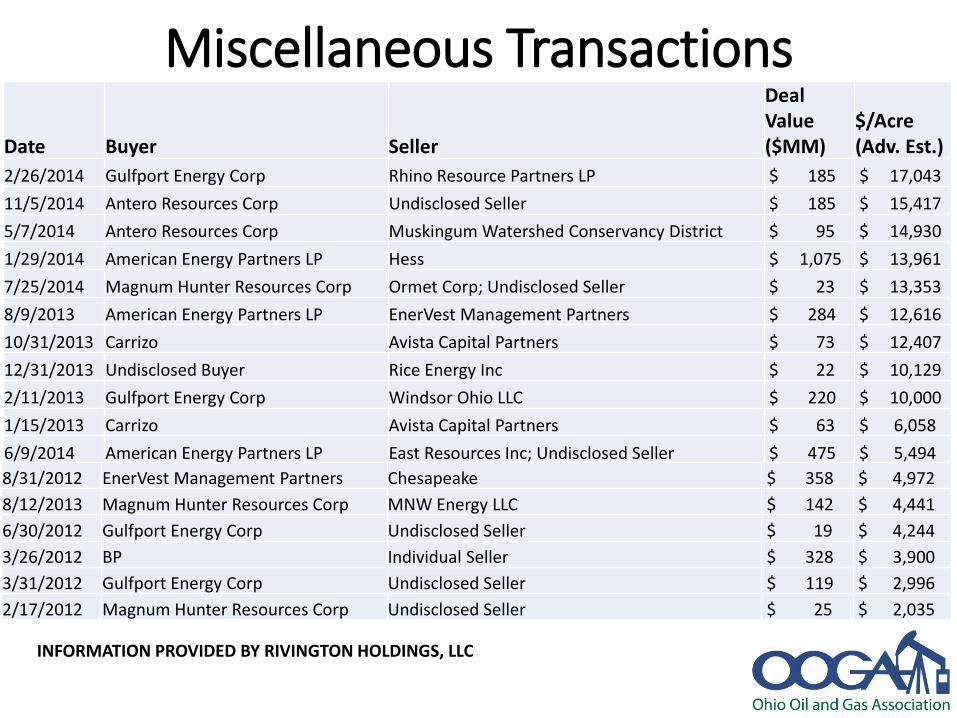
Miscellaneous Transactions
Date Buyer Seller
Deal Value($MM)
$/Acre(Adv. Est.)
2/26/2014 Gulfport Energy Corp Rhino Resource Partners LP $ 185 $ 17,043
11/5/2014 Antero Resources Corp Undisclosed Seller $ 185 $ 15,417
5/7/2014 Antero Resources Corp Muskingum Watershed Conservancy District $ 95 $ 14,930
1/29/2014 American Energy Partners LP Hess $ 1,075 $ 13,961
7/25/2014 Magnum Hunter Resources Corp Ormet Corp; Undisclosed Seller $ 23 $ 13,353
8/9/2013 American Energy Partners LP EnerVest Management Partners $ 284 $ 12,616
10/31/2013 Carrizo Avista Capital Partners $ 73 $ 12,407
12/31/2013 Undisclosed Buyer Rice Energy Inc $ 22 $ 10,129
2/11/2013 Gulfport Energy Corp Windsor Ohio LLC $ 220 $ 10,000
1/15/2013 Carrizo Avista Capital Partners $ 63 $ 6,058
6/9/2014 American Energy Partners LP East Resources Inc; Undisclosed Seller $ 475 $ 5,494
INFORMATION PROVIDED BY RIVINGTON HOLDINGS, LLC
8/31/2012 EnerVest Management Partners Chesapeake $ 358 $ 4,972
8/12/2013 Magnum Hunter Resources Corp MNW Energy LLC $ 142 $ 4,441
6/30/2012 Gulfport Energy Corp Undisclosed Seller $ 19 $ 4,244
3/26/2012 BP Individual Seller $ 328 $ 3,900
3/31/2012 Gulfport Energy Corp Undisclosed Seller $ 119 $ 2,996
2/17/2012 Magnum Hunter Resources Corp Undisclosed Seller $ 25 $ 2,035
Page 41
THANK YOU!Marty Shumway
(614) 846-1391
[email protected]
Special Thanks To:
Ohio Oil and Gas Association
Bill Arnholt, Northwood Energy
Tim Knobloch, James Knobloch Petroleum Consultants, Inc.
Larry Wickstrom, Wickstrom Geosciences