This discussion paper is/has been under review for the journal Hydrology and Earth SystemSciences (HESS). Please refer to the corresponding final paper in HESS if available.
Vertical hydraulic conductivity of aclayey-silt aquitard: accelerated fluid flowin a centrifuge permeameter comparedwith in situ conditionsW. A. Timms1,2, R. Crane2,3, D. J. Anderson3, S. Bouzalakos1,2, M. Whelan1,2,D. McGeeney2,3, P. F. Rahman3, A. Guinea2,3, and R. I. Acworth2,3
1School of Mining Engineering, University of New South Wales, Sydney, Australia2UNSW Connected Waters Initiative affiliated with the National Centre for GroundwaterResearch and Training Australia, Sydney, Australia3Water Research Laboratory, School of Civil and Environmental Engineering,University of New South Wales, Sydney, Australia
Received: 16 January 2014 – Accepted: 26 February 2014 – Published: 21 March 2014
Evaluating the possibility of leakage through low permeability geological strata is crit-ically important for sustainable water supplies, extraction of fuels from strata such ascoal beds, and confinement of waste within the earth. Characterizing low or negligi-ble flow rates and transport of solutes can require impractically long periods of field5
or laboratory testing, but is necessary for evaluations over regional areas and overmulti-decadal timescales. The current work reports a custom designed centrifuge per-meameter (CP) system, which can provide relatively rapid and reliable hydraulic con-ductivity (K ) measurement compared to column permeameter tests at standard gravity(1g). Linear fluid velocity through a low K porous sample is linearly related to g-level10
during a CP flight unless consolidation or geochemical reactions occur. The CP moduleis designed to fit within a standard 2 m diameter, geotechnical centrifuge with a capac-ity for sample dimensions of 30 to 100 mm diameter and 30 to 200 mm in length. Atmaximum RPM the resultant centrifugal force is equivalent to 550g at base of sampleor a total stress of ∼2 MPa. K is calculated by measuring influent and effluent volumes.15
A custom designed mounting system allows minimal disturbance of drill core samplesand a centrifugal force that represents realistic in situ stress conditions is applied. For-mation fluids were used as influent to limit any shrink-swell phenomena which mayalter the resultant K value. Vertical hydraulic conductivity (Kv) results from CP test-ing of core from the sites in the same clayey silt formation varied (10−7 to 10−9 ms−1,20
n=14) but higher than 1g column permeameter tests of adjacent core using deion-ized water (10−9 to 10−11 ms−1, n=7). Results at one site were similar to in situ Kv
values (3×10⁻⁹ ms−1) from pore pressure responses within a 30 m clayey sequencein a homogenous area of the formation. Kv sensitivity to sample heterogeneity was ob-served, and anomalous flow via preferential pathways could be readily identified. Re-25
sults demonstrate the utility of centrifuge testing for measuring minimum K values thatcan contribute to assessments of geological formations at large scale. The importance
of using realistic stress conditions and influent geochemistry during hydraulic testing isalso demonstrated.
1 Introduction
Clay or other low permeability sediment and rock often dominate sedimentary se-quences and can form important hydraulic barriers known as aquitards (Potter et al.,5
1980). Aquitards often overlie aquifers that yield strategically important fresh water re-sources, and form important cap-rocks or seals between shallow aquifers and deeperstrata that are targeted for depressurization during gas or mineral extraction (Timmset al., 2012). The current work compares the results of steady state centrifuge per-meability testing of semi-consolidated drill core samples with column tests at standard10
gravity (1g at earth’s surface, 9.8065 (ms−2) and formation scale permeability, basedon analysis of in situ pore pressure propagation.
Thick, low K , unoxidized, clay-rich aquitards represent important sites for waste con-finement and disposal (including high-level radioactive waste and sequestration of car-bon dioxide and saline effluents) and act as protective covers for regional aquifers15
(Cherry et al., 2004). Effective shale and claystone flow barriers are required to dis-connect shallow aquifer systems from underlying coal seams that are depressurizedto produce gas (Timms et al., 2012; APLNG, 2013). Furthermore, fine-grained geo-logic media are commonly used as engineered barriers to limit horizontal seepage ofmine water (Timms et al., 2013), for containment of tailings (Znidarčić et al., 2011) and20
municipal refuse and nuclear waste (Rowe et al., 1995). Low permeability material isdefined by Neuzil (1986) as K < 10−8 ms−1. The US EPA requires low permeabilitywaste barriers for hazardous waste landfills with K of < 10−9 ms−1 (US EPA, 1989).Neuzil (1986) noted that no geologic material properly tested proved to be entirelyimpermeable.25
Aquitards volumetrically constitute the bulk of sedimentary geologic deposits (Pot-ter et al., 1980), and are typically assumed saturated if located below a watertable
(Cherry et al., 2004). Water-saturated hydraulic conductivity (K ) and diffusion coef-ficients for aquitards may therefore not be applicable to variably saturated or non-water saturated low permeability strata. Research on aquitards comprised of semi-consolidated clayey materials deposited by alluvial, colluvial and aeolian processes islacking, compared with aquitard research on glacial tills (Grisak and Cherry, 1975),5
claystones (Smith et al., 2013; Jougnot et al., 2010) and shale (Neuzil, 1994; Joshet al., 2012). Clay-bearing sediments formed via alluvial, colluvial and aeolian pro-cesses frequently occur in the geosphere. For example, clayey silt aquitards accountfor 60 % of the ∼ 100 m thick alluvial sediment sequences, in the Mooki catchment ofAustralia’s Murray–Darling Basin (Farley, 2011) this represents a key gap in the current10
theoretical understanding of clay mineralogy and geochemistry.Aquitard research on alluvial sediments is important because recharge by slow seep-
age provides essential groundwater supplies for municipal water supply and crop irri-gation in relatively dry inland settings (Acworth and Timms, 2009). Increased effec-tive stress associated with aquifer drawdown for irrigation, may release saline water15
stored within shallow aquitards with implications for continuing high yields of fresh wa-ter. Characterising the effects of variable chemical composition of formation water onthe hydraulic conductivity of such sediments is therefore essential to determine thelong-term hydro-geochemical fate of such field sites.
Obtaining realistic measurements of groundwater flow and solute transport within20
aquitards is by definition a slow process, requiring relatively time consuming and ex-pensive field and laboratory studies. Various field and laboratory methods are availableto directly measure or indirectly calculate hydraulic conductivity in a horizontal (Kh) orvertical (Kv) orientation, and for saturated and semi-saturated or multi-phase flow (e.g.liquid and gas). Water level recovery of a bore pump test in glacial till (K = 10−11 ms−1)25
for example has occurred over a period of ∼ 30 years, with revised calculation of hy-draulic parameters to improve the fit with data that is emerging over this time (van derKamp, 2011).
Methods for measuring the in situ permeability of clay formations include: slug tests(piezometer tests, falling-head tests), aquifer pumping tests with piezometers in theaquitard, aquifer pumping tests with observation wells in the aquifer only, measurementof seasonal fluctuations of pore-pressure, measurement of pore-pressure changes andsettlement due to surface loading, and numerical analysis of local and regional ground-5
water flow (van der Kamp, 2001). Neuman and Witherspoon (1968) developed genericanalytical solutions for drawdown within an aquiclude, in which vertical flow occurrs,but is sufficient small to have no effect on water levels within an overlying or underlyingaquifer. Type curves were presented for analytical solutions applying for an infinitelythick and a finite thickness aquiclude. In contrast, analysis of a leaky aquitard-aquifer10
system was presented by Neuman and Witherspoon (1972). The ratio method, as it isknown, compared drawdown within an aquitard to drawdown in an underlying aquiferfrom which extraction was occurring. Vertical hydraulic conductivity is calculated fromthe hydraulic diffusion of pressure transients within a uniform, homogeneous aquitard.
The deconvolution of the pressure response with depth through an aquitard can be15
analysed with a Fourier transform method known as harmonic analysis (Boldt-Leppinand Hendry, 2003). The hydraulic diffusivity (hydraulic conductivity/specific storage) isexpressed analytically either based on the amplitude or phase shift of harmonic sig-nals, assuming that the thickness of the aquitard is half infinite. For example, harmonicanalysis enabled in situ Kv to be estimated from phase and amplitude shifts of pore20
pressure response to soil moisture loading propagating downwards though a 30 m thickaquitard on the basis of measured specific storage and hourly or 6 hourly groundwaterlevel monitoring over 5 years (Timms and Acworth, 2005). Jiang et al. (2013) furtherdeveloped the harmonic analysis method for finite aquitards in a multi-layer system,for the case of water level monitoring that is limited to aquifers bounding the aquitard,25
rather than from within the aquitard. Coherence analysis of water level fluctuationsin bounding aquifers from indeterminate stresses (e.g. pumping, recharge, rainfall orearthquake) was used to derive Kv for deep rock aquitards on the basis of interpolated
groundwater level data that was measured at irregular intervals of at least 10 days forseveral decades.
A more direct method of determining in situ hydraulic parameters is possible usingfully grouted vibrating wire transducers and high frequency data recording within deepformations, as recently demonstrated by Smith et al. (2013) for a bedrock claystone at5
up to 325 mb.g.l. (below ground level). Pore pressure and barometric pressure wererecorded at 30 min intervals and analysed for barometric response, earth tides, andrainfall events. Core samples from the same drill holes were vacuum sealed on sitefor consolidation testing and triaxial permeameter testing. The in situ compressibilityand specific storage derived from barometric pressure responses were as much as an10
order of magnitude smaller than laboratory results.A variety of laboratory testing techniques for low K samples are also available, how-
ever, the reliability of results may depend on factors such as the preparation and sizeof core samples, configuration of equipment and uncertainties of measurement, theinfluent water that is used and the stresses that are applied relative to in situ values,15
and whether permeability is directly measured from steady state flow, or subject toadditional parameters and assumptions with alternative flow regime. Laboratory test-ing of clayey-silt cores by standard rigid and flexible wall column techniques require1–2 weeks, compared with < 1 week in a centrifuge permeameter methods for unsat-urated samples (ASTM, 2010). Constant or falling-head tests in rigid-walled column20
permeameters at natural gravity require a large water pressure gradient and/or longtesting times for low-permeability samples, are subject to potential leakage, and maynot replicate in situ confining stresses. Column testing of core samples is possible forsome test conditions in triaxial cells such as those used in geotechnical and petroleumstudies, such as the study of Wright et al. (2002) on both Kh and Kv and anisotropy in25
limestone aquifers. However, standard practice for testing ultralow permeability cores(e.g. Kv < 1×10⁻¹⁰ ms−1) typically consists of applying a confining pressure to a watertight system and measuring relatively subtle changes in pressure with high resolutionpressure transducers (API, 1998).
Geotechnical centrifuges are used to subject porous samples to high artificial grav-ities in order to characterise their hydraulic and/or consolidation properties, and forphysical modelling as part of geotechnical design. Accelerated gravity acts on both thesolid particles and fluids within the porous sample without a large fluid pressure gra-dient to drive flow. The technique can be applied to investigate slow hydrogeological5
processes over shorter timescales, i.e. hydraulic flow through low permeability layersthat would take several years under in situ conditions can be reproduced in a geotech-nical centrifuge within hour or days, depending on the conditions.
Accelerated gravity achieves a steady state equilibrium for fluid flow within hoursor days of instrument operation, while simultaneously applying stresses to the solid10
matrix. A permeameter column, mounted on a geotechnical centrifuge is rotated suf-ficiently fast to accelerate flow and approximate in situ total stresses, while the targetg-level is designed to ensure that the matrix is not consolidated and chemical equilib-rium is maintained. Steady state flow can provide more reliable K results than transientflow techniques that provide results in less time, due partly to less complex instrumen-15
tation requirements. Although either steady state or transient flow approaches can beadopted in centrifuge permeameters, steady state flow is relatively straight forwardto interpret, depending on the assumptions and instrumentation available to indepen-dently measure pressure or suction gradients within the core (Zornberg and McCartney,2010).20
The geotechnical centrifuge system that is described in this paper is moderatelysized and relatively economic to operate, whilst able to perform both unsaturated andsaturated testing of porous media with real-time measurement of various parametersduring flight. These attributes mean that centrifuge permeameter testing of relativelylarge diameter core (up to 100 mm diameter) in this facility is comparable in cost to25
testing of small cores (38 mm diameter) using alternative methods such as He-gaspermeation. The system has been successfully used for testing low permeability rockcores (Bouzalakos et al., 2013). To date, there were no other direct Kv measurementson these deep shales available (APLNG, 2013) and alternative laboratory methods
were not successful in obtaining a Kv value from these very low K rocks (Bouzalakoset al., 2013).
This paper demonstrates novel centrifuge permeameter techniques and equipmentthat have been developed for characterizing semi-consolidated clayey silt cores. Coreswere obtained from various low permeability sediments below the watertable at depths5
of ∼ 10 to ∼ 40 mb.g.l. at sites in eastern Australia. The centrifuge permeameter test-ing results are compared with 1g column permeameter methods and in situ measure-ments of permeability, based on harmonic analysis of the high frequency pore pressurepropagation. The reliability of the Kv results to constrain assessments of regional scalevertical connectivity are considered in the context of sampling and experimental factors10
including flow and stress conditions within the centrifuge permeameter.
2 Centrifuge technology for hydraulic characterisation
2.1 Centrifugal acceleration
Centrifugal force is a body force that accelerates both solid and fluid phases withina core sample. A physical model of identical geologic material that is subjected to15
centrifugal acceleration experiences stresses equivalent to a full scale in situ prototype(Nimmo and Mello, 1991), where centrifugal acceleration (a) is equal to the scalingfactor (N) multiplied by standard gravity (g).
Newtown’s second law indicates that centripetal force (F ) is required to accelerate(ar ) an object with mass (m) to maintain a tangential velocity (V ), in a circular path at20
distance (r) from the axis of rotation. The centripetal force acts towards the centre ofrotation along the radius. From a non-inertial frame of reference, for example, on therotating beam of a centrifuge, a centrifugal force, equal but opposite to the centripetalforce, acts outwards from the center of rotation.
where a is the centrifugal acceleration (ms−2), r is the radius from the axis of rotation(m). Since the angular velocity ω = v/r (radians−1), we can express the centrifugalforce as:
F =mω2r (2)5
Centrifugal force is therefore a body force that accelerates both solid and fluid phaseswithin a core sample. A physical model of identical geologic material that is subjected tocentrifugal acceleration experiences stresses equivalent to a full scale in situ prototype(Nimmo and Mello, 1991), where centrifugal acceleration (a) is equal to the scalingfactor (N) multiplied by standard gravity (g).10
Centrifugal acceleration at any point within the centrifuge core is calculated as fol-lows:
a =ω2r = Ng (3)
The angular velocity is related to RPM (revolutionsmin−1) as:15
ω = 2π×RPM/60 (4)
Substituting Eq. (4) into Eq. (3) and dividing by g gives Eq. (5) to determine the N scalefor a given RPM and radius:
N = 0.001118× (RPM)2 × r (5)20
The driving force for fluid flow during centrifugation, and the scale N, is therefore di-rectly proportional to the square of rotational speed and radial position of the coresample. The value of N at the mid-height of the core Nmid (Fig. 1) provides a singleconvenient value of N. The variability of N from r0 to ri can be minimized for a speci-25
fied g-level by using a centrifuge permeameter with a larger radius and slower angularvelocity (Timms, 2009).
2.2 Centrifuge applications for physical modelling and characterisation
The centrifuge permeameter tests reported herein focus on hydraulic characterisa-tion of intact drill cores, in contrast to the more common application of geotechnicalcentrifuges for physical modelling of earth systems, such as contaminant transport(Arulanandan et al., 1988), characterizing unsaturated flow parameters (Nakajima and5
Stadler, 2006) and for physical modelling in geotechnical design (Garnier et al., 2007).For example, a geotechnical centrifuge was used to evaluate the seepage inducedconsolidation behaviour of mine tailings (Znidarčić et al., 2011).
The use of centrifuge systems has long been recognized as a valid and efficientmethod to characterize the hydraulic properties of soil, sediment and rock samples10
(Nimmo and Mello, 1991). Since centrifugal force is a body force experiments can beperformed under well controlled conditions with minimal heterogenetic disturbance ofthe sample. Indeed there are many advantages of centrifugal force as an alternativeto high pressure for hydraulic characterisation (Nimmo and Mello, 1991). Advantagesinclude: simplicity and ease of operation, centrifugal methods do not require complex15
pressure and/or fluid flow apparatus; K range, centrifugal force is determined by thespeed of revolution and therefore easily adjustable over a wide range of K values;and time requirements, centrifugal force requires minimal time for a large number ofmeasurements, subject to the saturatation state and permeability of the core.
2.3 Types of characterisation tests in a centrifuge20
Hydraulic characterisation tests in a centrifuge can be designed with no inflow, steadystate flow or transient flow (Table 1). In this context, steady state flow is defined asa constant rate of influent flow that is equivalent to effluent flow. By contrast, transientflow conditions occur when influent and effluent flow rates are not in equilibrium. Whileless complex instrumentation is required for steady state flow testing, centrifuge tech-25
niques based on transient flow, whether one or multiple steps (Nakajima and Stadler,2006), require specialised pressure transducers or tensiometers.
Selected examples of the various types of hydraulic characterisation tests are pro-vided in Table 1, with further information on the history and development of centrifugepermeameters for these various testing regimes are provided in Sects. 2.4 and 2.5.In contrast to this study of saturated K , no flow and/or transient types of centrifugetests are used to determine semi-saturated hydraulic parameters. For example, Naka-5
jima and Stadler (2006) used a 2 m radius centrifuge operating at multiple g-levels upto 40g for outflow tests to define hydraulic parameters of the van Genuchten modelfor fluid flow as a function of variable moisture content. This study on fine Ottawasand samples were tested in a cell of larger dimensions (102 mm diameter and upto 432 mm in height, base of sample at a radius of 1.85 m) and transient fluid pressure10
data, recorded at points along the sample length, were analysed by inverse modellingto resolve optimum hydraulic parameters.
A centrifuge permeameter, or column mounted on a centrifuge strong box, is com-monly used for hydraulic characterisation. A conceptual plan of a centrifuge permeame-ter is shown in Fig. 1. The centrifuge permeameter contains a cylindrical clay sample15
with length L and diameter D, and is spinning in a centrifuge around a central axis atan angular velocity ω. The permeameter has an inlet face at a radius r , and a drainageplate at a radius of r0. The co-ordinate z is defined as positive from the base of thesample towards the central axis of rotation, consistent with definitions in 1g columntesting (McCartney, 2010). This frame of reference is in an opposite direction to that20
defined by Nimmo and Mello (1991), but is convenient for interpretation and compari-son of column flow tests. In this study, the outlet face is a free drainage boundary asdiscussed further in Sects. 2.4, 3.2 and 5.4.
2.4 History of centrifuge permeameters
Centrifuge permeameter techniques have developed over the past two decades25
(Nimmo and Mello, 1991; Conca and Wright, 1998; McCartney, 2007; Timms, 2005) toenable fluid flow and contaminant transport studies of aquitard materials that would oth-erwise not be possible, or studies that would take significantly longer using 1g column
permeameter techniques. Early adaptions of relatively small bench-top centrifuge sys-tems meant that each core could be positioned between fluid filled chambers, witha falling head of ponded fluid above the core and an applied pore pressure at the lowercore boundary (Nimmo and Mello, 1991).
The Unsaturated Flow Apparatus (UFA) centrifuge system for saturated and unsatu-5
rated flow studies introduces influent through a sealed rotary union, with free drainageat the base of each core (Conca and Wright, 1998; Timms, 2003; Timms et al., 2009).However, the radius of this system (0.087 m effective to mid-core, or 0.117 m to baseof core) and relatively fast angular velocity results in significantly different g-levels andstresses along the length of the core. Furthermore, effective flow measurements are10
only possible by dissembling the core holder. In comparison, real time monitoring ofpore pressure has been proven as successful for larger centrifuge systems (McCart-ney, 2007).
The centrifuge equipment required for faster testing are a disadvantage towidespread adoption, particularly with advanced instrumentation and data transfer15
challenges within an accelerated gravity environment. Large geotechnical centrifuges(2 to10 m diameter) are costly to operate and require significant setup time and exper-tise, whereas the UFA centrifuge is efficient to operate though limited in sample sizeand the lack of space available to fit instrumentation on the beam for real time datacollection (Timms et al., 2003, 2009).20
2.5 NCGRT Broadbent centrifuge permeameter system
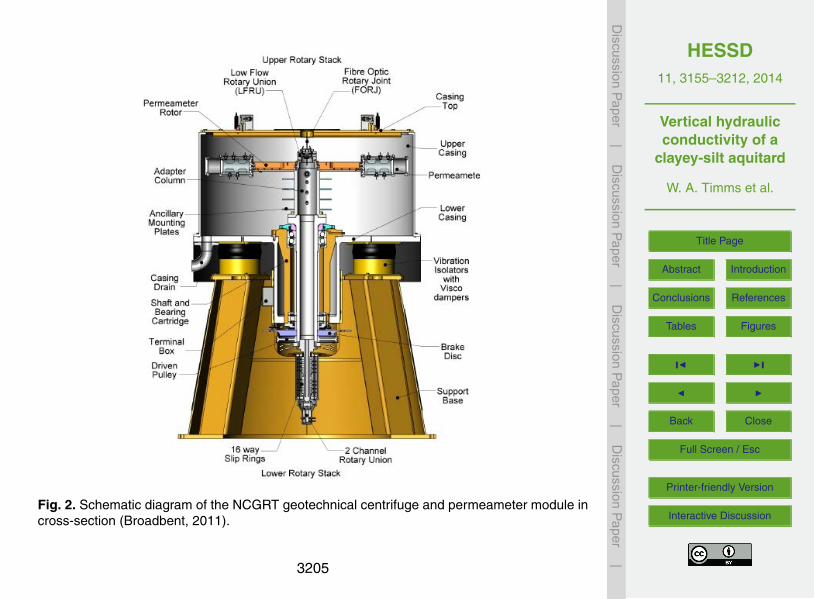
The centrifuge in this study (Fig. 2) is a Broadbent GT-18 Modular Geotechnical Cen-trifuge (22kW motor drives a variable speed of 10 to 875 RPM) on which two modulescan be fitted: either a centrifuge permeameter GMP GT2/0.65F or a geotechnical beamGMB GT6/0.75F. The geotechnical beam module is not discussed further in this study.25
The centrifuge permeameter (CP) module was designed specifically for groundwaterresearch while the base centrifuge and geotechnical beam module are standard. Ta-ble 2 describes the specifications and performance details of the centrifuge system
designed by Broadbent and the University of New South Wales. By contrast, the cen-trifuge permeameter modules on a similar centrifuge at the University of Texas, are ofsmaller diameter (McCartney, 2007).
The new permeameter permeameter system, including advanced influent and efflu-ent systems, enables relatively rapid and repeatable testing of large drill core (‘H’ or ‘C’5
core diameter 65 to 101 mm, length 30–200 mm), with realistic conditions. A low flowrotary union with a capacity of 0.1 to 100 mLmin−1 connects the influent lines A and Bto permeameters 1 and 2 without cross flow between the two influent lines. Unlike UFAcentrifuge systems, however, this flow union is not sealed, so the maximum head offluid within this centrifuge is the radial distance from the rotary union to the top of the10
sample (a distance of approximately 550 mm assuming a 100 mm length of core).Each centrifuge permeameter (CP) has a maximum sample capacity weight of
4.7 kg. In this system, at maximum centrifuge RPM a maximum of 556g applies atthe base of the core samples at a radius of 0.65 m from the centre of rotation. Therelatively large CP module allows on-board instrumentation and real-time monitoring15
of a range of parameters within a pair of permeameter bodies balanced at either endof the rotating beam. Since a maximum g-level of 471 applies at the centre of the sam-ple weight, the rating of this module is 2.2 g-ton (471×4.7/1000), a relatively smallgeotechnical centrifuge module (Zornberg and McCartney, 2010). The total weight ofeach of the pair of centrifuge permeameters when empty is 12.4 kg plus an allowance20
of 1.0 kg of effluent in the reservoir. Routine testing of low permeability porous media ispossible with a large cross-sectional flow area (100 mm diameter), influent pumps withvariable speed capable of low flow, and effluent detection systems. Weighting discs tosimulate stresses on cores of up to ∼ 2 MPa (at maximum RPM) have also been beendeveloped for consolidated samples that require testing at higher stress.25
Additional details on the current setup and instrumentation that has been developedfor characterisation of semi-consolidated cores in this geotechnical centrifuge are pro-vided in Sects. 5.2 to 5.5.
Intrinsic permeability and scaling issues must be considered prior to detailing calcula-tion methods in the following sections. Different combinations of Darcy’s Law and scal-ing relationships can be used depending on whether material and hydraulic characteri-5
sation or physical modelling is the study objective (Parkes et al., 2011), or geotechnicalevaluation where alternative scaling approaches are adopted (e.g. Singh and Gupta,2000; Nakajima and Stadler, 2006). Incorporating the scaling within the energy gradi-ent that drives flow, as is the approach in this study, is consistent with the fact that ifa pressure gradient was applied to a core sample under zero gravity conditions, the hy-10
draulic conductivity would remain equal to the coefficient of proportionality between theapplied gradient and the flow rate (Zornberg and McCartney, 2010; Taylor’s discussionin Tan and Scott, 1987). For physical modelling of processes such as soil liquefactionhowever, the scaling that is required for accelerated gravity experiments, could be moreappropriate within expressions of permeability or viscosity (Tan and Scott, 1987).15
Hydraulic conductivity as a function of intrinsic permeability (k), fluid viscosity andfluid density, is written as
K = kpwg/u (6)
where K is hydraulic conductivity (ms−1), pw is fluid density (kgm−3), u is fluid viscosity20
(Nsm−2 = kg s m) and k is intrinsic permeability (m2).However, in studies of relatively shallow and fresh groundwater systems, the fluid vis-
cosity and density are typically constant. In this study, for a shallow and aquitard con-taining relatively fresh groundwater, permeability refers to a permeability value that hasbeen derived from hydraulic conductivity assuming a fluid viscosity of 1.02×10⁻³ Pas25
and a fluid density of 1.0 gcm−3. Hydraulic conductivity values in this paper are for thesaturated state, with cores obtained from below the watertable, preserved and pre-pared as described in Sect. 5.
3.2 Steady state flow hydraulic conductivity measurement
The specific discharge of water (ν) along a groundwater streamline is calculated byDarcy’s Law based upon the gradient in total hydraulic head (∆h) measured over somedistance (∆L) as a function of the hydraulic conductivity proportionality constant, K :
v = −K ∂h∂L
(7)5
The negative sign is employed because flow is in the direction of decreasing water levelor water pressure head.
Hydraulic conductivity calculations for the centrifuge permeameter for this study werebased on ASTM D6527 (ASTM, 2008) and ASTM D7664 (ASTM, 2010) with a form10
of Darcy’s Law that incorporates the additional driving force within a centrifuge. TheASTM D6527 technique employs similar methods to a standard permeameter test inwhich the steady state hydraulic conductivity is calculated from the steady state specificdischarge through a sample with a free drainage surface for a given hydraulic gradient.Alternative formulations to calculate hydraulic conductivity for different experimental15
setups and assumptions are provided by a number of authors, such as Nimmo andMello (1991). For simplicity ASTM D5627 and ASTM D7664 calculate the solution tothe equation assuming that the gradient in the pressure head or matric potential (if partof the core is not fully saturated) is negligible when compared to the centrifuge inertialforce that is driving flow, i.e.:20
v = K
[ω2
g(r0 − z)
](8)
The proportionality term relating flow (which is constant at steady state) and K , is thegradient in the centrifuge elevation potential (Nimmo and Mello, 1991), or the gradientin centrifuge “elevation head” (Zornberg and McCartney, 2010) that is due to the cen-25
trifuge inertial force that drives flow in a direction away from the centre of rotation (or3169
in the opposite direction to z). ASTM D6527 states that for this assumption to hold,sufficiently high specific discharge and RPM is required. For the SSC-UFA centrifugepermeameter apparatus it is stated that RPM> 300 is required. For the NCGRT Broad-bent CP system, which spins samples at radial distance (to the base of core) of 0.65 mrather than 0.117 m, an RPM of 300 is equivalent to an RPM of 120 (N =9g).5
Given experimental parameters, ASTM D6527 expresses Eq. (8) as:
K=0.248Q
Armid(RPM)2(9)
where K is hydraulic conductivity (ms−1), Q is fluid flux (mLh−1), RPM isrevolutionsmin−1, A is sample flow area (cm2) and rmid is radial distance at the mid-10
point of the core sample (cm).It is noted that ASTM D7664 compares steady state centrifuge techniques with var-
ious column testing methods at 1g, with the optional addition of instrumentation tomeasure the pressure or suction gradient within the core during centrifuge testing. Thisstandard method, following the approach of Zornberg and McCartney (2010), indicates15
the calculated K is valid for the top third of the core if lower boundary conditions reducethe saturation state (moisture content). However, an added benefit of column testing ataccelerated gravity is that effects of boundary conditions are minimized. Furthermore,a ponded influent that maximise the infiltration rate at the top of the core, can be de-signed at a height above the top of the core to prevent loss of saturation along the core20
(Nimmo and Mello, 1991).
3.3 Fluid pressures and total stress
Fluid pressures and hydraulic gradient through the centrifuge core were determinedfollowing the approach of Nimmo and Mello (1991). A bulk density ρs, of 1.9 gcm−3
where P is total fluid pressure (kPa), ρw is the fluid density (gcm−3), r is the radiusof rotation (cm), and ω is the angular velocity (s−1). The total stress was determined5
through the centrifuge core following
S = ρs
r∫r0
rω2dr (11)
where S is total stress (kPa), ρs is the saturated core density (gcm−3), g is gravita-tional acceleration. The effective stress was calculated as the difference between total10
stress and fluid pressure. An increase in effective stress associated with decreasedfluid pressures near the base of the free draining core may cause consolidation of thecore matrix near the boundary.
The total stress applied to the core, relative to in situ stress, may affect the porosityof the core sample, depending on the stress history. In situ stress of the cores at the15
depth of sampling were estimated on the assumption that the overlaying formationswere fully saturated and of a similar density to the supplied core samples:
Sin situ = ρsdg (12)
where Sin situ is estimated stress of the sample under saturated in situ conditions (Pa),20
d is depth (mb.g.l. surface to the base of the core), g is standard gravity (ms−2) andρs is saturated density of core (kgm−3).
The driving forces for fluid flow, centrifugal force and hydraulic head gradient (sta-tionary centrifuge at 1g) were calculated at 0.005 m increments through the core. The
fluid flow potential due to the centrifuge (ω2r) and fluid head gradient (∆h/∆L) if thecore sample was at 1g were then compared as dimensionless numbers.
4 Study sites and sampling
4.1 Overview of study sites
Semi-consolidated sediment cores were obtained from three sites in the Australia’s5
Murray–Darling Basin, in the Upper Mooki subcatchment of the Namoi catchment(Fig. 3). Groundwater is extracted in this area for irrigation and town water supplies,with drawdowns of more than 10 m over 30 years. Due to the heterogeneity of mixedsediments, that were previously assumed to be homogenous, high permeability sed-iments, it can take years or decades for the impact of groundwater withdrawal to be10
transmitted through the sediments (Kelly et al., 2013). Core drilling was completed atthree research sites including Cattle Lane (CL), located south of the town of Caroona,the Breeza farm (BF) operated by the NSW Department of Primary Industries, south-east of Gunnedah, and Norman’s Road (NR), east-southeast of Gunnedah.
Clayey silt sediments at the Cattle Lane site are approximately 30 m thick (Timms15
and Acworth, 2005) and extend throughout the valley (Wiesner and Acworth, 1999), asshown by numerous CCPT (conductivity cone penetrometer) profiles. The porewatersalinity profile at the site, increasing from 10–30 m depth through the clay is consistentwith a diffusion dominated transport over thousands of years (Timms and Acworth,2006). The saturated zone fluctuates between the ground surface and approximately20
2 m depth in response to rainfall events, while water levels in the confined gravel aquiferat > 50 m depth display a delayed and dampened response to the same rainfall events.There is no groundwater extraction for irrigation from this aquifer in the vicinity of thesite, and the valley has had artificial drainage channels constructed to prevent pondingof surface water and soil salinization.25
Sediments at the Breeza farm and Norman’s Road site are relatively heterogeneous,with mixed sandy, clayey sand, and clayey-silt alluvium overlying a semi-confinedaquifer. The saturated zone is approximately 18 to 20 m below surface and extrac-tion for flood irrigation of crops causes large fluctuations in groundwater levels in theconfined aquifers at > 50 m depth. Hydrogeological and hydrochemical evidence indi-5
cate a leaky aquifer-aquitard system (Acworth and Timms, 2009), with the variability ingroundwater level responses controlled by a fining upward alluvial sequence (Guineaet al., 2014). At the Norman’s Road site, highly saline porewater in the clayey silt nearthe surface appear to have leached into the underlying aquifer, causing a significantincrease in salinity of the aquifer (Badenhop and Timms, 2012).10
4.2 Drilling and core sampling
Equipment and procedures for coring were compliant with AS 1289.1.1.3 to obtainsamples as undisturbed as possible. A rotary drilling rig equipped with Triefus triplecore barrels, lined with seamless clear PET, was used in push coring mode. Local creekwater was used as a drilling fluid and casing was used to stabilise the hole behind the15
push core barrel such that drilling fluid additives were not required. The holes weretherefore fully cased to the maximum depth of push core drilling at up to 40 mb.g.l.
The non-rotating core barrel was forced into the formation whilst a rotating device onthe outside of the tube removes the cuttings as the barrel was advanced. The cuttingedge of the non-rotating sample tube projects several millimetres beyond the rotary20
cutters. The thin walled core barrel complied with the standard for undisturbed sam-pling, with an area ratio of less than 25 % prescribed by AS 1289.1.1.3 for an opendrive sampler. The area ratio of 16 % was based on a core barrel design with an ex-ternal diameter of 110 mm and internal diameter of 101 mm (C size). The 1.5 m lengthcore barrel was a composite open sampling system with a core nose screwed on the25
base that included a bevelled end to cut the core as the barrel was pushed into theformation. After the core was extracted from the ground, an air supply was connected
to the top of the core barrel to slide the core out of the barrel whilst retained in the clearPET liner without rotation, distortion or compression.
The cores contained within PET liners in this minimally disturbed state were trans-ferred directly from the core barrels to a cool room on site, and thence to a laboratorycool room, reducing the potential for moisture loss. Semi-consolidated clay cores were5
selected from below the saturated zone for CP tests, at depths up to 40 mb.g.l. Sedi-ment core samples of lengths between 50–100 mm were prepared for CP testing.
The preferred method for preservation of drill core was double plastic bagging ofcore sections using a food vacuum sealer, and storage in a cool room at approximately4 ◦C. Alternatively, core within PET core barrel liners were trimmed of air or fluid filled10
excess liner immediately after drilling, sealed with plastic tape, and stored in a coolroom. Sections of cores, particularly at the nose end, that appeared to be damaged ordisturbed were excluded from permeability or bulk density testing.
After coring, the holes were completed as monitoring piezometers and the casingwas jacked out. The piezometers were constructed of screwed sections of 50 mm PVC15
casing with 0-ring seals, with a 1.5 m machine slotted screen packed with pea-sizedwashed gravel. The annulus was then filled with a bentonite seal, backfilled to thesurface and completed with a steel casing monument and cement monument pad.
4.3 Groundwater sampling for influent
Fluid for permeability testing (influent) should be taken from the formation at the same20
depth as the core, or if the limitations of sampling from aquitard strata preclude this, in-fluent water chemistry can be synthesized to approximate known ionic strength, Na/Caratio and pH of formation porewater. In this study, groundwater from piezometers ata similar depth to the core was obtained using standard groundwater quality samplingtechniques (Sundaram et al., 2009). A 240 V electric submersible pump (GRUNDFOS25
MP1) and a surface flow cell were used to obtain representative samples after purgingstagnant water to achieve constant field measurements of electrical conductivity andother parameters (unpublished data).
4.4 Site characterisation using electrical resistivity tomography
Electrical resistivity tomography indicates subsurface heterogeneity based on spatialvariability of bulk conductivity (Acworth, 1999). An ABEM terrameter LS was used withelectrodes in the ground at 5 m spacing over 240 m length transects. The depth of pen-etration was approximately 30 mb.g.l. The data was inverted using RES2DINV software5
(Loke, 2001) to provide a model of true resistivity. This paper focuses on a 2-D tomo-graph model from the CL site for comparison with in situ and laboratory permeabilitymethods.
5 Experimental setup and procedures
5.1 Core index testing and 1g column permeameter tests10
The moisture content and bulk density of cores was measured on the cores at the drillsite using methods adapted from AS (1991) methods AS 1289.2.1.1 and AS 1289.5.3.2respectively. Blind permeability tests were carried out by an independent laboratory,who adapted a constant/falling head method (AS 1289 6.7.3/5.1.1) with methods fromHead (1988). A sample diameter of 45.1 mm and length 61.83 mm was used, and15
a confining pressure of 150 kPa and back pressure of 50 kPa was applied, providinga vertical uniaxial stress of 100 kPa. The test time was 2500 to 6000 min (40 to 100 h).Deionised water was used as the influent.
5.2 Preparation of cores for centrifuge permeameter testing
Subsamples of cores for testing in the centrifuge permeameter were of the following20
dimensions: 100 mm diameter C size core, and a length of 50–100 mm. The CP iscapable of testing a maximum sample length of 200 mm. Two independent methodswere used to mount the porous samples in the liner, depending on the diameter of thecore and the degree of consolidation. For unconsolidated cores in this study, a core
extruder designed and built at UNSW was used to simultaneously trim and insert thecore directly from the PET drill core liners into the acrylic liner for testing. The claycore extruder specifications include 5 precision cutting blades for a 100 mm diametercut core and a motor drive piston. The resulting close fit of clay core within the linerensured that a self-seal was observed to form within minutes of introducing the influent5
solution. Leakage along the liner interface was readily identifiable by anomalous flowrate several orders of magnitude higher than the steady state flow Kv value. Basedon comparisons of flow rates through the drainage hole described in Sect. 5.4, theswelling that occurred to self-seal the core was estimated at < 0.02 % of the cross-sectional area of the core, equivalent to seal an annulus of ∼ 0.01 mm.10
Given the relatively shallow depth of these cores, and the semi-consolidated status,the maximum g-level in the centrifuge was limited to prevent structural changes in thecore matrix. To minimise changes in porosity during testing was similar to in situ, theg-level and the weight of ponded fluid on the cores were therefore designed to ensurethat total stress was less than estimated in situ stress at the depth from which the core15
was drilled. In addition to this procedure for seal-sealing cores, techniques describedby Bouzalakos et al. (2013) and Timms et al. (2014) are used to seal consolidated rockcore, alternative core sizes and geometries (e.g. half core cylinders) into these sameacrylic liners using resin and potting rings.
5.3 Preliminary core testing under vacuum20
To ensure that core was tested under saturated conditions, realistic of in situ condi-tions, drill core was adequately preserved, stored and set on a vacuum plate prior tocentrifuge testing. The preferred system for preservation of drill core was double plasticbagging of core sections using a food vacuum sealer, and storage in a cool room atapproximately 4 ◦C. Alternatively, core within PET core barrel liners were trimmed of air25
or fluid filled excess liner immediately after drilling, sealed with plastic tape, and storedin a cool room. Storage of cores in open core trays subjected to varying temperatureconditions was considered less than ideal.
A vacuum plate system for core samples was designed and used for two purposes:maximising the moisture content of samples and testing for rapid leaks of core samplesthat were prepared in acrylic liners in preparation for CP testing. The vacuum platedevice was designed to fit the CP liners containing the cores, drawing ponded influentfrom the top to the base of the cores using a standard laboratory vacuum pump at5
1 bar of negative pressure. After 12 to 48 h, or upon effluent flow from the base, theacrylic liners containing the prepared cores were then transferred directly to the CPmodule without disturbing the sample. Furthermore, the moisture content and degreeof saturation was monitoring by weight change of the permeameters during testing,and direct moisture tests of samples before and after CP testing.10
5.4 Centrifuge permeameter flow systems and instrumentation
In addition to the Broadbent CP module, some unique systems were developed as partof this study. Influent was fed from a pair of burettes located next to the centrifuge viaa pair of custom designed low voltage peristaltic pumps mounted either on the cen-trifuge beam, or outside the centrifuge and through the low flow rotary union described15
in Sect. 2.5. The peristaltic pumps can be operated either as zero/maximum flow toa set level, or at a variable flow rate of 0.001–150 mLh−1. Manual burette measure-ments to a resolution of 0.1 mL were used to verify the pump rates.
A PC with LABVIEW software is used for data logging and control of the influentpumping system, originally connected via an Ethernet Optic Rotary Joint (FORJ) that20
was subsequently replaced by a wireless system. A new data acquisition module (DAS)was designed and constructed with 7 data channels per module, including for influentlevel monitoring, pressure/load and temperature. A Zigbee based wireless hub wasfixed on the centrifuge beam for data transfer from the acquisition modules to a Zigbeewireless modem outside the centrifuge. Low voltage power to the DAS is transferred to25
the centrifuge beam via slip rings described by Broadbent (2011).Each permeameter assembly includes a newly designed reservoir insert (see Fig. 4a
and b) and employs a pair of custom designed carbon fibre rod electrical conductivity3177
(EC) electrodes to detect the influent reservoir head to an accuracy of 0.1 mm. Thehead of influent on the core is typically set to maintain a constant head of influent 20to 100 mm above the core sample by selection of electrodes of specific length andis therefore maintained at a constant head during K testing. The electrodes protrudethrough a pluviator cap into the influent reservoir and when the reservoir is depleted5
a decrease in EC is detected and transmitted back to the PC. The corresponding peri-staltic pump is then switched on to automatically pump fluid back into the reservoir.Carbon fibre rod (1 mm diameter) was selected as the electrode material due to itshigh tensile strength, low mass, high electrical conductivity and its resistance to corro-sion.10
The permeameter is also equipped with effluent reservoir capacity which is con-nected to the sample via a drainage plate. In order to allow homogenous flow of fluidfrom the sample surface into the effluent reservoir the drainage plate is lined withone 1 mm thick A14 Geofabrics Bidim geofabric filter (110 micron, and permeabilityof 33 ms−1; AS3706.9-01; Geofabrics, 2009) and one Whatman 5 Qualitative filter pa-15
per. The hydraulic conductivity of the drainage plate through a drainage hole of 2 mmdiameter was independently measured to ensure that there was no impedance to freedrainage. The average permeability > 10 tests of the drainage plate was ∼ 10−5 ms−1
(unpublished data), which is typically a factor of 1000 higher than low permeability coresamples.20
Effluent is extracted via a syringe or peristaltic pump through a “U” shaped tubethat connects to the base of the effluent reservoir (Fig. 4b). The concave dish baseof the effluent reservoir has a volume of ∼ 30 mL. This system, designed by UNSWspecifically for these studies, enables samples to be extracted without the need forthe permeameters to be taken off the beam, thereby alleviating safety risks in lifting25
heavy permeameters, and reduces the stop time required for a sampling event duringcentrifuge flight to less than 5 min.
An air vent, located at the top of the reservoir near the lower end of the drainageplate, connects the reservoir to the outside of the permeameter, thereby maintaining
a zero pressure outflow boundary. The free drainage boundary condition is differentfrom other centrifuge flow setups and is important for subsequent interpretation of flowprocesses during.
5.5 Centrifuge permeameter test operation
The K value is based on flow rate, flow area, radius and RPM, although the method5
was adapted from a UFA centrifuge to this CP system (Sect. 3.2). Importantly, bothtesting systems are for steady state flow with free drainage due to zero pressure at thebase of the core.
Two core samples were balanced to the nearest 100g and tested simultaneously ateither end of the centrifuge beam. The centrifuge permeameter was operated at 10g for10
20–30 min, and if no rapid flows due to leakage were detected, is gradually increasedto 20g, 40g and so on, until the maximum total stress on the core approaches theestimated in situ stresses of the material at its the depth in the formation from whichit was cored. It is also important to ensure that effective stress (Sect. 3.3) remains ac-ceptable, as dynamic fluid pressures during testing could cause consolidation of the15
core matrix, as discussed in Sect. 6.7. Influent volume was measured using both a cal-ibrated continuous time record of pump rotations, and manual burette measurements,and compared to effluent volume until a steady state flow of ±10 % change betweenmeasurements was achieved. Section 6.6 discusses the uncertainty of the measureddata in more detail.20
6 Results and discussion
6.1 Core index properties
Index properties for five representative cores are provided in Table 3, indicating thatthese cores were typically silty clay, confirmed by the D50 values of < 0.002 mm thatdifferentiates clay from silt, except for the sandy clay core. The dominance of silty over25
clay is an important characteristic of this formation, with clay mineralogy dominated bysmectite (Timms and Acworth, 2005; Acworth and Timms, 2009).
Moisture content varied from 24.7 to 36.4 % by weight, and was consistent withsite measured data on the core (unpublished data), although not all the cores werefully saturated as received by the external laboratory. Bulk density varied from 1.71 to5
1.88 gcm−3 and particle density from 2.47 to 2.58 gcm−3.
6.2 Centrifuge permeameter and 1g column tests of cores
The Kv of cores tested in the CP module (Table 4) varied from 3.5×10⁻⁷ to 1.0×10⁻⁹ ms−1 (n = 14). These results were generally higher than Kv results of 2×10⁻⁹ to4.9×10−11 ms−1 (n = 7), using column tests (Table 5) at 1g. Accelerations up to 80g10
were applied during CP testing of semi-consolidated sediment cores and were moretypically limited to 30–40g, with test times up to five times faster than by column testsat 1g. The possible reasons for the higher K results and reduced testing time for CPtesting compared with 1g column tests are considered in this section.
Figure 5 shows the measured influent and effluent rates during a typical CP test15
as the g-level is gradually increased, and the calculated Kv values. The g-levels weregradually stepped upwards to allow time for excess pore fluid pressures to equilibratethrough the core in a sequence that was designed to verify flow rate variability (10, 20,40, 60, 80 and back to 60g). Steady state flow (influent rate equal to effluent rate with nosignificant change over time) was achieved at ∼ 20 h, with some anomalous data ear-20
lier in the test (Fig. 5). However, a lower Kv value was observed over > 12 h overnight,then values measured over ∼ 1 h intervals during the day with frequent stops of severalminutes duration to measure the effluent volume, the later time interval measurementconsidered to be more realistic. Further experimentation and numerical modelling isrequired to adequately explain this discrepancy with may be associated with evapora-25
tive losses over longer time periods of flow measurement or other transient processeswithin the system.
Anomalous flow via preferential pathways could be readily identified by a flow rateseveral orders of magnitude greater than otherwise observed. Anomalous flow was of-ten observed along the interface of the cores and the liner during the early minutes ofa test as sealing occurred at steady state conditions were established. On one occa-sion, a failure occurred in the core during testing, with a preferential flow path occurring5
through the matrix, which at accelerated gravity causes very fast flow that is easily de-tected.Kv values for cores from the NR and BF sites were significantly more variable (over
10−9 to 10−7 ms−1) than for the CL site (within 10−9 ms−1). These findings reflect thegreater heterogeneity of alluvial sediments at the northern sites (NR and BF), com-10
pared with the clayey-silt deposit at the southern CL site. Based on the dataset cur-rently available for each site, there did not appear to be any significant Kv trend withdepth, except at the CL site, with a possible decrease of Kv by a factor of 3 with depthincreasing from 11 to 28 mb.g.l. Further testing is in progress to better identify anyspatially significant trends in Kv.15
Kv results obtained from the same CP from these three sites were generally higherthan Kv results from another alluvial system in the western Murray–Darling Basin (un-published data), and significantly higher than Kv for consolidated rock cores tested inthis system (Bouzalakos et al., 2013). At an undisclosed site in the western Murray–Darling Basin, the hydraulic conductivity of twelve (12) drill cores ranged from 1×10⁻¹¹
20
to 6×10⁻⁶ ms−1, while five (5) cores were ≤ 10−12 ms−1 (unpublished data). The rel-atively low g-levels, compared to rock core testing (Bouzalakos et al., 2013), werenecessary for the shallow and semi-consolidated nature of the clayey-silt cores. In fact,steady state flow was achieved at low g-levels for Kv values that were at least 100 timeshigher than the current detection limit of the CP system.25
The uncertainty of reporting results to two significant digits for Kv as low as10−9 ms−1 is further discussed in Sect. 6.6. In contrast, Kv results from an independentlaboratory were reported to 3 significant digits for the first batch of samples tested, and
1 significant digits for a subsequent batch of samples, although the range of Kv valueswere similar for both batches.
The reduced test times of CP testing may be attributed to the reduced time requiredto achieve steady state flow with centrifugal forces driving flow. Alternatively, the timerequired for 1g column testing may have increased due to fluid-solid interactions that5
reduced infiltration rates into the cores (10 to 100 lower Kv result for 1g column testscompared with CP tests). It is known that decreased ionic strength of influent (e.g.deionized water) causes a linear decrease in permeability, and that the relative con-centrations of sodium and calcium can affect permeability due to swelling and inter-layer interactions (e.g. Shackelford et al., 2010; Ahn and Jo, 2009). It is also possible10
that differences in K values from laboratory testing methods can also be attributed todifferences in test setup and stress changes that occur as discussed in Sect. 6.7. Thecentrifuge permeameter uses a larger core size (100 mm diameter) and groundwatersampled near the depth of the core, whereas the 1g column uses a small core diameter(45 mm diameter) and deionized water as an influent.15
CP testing was relatively rapid, with an average of less than 16 h (2 to 24 h) requiredfor steady state flow CP, compared with an average of 79 h (48 to 100 h) for 1g columntesting. In addition, an extended test of 830 h in the CP (unpublished data) verified thatno significant changes occurred over extended testing periods. The CP technique cantherefore reduce average testing time to ∼ 20 % of the time that would be required in20
1g laboratory testing systems, similar to the reduced time requirement of centrifugemethods for unsaturated hydraulic conductivity functions compared with 1g columntests ASTM (2010). The relative time advantage of testing cores at accelerated gravitymay be greater at lower Kv, due to the increased time required to establish steady stateflow conditions. This could be advantageous for longer experiments of contaminant25
transport that requires several pore volumes of steady state flow.
6.3 Validation of results with in situ Kv estimates
There is a general lack of in situ Kv measurements in this groundwater system. Therehave been no reported aquifer pump tests in the alluvial aquifer in this area, other thanobservations of the effects of irrigation bores over various spatial and temporal scales.
Vertical hydraulic conductivity (Kv) of the clayey-silt at the Cattle Lane site de-5
rived from observed amplitude and phase changes, resulted in an average value of2.8×10−9 ms−1 (Timms and Acworth, 2005). Five major rainfall events occurred dur-ing detailed pore pressure monitoring in five piezometers on an hourly or 6 hourly basisover four years. These data were verified and augmented by manual groundwater levelmeasurements. The phase lag at the base of the clay varied between 49 and 72 days.10
The phase lag pore pressure analysis resulted in a Kv value of 1.6×10⁻⁹ ms−1, whilethe change in amplitude over a vertical clay sequence of 18 m (from a 17 m depthpiezometer to the inferred base of the aquitard at 35 m depth) resulted in a Kv value of4.0×10−9 ms−1. The average value of Kv from these two estimates is 2.8×10⁻⁹ ms−1
which is possibly indicative at formation scale in this area, given the thick and extensive15
lateral extent as discussed below.The reliability of harmonic analysis related methods may be compromised by specific
storage measurements. Jiang et al. (2013) relied on indirect specific storage valuesderived from downhole sonic and density log data from boreholes in the region, whileTimms and Acworth (2005) calculated specific storage from barometric and loading20
responses that were recorded in the same groundwater level data set and boreholesthat were used for harmonic analysis.
With the advantage of robust estimates for specific storage in this study, the simi-larity of Kv measurements different scales at the CL site (Fig. 6) indicates that in thispart of the alluvial deposit, K is independent of the scale of measurement and that25
no hydraulically active fractures or vertical flowpaths affected the data. As discussedfurther in Sect. 6.8, this finding is consistent with work on argillaceous strata by Neuzil
(1994), but contrasts with evidence of scale dependant K values in other groundwatersystems.
Electrical resistivity tomography (Fig. 7) at the CL site confirmed the lateral extentof the relatively uniform formation in this area of the catchment. An electrical resistivitytomograph model indicated a homogenous layered system over a 240 m extent with5
resistivity increasing with depth to about 10 m depth, and then is relatively similar toa depth of about 30 m. This confirms a relatively uniform sediment in this area as foundby CPT profiling by Wiesner and Acworth (1999).
6.4 Comparison of results with regional Kv estimates
A regional groundwater flow model developed by McNeilage (2006) with a 2 layer MOD-10
FLOW code, determined the dominant source of recharge to be diffuse leakage throughthe soil (and aquitards) in the Breeza area (Zone 3 groundwater management area).As in typical modelling practice (Barnett et al., 2012), water the aquitard was not explic-itly modelled, with water instead transferred from a shallow to a deeper aquifer usinga vertical leakance value (units in dy−1), a model variable that is calculated for each15
cell of the model.The calibrated groundwater model indicated that approximately 70 % of the long term
average groundwater recharge (11 GLyr−1) was attributed to diffuse leakage in thisarea that included the CL and NR sites. This volume is equivalent to 20 mmyr−1, ora Kv of ∼ 6×10⁻¹⁰ ms−1 assuming a unit vertical hydraulic gradient over an area of20
approximately 500 km2. The actual Kv or leakance values were not reported. The cali-brated leakance values were found to vary over three orders of magnitude across theBreeza area, with relatively high values in isolated area in the south, centre and north.In comparison, the Kv results on clayey-silt cores appear to be higher, but with a similardegree of heterogeneity.25
6.5 Linear flow velocity at natural gradient and accelerated conditions
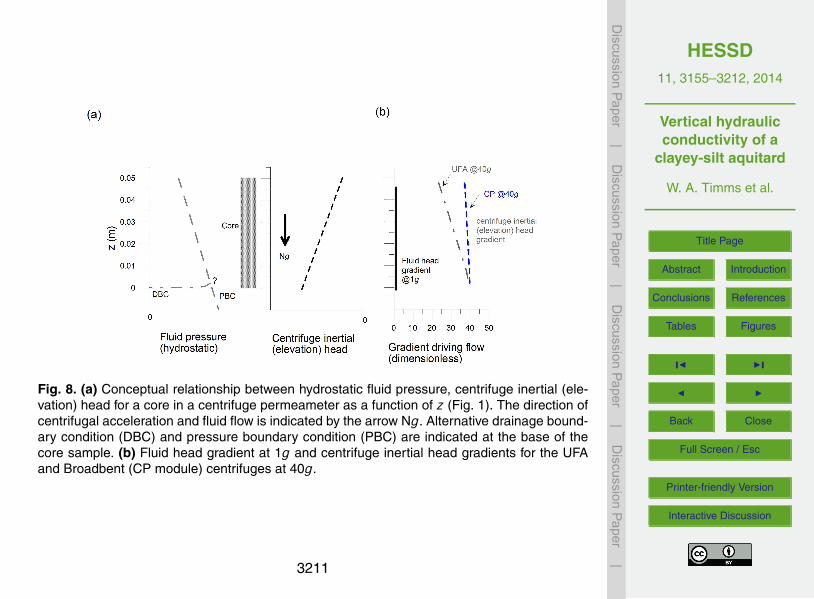
To determine if accelerated flow conditions are realistic for hydrogeological environ-ments, the linear flow velocity (apparent flow velocity corrected for porosity) for variousCP setups was compared with a theoretical unit gradient, and a typical vertical in situvertical hydraulic gradient. Figure 8 illustrates concepts for fluid flow at accelerated5
gravity. The hydrostatic fluid pressure (Eq. 9), measured at a radial position within thecore sample, increases with distance from the axis of rotation, continuing into a pres-sured reservoir boundary, or decreasing to zero at a free drainage boundary. By con-trast, the centrifuge inertial (elevation) head decreases with increasing distance fromthe axis of rotation, as also shown by Nimmo and Mello (1991) and McCartney (2007).10
It follows that the direction of fluid flow is outwards, in the opposite direction to theaxis of rotation. The gradients that drive flow are depicted in Fig. 8b, with the mostsignificant driving force due to centrifugal acceleration. The numerical analysis of fluidpressures that develop during flow and transition to new g-levels is beyond the scopeof the current study.15
In Table 6, an in situ hydraulic gradient of 0.5 is compared with CP setups for100 mm and 65 mm diameter cores of various lengths, for an aquitard material with Kv
of 10−8 ms−1. The vertical flow rate varies from 0.3 mLh−1 under in situ conditions, to8.5 mLh−1 in the CP, such that linear flow velocities remain very low 10−8 to 10−6 ms−1.The flow rate during centrifugation was N times greater than if a hydraulic gradient of20
1 was applied to the core samples at 1g. This increase in flow rate is consistent withscaling laws for physical modelling (Tan and Scott, 1987), and is greater than wouldoccur within aquitards where the vertical hydraulic gradient is typically less than one.An in situ vertical hydraulic gradient determined from measurements in piezometersthat are located above, below and within the aquitard sequence can provide hydraulic25
gradients that are typically higher than hydraulic gradients for lateral flow.Steady state flow Kv testing in the CP requires a relatively short testing time, as
described in Sect. 6.2, whereas for solute transport experiments, a longer experimental
time is required for several pore volumes (PV) of flow. For example, Timms and Hendry(2008) and Timms et al. (2009) describe continuous CP experiments over 90 daysto quantify reactive solute transport. The comparisons of time required for one PVprovided in Table 6 illustrate the possible advantages of CP for contaminant flow thatmay affect the structural integrity of the material.5
6.6 Limits and uncertainties of centrifuge permeameter testing
K values measured in this study are within the range of applicability of Darcy’s Law forlaminar flow at accelerated gravity. Flow of fluid through porous media at acceleratedgravity was found by Nimmo et al. (1987) to follow Darcy’s law for accelerations below1600g. The low end of K values that have been measured for geological specimens in10
the laboratory is 10−16 ms−1 (equivalent to approximately 10−11 Darcy, or 10−19 cm2) inthe UFA centrifuge (Conca and Wright, 1998). At accelerated gravity, steady state flowequilibrium is achieved in a time of hours and days, and in situ stresses can be appliedto drill core from approximately < 100 m depth or a total stress of approximately 1 MPain the Broadbent CP system (without weighting discs).15
Hydraulic conductivity data derived from experiments in the centrifuge permeameterinclude a component of measurement error. The quantified components of the mea-surement error are: limit of reading for time ±1 s; limit of reading for permeameter (totalmass) balance ±0.5g; limit of reading for high precision (outflow mass) balance ±0.1g;limit of reading for influent control burette ± 0.1 mL; accuracy of automatic influent con-20
trol system ±0.1 mL; accuracy of influent fluid level monitoring system ±0.2 mm; fluidheld by surface tension in effluent reservoir and on reservoir base plate < ±1.0 mL;evaporation from permeameter chambers < 0.3 mmd−1 (< 2.2 mLdy−1 at 875 RPM).
Sidewall leakage between the core-sample and wall of the permeameter, and anyresin that is required to set the core sample for testing has been quantified and is below25
the hydraulic conductivity detection limit. The current detection limit of the centrifugepermeameter ranges from 3×10⁻¹¹ to 1×10⁻¹² ms−1 and is controlled by evaporationwhich increases with increasing centripetal acceleration. For the low levels required
for semi-consolidated clay core, the detection limit was 1×10⁻¹² ms−1. For the exper-imental procedure followed for this study the above volumetric errors translate to anuncertainty in the measurement of K that is typically better than ±15 %.
6.7 Pore fluid pressure and stress conditions during centrifuge permeametertesting5
While the errors that may occur during measurement of K can be defined, whetheror not the K value is realistic of in situ conditions depends in part on the magnitudeof stress and any structural changes that occur within the core matrix. Considerationof stress regimes is particularly important for semi-consolidated core matrix, and forcompressive or swelling materials. In situ stresses can be simulated in both a CP test10
and 1g column test, depending on the core setup capabilities of the testing equipment,and testing design. At the low g-levels and stresses required for these relatively shallowsemi-consolidated cores, the stress conditions in both tests were similar.
Calculated pore fluid pressure and total stress are shown in Fig. 9 for a 50 mm lengthcore at 40g for the Broadbent CP module, based on Eqs. (9) and (10), in 0.005 m15
increments of radius. The effective stress, the difference between the total stress andpore fluid pressures, is evidently highest towards the base of the core, before the effectsof a free drainage base (zero pressure) occur within the core. At 40g, the total stressat the base of the core is 40 kPa, or 34 kPa plus 6 kPa of stress at the top of the coreassuming a fluid head of 20 mm ponded on the top of a 50 mm length of core. At 80g,20
the total stress at the base of the core is 74 kPa. This is significantly less than themaximum in situ stress for core samples listed in Table 4, calculated using Eq. (11).
During centrifuge testing, effective stress is maximum at the base of the free drainingcore, where fluid pressure is zero, and thus effective stress is equal to total stress underhydrostatic conditions (no flow). In both testing methods in this study, the total stress25
was less than estimated in situ stress, however the stress history of the core sampleand effective stress dynamics were uncertain. Considering that a stress is necessary
on top of the core to prevent swelling of the core, it appears that the stresses dur-ing these tests were likely within an acceptable range to minimise structural changesincluding swelling and consolidation. However, further attention on these processes,including instrumentation to measure fluid pressures and core matrix changes duringtesting is required in future studies.5
Figure 8b shows the water head gradient of 0.4 (at 1g) compared with the centrifuge“elevation head” gradient or centrifuge inertial force that drives fluid flow within thecentrifuge for both the Broadbent CP module and the UFA system at 40g. As describedin Sect. 4.2, the Broadbent CP module achieves a more constant g-level over the lengthof a 50 mm core than is possible in the smaller UFA system. The centrifuge elevation10
gradient driving flow is significantly greater than the water head gradient that wouldoccur at 1g, and is more uniform in the Broadbent CP module (37 to 40g) comparedwith the UFA system (23 to 40g), or a variation of 7 and 41 % respectively.
These findings confirm previous studies that noted the importance of centrifuge ex-perimental design to achieve linear stress and pressure gradients. Nakajim and Stadler15
(2006) found that non-linearity in pore pressure distribution was not significant wherethe ratio of radius and sample size (r/L) was large. In their study, the r/L ratio was8 (2.0/0.25). By this criteria it is noted that for the examples given here, the r/L ratioof 130 (0.65/0.005) in the Broadbent CP module is more favourable than for the UFAsetup where the r/L ratio of 22 (0.11/0.005). Timms et al. (2003) noted that accurate20
scaling of physical factors (eg length, time) in the UFA centrifuge was limited by differ-ing acceleration and stress experienced at the top and base of the core. A larger radiuscentrifuge operated at lower speeds minimises stress gradients within the core, thusminimising the possibility that variable stresses affect the structure of the core sample.
6.8 Benefits of core scale measurement of aquitard properties25
The natural variability within apparently homogeneous geological media is large(Schulze-Makuch et al., 1999). For example, Neuzil (1994) reported that for similarporosity, hydraulic conductivity commonly varies over three orders of magnitude. When
parameterising this variability in flow models, predictions of groundwater impacts fromaquifer interference activities can exhibit a significant degree of uncertainty. Core scalemeasurements of aquitard properties provide an opportunity to reduce this uncertaintyby providing a likely minimum value of matrix permeability if the cores are drilled, pre-served, prepared and tested in an appropriate manner as demonstrated in this study.5
For argillaceous strata permeability often does not increase with increasing physicalscale of testing at least at intermediate scale, indicating that permeability due to fractur-ing is absent (Neuzil, 1994). In the absence of direct measurement of aquitard perme-ability there is a real risk that aquitard parameters may be ignored or misrepresented inanalyses resulting in a corresponding under-prediction of vertical connectivity via pref-10
erential flow paths and/or over-prediction of aquifer storage and transmissivity. This isan especially important consideration in the analysis of aquifer tests that may not havebeen conducted for sufficient periods of time to identify distant boundary conditionsor the characteristic effects of aquitard leakage and/or storage (Neuman and Wither-spoon, 1968). In very low permeability strata however, there are practical limitations to15
pump tests and packer testing below about 10−8 ms−1, depending on the equipmentand the length of strata that is subject to testing. It is recognised that in many hetero-geneous systems that time lags for the propagation of drawdown responses throughan aquitard can be significant (Kelly et al., 2013).
Core scale measures of aquitard hydraulic conductivity are an integral component of20
hydrogeological studies concerning aquifer connectivity. The availability of core scalefacies measurements enables the up-scaling of bore log and geophysical data to deter-mine upper and lower hydraulic conductivity bounds for regionally up-scaled aquitardunits. Any differences between K values at various scale is important for indicating thepossibility of preferential flow through heterogeneous strata or aquitard defects (e.g.25
faults and fractures). The availability of these bounded estimates helps to constrainthe uncertainty analyses conducted on regional groundwater flow models to yield moreconfident predictions (Gerber and Howard, 2000).
Nevertheless, aquitards are typically excluded from regional groundwater flow mod-els, which rely on hydraulic resistance (leakance) values to transfer water verticallybetween aquifers (Barnett et al., 2012). However, such an approach is not capableof identifying rapid flow pathways through defects in the aquitards or the release ofstored water from an aquitard to an aquifer and cannot resolve the vertical hydraulic5
head distribution across the aquitard to verify drawdown responses. An aquitard shouldbe subdivided into at least three thinner layers to effectively model transient pressureresponses (Barnett et al., 2012). Rather than assigning constant theoretical valuesfor aquitard properties through these multiple layers, a combination of realistic andrapid laboratory measurement and direct in situ measurements may be considered10
where high risk activities demand improved confidence in conceptual understandingand model predictions.
7 Conclusions and further work
Accurate and reliable measurement of the vertical hydraulic conductivity of aquitardsis a critical concern for many applications. More realistic numerical flow models are15
possible to quantify the significance of transient drawdown, the associated release ofwater into adjacent aquifers over long time periods, and the possibility of preferentialflow. However, increasing the complexity of hydro-geochemical models cannot improveconfidence in the conceptual model if the original data on aquitard hydraulic propertiesis inaccurate or absent.20
Centrifuge technology can be a powerful tool for hydraulic and geotechnical char-acterization of low permeability sediments and rocks to augment site and regionalscale assessments. The lengthy time required to obtain realistic aquitard hydraulic datais substantially reduced by achieving hydraulic equilibrium under accelerated gravity.Value can be added to the cost of drilling if strata samples are drilled using coring25
methods with minimal disturbance, preserving the cores to prevent moisture loss, andappropriate preparation and testing of the cores as demonstrated in this study.
Core tests using formation water or groundwater as an influent with realistic stressescan provide a reliable minimum matrix scale value for evaluating the potential for ver-tical flow at a larger scale. Any differences between K values at various scale is im-portant for indicating the possibility of preferential flow through heterogeneous strataor aquitard defects (e.g. faults and fractures). Kv results in the order of 10−9 ms−1 were5
obtained in ∼ 20 % of the time required for 1g column permeameter tests. The Kv val-ues were successfully verified with independent in situ Kv values calculated from highfrequency pressure data changes within a thick, homogenous and laterally extensiveclayey-silt deposit. This provides confidence for contaminant transport experiments thatrequire several pore volumes of influent flow at steady state conditions, but would oth-10
erwise require implausibly lengthy testing periods without accelerated flow rates.Further studies are in progress in the CP to measure both Kv and Kh to assess
the anisotropy of core samples, to quantify the effect of deionized water and vary-ing influent chemistry on Kv, and to consider the significance of transient fluid pres-sure and changes in stress regimes during accelerated fluid flow in these porous me-15
dia. Additional instrumentation to monitor changes in moisture content and fluid pres-sure/suction within the core is required to examine the effects of desaturation on strataintegrity and hydraulic behaviour.
Acknowledgements. Funding from the Australian Research Council and National Water Com-mission, through the National Centre for Groundwater Research and Training Program 1B is20
gratefully acknowledged. The contributions of N. Baker and A. Ainsworth of Broadbent andSons, Hudersfield UK, are acknowledged and J. McCartney for helpful discussion on the theoryof fluid flow during centrifuge testing. We appreciated research support at the Breeza farm pro-vided by M. McLeod and S. Goodworth of the NSW Department of Primary Industries. Clayey-silt cores were drilled by New South Wales Office of Water, with S. McCulloch, H. Studhome25
and G. Regmi. Experimental testing was assisted at UNSW by A. Hartland, B. Bambrook,M. Aitkins, P. King, S. May and T. Meyers.
Acworth, R. I.: Investigation of dryland salinity using the electrical image method, Aust. J. SoilRes., 37, 623–636, 1999.
Acworth, R. I. and Timms, W.: Evidence for connected water processes through smectite-dominated clays at Breeza, New South Wales, Aust. J. Earth Sci., 56, 71–86, 2009.5
Ahn, H. S. and Young Jo, H. Y.: Influence of exchangeable cations on hydraulic conductivity ofcompacted bentonite, Appl. Clay Sci., 44, 144–150, 2009.
Arulanandan, K., Thompson, P. Y., Kutter, B. L., Meegoda, N. J., Muraleetharan, K. K.,and Yogachandran, C.: Centrifuge modeling of transport processes for pollutants in soils,J. Geotech. Eng.-ASCE, 114, 185–205, 1988.10
API: Recommended Practices for Core Analysis, Recommended Practice 40, 2nd Edn, Ameri-can Petroleum Institute Publishing Services, Washington, DC, 1998.
APLNG: Groundwater Assessment, Australia Pacific LNG Upstream Project Phase 1, Q-LNG01-15-TR-1801, Australia Pacific LNG, Milton, Queensland, Australia, 266 pp., 2013.
AS: Methods of Testing Soil for Engineering Purposes, Standard methods 1289 2.1.1; 5.1.1;15
5.3.2 and 6.7.3, Australian Standards, Sydney, 1991.AS: Sampling and Preparation of Soils – Undisturbed Samples – Standard Method 1289 1.3.1.
Australian Standards, Sydney, 1999.ASTM: Standard Test Method for Determining Unsaturated and Saturated Hydraulic Conductiv-
ity in Porous Media by Steady State Centrifugation, D 6527-08, American Society for Testing20
and Materials International, West Conshohocken, PA, United States, 2008.ASTM: Standard Test Method for Measurement of Hydraulic Conductivity of Unsaturated Soils,
D 7664-10, American Society for Testing and Materials International, West Conshohocken,PA, United States, 2010.
Badenhop, A. M. and Timms, W. A.: Long-Term Salinity Changes in an Inland Aquifer, NSW,25
Australia, in: Proceedings of the 34th Hydrology & Water Resources Symposium, EngineersAustralia, Sydney, NSW, 43–51, 19–22 November 2012.
Bambrook, B.: Aquitards and Groundwater Sustainability – Comparison of Geotechnical Cen-trifuge Tests and Computer Models, Unpublished Honours thesis, School of Civil and Envi-ronmental Engineering, University of New South Wales, 2011.30
Barnett, B., Townley, L. R., Post, V., Evans, R. E., Hunt, R. J., Peeters, L., Richardson, S.,Werner, A. D., Knapton, A., and Boronkay, A.: Australian Groundwater Modelling Guidelines,published by the National Water Commission, Australia, 2012.
Boldt-Leppin, B. E. J. and Hendry, J. M.: Application of harmonic analysis of water levels todetermine vertical hydraulic conductivities in clay-rich aquitards, Ground Water, 41, 514–5
522, 2003.Bouzalakos, S., Timms, W., Rahman, P., McGeeney, D., and Whelan, M.: Geotechnical cen-
trifuge permeater for characterizing the hydraulic integrity of partially saturated confiningstrata for CSG operations, in: Reliable Mine Water Technology, Vol. I, Proceedings of theInternational Mine Water Congress, Colorado School of Mines, 5–9 August 2013, edited10
by: Brown, A., Figueroa, L., and Wolkersdorfer, Ch., Publication Printers, Denver, Colorado,USA, 1193–1198, 2013.
Broadbent: Operating Manual for Modular Geotechnical Centrifuge with GT2/0.65 Permeame-ter and GT6/0.75 Beam Environments, Broadbent and Sons Ltd., Huddersfield, UK, 2011.
Cherry, J. A., Parker, B. L., Bradbury, K. R., Eaton, T. T., Gotkowitz, M. G., Hart, D. J., and15
Borchardt, M. A.: Role of Aquitards in the Protection of Aquifers from Contamination: a “Stateof the Science” Report, AWWA Research Foundation, Denver, CO, United States, 2004.
Conca, J. L. and Wright, J.: The UFA method for rapid, direct measurements of unsaturatedtransport properties in soil, sediment and rock, Aust. J. Soil Res., 36, 1–25, 1998.
Farley, C.: Aquitards and Groundwater Sustainability: Three-Dimensional Mapping of Aquitard20
Architecture, Unpublished Honours thesis, School of Civil and Environmental Engineering,University of New South Wales, 2011.
Garnier, J., Gaudin, C., Springman, S. M., Culligan, P. J., Goodings, D., Konig, D., Kutter, B.,Phillips, R., Randolph, M. F., and Thorel, L.: Catalogue of scaling laws and similitude ques-tions in geotechnical centrifuge modelling, International Journal of Physical Modelling in25
fabrics Australasia Pty Ltd, Melbourne, Australia, 2009.Gerber, R. E. and Howard, K.: Recharge through a regional till aquitard: three-dimensional flow
model water balance approach, Ground Water, 38, 410–422, 2000.30
Grisak, G. E. and Cherry, J. A.: Hydrologic characteristics and response of fractured till andclay confining a shallow aquifer, Can. Geotech. J., 12, 23–43, 1975.
Head, K. H.: Manual of Soil Laboratory Testing, Pentech Press, London, 1988.
Jiang, Z., Mariethoz, G., Taulis, M., and Cox, M.: Determination of vertical hydraulic conductivityof aquitards in a multilayered leaky system using water-level signals in adjacent aquifers,J. Hydrol., 500, 170–182, 2013.
Josh, M., Esteban, L., Delle Piane, C., Sarout, J., Dewhurst, D. N., and Clenell, M. B.:Laboratory characterisation of shale properties, J. Petrol. Sci. Eng., 88, 107–124,5
doi:10.1016/j.petrol.2012.01.023, 2012.Jougnot, D., Revil, A., Lu, N., and Wayllace, A.: Transport properties of the Callovo–
Oxfodrian clay rock under partially saturated conditions, Water Resour. Res., 46, W08514,doi:10.1029/2009WR008552, 2010.
Kelly, B. F. J., Timms, W. A., Andersen, S. M., Ludowici, K., Blakers, R., Badenhop, A.,10
McCallum, A. M., Rau, G. C., and Acworth, R. I.: Aquifer heterogeneity and re-sponse time: the challenge for groundwater management, Crop Pasture Sci., 64, 1141–1154,doi:10.1071/CP13084, 2013.
Loke, M. H.: Rapid 2-D and 3-D Resistivity and IP Inversion Using the Least Squares Method– RES2DINV Ver 3.4 Manual, available at: www.geoelectrical.com (last access: 18 January15
2014), 2001.McCartney, J. S.: Determination of the Hydraulic Characteristics of Unsaturated Soils Using
a Centrifuge Permeameter, Ph.D. thesis, The University of Texas at Austin, Faculty of theGraduate School, 2007.
McCartney, J. S. and Zornberg, J. G.: Centrifuge permeameter for unsaturated soils II: mea-20
surement of the hydraulic characteristics of an unsaturated clay, J. Geotech. Geoenviron.,136, 1064–1076, 2010.
McNeilage, C.: Upper Namoi Groundwater Flow Model, NSW Department of Natural Re-sources, New South Wales, Parramatta, 2006.
Nakajima, H. and Stadler, A. T.: Centrifuge modeling of one-step outflow tests for unsatu-25
Neuzil, C. E.: How permeable are clays and shales?, Water Resour. Res., 30, 145–150, 1994.Nimmo, J. R. and Mello, K. A.: Centrifugal techniques for measuring saturated hydraulic con-
ductivity, Water Resour. Res., 27, 1263–1269, 1991.Nimmo, J. R., Rubin, J., and Hammermeister, D. P.: Unsaturated flow in a centrifugal field:
measurement of hydraulic conductivity and testing of Darcy’s Law, Water Resour. Res., 23,5
124–134, 1987.Parks, J., Stewart, M., and McCartney, J. S.: Validation of a centrifuge permeameter for inves-
tigation of transient infiltration and drainage flow processes in unsaturated soils, Geotech.Test. J., 35, Paper ID: GTJ103625, doi:10.1520/GTJ103625, 2012.
Potter, P. E., Maynard, J. B., and Pryor, W. A.: Sedimentology of Shale – Study Guide and10
Reference Source, Springer-Verlag, New York, 1980.Rowe, R. K., Quigley, R. M., and Booker, J. R.: Clayey Barrier Systems for Waste Disposal
Facilities, E & FN Spon, London, 1995.Schulze-Makuch, D., Carlson, D. A., Cherkauer, D. S., and Malik, P.: Scale Dependency of
hydraulic conductivity in heterogeneous media, Ground Water, 37, 904–919, 1999.15
Shackelford, C. D., Sevick, G. W., and Eykholt, G. R.: Hydraulic conductivity of geosyntheticclay liners to tailings impoundment solutions, Geotext. Geomembranes, 28, 149–162, 2010.
Šimůnek, J. and Nimmo, J.: Estimating soil hydraulic parameters from transient flow experi-ments in a centrifuge using parameter optimization technique, Water Resour. Res., 41, 1–9,2005.20
Singh, D. N. and Gupta, A. K.: Modelling hydraulic conductivity in a small centrifuge, Can.Geotech. J. 37, 1150–1155, 2000.
Smith, L. A., van der Kamp, G., and Hendry, M. J.: A new technique for obtaining high-resolutionpore pressure records in thick claystone aquitards and its use to determine in situ compress-ibility, Water Resour. Res., 9, 732–743, 2013.25
Sundaram, B., Feitz, A., de Caritat, P., Plazinska, A., Brodie, R., Coram, J., and Ransley, T.:Groundwater Sampling and Analysis – a Field Guide, Geoscience Australia, Record 2009/27,95 pp., 2009.
Tan, T. S. and Scott, R. F.: Centrifuge scaling considerations for fluid–particle systems: discus-sion by R. N. Taylor and response, Geotechnique, 37, 131–133, 1987.30
Timms, W. and Acworth, R. I.: Propagation of porewater pressure change through thick claysequences: an example from the Yarramanbah site, Liverpool Plains, New South Wales,Hydrogeol. J., 13, 858–870, doi:10.1007/s10040-005-0436-7, 2005.
Timms, W. and Acworth, R. I.: Rethinking a Conceptual Model: Advective vs. Diffusive Chlo-ride Flux in a Low Permeability Clay Sequence, International Association of HydrogeologistsCongress on Aquifer Systems Management, Dijon, France, 30 May–1 June, 2006.
Timms, W. A. and Hendry, M. J.: Long term reactive solute transport in an aquitard using a cen-trifuge model, Ground Water, 46, 616–628, doi:10.1111/j.1745-6584.2008.00441.x, 2008.5
Timms, W. A., Hendry, M. J., Sharma, J., and Cooper, C: Application of centrifuge modelling toassess long-term brine migration in thick clay tills, Saskatchewan, Canada, in: Proceedingsof Water in Mining, Australian Institute of Mining and Metallurgy (AusIMM), Brisbane, 13–15 October 2003, 2003.
Timms, W., Hendry, J., Muise, J., and Kerrich, R.: Coupling centrifuge modeling and laser abla-10
tion ICP-MS to determine contaminant retardation in clays, Environ. Sci. Technol., 43, 1153–1159, 2009.
Timms, W., Acworth, I., Hartland, A., and Laurence, D.: Leading practices for assessing theintegrity of confining strata: application to mining and coal seam gas extraction, in: Interna-tional Water and Mining Association Symposium Proceedings, Bunbury, Western Australia,15
29 September to 4 October 2012, edited by: Clint, D., McCullough, C. D., Lund, M. A., andWyse, L., 139–148, 2008.
Timms, W., Whelan, M., Acworth, I., McGeeney, D., Bouzalakos, S., Crane, R., McCartney, J.,and Hartland, A.: A novel centrifuge permeameter to characterize flow through low perme-ability strata, in: Proceedings of International Congress on Physical Modelling in Geotechnics20
(ICPMG), Perth, Balkema, 14–17 January, 2014.US EPA: Requirement for Hazardous Waste Landfill Design, Construction and Closure,
EPA/625/4-89/022, US Environmental Protection Agency, Cincinnati, OH, United Sates,1989.
Van der Kamp, G.: Methods for determining the in situ hydraulic conductivity of shallow25
aquitards – an overview, J. Hydrol., 9, 5–6, 2001.Van der Kamp, G.: Determining the hydraulic properties of aquitards, in: 2nd Canadian Sympo-
sium on Aquitard Hydrogeology, University of Ottawa, Canada, 21–23 June, 2011.Wiesner, T. and Acworth, R. I.: Groundwater Contamination Investigation Using CCPTs, Water
Wright, M., Dillon, P., Pavelic, P., Peter, P., and Nefiodovas, A.: Measurement of 3-D hydraulicconductivity in aquifer cores at in situ effective stress, Ground Water, 40, 509–517, 2002.
Zornberg, J. G. and McCartney, J. S.: Centrifuge permeameter for unsaturated soils. I: The-oretical basis and experimental developments, J. Geotech. Geoenviron., 136, 1051–1063,2010.
Znidarčić, D., Miller, R., van Zyl, D., Fredlund, M., and Wells, S.: Consolidation testing of oil sandfine tailings, in: Proceedings Tailings and Mine Waste 2011, Vancouver, BC, 6–9 November,5
Table 4. Kv results from CP tests indicating g-level maximum and testing time. The influentsource column identifies the site (NR, CL, BF) and depth (P20 is piezometer screen at 20 mdepth) of groundwater sampling. Calculations were based on Eq. (9) for Kv and Eq. (11) for insitu stress.
Site TestID
Depth(mb.g.l.)
Kv (ms−1) g-levelmaximum
Estimated in situstress (kPa)
Testingtime (h)
Influentsource
NR 5-1 33.8 4×10⁻⁹ 10 615 ∼ 144 NR P30NR 5-2 33.9 2×10⁻⁹ 10 615 ∼ 144 NR P30NR 37-1 34.68 2.4×10⁻⁷ 10 646 2.6 NR P30
Fig. 3. Location of study sites in Eastern Australia, state of NSW. The Norman’s Road, BreezaFarm and Cattle Lane sites are shown within the Namoi catchment.
Fig. 4. Cross section of the (a) centrifuge permeameter and beam showing new reservoir andreference points and (b) detail of new reservoir liner with suction extraction port.
Fig. 5. Centrifuge permeameter testing at low stresses of a semi-consolidated clayey-silt coresample (CL 26.1 m depth, Test 39-1) showing variation of g-level, Kv and influent and effluentflow rate during the test (after Timms et al., 2014).
Fig. 6. Vertical hydraulic conductivity measurements by centrifuge permeameter, column per-meameter. These data are compared with in situ pore pressure data at 6 hourly intervals over5 years interpreted with harmonic analysis (after Timms and Acworth, 2005) for the Cattle Lanesite with massive clayey-silt from the surface to 35 m depth.
Fig. 7. Electrical resistivity tomography of the Cattle Lane site including a photograph andschematic of the site. Lateral homogeneity of the subsurface alluvium over at least 240 metresis indicated.
Fig. 8. (a) Conceptual relationship between hydrostatic fluid pressure, centrifuge inertial (ele-vation) head for a core in a centrifuge permeameter as a function of z (Fig. 1). The direction ofcentrifugal acceleration and fluid flow is indicated by the arrow Ng. Alternative drainage bound-ary condition (DBC) and pressure boundary condition (PBC) are indicated at the base of thecore sample. (b) Fluid head gradient at 1g and centrifuge inertial head gradients for the UFAand Broadbent (CP module) centrifuges at 40g.
Fig. 9. Fluid head pressure (hydrostatic), total stress and effective stress (difference betweentotal stress and effective stress) at 40g in this study.