Function of a Fly Motion-Sensitive Neuron Matches Eye Movements during Free Flight Roland Kern 1* , J. H. van Hateren 2 , Christian Michaelis 1 , Jens Peter Lindemann 1 , Martin Egelhaaf 1 1 Department of Neurobiology, Faculty for Biology, Bielefeld University, Bielefeld, Germany, 2 Department of Neurobiophysics, University of Groningen, The Netherlands Sensing is often implicitly assumed to be the passive acquisition of information. However, part of the sensory information is generated actively when animals move. For instance, humans shift their gaze actively in a sequence of saccades towards interesting locations in a scene. Likewise, many insects shift their gaze by saccadic turns of body and head, keeping their gaze fixed between saccades. Here we employ a novel panoramic virtual reality stimulator and show that motion computation in a blowfly visual interneuron is tuned to make efficient use of the characteristic dynamics of retinal image flow. The neuron is able to extract information about the spatial layout of the environment by utilizing intervals of stable vision resulting from the saccadic viewing strategy. The extraction is possible because the retinal image flow evoked by translation, containing information about object distances, is confined to low frequencies. This flow component can be derived from the total optic flow between saccades because the residual intersaccadic head rotations are small and encoded at higher frequencies. Information about the spatial layout of the environment can thus be extracted by the neuron in a computationally parsimonious way. These results on neuronal function based on naturalistic, behaviourally generated optic flow are in stark contrast to conclusions based on conventional visual stimuli that the neuron primarily represents a detector for yaw rotations of the animal. Citation: Kern R, van Hateren JH, Michaelis C, Lindemann JP, Egelhaaf M (2005) Function of a fly motion-sensitive neuron matches eye movements during free flight. PLoS Biol 3(6): e171. Introduction In moving animals, retinal image flow differs from conven- tional visual stimuli used in the laboratory, by its character- istic dynamics that are largely determined by the animals’ own actions and reactions. For instance, the retinal image flow on the eyes of humans steering a car, is determined by the direction and speed of the car, but also by the body, head, and eye movements of the driver. In particular, the eyes are rotated actively in a sequence of saccades towards interesting locations in the scene (review [1]). Many insects, such as blowflies, employ a similar saccadic viewing strategy (review [2]). They shift their gaze during free flight by saccadic turns of body and head, keeping gaze basically fixed between saccades [3–5]. This active viewing strategy generates retinal image flow with characteristic dynamical features and separates to a large extent the image flow resulting from rotational and translational movements of the animal. Because the rotational optic flow component does not depend on the distance between the eyes and environmental objects, whereas the translational flow component does, the saccadic flight strategy may help the nervous system to extract information about the spatial layout of the environ- ment. So far, it is not clear to what extent neuronal processing matches the specific properties of the retinal image flow during natural behaviour and thus may be appropriate for gathering environmental information. It is possible that the mechanisms of neuronal information processing are specifically adapted to efficiently utilize image flow under behaviourally relevant conditions. This hypothesis is tested here by analysing the performance of an identified motion-sensitive neuron in the blowfly under stimulus conditions that approximate natural situations. To circumvent the problems of recording neuronal responses in freely moving animals we took advantage of recent technological developments: In the blowfly, a model system for visual motion computation [6,7], body and even head movements were recorded during free flight [5,8]. The resulting behaviourally generated retinal image flow was reconstructed (Video S1) and replayed to blowflies with a panoramic visual stimulator that is sufficiently fast to show visual stimuli as experienced even during rapid saccadic turns [9]. During replay the activity of the so-called horizontal system equatorial cell (HSE) [10,11] was recorded intra- cellularly. HSE is a major output neuron of the visual system and belongs to an identified set of motion-sensitive neurons present in both the left and right third visual neuropil of the blowfly brain. These neurons are believed to extract parameters of self-motion from the optic flow field [10–12]. HSE responds in a directionally selective manner to visual wide-field motion; because of its input from many local motion-sensitive elements, it is depolarised by front-to-back motion in the ipsilateral visual field and hyperpolarised during motion in the reverse direction [6]. The graded depolarisations, although superimposed by spikes of variable amplitude, are still quite pronounced in the axon terminal of the cell [10,11,13] (Figure 1A). Such depolarisations were Received January 10, 2005; Accepted March 14, 2005; Published May 17, 2005 DOI: 10.1371/journal.pbio.0030171 Copyright: Ó 2005 Kern et al. This is an open-access article distributed under the terms of the Creative Commons Attribution License, which permits unrestricted use, distribution, and reproduction in any medium, provided the original work is properly cited. Abbreviations: HSE, horizontal system equatorial cell; OR, only rotation; OT, only translation; SEM, standard error of the mean Academic Editor: Mandyam V. Srinivasan, Australian National University, Australia *To whom correspondence should be addressed. E-mail: roland.kern@uni-bielefeld. de PLoS Biology | www.plosbiology.org June 2005 | Volume 3 | Issue 6 | e171 1130 Open access, freely available online P L o S BIOLOGY
Transcript
Function of a Fly Motion-Sensitive NeuronMatches Eye Movements during Free FlightRoland Kern1*, J. H. van Hateren2, Christian Michaelis1, Jens Peter Lindemann1, Martin Egelhaaf1
1 Department of Neurobiology, Faculty for Biology, Bielefeld University, Bielefeld, Germany, 2 Department of Neurobiophysics, University of Groningen, The Netherlands
Sensing is often implicitly assumed to be the passive acquisition of information. However, part of the sensoryinformation is generated actively when animals move. For instance, humans shift their gaze actively in a sequence ofsaccades towards interesting locations in a scene. Likewise, many insects shift their gaze by saccadic turns of body andhead, keeping their gaze fixed between saccades. Here we employ a novel panoramic virtual reality stimulator andshow that motion computation in a blowfly visual interneuron is tuned to make efficient use of the characteristicdynamics of retinal image flow. The neuron is able to extract information about the spatial layout of the environmentby utilizing intervals of stable vision resulting from the saccadic viewing strategy. The extraction is possible becausethe retinal image flow evoked by translation, containing information about object distances, is confined to lowfrequencies. This flow component can be derived from the total optic flow between saccades because the residualintersaccadic head rotations are small and encoded at higher frequencies. Information about the spatial layout of theenvironment can thus be extracted by the neuron in a computationally parsimonious way. These results on neuronalfunction based on naturalistic, behaviourally generated optic flow are in stark contrast to conclusions based onconventional visual stimuli that the neuron primarily represents a detector for yaw rotations of the animal.
Citation: Kern R, van Hateren JH, Michaelis C, Lindemann JP, Egelhaaf M (2005) Function of a fly motion-sensitive neuron matches eye movements during free flight. PLoSBiol 3(6): e171.
Introduction
In moving animals, retinal image flow differs from conven-tional visual stimuli used in the laboratory, by its character-istic dynamics that are largely determined by the animals’own actions and reactions. For instance, the retinal imageflow on the eyes of humans steering a car, is determined bythe direction and speed of the car, but also by the body, head,and eye movements of the driver. In particular, the eyes arerotated actively in a sequence of saccades towards interestinglocations in the scene (review [1]). Many insects, such asblowflies, employ a similar saccadic viewing strategy (review[2]). They shift their gaze during free flight by saccadic turnsof body and head, keeping gaze basically fixed betweensaccades [3–5]. This active viewing strategy generates retinalimage flow with characteristic dynamical features andseparates to a large extent the image flow resulting fromrotational and translational movements of the animal.Because the rotational optic flow component does notdepend on the distance between the eyes and environmentalobjects, whereas the translational flow component does, thesaccadic flight strategy may help the nervous system toextract information about the spatial layout of the environ-ment. So far, it is not clear to what extent neuronalprocessing matches the specific properties of the retinalimage flow during natural behaviour and thus may beappropriate for gathering environmental information. It ispossible that the mechanisms of neuronal informationprocessing are specifically adapted to efficiently utilize imageflow under behaviourally relevant conditions. This hypothesisis tested here by analysing the performance of an identifiedmotion-sensitive neuron in the blowfly under stimulusconditions that approximate natural situations.
To circumvent the problems of recording neuronalresponses in freely moving animals we took advantage of
recent technological developments: In the blowfly, a modelsystem for visual motion computation [6,7], body and evenhead movements were recorded during free flight [5,8]. Theresulting behaviourally generated retinal image flow wasreconstructed (Video S1) and replayed to blowflies with apanoramic visual stimulator that is sufficiently fast to showvisual stimuli as experienced even during rapid saccadic turns[9]. During replay the activity of the so-called horizontalsystem equatorial cell (HSE) [10,11] was recorded intra-cellularly.HSE is a major output neuron of the visual system and
belongs to an identified set of motion-sensitive neuronspresent in both the left and right third visual neuropil of theblowfly brain. These neurons are believed to extractparameters of self-motion from the optic flow field [10–12].HSE responds in a directionally selective manner to visualwide-field motion; because of its input from many localmotion-sensitive elements, it is depolarised by front-to-backmotion in the ipsilateral visual field and hyperpolarisedduring motion in the reverse direction [6]. The gradeddepolarisations, although superimposed by spikes of variableamplitude, are still quite pronounced in the axon terminal ofthe cell [10,11,13] (Figure 1A). Such depolarisations were
Received January 10, 2005; Accepted March 14, 2005; Published May 17, 2005DOI: 10.1371/journal.pbio.0030171
Copyright: ! 2005 Kern et al. This is an open-access article distributed underthe terms of the Creative Commons Attribution License, which permitsunrestricted use, distribution, and reproduction in any medium, provided theoriginal work is properly cited.
Abbreviations: HSE, horizontal system equatorial cell; OR, only rotation; OT, onlytranslation; SEM, standard error of the mean
Academic Editor: Mandyam V. Srinivasan, Australian National University, Australia
*To whom correspondence should be addressed. E-mail: [email protected]
shown in other motion-sensitive neurons with the same typeof mixed response to be transmitted to postsynaptic cells [14].Because HSE also receives excitatory input from thecontralateral eye during back-to-front motion via theidentified H1 and H2 neurons, previous studies usingconventional experimenter-defined stimuli concluded thatits main functional role is to encode rotations around thevertical axis of the head (yaw). In addition, HSE also respondsto binocular front-to-back motion [10,12,15], as occurs duringforward flight.Responses to behaviourally generated optic flow, however,
cast doubt on the presumed role of HSE. We provideevidence that HSE, rather than primarily representing adetector for yaw rotations of the animal, also encodesinformation about sideward translational optic flow. Thisfeature could be significant from a functional point of viewbecause only optic flow induced by translatory motion, butnot by rotatory motion, contains information about thespatial layout of the environment. The animal’s saccadic flightstyle is concluded to produce a match of the dynamicalproperties of retinal image flow with the visual motionpathway of the blowfly.
Results
The velocity profile of yaw rotations reflects the blowfly’ssaccadic flight style: The fly executes a series of saccadic turnsin which the head shows peaks in yaw velocity approachingseveral thousand degrees per second (Figure 1B and 1C).Between saccades the gaze is kept basically stable and theresulting optic flow is much smaller than during saccades(Figure 1C). Figure 1D shows a recording from an HSE cell ofa blowfly watching a movie, played back on the panoramicstimulator, consisting of the image flow experienced byanother blowfly during the flight of Figure 1B. For most of thetime during this stimulus, the HSE cell was depolarisedrelative to its resting potential. This depolarisation wasinterrupted by brief hyperpolarisations during saccadesevoking null-direction motion (‘‘null-direction saccades’’)(Figure 1D and 1E, blue lines; Figure 1F, red trace). Incontrast to expectations from responses to conventionalstimuli, HSE did not consistently depolarise during saccadesleading to preferred-direction motion (‘‘preferred-directionsaccades’’), but often showed a slight response dip (negative-going response) relative to the ongoing depolarisation level(Figure 1D and 1E, red lines; Figure 1F, black trace). Similarresponse profiles were obtained for all ten behaviourallygenerated motion sequences that were tested. Hence, we mayconclude that the overall depolarisation of HSE is not evokedby preferred-direction saccades, but by optic flow betweensaccades.This finding was surprising because the strongest optic flow
Figure 1. Response Characteristics of HSE under Various StimulusConditions
(A) Individual response of the right HSE to rightward (preferred-direction [PD]) and leftward (null-direction [ND]) rotation of avertical sinusoidal grating (wavelength 20 deg, velocity 40 deg/s,contrast 0.98, azimuth 6120 deg, elevation 650 deg).(B) Downward view of a flight trajectory (dotted line), with headposition and orientation shown every 50 ms (time colour coded: start,red; finish, green).(C) Head yaw velocity (black) and total optic flow (green) during theflight shown in (B). Positive velocities denote leftward turns, PD forthe right HSE.(D) Membrane potential of a right HSE in response to the flightshown in (B).(E) Average membrane potential of the right HSE as determinedacross trials; the entire responses including spikes were taken intoaccount (N = 6 cells, n = 17 responses).(F) Saccade-triggered averages, calculated from the mean responses(N = 6, one to four repetitions) of right and left HSE to two
trajectories for PD (black) and ND (red) saccades (63 differentsaccades). Vertical line denotes time of saccade peak velocity.(G) Same as (E), but with rotations only (position of fly fixed in centreof cage; N = 6, n = 11). Broken lines denote resting potential; red orblue vertical lines indicate peak times of PD or ND saccades,respectively. Signals in (D), (E), and (G) are shifted backwards by 22.5ms to account for response latencies; this value was determined bycross-correlation of the yaw velocity and the corresponding responsetraces. Signals in (E) and (G) are low-pass filtered (with a Gaussianstandard deviation of 3 ms).DOI: 10.1371/journal.pbio.0030171.g001
in the cell’s preferred direction was generated duringpreferred-direction saccades rather than between saccades.The possibility that the angular velocities during saccadeswere too large to be perceived by the motion vision systemcan be excluded. When the neuron was stimulated exclusivelywith the original rotations without any superimposed trans-lation, thereby mimicking a situation in which the environ-mental structures were at an infinite distance (Figure 1G),pronounced depolarising response peaks during preferred-direction saccades occurred. From the considerable differ-ence between the responses of Figure 1E and 1G, it followsthat the translational optic flow component has a majorimpact on the neuronal response profile, even though thetranslational component is much smaller than the rotationalcomponent evoked by saccades. Because blowflies keep theirgaze stable between saccades, apart from small-amplitude,broad-band yaw rotations (Figures 1C, 2A, and 2B), they maygather useful information about the spatial layout of theoutside world from the translational optic flow componentsthat dominate at low frequencies in intersaccadic intervals.
To test this hypothesis, we analysed the intersaccadic-response segments by masking the saccadic segments ofstimulus and response. Masks were obtained by gating aregion surrounding each saccade that was large enough toinclude all parts of both saccadic stimulus and correspondingresponse (for details see Materials and Methods). To establishwhether single HSE responses provide the animal withinformation on its self-motion parameters that could beaccessed by simple filtering operations, we determined theoptimal linear filters by estimating these parameters from theresponses. The similarity between estimated and original self-motion parameters was quantified by the coherence thatvaries between zero (i.e., both signals are unrelated) and one(i.e., perfect reconstruction). Whereas the coherence of theintersaccadic yaw velocity and the neuronal response wassignificant only between approximately 20 Hz and 60 Hz,there was considerable coherence between sideward velocityand the neuronal responses at low frequencies (Figure 3A,results from ten flights and five HSE neurons). Surprisingly,the coherence was much smaller for the forward velocityalthough HSE responds well to constant-velocity front-to-back motion [10,11,15] (see Figure 1A). The coherence withthe other self-motion parameters (upward velocity, pitch, androll) was negligible. We conclude from these results that HSEmight make use of the difference in frequency content ofrotations and translations (see Figure 2B) to provideinformation on both optic flow components in adjacentfrequency bands (Figure 3A). This is possible because theintersaccadic yaw velocities are smaller by an order ofmagnitude than during saccades (compare Figures 1C and2A). Hence, the saccadic gaze strategy may be viewed as aspecialisation that enables the extraction of translatory opticflow amidst rotatory optic flow that would otherwisedominate the response if smooth yaw rotations were usedexclusively for steering.
The intersaccadic responses to rotation and translationduring natural flight might interfere with each other in acomplicated way. To check whether such an effect influencesour conclusions, we designed two control stimuli (Figure 3Band Video S2). These control stimuli allowed us to study theresponse to rotation and translation separately whilst keepingthe visual scene viewed by the fly virtually the same. In the
only rotation (OR) control there was no translation betweensaccades, so to obtain basically the same trajectory of the eye,the intersaccadic translation of the original trajectories wasadded to the translation during saccades. In contrast, in theonly translation (OT) control, the eye was assumed totranslate without any superimposed rotation between sac-cades; the rotation between saccades was added to saccadicrotation. Coherence of yaw velocity with the response to ORstimuli and coherence of the translational velocities with theresponse to OT stimuli show similar frequency dependenciesas the corresponding components of the original optic flow(Figure 3A and 3C), confirming our conclusion of a frequencyseparation of the rotational and translational components.Again, the coherence was much smaller for the forwardvelocity than for the sideward velocity. Hence, the low-frequency components of the neuronal responses between
Figure 2. Properties of the Intersaccadic Stimulus for the TrajectoriesUsed for Figure 3A
(A) Probability density function of yaw velocity (red), sideward(black), and forward (blue) velocity. Forward is parallel to the frontalaxis of the fly’s head; sideward is perpendicular to the head’s plane ofsymmetry. Sideward and forward velocities were converted to angularvelocities by multiplying by the nearness (equal to the inverse of thedistance [16]) averaged over the trajectories and over the receptivefields of the neurons (7.02 m!1).(B) Power spectra of yaw velocity (red), sideward (black), and forward(blue) angular velocity. Typical relative standard error of the mean(SEM) = 20%.DOI: 10.1371/journal.pbio.0030171.g002
saccades encode mostly sideward motion, whereas informa-tion about yaw velocity dominates the high-frequencyresponse components.
By combining the responses of the HSE cells from bothhalves of the brain, the specificity of the intersaccadicresponses to the translational optic flow components can beenhanced. The summation of the responses almost exclusivelysignifies forward velocity (Figure 4A), whereas the differencebetween the responses almost exclusively signifies the side-ward and yaw velocities (Figure 4B). The latter signals can beseparated by low-pass and band-pass filtering, respectively. Itis not known whether the blowfly actually uses such aprocessing scheme, but it is clear that the information onyaw, forward, and sideward velocity can be extracted bysimple operations that can also be interpreted in neuronalterms.
Because translational optic flow depends on the distance ofthe animal to objects in its environment [16–18], thedependence of the neuronal responses on translation velocity
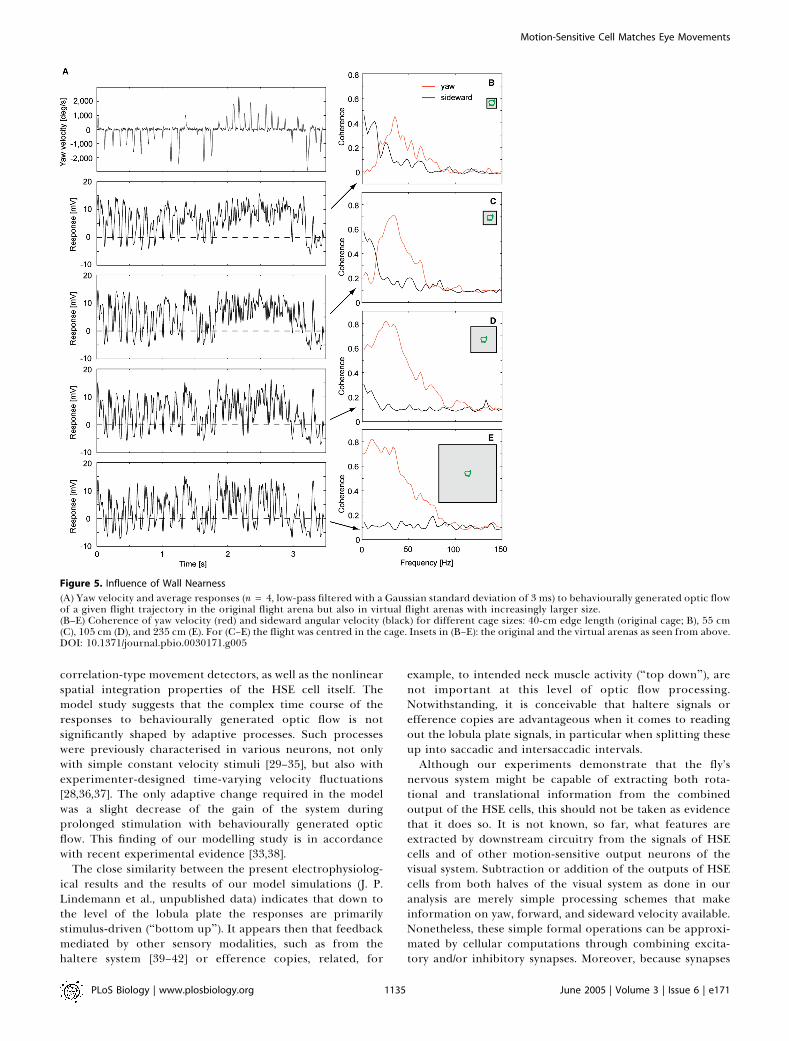
is likely to reflect the spatial relation of the animal to itssurroundings. This prediction is supported by experiments inwhich the optic flow of a given flight trajectory was tested notonly for the original flight arena. but also for virtual flightarenas of increasingly larger size (Figure 5). When enlargingthe virtual arena, the overall response profile changeddramatically and became virtually indistinguishable fromthe response to the original rotations without any super-imposed translation (compare bottom trace in Figure 5A andFigure 1F) when the size of the flight arena increased to morethan approximately 2 m. Accordingly, the coherence betweenthe difference of the responses of the right and the left HSEand sideward velocity dropped to chance levels with increas-ing distance of the fly to the arena walls (Figure 5B–5E).Hence, intersaccadic responses of HSE implicitly reflectdistance information. For the translatory velocities of fliesobserved in the present experiments in the original 40-cmcage, all distances larger than about 1 m were effectively atinfinity.
Figure 3. Coherence of Stimulus Parameters with HSE Response, Intersaccadic Parts of Stimulus and Response Only
(A) Average coherence of the response of the right and left HSE (N = 5 cells) with yaw velocity (red), sideward (black), and forward (blue)velocity.(B) Construction of control stimuli. Times i denote the start of an intersaccadic period, m is its midpoint, and s is the start of a saccade. For OT,each orientation coordinate (yaw shown) between consecutive midpoints is compressed into the saccadic period, leaving orientation constantbetween saccades. For OR, each position coordinate (x shown) is similarly compressed, leaving position constant between saccades.(C) Average coherence of yaw velocity for the OR (right and left HSE, N= 2) control (red), and of sideward (black) and forward (blue) velocity forthe OT (N = 3) control. Typical relative SEM = 10% for all coherences shown at (A) and (C).DOI: 10.1371/journal.pbio.0030171.g003
Here it is shown that, between saccades, the neuronalsignals of an identified motion-sensitive visual interneuron ofthe blowfly provide information about translatory self-motion and thus, implicitly, about the spatial relation of theanimal to its surroundings. This result was obtained by anovel experimental paradigm that made it possible, for thefirst time, to present in electrophysiological experimentswhat an animal has seen during free-flight manoeuvres.Although the behavioural free-flight sequences were obtainedin a relatively small flight arena, there are preliminary resultsthat blowflies under natural outdoor conditions [19] employthe same saccadic flight strategy as observed under laboratoryconditions. However, whereas the position and orientation ofthe eyes of free-flying blowflies could be resolved withunprecedented resolution in the laboratory setting by usinga magnetic coil technique [4,5], reconstruction of gaze with asimilar precision is not easily possible from high-speed videodata collected outdoors. Hence, the behaviourally generatedoptic flow sequences that were used for stimulation in thepresent study represent the currently most precise approx-imation of the visual input of freely flying blowflies.
Our conclusions obtained with behaviourally generatedoptic flow do not match previous conclusions based onconventional stimuli exclusively defined by the experimenter.
In contrast to the common view that the analysed HSEneuron mainly acts as a detector for the animal’s self-rotation[12,20], our results show that, depending on the three-dimensional layout of the environment, its response maynot be dominated by the most prominent turns of the animalthat occur during saccades.
Although the cell experiences the largest optic flow duringsaccades, it may encode behaviourally relevant informationespecially between saccades. Because blowflies keep their gazestable between saccades apart from small, broad-band yawrotations, they may gather useful information about theoutside world from the translational optic flow componentsthat dominate at low frequencies in intersaccadic intervals.Indeed, between saccades, neuronal signals provide richinformation about the spatial relation of the animal to itssurroundings. It should be noted that distance is signalledonly relative to the fly’s own velocity, because retinalvelocities evoked during translation are inversely propor-tional to distance and proportional to translation velocity.This implies that in walking flies, the visual surroundingsshould affect the responses of the HSE cell only when the flyis very close to environmental structures, just as has beenfound previously [21,22]. This implicit scaling of distanceinformation by the actual speed of the animal may be aparsimonious and advantageous way to extract from opticflow behaviourally relevant information about the outlay ofthe environment, because, for instance, evasive actionsevoked by obstacles in the path of locomotion need to beevoked only at a smaller distance when the animal movesslower.
Based on experimenter-designed motion stimuli, motion-sensitive neurons are conventionally expected to encodestimulus velocity. Indeed, stimulus velocity can be recon-structed faithfully from the responses of blowfly motion-sensitive neurons as long as the velocities and velocitychanges are relatively small [23,24]. However, during saccades
the visual motion system operates far beyond the linearrange. At higher velocities and, in particular, for verytransient motion stimuli, the responses of motion-sensitiveneurons are no longer determined by pattern velocity alone,but acceleration and higher time-derivatives of velocitypresumably also play a role in shaping the response profile[25–28]. Hence, to assess the functional significance ofneuronal mechanisms it is important to analyse the systemunder its natural operating conditions. The limited linearoperating range of motion vision is frequently regarded as adisadvantage because motion-sensitive neurons are implicitlyexpected to encode velocity in a linear way. In contrast to thisview, our results suggest that the nonlinearities of the visualmotion system may be essential for HSE to encodeinformation about the spatial relation of the animal to itsenvironment. This interpretation is corroborated by modelsimulations of the blowfly’s visual motion pathway and ofHSE responses to behaviourally generated optic flow (J. P.Lindemann et al., unpublished data). If the neuron encodedlinearly the entire velocity range that the system encountersin behaviour, by far the largest responses would be generatedduring body saccades. This would leave only a small responserange for encoding information about optic flow betweensaccades. This information would be strongly degraded bynoise in the neuronal signals. Hence, because during saccadesthe motion vision system does operate outside its linearrange, it appears to be able, between saccades, to encodeuseful information about translation and thus about thespatial relation of the animal to the outside world.How can the time-dependent responses to complex
dynamic stimuli a blowfly encounters in free flight beexplained? All features of the HSE responses that arecharacterised here by electrophysiological techniques canbe explained by a model of the computational mechanismsimplemented by the neuronal circuits in the blowfly motionvision pathway (J. P. Lindemann et al., unpublished data).Although this model was originally proposed based on simpleexperimenter-designed stimuli, we showed that it alsoexploits the active saccadic gaze and flight strategy ofblowflies in a similar way to its neuronal counterpart. Bystepwise dissection of the model circuit, we could determinewhich of its components are essential for these remarkablefeatures. Most relevant is the nonlinear velocity encoding ofthe mechanism of local motion detection, modelled by
Figure 4. Coherence of Stimulus Parameters with Combined HSEResponses, Intersaccadic Parts of Stimulus and Response Only
(A) Average coherence of yaw (red), sideward (black), and forward(blue) velocity with the summed responses of right and left HSE (N =5).(B) Same as (A) for the subtracted responses of right and left HSE.Typical relative SEM = 10% for all coherences shown at (A) and (B).DOI: 10.1371/journal.pbio.0030171.g004
correlation-type movement detectors, as well as the nonlinearspatial integration properties of the HSE cell itself. Themodel study suggests that the complex time course of theresponses to behaviourally generated optic flow is notsignificantly shaped by adaptive processes. Such processeswere previously characterised in various neurons, not onlywith simple constant velocity stimuli [29–35], but also withexperimenter-designed time-varying velocity fluctuations[28,36,37]. The only adaptive change required in the modelwas a slight decrease of the gain of the system duringprolonged stimulation with behaviourally generated opticflow. This finding of our modelling study is in accordancewith recent experimental evidence [33,38].
The close similarity between the present electrophysiolog-ical results and the results of our model simulations (J. P.Lindemann et al., unpublished data) indicates that down tothe level of the lobula plate the responses are primarilystimulus-driven (‘‘bottom up’’). It appears then that feedbackmediated by other sensory modalities, such as from thehaltere system [39–42] or efference copies, related, for
example, to intended neck muscle activity (‘‘top down’’), arenot important at this level of optic flow processing.Notwithstanding, it is conceivable that haltere signals orefference copies are advantageous when it comes to readingout the lobula plate signals, in particular when splitting theseup into saccadic and intersaccadic intervals.Although our experiments demonstrate that the fly’s
nervous system might be capable of extracting both rota-tional and translational information from the combinedoutput of the HSE cells, this should not be taken as evidencethat it does so. It is not known, so far, what features areextracted by downstream circuitry from the signals of HSEcells and of other motion-sensitive output neurons of thevisual system. Subtraction or addition of the outputs of HSEcells from both halves of the visual system as done in ouranalysis are merely simple processing schemes that makeinformation on yaw, forward, and sideward velocity available.Nonetheless, these simple formal operations can be approxi-mated by cellular computations through combining excita-tory and/or inhibitory synapses. Moreover, because synapses
Figure 5. Influence of Wall Nearness
(A) Yaw velocity and average responses (n= 4, low-pass filtered with a Gaussian standard deviation of 3 ms) to behaviourally generated optic flowof a given flight trajectory in the original flight arena but also in virtual flight arenas with increasingly larger size.(B–E) Coherence of yaw velocity (red) and sideward angular velocity (black) for different cage sizes: 40-cm edge length (original cage; B), 55 cm(C), 105 cm (D), and 235 cm (E). For (C–E) the flight was centred in the cage. Insets in (B–E): the original and the virtual arenas as seen from above.DOI: 10.1371/journal.pbio.0030171.g005
are often found to act as frequency filters (e.g., [43–45]), itappears to be feasible, by neuronal mechanisms, to separatethe information on sideward translation and yaw rotationthat is inherent in different frequency bands in the HSEdifference signal. It will be of interest in future studies todetermine whether the proposed encoding scheme, which thecurrent experiments show is possible, is actually employed bythe fly’s brain during flight. Moreover, it needs to be workedout how the saccadic flight and gaze control system interactswith the system that mediates compensatory optomotorresponses by reducing the slip velocity between the animaland its environment that results from unintended coursedeviations [46–48]. Such deviations may result, for instance,from asymmetries of the fly’s motor system. The differentdynamical properties of both systems would explain whysaccadic turns are not counteracted by the compensatoryoptomotor system: Actively induced fast saccadic turns arenot impeded by the much slower optomotor system [48,49].There is evidence for this interpretation from recentbehavioural experiments both on walking [50] and flyingblowflies (R. K., unpublished data).
Our results suggest that the computational design princi-ples of the blowfly visual motion pathway are adapted to theactive vision strategies of the animal and therefore allow theextraction of behaviourally relevant information. Informa-tion resulting mainly from sideward movements of the animalin the intersaccadic interval may be used to elicit saccadesthat prevent the animal from crashing into an obstacle.Indeed, there is evidence from combined behavioural andmodelling analyses on Drosophila that image expansion in thelateral visual field may play this important role [51].
In conclusion, our results provide an example in which anovel functional role of a neuron emerges by probing theneuron with stimuli that are actively generated by theanimals’ own behaviour. The new role is revealed herebecause the behaviourally generated input has dynamicalproperties strongly differing from those of conventionalexperimenter-designed stimuli.
Materials and Methods
Stimulus generation and electrophysiology. The position andorientation of the head of blowflies flying in a cage of 403 403 40cm3, with images of herbage on its side walls, were recorded usingmagnetic fields driving search coils attached to the flies [5,8]. Becausethe fly’s compound eye is an integral part of its head, and the visualinterior of the cage is known, the visual stimulus encountered by thefly during a flight could be reconstructed. Reconstructions of tenflights of 3.45 s, originating from three different flies, were playedback on a panoramic stimulus device [9] at a frame rate of 370 Hz.Proper spatial and temporal prefiltering prevented spatiotemporalaliasing during fast turns [9]. An approximation of the response ofthe contralateral HSE to the same flight was obtained by presenting amirrored version of the reconstruction. Intracellular recordings weremade from the HSE-cell in the right optic lobe of 1- to 2-d-old femaleblowflies of Calliphora vicina, following standard routines [52] andensuring careful alignment of the flies’ eyes. Results are based on HSErecordings from 14 flies.
Data analysis. Coherence between stimulus and response wascalculated as c2b " jPsrj2=#PssPrr$ [53], where Psr is the cross spectraldensity of stimulus and response, Pss is the power spectral density ofthe stimulus, and Prr is that of the response. The filter Psr/Prrreconstructs stimulus from response, and Prs/Pss, response fromstimulus. Spectra were calculated by periodogram averaging of 50%overlapping data segments, with each periodogram the discreteFourier transform of a cos2-tapered zero-mean data segment of 256ms, extended by zero-padding to 512 ms. Results were not strongly
dependent on segment length. Before segmentation, the response wasaligned with the stimulus by shifting it 22.5 ms backwards in time, theapproximate latency under the conditions of these experiments.Results were not strongly dependent on shift size. Segments from allflights used as stimulus for a particular cell were included in theperiodogram averaging. Bias in the coherence estimate was corrected[54] by c2 " n=#n! 1$c2b ! 1=#n! 1$, where n is the total number ofsegments. Coherence of the response with two parameters of thestimulus was obtained by first conditioning the second parameterwith the first [55], i.e., s92 " s2 ! #P21=P11$s1, where s1 is the firstparameter, and s2 and s92 is the original and conditioned secondparameter, respectively; P21 and P11 are cross and power spectraof the second and first parameter. Conditioning removes from s2the second-order statistical dependence with s1. With threestimulus parameters (e.g., yaw, sideward, and forward velocity(see Figure 3A) , the conditioned third parameter iss93 " s3 ! #P329=P2929$s92 ! #P31=P11$s1, which removes from s3 thesecond-order statistical dependence with both s1 and s92. The orderof evaluating parameters does not significantly affect the results forthe stimulus parameters used in this study because they are almostuncorrelated.
Masks selecting saccadic segments in stimulus and response wereobtained by gating (transmitting) a region surrounding saccades, heredefined as peaks (%500 deg/s) in the total angular velocity of the head.The region was large enough to include all parts of both saccadicstimulus and corresponding response. Saccades that were closetogether were merged to reduce boundary effects. Edges of themasks were tapered with a 12.5-ms cos2 taper to reduce spectralleakage biasing the coherence estimate at high frequencies. Theintersaccadic mask, used for suppressing the saccadic stimulus andresponse, equals one minus the saccadic mask. Masked data consistedof gated data intermitted with blocks of zeroes. Although the maskshapes the power and cross spectra of the masked data, this occurs ina similar way for all spectra in the numerator and denominator of thedefinition of coherence. Consequently, the mask by itself does notgenerate coherence for uncorrelated data, which was checked incontrol computations with uncorrelated noise. The coherence ofmasked data includes the zero blocks, however, and therefore shouldbe regarded as belonging to the entire masked signal, not just to itsintersaccadic part.
The power spectra of Figure 2B were not calculated for the entiremasked data because the mask dominates the shape of these spectra,producing a strong peak at the saccade rate, approximately 10 Hz.Instead, we used a routine for calculating the Fourier transform ofgapped data [56] and obtained the power spectra by averaging thesquared amplitude over segments. The routine ignores all datamasked, defined here as points where the intersaccadic mask wassmaller than 0.5.
The total optic flow for Figure 1C was calculated by projecting theoptic flow onto the local response field of the right HSE cell, i.e., it isweighted according to the cell’s local preferred directions andmotion sensitivities.
Supporting Information
Video S1. Flight of 3.45 s, Shown Ten Times Slower than Real Time(at 25 fps Playback Speed)The left panel shows a reconstruction of the flight in a schematiccage, with, for the sake of clarity, the fly rendered three times larger,relative to the cage, than it is in reality. The middle panel shows anenlarged view of the orientational movements of the fly’s thorax(blue) and head (red) during the same flight [5,8]. The right panelshows the visual scene, viewed from the centre of the head, during thesame flight. It shows a 180 deg fisheye projection, with the centrestraight ahead, the far right of the image pointing at 90 deg to theright, and the upper part of the image pointing straight up. Thesection of 1.5 s length used for Video S2 starts at 1.11 s from thebeginning, i.e., approximately at one third of the video. Note thevisual consequences of the saccadic yaw changes of thorax and head,and the roll compensation of the head.Found at DOI: 10.1371/journal.pbio.0030171.sv001 (9.9 MB ZIP).
Video S2. Illustration of the OT and OR Control StimuliThe middle panel shows 1.5 s of the video corresponding to theoriginal trajectory, shown 40 times slower than real time, for a patchof 30 deg3 30 deg in a direction in the horizontal plane at 45 deg tothe right of the frontal axis of the eye (azimuth 45 deg, elevation 0
deg). This direction is in the middle of the receptive field of the rightHSE. The letters S and I in the title bar signal the time course of thesaccadic and intersaccadic masks used for analysing the saccadic andintersaccadic responses, respectively. The left panel shows the OTcontrol in which between saccades (I on), all rotation is removed andonly translational optic flow is presented to the fly. The right panelshows the OR control in which between saccades, all translation isremoved and only rotational optic flow is presented to the fly. Notethat the intersaccadic speeds for sideward translation (original andOT) and rotation (original and OR) are of the same order ofmagnitude (see the overlapping velocity distributions of yaw andsideward velocity in Figure 2A), whereas the rotations extend tohigher temporal frequencies than the translations (see the powerspectra of yaw and sideward velocity in Figure 2B). This is reflected inthe coding of rotation and translation in the HSE neuron (see thecoherences for yaw and sideward velocity in Figure 3A, 3C, and 4B).
Found at DOI: 10.1371/journal.pbio.0030171.sv002 (8.8 MB ZIP).
Acknowledgments
We thank N. Boeddeker, J. Grewe, K. Karmeier, H. P. Snippe, and A.-K. Warzecha for a critical reading of the manuscript. Supported bythe Deutsche Forschungsgemeinschaft (DFG).
Competing interests. The authors have declared that no competinginterests exist.
Author contributions. RK, JHvH, JPL, and ME conceived anddesigned the experiments. RK and CM performed the experiments.RK, JHvH, CM, and ME analyzed the data. JHvH and JPLcontributed materials and analysis tools. RK, JHvH, and ME wrotethe paper. &
References1. Findlay JM, Gilchrist ID (2003) Active vision: The psychology of looking and
seeing. Oxford: Oxford University Press. 220 p.2. Land MF, Collett TS (1997) A survey of active vision in invertebrates. In:
Srinivasan MV, Venkatesh S, editors. From living eyes to seeing machines.Oxford: Oxford University Press. pp. 16–36.
3. Land MF (1973) Head movement of flies during visually guided flight.Nature 243: 299–300.
4. Schilstra C, van Hateren JH (1999) Blowfly flight and optic flow. I. Thoraxkinematics and flight dynamics. J Exp Biol 202: 1481–1490.
5. van Hateren JH, Schilstra C (1999) Blowfly flight and optic flow. II. Headmovements during flight. J Exp Biol 202: 1491–1500.
6. Egelhaaf M, Kern R, Kurtz R, Krapp HG, Kretzberg J, et al. (2002) Neuralencoding of behaviourally relevant motion information in the fly. TrendsNeurosci 25: 96–102.
7. Borst A, Haag J (2002) Neural networks in the cockpit of the fly. J CompPhysiol A Neuroethol Sens Neural Behav Physiol 188: 419–437.
8. Schilstra C, van Hateren JH (1998) Stabilizing gaze in flying blowflies.Nature 395: 654.
9. Lindemann JP, Kern R, Michaelis C, Meyer P, van Hateren JH, et al. (2003)FliMax, a novel stimulus device for panoramic and high speed presentationof behaviourally generated optic flow. Vision Res 43: 779–791.
10. Hausen K (1982) Motion sensitive interneurons in the optomotor system ofthe fly. I. The horizontal cells: Structure and signals. Biol Cybern 45: 143–156.
11. Hausen K (1982) Motion sensitive interneurons in the optomotor system ofthe fly. II. The horizontal cells: Receptive field organization and responsecharacteristics. Biol Cybern 46: 67–79.
12. Hausen K, Egelhaaf M (1989) Neural mechanisms of visual course control ininsects. In: Stavenga D, Hardie RC, editors. Facets of vision. Berlin:Springer Verlag. pp. 391–424.
13. Haag J, Borst A (1998) Active membrane properties and signal encoding ingraded potential neurons. J Neurosci 18: 7972–7986.
14. Warzecha AK, Kurtz R, Egelhaaf M (2003) Synaptic transfer of dynamicalmotion information between identified neurons in the visual system of theblowfly. Neuroscience 119: 1103–1112.
15. Horstmann W, Egelhaaf, M, Warzecha AK (2000) Synaptic interactionsincrease optic flow specificity. Europ J Neurosci 12: 2157–2165.
16. Koenderink JJ (1986) Optic Flow. Vision Res 26: 161–180.17. Eckert MP, Zeil J (2001) Towards an ecology of motion vision. In: Zanker
JM, Zeil J, editors. Motion vision: Computational, neural, and ecologicalconstraints. Berlin: Springer Verlag. pp. 333–369.
18. Gibson JJ (1950) The perception of the visual world. Boston: HoughtonMifflin. 235 p.
19. Boeddeker N, Lindemann JP, Egelhaaf M, Zeil J (2005) Analysis of neuronalresponses in the blowfly visual system to optic flow under natural outdoorsconditions. In: Zimmermann H, Krieglstein K, editors. Proceedings of the6th meeting of the German Neuroscience Society. 30th Gottingen Neuro-biology Conference; 2005 Feb 17–20; Gottingen, Germany. Neuroforum2005, 1 Suppl.: 22B.
20. Krapp, HG, Hengstenberg R, Egelhaaf M (2001) Binocular contribution tooptic flow processing in the fly visual system. J Neurophysiol 85: 724–734.
21. Kern R, Petereit C, Egelhaaf M (2001) Neural processing of naturalisticoptic flow. J Neurosci 21: 1–5.
22. Kern R, Lutterklas M, Petereit C, Lindemann JP, Egelhaaf M (2001)Neuronal processing of behaviourally generated optic flow: Experimentsand model simulations. Network 12: 351–369.
23. Bialek W, Rieke F, de Ruyter van Steveninck R, Warland D (1991) Reading aneural code. Science 252: 1854–1857.
24. Haag J, Borst A (1997) Encoding of visual motion information andreliability in spiking and graded potential neurons. J Neurosci 17: 4809–4819.
25. Srinivasan, MV (1983) The impulse response of a movement-detectingneuron and its interpretation. Vision Res 23: 659–663.
26. Egelhaaf M, Reichardt W (1987) Dynamic response properties of movementdetectors: Theoretical analysis and electrophysiological investigation in thevisual system of the fly. Biol Cybern 56: 69–87.
27. Egelhaaf M, Borst A (1989) Transient and steady-state response propertiesof movement detectors. J Opt Soc Am A 6: 116–127.
28. Maddess T, DuBois R, Ibbotson MR (1991) Response properties andadaptation of neurones sensitive to image motion in the butterfly Papilioaegeus. J Exp Biol 161: 171–199.
29. Maddess T, Laughlin SB (1985) Adaptation of the motion-sensitive neuronH1 is generated locally and governed by contrast frequency. Proc R SocLond B 225: 251–275.
30. Ruyter van Steveninck R de, Zaagman WH, Mastebroek HAK (1986)Adaptation of transient responses of a movement-sensitive neuron in thevisual system of the blowfly, Calliphora erythrocephala. Biol Cybern 54:223–236.
31. Borst A, Egelhaaf M (1987) Temporal modulation of luminance adapts timeconstant of fly movement detectors. Biol Cybern 56: 209–215.
32. Harris RA, O’Carroll DC, Laughlin SB (1999) Adaptation and the temporaldelay filter of fly motion detectors. Vision Res 39: 2603–2613.
33. Harris, RA, O’Carroll DC, Laughlin SB (2000) Contrast gain reduction in flymotion adaptation. Neuron 28: 595–606.
34. Reisenman C, Haag J, Borst A (2003) Adaptation of response transients infly motion vision. I. Experiments. Vision Res 43: 1291–1307.
35. Borst A, Reisenman C, Haag J (2003) Adaptation to response transients infly motion vision. II: Model studies. Vision Res 43: 1309–1322.
36. Brenner N, Bialek W, de Ruyter van Steveninck R (2000) Adaptive rescalingmaximizes information transmission. Neuron 26: 695–702.
37. Fairhall AL, Lewen GD, Bialek W, de Ruyter van Steveninck R (2001)Efficiency and ambiguity in an adaptive neural code. Nature 412: 787–792.
38. Heitwerth J, Egelhaaf M (2005) A new role of motion adaptation in visualmotion pathway of the blowfly. In: Zimmermann H, Krieglstein K, editors.Proceedings of the 6th meeting of the German Neuroscience Society. 30thGottingen Neurobiology Conference; 2005 Feb 17–20; Gottingen, Ger-many. Neuroforum 2005; 1 Suppl: 17B.
39. Nalbach G, Hengstenberg R (1994) The halteres of the blowfly Calliphora.II. Three-dimensional organization of compensatory reactions to real andsimulated rotations. J Comp Physiol A 175: 695–708.
40. Nalbach G (1993) The halteres of the blowfly Calliphora: I. Kinematics anddynamics. J Comp Physiol A 173: 293–300.
41. Chan WP, Prete F, Dickinson MH (1998) Visual input to the efferentcontrol system of a fly’s ‘‘gyroscope.’’ Science 280: 289–292.
42. Sherman A, Dickinson MH (2004) Sumation of visual and mechanosensoryfeedback in Drosophila flight control. J Exp Biol 207: 133–142.
43. Fortune ES, Rose GJ (1997) Passive and active membrane propertiescontribute to the temporal filtering properties of midbrain neurons invivo. J Neurosci 17: 3815–3825.
44. Fortune ES, Rose GJ (2001) Short-term synaptic plasticity as a temporalfilter. Trends Neurosci 24: 381–385.
45. Trussell LO (1999) Synaptic mechanisms for coding timing in auditoryneurons. Annu Rev Neurosci 61: 477–496.
46. Gotz KG (1975) The optomotor equilibrium of the Drosophila navigationsystem. J Comp Physiol 99: 187–210.
47. Heisenberg M, Wolf R (1984) Vision in Drosophila. Berlin: Springer Verlag.250 p.
48. Egelhaaf M (1987) Dynamic properties of two control systems underlyingvisually guided turning in house-flies. J Comp Physiol A Neuroethol SensNeural Behav Physiol 161: 777–783.
49. Warzecha AK, Egelhaaf M (1996) Intrinsic properties of biological motiondetectors prevent the optomotor control system from getting unstable. PhilTrans R Soc Lond B 351: 1579–1591.
50. Kern, R, Egelhaaf, M (2000) Optomotor course control in flies with largelyasymmetric visual input. J Comp Physiol A Neuroethol Sens Neural BehavPhysiol 186: 45–55.
51. Tammero LF, Dickinson MH (2002) The influence of visual landscape on
the free flight behavior of the fruit fly Drosophilia melanogaster. J Exp Biol205: 327–343.
52. Warzecha AK, Egelhaaf M, Borst A (1993) Neural circuit tuning fly visualinterneurons to motion of small objects. 1. Dissection of the circuit bypharmacological and photoinactivation techniques. J Neurophysiol 69:329–339.
53. Theunissen F, Roddey JC, Stufflebeam S, Clague H, Miller JP (1996)Information theoretic analysis of dynamical encoding by four identifiedprimary sensory interneurons in the cricket cercal system. J Neurophysiol75: 1345–1364.
54. van Hateren JH, Ruttiger L, Sun H, Lee BB (2002) Processing of naturaltemporal stimuli by macaque retinal ganglion cells. J Neurosci 22: 9945–9960.
55. Bendat JS, Piersol AG (2000) Random data: Analysis and measurementprocedures. New York: Wiley-Interscience. p 594.
56. Scargle JD (1989) Studies on astronomical time series analysis. III. Fouriertransforms, autocorrelation functions, and cross-correlation functions ofunevenly spaced data. Astrophys J 343: 874–887.
Note Added in ProofDuring the review of this paper, we (RK, JHvH, ME) submitted a related
paper to the Journal of Neuroscience, which has since been published: vanHateren JH, Kern R, Schwerdtfeger G, Egelhaaf M (2005) Function and codingin the blowfly H1 neuron during naturalistic optic flow. J Neurosci 25: 4343–4352.