Regional differences in usage of antenatal care and safe delivery services in Indonesia: findings from a nationally representative survey Vrijesh Tripathi, 1 Rajvir Singh 2 To cite: Tripathi V, Singh R. Regional differences in usage of antenatal care and safe delivery services in Indonesia: findings from a nationally representative survey. BMJ Open 2017;7: e013408. doi:10.1136/ bmjopen-2016-013408 ▸ Prepublication history for this paper is available online. To view these files please visit the journal online (http://dx.doi.org/10.1136/ bmjopen-2016-013408). Received 11 July 2016 Revised 26 November 2016 Accepted 8 December 2016 1 Faculty of Science and Technology, Department of Mathematics and Statistics, The University of the West Indies, St Augustine, Trinidad and Tobago 2 Cardiology Research Centre, Heart Hospital, Hamad Medical Corporation (HMC), Doha, Qatar Correspondence to Dr Vrijesh Tripathi; [email protected]ABSTRACT Background: Indonesia has shown a nominal increase in antenatal care (ANC) coverage from 93% to 96% in the Indonesia Demographic Health Survey (IDHS)— 2012. This is high but for a comprehensive assessment of maternal health coverage in Indonesia, safe delivery services need to be assessed in conjunction with ANC coverage. Materials and methods: The study uses survey data from the IDHS-2012 that was conducted among women aged 15–49 years who gave birth during the past 3 years preceding the survey. Socioeconomic and demographic factors affecting ANC coverage and safe delivery services are analysed by segregating the data into 7 regions of Indonesia. Results: Multivariate results show that besides wealth and education differentials, regional differences significantly affect the usage of ANC and safe delivery services across the 7 regions. Univariate analyses show that Sulawesi, Maluku and Western New Guinea islands are at a disadvantage in accessing ANC and safe delivery services. Conclusions: The study recommends that disaggregated regional targets be set in order to further reduce maternal mortality rates in Indonesia. INTRODUCTION Indonesia is the second most populous country in Asia and the fourth largest in the world after the People’ s Republic of China, India and the USA. It consists of more than 17 000 islands spread over 1.9 million square kilometres and is home to some 240 million people. There are five major islands: Sumatra, Java, Kalimantan, Sulawesi and Papua. Two remaining groups of islands are Maluku and Nusa Tenggara, running from Sulawesi to Papua in the north and from Bali to Timor in the south. The country is divided into 34 provinces that comprise some 500 districts, divided into nearly 7000 subdis- tricts in which there are almost 80 000 villages. 1 For the purposes of this study, we have divided the country into seven regions, Sumatra, Java, Lesser Sunda islands compris- ing Bali, West and East Nusa Tenggara, Kalimantan, Sulawesi, Maluku islands and Western New Guinea islands. The United Nations defined millennium development goals (MDGs) 4 and 5 were aimed at reducing under five-child mortality (U5M) by two-thirds and to improve mater- nal mortality ratios by three-quarters between 1990 and 2015. 2 Indonesia has recorded a huge reduction in U5M down from 85 to 27 deaths per 1000 live births in 2015. 3 The international community has now defined sustainable development goals that look forward to achieving a target of reducing U5M to as low as 25/1000 live births. 4 According to the IDHS 2012 report, while the number of mothers receiving antenatal care (ANC) has increased from 93% in 2007 to 96% in 2012, more than half of all deliver- ies still take place at home in the absence of specialised services to deal with potential complications. 5 The ministry of health reported a wide discrepancy in ANC usage Strengths and limitations of this study ▪ No prior study has analysed determinants of antenatal care and safe delivery services in Indonesia in a single study. ▪ The sampling design is robust and is representa- tive of the country. ▪ The IDHS-2012 covered ever-married and never- married women aged 15–49 years. ▪ There is a recall bias because of the cross- sectional design of the survey data that are self- reported at a single point of time. ▪ Most of the variables (age, wealth index, educa- tion, occupation) are recorded at the time of the survey rather than at the time of birth of the child and thus may have changed. Tripathi V, Singh R. BMJ Open 2017;7:e013408. doi:10.1136/bmjopen-2016-013408 1 Open Access Research on 10 July 2018 by guest. Protected by copyright. http://bmjopen.bmj.com/ BMJ Open: first published as 10.1136/bmjopen-2016-013408 on 3 February 2017. Downloaded from
Transcript
Regional differences in usage ofantenatal care and safe delivery servicesin Indonesia: findings from a nationallyrepresentative survey
Vrijesh Tripathi,1 Rajvir Singh2
To cite: Tripathi V, Singh R.Regional differences in usageof antenatal care and safedelivery services inIndonesia: findings from anationally representativesurvey. BMJ Open 2017;7:e013408. doi:10.1136/bmjopen-2016-013408
▸ Prepublication history forthis paper is available online.To view these files pleasevisit the journal online(http://dx.doi.org/10.1136/bmjopen-2016-013408).
Received 11 July 2016Revised 26 November 2016Accepted 8 December 2016
1Faculty of Science andTechnology, Department ofMathematics and Statistics,The University of the WestIndies, St Augustine, Trinidadand Tobago2Cardiology Research Centre,Heart Hospital, HamadMedical Corporation (HMC),Doha, Qatar
ABSTRACTBackground: Indonesia has shown a nominal increasein antenatal care (ANC) coverage from 93% to 96% inthe Indonesia Demographic Health Survey (IDHS)—2012. This is high but for a comprehensiveassessment of maternal health coverage in Indonesia,safe delivery services need to be assessed inconjunction with ANC coverage.Materials and methods: The study uses survey datafrom the IDHS-2012 that was conducted amongwomen aged 15–49 years who gave birth during thepast 3 years preceding the survey. Socioeconomic anddemographic factors affecting ANC coverage and safedelivery services are analysed by segregating the datainto 7 regions of Indonesia.Results: Multivariate results show that besides wealthand education differentials, regional differencessignificantly affect the usage of ANC and safe deliveryservices across the 7 regions. Univariate analyses showthat Sulawesi, Maluku and Western New Guinea islandsare at a disadvantage in accessing ANC and safedelivery services.Conclusions: The study recommends thatdisaggregated regional targets be set in order tofurther reduce maternal mortality rates in Indonesia.
INTRODUCTIONIndonesia is the second most populouscountry in Asia and the fourth largest in theworld after the People’s Republic of China,India and the USA. It consists of more than17 000 islands spread over 1.9 million squarekilometres and is home to some 240 millionpeople. There are five major islands:Sumatra, Java, Kalimantan, Sulawesi andPapua. Two remaining groups of islands areMaluku and Nusa Tenggara, running fromSulawesi to Papua in the north and from Balito Timor in the south. The country isdivided into 34 provinces that comprise some500 districts, divided into nearly 7000 subdis-tricts in which there are almost 80 000
villages.1 For the purposes of this study, wehave divided the country into seven regions,Sumatra, Java, Lesser Sunda islands compris-ing Bali, West and East Nusa Tenggara,Kalimantan, Sulawesi, Maluku islands andWestern New Guinea islands.The United Nations defined millennium
development goals (MDGs) 4 and 5 wereaimed at reducing under five-child mortality(U5M) by two-thirds and to improve mater-nal mortality ratios by three-quarters between1990 and 2015.2 Indonesia has recorded ahuge reduction in U5M down from 85 to 27deaths per 1000 live births in 2015.3 Theinternational community has now definedsustainable development goals that lookforward to achieving a target of reducingU5M to as low as 25/1000 live births.4
According to the IDHS 2012 report, whilethe number of mothers receiving antenatalcare (ANC) has increased from 93% in 2007to 96% in 2012, more than half of all deliver-ies still take place at home in the absence ofspecialised services to deal with potentialcomplications.5 The ministry of healthreported a wide discrepancy in ANC usage
Strengths and limitations of this study
▪ No prior study has analysed determinants ofantenatal care and safe delivery services inIndonesia in a single study.
▪ The sampling design is robust and is representa-tive of the country.
▪ The IDHS-2012 covered ever-married and never-married women aged 15–49 years.
▪ There is a recall bias because of the cross-sectional design of the survey data that are self-reported at a single point of time.
▪ Most of the variables (age, wealth index, educa-tion, occupation) are recorded at the time of thesurvey rather than at the time of birth of thechild and thus may have changed.
Tripathi V, Singh R. BMJ Open 2017;7:e013408. doi:10.1136/bmjopen-2016-013408 1
across provinces with 96% mothers using ANC servicesin Jakarta compared with only 38% mothers in Papuaprovince.6 7 Thus, this study assesses whether regionaldifferences affect ANC coverage and safe deliveryservices across Indonesia.
METHODSThe study uses raw data from nationally representativesamples of women aged 15–49 years in IndonesiaDemographic and Health Survey (IDHS-2012) con-ducted during 7 May–31 July 2012. Among 45 607women interviewed in the survey with a 96% responserate, a total of 23 809 women gave birth in the 3 yearspreceding the survey. There were 1558 (6.5%) reporteddeaths.1
Ethics statementThe IDHS-2012 was conducted in accordance with inter-nationally agreed ethical principles for the conduct ofmedical research. Since this study is based on the IDHSdata, which are available in the public domain with noidentifiable information on the survey participants, thiswork is exempted from ethical review.1
Outcome eventsFor the purposes of analysing ANC coverage, the studypopulation consists of mothers who had at least threeANC visits or at least two tetanus toxoid injectionsduring pregnancy or one tetanus toxoid injection inpregnancy and at least one tetanus toxoid injection inthe preceding 3 years and received iron and folic acidtablets for 90 or more days.8–10 Safe delivery is describedas delivery attended by a general practitioner or obstetri-cian or nurse or trained midwife who has been educatedand trained to manage normal pregnancies while thoseattended by faith healers or elders or relatives or trad-itional birth attendants or others are not included insafe delivery.11
CovariatesData were segregated according to the seven regions inIndonesia. There is merit in segregating data for itallows us to focus on aspects of ANC and safe deliveryservices that may remain hidden in national level indica-tors.12 13 Selected socioeconomic and demographicfactors examined include age, place of residence, educa-tion of self and father, occupation of self and father,wealth quintile, frequency of listening to the radio/reading newspapers and magazines, birth order andchild status at birth. Though age is a continuous vari-able, it is tabulated into age groups 15–19 years, 20–24 years, 25–29 years and above 30 years. Place of resi-dence is categorised as rural or urban. Education is clas-sified as no formal education, up to primary level, up tosecondary level and higher. Occupation is arranged intocategories as not working outside home for money,unskilled or skilled work, or agriculture. A composite
wealth index was computed using principal componentanalysis of household items related to possession ofdurable assets, access to utilities and infrastructure, andhousing characteristics to assess the economic status ofthe mothers. Each woman was ranked based on a house-hold asset score and was assigned to wealth quintiles,labelled as poorest, poorer, middle, richer and richest,each comprising 20% of the population. A detaileddescription on the methodology adopted to constructthe wealth index in the IDHS data set is given in theIDHS 2012 report.1 Public messaging is an importantsource of getting information for the woman, and there-fore the frequency of listening to the radio/readingnewspapers and magazines is included to gauge themother’s level of perception regarding family healthinitiatives.
Statistical analysesData were downloaded from the DHS site with due per-mission for analyses. Frequencies with percentages arecalculated for predictors and outcome variables.Relationships of mothers’ social and demographic vari-ables and healthcare outcomes data are stratified accord-ing to seven regions with the dependent variables asANC coverage and safe delivery services. χ2 tests are per-formed to see associations and univariate logistic regres-sion analysis are performed to know about ORs and 95%CI for all predictors. Multivariate logistic regression ana-lyses are performed and adjusted ORs with 95% CI andp values are presented in the tables.14–16 Statistical signifi-cance was set at p<0.05.17 The SPSS 21.0 statisticalpackage is used for the analyses (IBM SPSS. Statistics forwindows. Version 21.0. Armonk: IBM Corp, 2012).
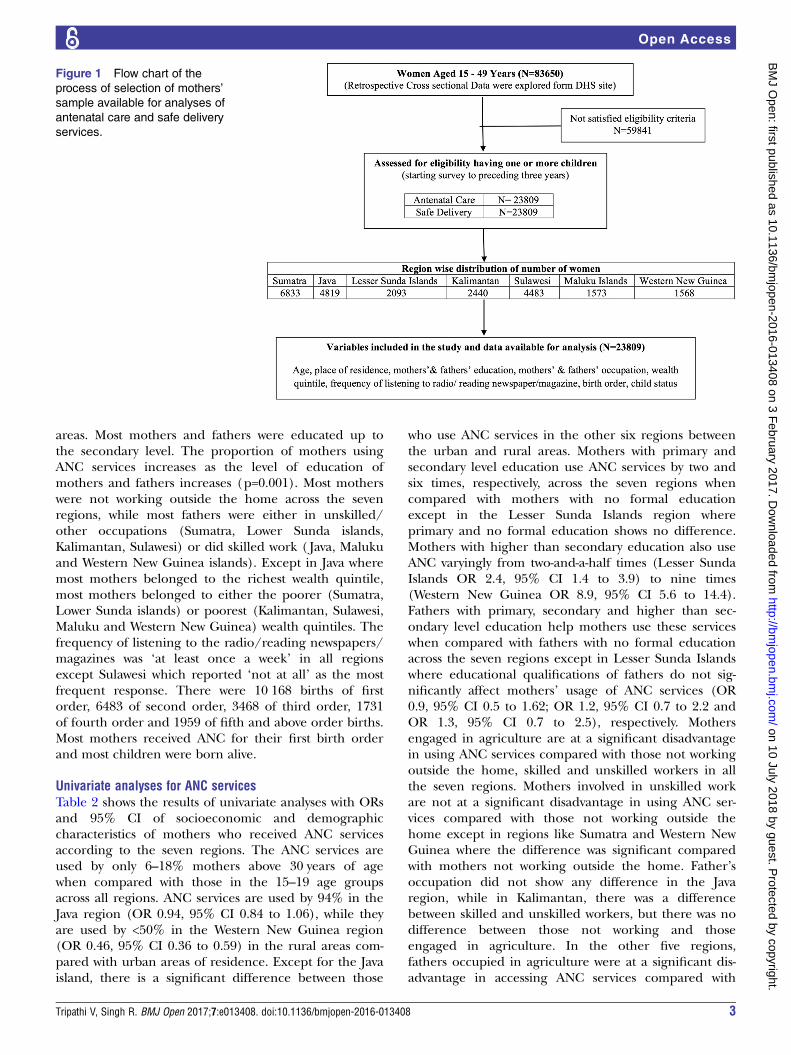
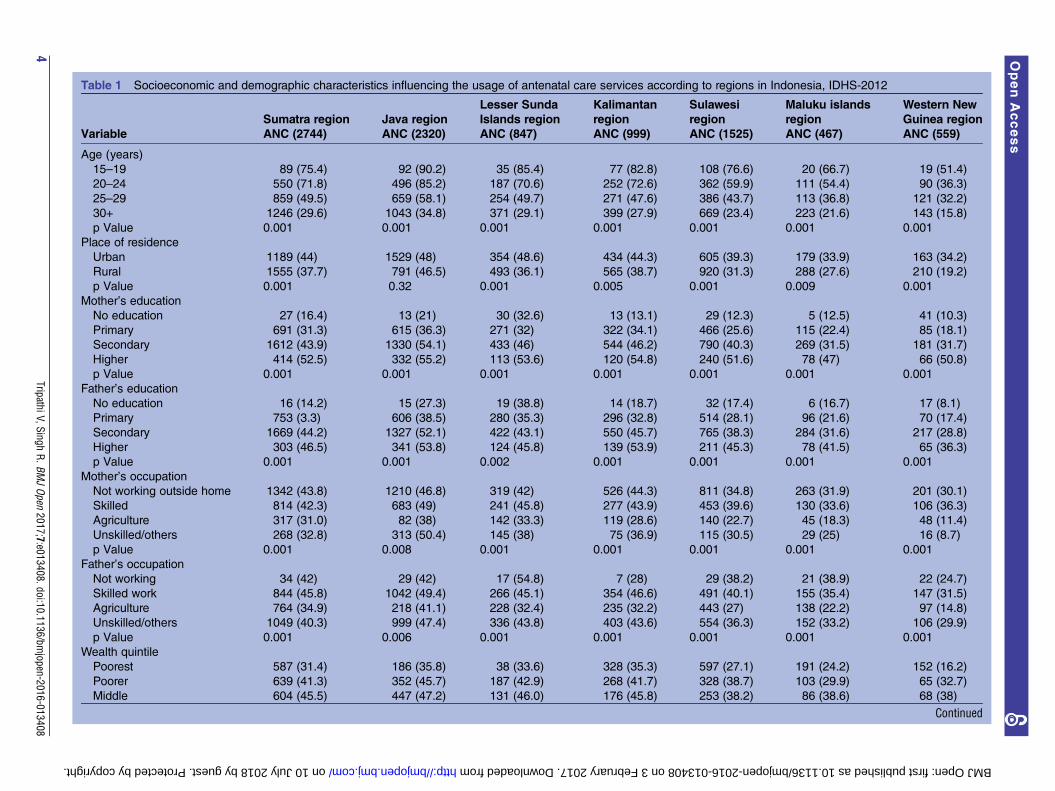
RESULTSPopulation characteristics of the study population for ANCservicesThe study population of 23 809 births consisted of 6833births in the Sumatra region, 4819 births in the Javaregion, 2093 births in the Lesser Sunda Islands region,2440 births in Kalimantan, 4483 births in Sulawesi, 1573births in the Maluku Islands and 1568 births in theWestern New Guinea islands (figure 1). Table 1 presentscharacteristics of mothers using ANC services across theseven regions, including 2744 births in the Sumatraregion, 2320 births in the Java region, 847 births in theLesser Sunda Islands, 999 births in Kalimantan, 1525births in Sulawesi, 467 births in Maluku Islands and 559births in the Western New Guinea islands. The tableshows the number of mothers in a particular categoryusing ANC services with the accompanying percentageof the total number of mothers in that category. As theage of the mother increases, the usage of ANC decreasesacross the seven regions (p=0.001), especially formothers above the age of 25 years. More births tookplace in rural areas than urban areas in all regionsexcept Java where more births took place in the urban
2 Tripathi V, Singh R. BMJ Open 2017;7:e013408. doi:10.1136/bmjopen-2016-013408
areas. Most mothers and fathers were educated up tothe secondary level. The proportion of mothers usingANC services increases as the level of education ofmothers and fathers increases (p=0.001). Most motherswere not working outside the home across the sevenregions, while most fathers were either in unskilled/other occupations (Sumatra, Lower Sunda islands,Kalimantan, Sulawesi) or did skilled work ( Java, Malukuand Western New Guinea islands). Except in Java wheremost mothers belonged to the richest wealth quintile,most mothers belonged to either the poorer (Sumatra,Lower Sunda islands) or poorest (Kalimantan, Sulawesi,Maluku and Western New Guinea) wealth quintiles. Thefrequency of listening to the radio/reading newspapers/magazines was ‘at least once a week’ in all regionsexcept Sulawesi which reported ‘not at all’ as the mostfrequent response. There were 10 168 births of firstorder, 6483 of second order, 3468 of third order, 1731of fourth order and 1959 of fifth and above order births.Most mothers received ANC for their first birth orderand most children were born alive.
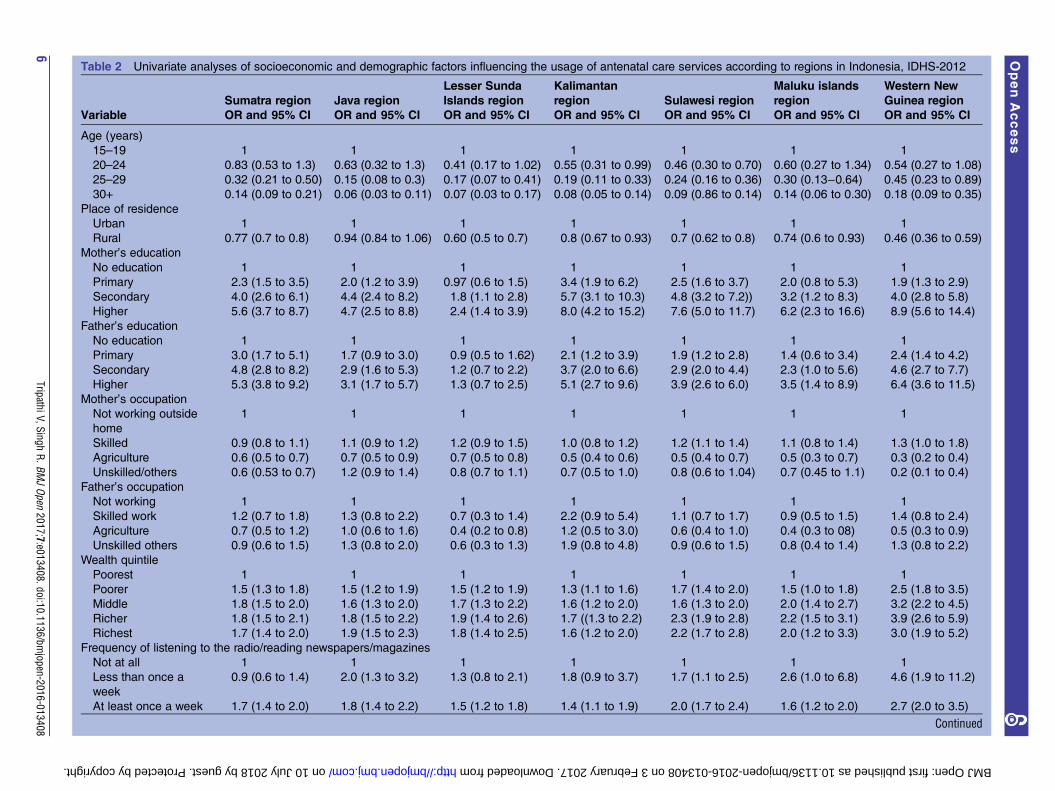
Univariate analyses for ANC servicesTable 2 shows the results of univariate analyses with ORsand 95% CI of socioeconomic and demographiccharacteristics of mothers who received ANC servicesaccording to the seven regions. The ANC services areused by only 6–18% mothers above 30 years of agewhen compared with those in the 15–19 age groupsacross all regions. ANC services are used by 94% in theJava region (OR 0.94, 95% CI 0.84 to 1.06), while theyare used by <50% in the Western New Guinea region(OR 0.46, 95% CI 0.36 to 0.59) in the rural areas com-pared with urban areas of residence. Except for the Javaisland, there is a significant difference between those
who use ANC services in the other six regions betweenthe urban and rural areas. Mothers with primary andsecondary level education use ANC services by two andsix times, respectively, across the seven regions whencompared with mothers with no formal educationexcept in the Lesser Sunda Islands region whereprimary and no formal education shows no difference.Mothers with higher than secondary education also useANC varyingly from two-and-a-half times (Lesser SundaIslands OR 2.4, 95% CI 1.4 to 3.9) to nine times(Western New Guinea OR 8.9, 95% CI 5.6 to 14.4).Fathers with primary, secondary and higher than sec-ondary level education help mothers use these serviceswhen compared with fathers with no formal educationacross the seven regions except in Lesser Sunda Islandswhere educational qualifications of fathers do not sig-nificantly affect mothers’ usage of ANC services (OR0.9, 95% CI 0.5 to 1.62; OR 1.2, 95% CI 0.7 to 2.2 andOR 1.3, 95% CI 0.7 to 2.5), respectively. Mothersengaged in agriculture are at a significant disadvantagein using ANC services compared with those not workingoutside the home, skilled and unskilled workers in allthe seven regions. Mothers involved in unskilled workare not at a significant disadvantage in using ANC ser-vices compared with those not working outside thehome except in regions like Sumatra and Western NewGuinea where the difference was significant comparedwith mothers not working outside the home. Father’soccupation did not show any difference in the Javaregion, while in Kalimantan, there was a differencebetween skilled and unskilled workers, but there was nodifference between those not working and thoseengaged in agriculture. In the other five regions,fathers occupied in agriculture were at a significant dis-advantage in accessing ANC services compared with
Figure 1 Flow chart of the
process of selection of mothers’
sample available for analyses of
antenatal care and safe delivery
services.
Tripathi V, Singh R. BMJ Open 2017;7:e013408. doi:10.1136/bmjopen-2016-013408 3
on 10 July 2018 by guest. Protected by copyright. http://bmjopen.bmj.com/ BMJ Open: first published as 10.1136/bmjopen-2016-013408 on 3 February 2017. Downloaded from
on 10 July 2018 by guest. Protected by copyright. http://bmjopen.bmj.com/ BMJ Open: first published as 10.1136/bmjopen-2016-013408 on 3 February 2017. Downloaded from
Table 2 Univariate analyses of socioeconomic and demographic factors influencing the usage of antenatal care services according to regions in Indonesia, IDHS-2012
Sumatra region Java region
Lesser Sunda
Islands region
Kalimantan
region Sulawesi region
Maluku islands
region
Western New
Guinea region
Variable OR and 95% CI OR and 95% CI OR and 95% CI OR and 95% CI OR and 95% CI OR and 95% CI OR and 95% CI
Age (years)
15–19 1 1 1 1 1 1 1
20–24 0.83 (0.53 to 1.3) 0.63 (0.32 to 1.3) 0.41 (0.17 to 1.02) 0.55 (0.31 to 0.99) 0.46 (0.30 to 0.70) 0.60 (0.27 to 1.34) 0.54 (0.27 to 1.08)
25–29 0.32 (0.21 to 0.50) 0.15 (0.08 to 0.3) 0.17 (0.07 to 0.41) 0.19 (0.11 to 0.33) 0.24 (0.16 to 0.36) 0.30 (0.13−0.64) 0.45 (0.23 to 0.89)
30+ 0.14 (0.09 to 0.21) 0.06 (0.03 to 0.11) 0.07 (0.03 to 0.17) 0.08 (0.05 to 0.14) 0.09 (0.86 to 0.14) 0.14 (0.06 to 0.30) 0.18 (0.09 to 0.35)
Place of residence
Urban 1 1 1 1 1 1 1
Rural 0.77 (0.7 to 0.8) 0.94 (0.84 to 1.06) 0.60 (0.5 to 0.7) 0.8 (0.67 to 0.93) 0.7 (0.62 to 0.8) 0.74 (0.6 to 0.93) 0.46 (0.36 to 0.59)
Mother’s education
No education 1 1 1 1 1 1 1
Primary 2.3 (1.5 to 3.5) 2.0 (1.2 to 3.9) 0.97 (0.6 to 1.5) 3.4 (1.9 to 6.2) 2.5 (1.6 to 3.7) 2.0 (0.8 to 5.3) 1.9 (1.3 to 2.9)
Secondary 4.0 (2.6 to 6.1) 4.4 (2.4 to 8.2) 1.8 (1.1 to 2.8) 5.7 (3.1 to 10.3) 4.8 (3.2 to 7.2)) 3.2 (1.2 to 8.3) 4.0 (2.8 to 5.8)
Higher 5.6 (3.7 to 8.7) 4.7 (2.5 to 8.8) 2.4 (1.4 to 3.9) 8.0 (4.2 to 15.2) 7.6 (5.0 to 11.7) 6.2 (2.3 to 16.6) 8.9 (5.6 to 14.4)
Father’s education
No education 1 1 1 1 1 1 1
Primary 3.0 (1.7 to 5.1) 1.7 (0.9 to 3.0) 0.9 (0.5 to 1.62) 2.1 (1.2 to 3.9) 1.9 (1.2 to 2.8) 1.4 (0.6 to 3.4) 2.4 (1.4 to 4.2)
Secondary 4.8 (2.8 to 8.2) 2.9 (1.6 to 5.3) 1.2 (0.7 to 2.2) 3.7 (2.0 to 6.6) 2.9 (2.0 to 4.4) 2.3 (1.0 to 5.6) 4.6 (2.7 to 7.7)
Higher 5.3 (3.8 to 9.2) 3.1 (1.7 to 5.7) 1.3 (0.7 to 2.5) 5.1 (2.7 to 9.6) 3.9 (2.6 to 6.0) 3.5 (1.4 to 8.9) 6.4 (3.6 to 11.5)
Mother’s occupation
Not working outside
home
1 1 1 1 1 1 1
Skilled 0.9 (0.8 to 1.1) 1.1 (0.9 to 1.2) 1.2 (0.9 to 1.5) 1.0 (0.8 to 1.2) 1.2 (1.1 to 1.4) 1.1 (0.8 to 1.4) 1.3 (1.0 to 1.8)
Agriculture 0.6 (0.5 to 0.7) 0.7 (0.5 to 0.9) 0.7 (0.5 to 0.8) 0.5 (0.4 to 0.6) 0.5 (0.4 to 0.7) 0.5 (0.3 to 0.7) 0.3 (0.2 to 0.4)
Unskilled/others 0.6 (0.53 to 0.7) 1.2 (0.9 to 1.4) 0.8 (0.7 to 1.1) 0.7 (0.5 to 1.0) 0.8 (0.6 to 1.04) 0.7 (0.45 to 1.1) 0.2 (0.1 to 0.4)
Father’s occupation
Not working 1 1 1 1 1 1 1
Skilled work 1.2 (0.7 to 1.8) 1.3 (0.8 to 2.2) 0.7 (0.3 to 1.4) 2.2 (0.9 to 5.4) 1.1 (0.7 to 1.7) 0.9 (0.5 to 1.5) 1.4 (0.8 to 2.4)
Agriculture 0.7 (0.5 to 1.2) 1.0 (0.6 to 1.6) 0.4 (0.2 to 0.8) 1.2 (0.5 to 3.0) 0.6 (0.4 to 1.0) 0.4 (0.3 to 08) 0.5 (0.3 to 0.9)
Unskilled others 0.9 (0.6 to 1.5) 1.3 (0.8 to 2.0) 0.6 (0.3 to 1.3) 1.9 (0.8 to 4.8) 0.9 (0.6 to 1.5) 0.8 (0.4 to 1.4) 1.3 (0.8 to 2.2)
Wealth quintile
Poorest 1 1 1 1 1 1 1
Poorer 1.5 (1.3 to 1.8) 1.5 (1.2 to 1.9) 1.5 (1.2 to 1.9) 1.3 (1.1 to 1.6) 1.7 (1.4 to 2.0) 1.5 (1.0 to 1.8) 2.5 (1.8 to 3.5)
Middle 1.8 (1.5 to 2.0) 1.6 (1.3 to 2.0) 1.7 (1.3 to 2.2) 1.6 (1.2 to 2.0) 1.6 (1.3 to 2.0) 2.0 (1.4 to 2.7) 3.2 (2.2 to 4.5)
Richer 1.8 (1.5 to 2.1) 1.8 (1.5 to 2.2) 1.9 (1.4 to 2.6) 1.7 ((1.3 to 2.2) 2.3 (1.9 to 2.8) 2.2 (1.5 to 3.1) 3.9 (2.6 to 5.9)
Richest 1.7 (1.4 to 2.0) 1.9 (1.5 to 2.3) 1.8 (1.4 to 2.5) 1.6 (1.2 to 2.0) 2.2 (1.7 to 2.8) 2.0 (1.2 to 3.3) 3.0 (1.9 to 5.2)
Frequency of listening to the radio/reading newspapers/magazines
Not at all 1 1 1 1 1 1 1
Less than once a
week
0.9 (0.6 to 1.4) 2.0 (1.3 to 3.2) 1.3 (0.8 to 2.1) 1.8 (0.9 to 3.7) 1.7 (1.1 to 2.5) 2.6 (1.0 to 6.8) 4.6 (1.9 to 11.2)
At least once a week 1.7 (1.4 to 2.0) 1.8 (1.4 to 2.2) 1.5 (1.2 to 1.8) 1.4 (1.1 to 1.9) 2.0 (1.7 to 2.4) 1.6 (1.2 to 2.0) 2.7 (2.0 to 3.5)
Continued
6TripathiV,Singh
R.BMJOpen
2017;7:e013408.doi:10.1136/bmjopen-2016-013408
OpenAccess
on 10 July 2018 by guest. Protected by copyright. http://bmjopen.bmj.com/ BMJ Open: first published as 10.1136/bmjopen-2016-013408 on 3 February 2017. Downloaded from
those not working, those engaged in skilled work andunskilled work. The usage of ANC services increases sig-nificantly by one-and-a-half to two times for those inpoorer to richest wealth quintiles across all regionsexcepts Western New Guinea where it increases fromtwo-and-a-half times to four times for those in poorer torichest quintiles compared with those in the poorestwealth quintile. The usage of ANC services in Sumatra,Lesser Sunda Islands and Kalimantan regions is notassociated with listening to the radio and/or readingnewspapers and magazines less than once a week com-pared with not listening to the radio or reading newspa-pers at all. Those listening to the radio and/or readingnewspapers and magazines at least once a week useANC services one-and-a-half to two times more thanthose who do not across all regions except in theWestern New Guinea region, where ANC usageincreases significantly by almost four-and-a-half times(OR 4.6, 95% CI 1.9 to 11.2). As birth order increasesfrom the first to third birth order, mothers show greaterawareness and use ANC services compared with the firstbirth order across all regions. However, ANC usageshows a decreasing trend with the fourth and fifth andabove birth order. Those who reported the status ofchild at birth as dead did not use ANC services com-pared with those whose child was alive at birth.
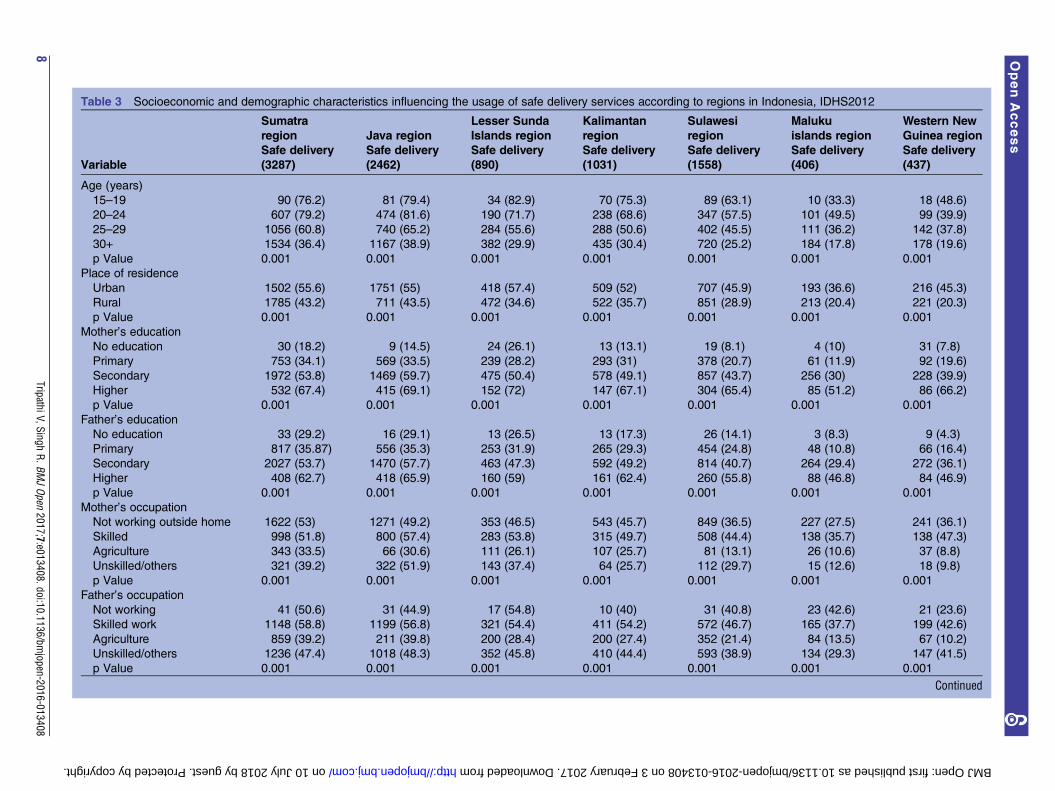
Population characteristics of study population for safedeliveryThe total number of safe deliveries in Indonesia in the3 years preceding the survey is 10 071 or 42.3% of thetotal burden of deliveries in Indonesia. These comprised3287 births in the Sumatra region, 2462 births in theJava region, 890 births in the Lesser Sunda Islandsregion, 1031 births in Kalimantan, 1558 births inSulawesi, 406 births in the Maluku Islands and 437births in the Western New Guinea islands. Table 3 showsthe number of mothers in a particular category usingsafe delivery services with the accompanying percentageof the total number of mothers in that category. Mostmothers who used safe delivery services were aged over30 years. More safe deliveries occurred in rural ratherthan urban places of residence except in Java where itwas the opposite. Most mothers and fathers were edu-cated up to the secondary level. Most mothers were notworking outside the home and most fathers wereengaged in skilled work in Java, Kalimantan, Malukuand Western New Guinea islands, while they wereengaged in unskilled or other work in Sumatra, LowerSunda and Sulawesi islands. Most families were in therichest quintile in the Java islands, in the poorer wealthquintile in Sumatra islands and in the poorest wealthquintile in the rest of the five regions. Most motherswho used safe delivery services listened to the radio,read newspapers/magazines at least once a week. Mostsafe deliveries were of the first birth order and most chil-dren were reported to be alive.
Table
2Co
ntinued
Sumatraregion
Javaregion
LesserSunda
Islandsregion
Kalimantan
region
Sulawesiregion
Malukuislands
region
Western
New
Guinearegion
Variable
OR
and95%
CI
OR
and95%
CI
OR
and95%
CI
OR
and95%
CI
OR
and95%
CI
OR
and95%
CI
OR
and95%
CI
Birth
order
First
11
11
11
1
Second
1.6
(1.5
to1.8)
1.9
(1.6
to2.0)
1.3
(1.0
to1.6)
1.4
(1.1
to1.6)
1.4
(1.2
to1.7)
1.0
(0.8
to1.5)
1.1
(0.8
to1.5)
Third
1.9
(1.7
to2.2)
1.9
(1.6
to2.3)
1.7
(1.3
to2.2)
1.5
(1.2
to1.9)
1.5
(1.2
to1.8)
1.6
(1.2
to2.2)
1.4
(1.0
to2.0)
Fourth
2.0
(1.6
to2.4)
1.3
(1.0
to1.7)
1.6
(1.1
to2.2)
1.4
(1.0
to1.9)
1.6
(1.2
to1.9)
1.3
(0.9
to1.9)
1.2
(0.8
to1.8)
Fifth
andabove
1.2
(1.0
to1.5)
1.1
(0.8
to1.5)
1.5
(1.0
to2.0)
1.1
(0.8
to1.6)
1.1
(0.9
to1.4)
1.5
(1.0
to2.0)
1.1
(0.8
to1.6)
Child
status
Dead
11
11
11
1
Alive
6.3
(4.4
to8.8)
3.4
(2.5
to4.7)
3.8
(2.5
to5.9)
43(2.7
to6.8)
5(3.5
to7.1)
4.4
(2.4
to8.1)
2.6
(1.6
to4.1)
Tripathi V, Singh R. BMJ Open 2017;7:e013408. doi:10.1136/bmjopen-2016-013408 7
on 10 July 2018 by guest. Protected by copyright. http://bmjopen.bmj.com/ BMJ Open: first published as 10.1136/bmjopen-2016-013408 on 3 February 2017. Downloaded from
on 10 July 2018 by guest. Protected by copyright. http://bmjopen.bmj.com/ BMJ Open: first published as 10.1136/bmjopen-2016-013408 on 3 February 2017. Downloaded from
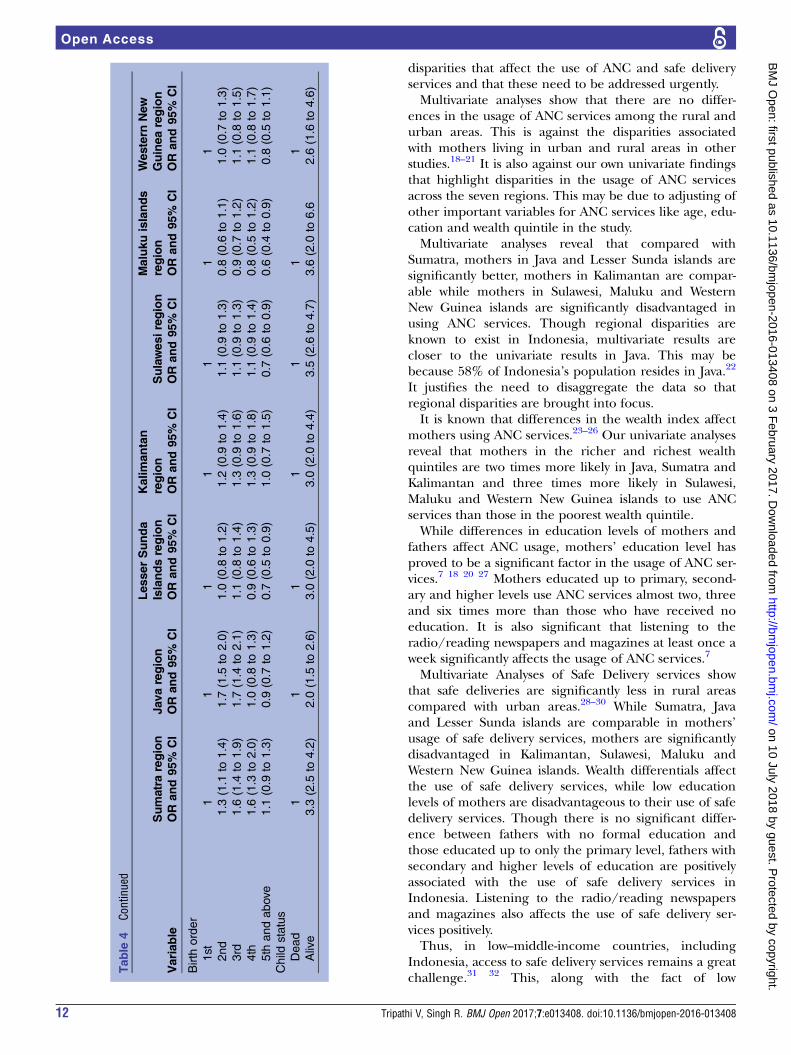
Univariate analyses for safe delivery servicesTable 4 presents the results of univariate analyses ofsocioeconomic and demographic characteristics of safedelivery according to seven regions in Indonesia.Mothers who are 25 years and older have significantlyless chances of safe delivery compared with those in the15–19 age group in Sumatra, Java, Lesser Sunda Islands,Kalimantan and Sulawesi, while in Maluku and WesternNew Guinea islands, mothers over 30 are less likely tohave safe delivery. Mothers living in rural places of resi-dence have significantly less chances of safe deliverywhen compared with those in urban places of residencein Sumatra, Java, Lesser Sunda Islands, Kalimantan,Sulawesi, Maluku Islands and Western New Guineaislands, respectively. The chances of safe delivery formothers with primary and secondary and above leveleducation increase by 2–23 times in Sumatra, Java,Kalimantan, Sulawesi and Western New Guinea islands,respectively, when compared with mothers with noformal education. Fathers’ education to secondary andhigher levels significantly increases the chances of safedelivery compared with those fathers with no formaleducation. In Kalimantan, Sulawesi and Western NewGuinea, even up to primary level education of fathersshows significant difference in the usage of safe deliveryservices compared with fathers with no formal educa-tion. Mothers engaged in agriculture are at a disadvan-tage in all regions compared with mothers not workingoutside the home. However, mothers engaged in skilledwork are significantly advantaged in using safe deliveryservices across all regions. Mothers who are in unskilledor other jobs are at a significant disadvantage in havingsafe delivery except in the Java region where there is nodifference between unskilled/others and those notworking outside the home (OR 1.1, 95% CI 0.9 to 1.3).Fathers who are in agriculture are at a statistically signifi-cant disadvantage compared with those not working inensuring safe delivery in all regions except theKalimantan and Java regions. Fathers engaged in skilledwork are at an advantage in all regions except theMaluku Islands region (OR 0.8, 95% CI 0.5 to 1.4),though this association is not significant. Fathersengaged in unskilled work use safe delivery services onpar with those not working except in the Western NewGuinea region where they are two times more likely tohave safe delivery (OR 2.3, 95% CI 1.3 to 4.0). As thewealth index increases, safe deliveries increase from twoto eight times in all regions. Those listening to the radioand/or reading newspapers and magazines less thanonce a week or at least once a week are more likely tohave safe deliveries by about two to four times comparedwith those who do not, except in the Sumatra region. InSumatra, as birth order increases from the first to fourthbirth order, mothers use safe delivery services, thoughthere is no difference for the fifth and above birth ordercompared with the first birth order. In Java, there is asignificant difference from the first to third, but there isno difference for the fourth and fifth and above birth
order. In Lesser Sunda islands, Sulawesi and Malukuislands, there is no significant difference between thefirst four birth orders, but there is a significant decline(30–40%) in ensuring safe deliveries for the fifth andabove birth order. In Kalimantan and Western NewGuinea islands, there is no difference between the firstand higher birth orders. Those who reported the statusof child at birth as dead did not avail safe delivery ser-vices across all regions compared with those whoreported the status of the child as alive at birth.
Multivariate analysesFindings of selected socioeconomic and demographicpredictors related to ANC coverage and safe delivery ser-vices after adjusting mother’s age at childbirth, mother’soccupation, father’s occupation, frequency of listeningto the radio/reading newspapers/magazines, birthorder and child status are presented in table 5. Mothersresiding in rural areas are only slightly more likely (OR1.02, 95% CI 0.95 to 1.1) to receive ANC than thoseliving in urban areas. However, mothers living in ruralareas are 14% less likely (OR 0.86, 95% CI 0.80 to 0.92)to have safe delivery compared with those in urbanareas. Different regions show significant differences inthe usage of ANC. ANC usage is significantly more inJava and Lesser Sunda Islands, compared with theSumatra and Kalimantan regions. Safe delivery servicesshow no difference in Java and Lesser Sunda Islands butare significantly less in Kalimantan, Sulawesi, MalukuIslands and Western New Guinea islands when com-pared with the Sumatra region. An increase in thewealth index ensures better usage of ANC and safe deliv-ery services. Mother’s education and father’s educationhave comparable and significant roles in the usage ofANC services and in ensuring safe delivery. No formaleducation is a disadvantage in the usage of ANC andsafe delivery services, while higher than secondary leveleducation of mothers is an advantage in the usage ofANC services (OR 6.2, 95% CI 4.87 to 7.85) and ensur-ing safe delivery (OR 10.37, 95% CI 8.06 to 13.3).Listening to the radio/reading newspapers and maga-zines at least once a week has an impact on usage ofANC and safe delivery services. However, listening to theradio/reading newspapers less than once a week has animpact on safe delivery but not on ANC services wherenot listening to the radio/reading newspapers andmagazines or listening to the radio/reading newspapersand magazines less than once a week makes nodifference.
DISCUSSIONThis study examines the factors that affect the usage ofANC and safe delivery services in Indonesia. SinceIndonesia is geographically spread over a wide area,there are regional disparities in the usage of ANC andsafe delivery services across its many islands. Our studyproves that there are socioeconomic and demographic
10 Tripathi V, Singh R. BMJ Open 2017;7:e013408. doi:10.1136/bmjopen-2016-013408
Table 4 Univariate analyses of socioeconomic and demographic factors influencing the usage of safe delivery services according to regions in Indonesia, IDHS-2012
Sumatra region Java region
Lesser Sunda
Islands region
Kalimantan
region Sulawesi region
Maluku islands
region
Western New
Guinea region
Variable OR and 95% CI OR and 95% CI OR and 95% CI OR and 95% CI OR and 95% CI OR and 95% CI OR and 95% CI
Age (years)
15–19 1 1 1 1 1 1 1
20–24 1.2 (0.8 to 1.9) 1.1 (0.7 to 1.9) 0.5 (0.2 to 1.2) 0.7 (0.4 to 1.2) 0.8 (0.5 to 1.2) 2.0 (0.9 to 4.4) 0.7 (0.4 to 1.4)
25–29 0.5 (0.3 to 0.7) 0.5 (0.3 to 0.8) 0.3 (0.1 to 0.6) 0.3 (0.2 to 0.6) 0.5 (0.3 to 0.7) 1.1 (0.5 to 2.5) 0.6 (0.3 to 1.3)
30+ 0.2 (0.1 to 0.3) 0.2 (0.1 to 0.3) 0.1 (0.04 to 0.2) 0.1 (0.09 to 0.2) 0.2 (0.1 to 0.3) 0.4 (0.2 to 0.9) 0.3 (0.1 to 0.5)
Place of residence
Urban 1 1 1 1 1 1 1
Rural 0.6 (0.5 to 0.7) 0.6 (0.56 to 0.71) 0.4 (0.3 to 0.5) 0.5 (0.4 to 0.6) 0.5 (0.4 to 0.5) 0.4 (0.3 to 0.6) 0.3 (0.2 to 0.47)
Mother’s education
No education 1 1 1 1 1 1 1
Primary 2.3 (1.6 to 3.5) 3.0 (1.5 to 6.0) 1.1 (0.7 to 1.8) 3.0 (1.6 to 5.4) 3.0 (1.8 to 4.8) 1.2 (0.4 to 3.5) 2.9 (1.9 to 4.4)
Secondary 5.2 (3.5 to 7.8) 8.7 (4.0 to 17.7) 2.9 (1.8 to 4.7) 6.4 (3.5 to 11.6) 8.9 (5.5 to 14.3) 3.9 (1.4 to 11.0) 7.8 (5.2 to 11.7)
Higher 9.3 (6.1 to 14.2) 13.0 (6.0 to 27.0) 7.3 (4.0 to 12.7) 13.5 (7.0 to 25.8) 21.6 (13 to 35.8) 9.4 (3.2 to 27.7) 23.0 (13.7 to 38.7)
Father’s education
No education 1 1 1 1 1 1 1
Primary 1.4 (0.9 to 2.0) 1.3 (0.7 to 2.4) 1.3 (0.7 to 2.5) 2.0 (1.1 to 3.7) 2.0 (1.3 to 3.0) 1.3 (0.4 to 4.5) 4.4 (2.0 to 8.9)
Secondary 2.8 (1.9 to 4.2) 3.3 (1.8 to 5.9) 2.5 (1.3 to 4.8) 4.6 (2.5 to 8.5) 4.0 (2.7 to 6.4) 4.6 (1.4 to 15) 12.5 (6.0 to 24.9)
Higher 4.0 (2.6 to 6.3) 4.7 (2.6 to 8.6) 4.0 (2.0 to 7.9) 8.0 (4.1 to 15.1) 7.7 (4.9 to 12.0) 9.7 (3.0 to 32) 20.0 (9.0 to 40.8)
Mother’s occupation
Not working 1 1 1 1 1 1 1
Skilled 1.0 (0.9 to 1.1) 1.4 (0.3 to 0.6) 1.3 (1.1 to 1.7) 1.2 (1.0 to 1.4) 1.4 (1.2 to 1.6) 1.5 (1.1 to 1.9) 1.6 (1.2 to 2.0)
Agriculture 0.95 (0.40 to 0.5) 0.5 (0.3 to 0.6) 0.4 (0.3 to 0.5) 0.4 (0.3 to 0.5) 0.3 (0.2 to 0.3) 0.3 (0.2 to 0.5) 0.2 (0.1 to 0.2)
Unskilled/others 0.60 (0.5 to 0.7) 1.1 (0.9 to 1.3) 0.7 (0.5 to 0.9) 0.5 (0.4 to 0.8) 0.7 (0.6 to 0.9) 0.4 (0.2 to 0.7) 0.2 (0.1 to 0.3)
Father’s occupation
Not working 1 1 1 1 1 1 1
Skilled work 1.4 (0.9 to 2.2) 1.6 (1.0 to 2.6) 1.0 (0.5 to 2.3) 1.2 (1.0 to 1.4) 1.4 (1.2 to 1.6) 0.8 (0.5 to 1.4) 2.4 (1.4 to 4.0)
Agriculture 0.6 (0.4 to 0.9) 0.8 (0.5 to 1.3) 0.3 (0.2 to 0.7) 0.4 (0.3 to 0.5) 0.3 (0.2 to 0.3) 0.2 (0.1 to 0.4) 0.4 (0.2 to 0.6)
Unskilled others 0.9 (0.6 to 1.4) 1.1 (0.7 to 1.9) 0.7 (0.3 to 1.4) 0.5 (0.4 to 0.8) 0.7 (0.6 to 0.9) 0.6 (0.3 to 1.0) 2.3 (1.3 to 4.0)
Wealth quintile
Poorest 1 1 1 1 1 1 1
Poorer 1.7 (1.5 to 2.0) 1.9 (1.5 to 2.3) 2.0 (1.6 to 2.5) 1.6 (1.3 to 2.0) 2.3 (1.9 to 2.7) 2.2 (1.6 to 3.0) 3.4 (2.4 to 4.7)
Middle 2.1 (1.8 to 2.4) 2.3 (1.8 to 2.9) 2.9 (2.2 to 3.9) 2.5 (2.0 to 3.0) 2.9 (2.4 to 3.4) 4.5 (3.0 to 6.3) 5.1 (3.6 to 7.2)
Richer 2.2 (1.9 to 2.6) 2.7 (2.2 to 3.4) 3.7 (2.7 to 5.0) 2.7 (2.0 to 3.6) 4.4 (3.5 to 5.4) 6.1 (4.2 to 8.9) 8.2 (5.4 to 12.2)
Richest 2.4 (2.0 to 2.8) 3.3 (2.6 to 4.0) 3.8 (2.8 to 5.1) 3.0 (2.2 to 4.0) 3.8 (3.0 to 4.8) 5.9 (3.5 to 10.0) 4.9 (3.0 to 7.9)
Frequency of listening to the radio/reading newspapers/magazines
Not at all 1 1 1 1 1 1 1
Less than once a week 1.0 (0.7 to 1.5) 2.6 (1.7 to 3.9) 1.8 (1.1 to 2.9) 2.5 (1.2 to 5.3) 1.9 (1.2 to 2.8) 5.6 (2.2 to 14.6) 5.8 (2.4 to 14.2)
At least once a week 1.8 (1.6 to 2.2) 2.2 (1.7 to 2.7) 2.3 (1.9 to 2.8) 2.0 (1.5 to 2.6) 2.9 (2.4 to 3.6) 1.8 (1.4 to 2.4) 4.2 (3.3 to 5.3)
Continued
TripathiV,SinghR.BM
JOpen
2017;7:e013408.doi:10.1136/bmjopen-2016-013408
11
OpenAccess
on 10 July 2018 by guest. Protected by copyright. http://bmjopen.bmj.com/ BMJ Open: first published as 10.1136/bmjopen-2016-013408 on 3 February 2017. Downloaded from
disparities that affect the use of ANC and safe deliveryservices and that these need to be addressed urgently.Multivariate analyses show that there are no differ-
ences in the usage of ANC services among the rural andurban areas. This is against the disparities associatedwith mothers living in urban and rural areas in otherstudies.18–21 It is also against our own univariate findingsthat highlight disparities in the usage of ANC servicesacross the seven regions. This may be due to adjusting ofother important variables for ANC services like age, edu-cation and wealth quintile in the study.Multivariate analyses reveal that compared with
Sumatra, mothers in Java and Lesser Sunda islands aresignificantly better, mothers in Kalimantan are compar-able while mothers in Sulawesi, Maluku and WesternNew Guinea islands are significantly disadvantaged inusing ANC services. Though regional disparities areknown to exist in Indonesia, multivariate results arecloser to the univariate results in Java. This may bebecause 58% of Indonesia’s population resides in Java.22
It justifies the need to disaggregate the data so thatregional disparities are brought into focus.It is known that differences in the wealth index affect
mothers using ANC services.23–26 Our univariate analysesreveal that mothers in the richer and richest wealthquintiles are two times more likely in Java, Sumatra andKalimantan and three times more likely in Sulawesi,Maluku and Western New Guinea islands to use ANCservices than those in the poorest wealth quintile.While differences in education levels of mothers and
fathers affect ANC usage, mothers’ education level hasproved to be a significant factor in the usage of ANC ser-vices.7 18 20 27 Mothers educated up to primary, second-ary and higher levels use ANC services almost two, threeand six times more than those who have received noeducation. It is also significant that listening to theradio/reading newspapers and magazines at least once aweek significantly affects the usage of ANC services.7
Multivariate Analyses of Safe Delivery services showthat safe deliveries are significantly less in rural areascompared with urban areas.28–30 While Sumatra, Javaand Lesser Sunda islands are comparable in mothers’usage of safe delivery services, mothers are significantlydisadvantaged in Kalimantan, Sulawesi, Maluku andWestern New Guinea islands. Wealth differentials affectthe use of safe delivery services, while low educationlevels of mothers are disadvantageous to their use of safedelivery services. Though there is no significant differ-ence between fathers with no formal education andthose educated up to only the primary level, fathers withsecondary and higher levels of education are positivelyassociated with the use of safe delivery services inIndonesia. Listening to the radio/reading newspapersand magazines also affects the use of safe delivery ser-vices positively.Thus, in low–middle-income countries, including
Indonesia, access to safe delivery services remains a greatchallenge.31 32 This, along with the fact of low
Table
4Co
ntinued
Sumatraregion
Javaregion
LesserSunda
Islandsregion
Kalimantan
region
Sulawesiregion
Malukuislands
region
Western
New
Guinearegion
Variable
OR
and95%
CI
OR
and95%
CI
OR
and95%
CI
OR
and95%
CI
OR
and95%
CI
OR
and95%
CI
OR
and95%
CI
Birth
order
1st
11
11
11
1
2nd
1.3
(1.1
to1.4)
1.7
(1.5
to2.0)
1.0
(0.8
to1.2)
1.2
(0.9
to1.4)
1.1
(0.9
to1.3)
0.8
(0.6
to1.1)
1.0
(0.7
to1.3)
3rd
1.6
(1.4
to1.9)
1.7
(1.4
to2.1)
1.1
(0.8
to1.4)
1.3
(0.9
to1.6)
1.1
(0.9
to1.3)
0.9
(0.7
to1.2)
1.1
(0.8
to1.5)
4th
1.6
(1.3
to2.0)
1.0
(0.8
to1.3)
0.9
(0.6
to1.3)
1.3
(0.9
to1.8)
1.1
(0.9
to1.4)
0.8
(0.5
to1.2)
1.1
(0.8
to1.7)
5th
andabove
1.1
(0.9
to1.3)
0.9
(0.7
to1.2)
0.7
(0.5
to0.9)
1.0
(0.7
to1.5)
0.7
(0.6
to0.9)
0.6
(0.4
to0.9)
0.8
(0.5
to1.1)
Child
status
Dead
11
11
11
1
Alive
3.3
(2.5
to4.2)
2.0
(1.5
to2.6)
3.0
(2.0
to4.5)
3.0
(2.0
to4.4)
3.5
(2.6
to4.7)
3.6
(2.0
to6.6
2.6
(1.6
to4.6)
12 Tripathi V, Singh R. BMJ Open 2017;7:e013408. doi:10.1136/bmjopen-2016-013408
household health insurance coverage and highout-of-pocket spending on health, impedes universalhealth coverage.33 These need to be corrected furtherbecause regional and wealth inequalities affect maternalmortality and U5M in Indonesia.
CONCLUSIONWe surmise that ANC services have increased nominallyfrom the last IDHS survey. However, since it is still not100%, we need to look at factors affecting poor coverageby ANC and safe delivery services. Poor usage of theseservices is related to a complex set of social and demo-graphic factors that affect the use, accessibility, afford-ability and perception about the need and utility of suchservices.34–36 While being poor with no formal educationwas a deterrent to accessing ANC services, the odds ofusing ANC and safe delivery services were significantlyless in the Sulawesi, Maluku and Western New Guineaislands. This means that the areas covered by trainednurses/midwives are increased and special incentives are
offered to train women social workers in the Sulawesi,Maluku and Western New Guinea islands. The studyrecommends that disaggregated regional targets be setso as to further reduce maternal mortality rates inIndonesia.
Contributors VT and RS conceived and designed the study, analysed thedata, and equally contributed and reviewed drafts of the paper.
Funding This research received no specific grant from any funding agency inthe public, commercial or not-for-profit sectors.
Competing interests None declared.
Provenance and peer review Not commissioned; externally peer reviewed.
Data sharing statement The DHS website provides access to data onsubmission and approval for a proposal of study: http://dhsprogram.com/data/new-user-registration.cfm.
Open Access This is an Open Access article distributed in accordance withthe Creative Commons Attribution Non Commercial (CC BY-NC 4.0) license,which permits others to distribute, remix, adapt, build upon this work non-commercially, and license their derivative works on different terms, providedthe original work is properly cited and the use is non-commercial. See: http://creativecommons.org/licenses/by-nc/4.0/
Table 5 Multivariate analyses of selected socioeconomic predictors for complete antenatal care coverage and safe delivery
services in Indonesia
Antenatal care Safe delivery
Variable OR 95% CI p Value OR 95% CI p Value
Place of residence
Urban 1.0 1.0
Rural 1.02 0.95 to 1.10 0.58 0.86 0.80 to 0.92 0.001
Region
Sumatra 1 – – 1 – –
Java 1.50 1.32 to 1.59 0.001 0.99 0.90 to 1.08 0.80
Lesser Sunda Islands 1.22 1.08 to 1.37 0.001 0.96 0.86 to 1.09 0.54
Kalimantan 1.07 0.96 to 1.20 0.23 0.79 0.71 to 0.08 0.001
Sulawesi 0.76 0.70 to 0.83 0.001 0.56 0.51 to 0.61 0.001
Maluku Islands 0.56 0.49 to 0.64 0.001 0.30 0.26 to 0.35 0.001
Western New Guinea 0.46 0.40 to 0.54 0.001 0.44 0.38 to 0.51 0.001
Wealth quintile
Poorest 1 – – 1 –
Poorer 1.45 1.32 to 1.60 0.001 1.64 1.50 to 1.80 0.001
Middle 1.57 1.42 to 1.74 0.001 1.89 1.70 to 2.10 0.001
Richer 1.75 1.56 to 1.96 0.001 2.02 1.81 to 2.26 0.001
Richest 1.52 1.33 to 1.73 0.001 1.72 1.51 to 1.96 0.001
Mother’s education
No education 1 – – 1 – –
Primary 1.85 1.51 to 2.27 0.001 2.06 1.65 to 2.56 0.001
Secondary 2.94 2.40 to 3.63 0.001 3.98 3.19 to 4.97 0.001
Higher 6.20 4.87 to 7.85 0.001 10.37 8.06 to 13.3 0.001
Father’s education
No education 1 – 1 – –
Primary 1.50 1.18 to 1.90 0.001 1.16 0.91 to 1.47 0.24
Secondary 1.81 1.43 to 2.31 0.001 1.61 1.26 to 2.05 0.001
Higher 1.79 1.37 to 2.33 0.001 1.68 1.28 to 2.20 0.001
Frequency of listening to radio/reading newspaper/magazine
Not all 1 1
Less than once a week 1.16 0.94 to 1.44 0.18 1.25 1.01 to 1.55 0.01
At least once a week 1.24 1.13 to 1.37 0.001 1.26 1.15 to 1.39 0.001
Mother’s age at childbirth, mother’s occupation, father’s occupation, birth order and child status are controlled in multivariate analyses.
Tripathi V, Singh R. BMJ Open 2017;7:e013408. doi:10.1136/bmjopen-2016-013408 13
REFERENCES1. Statistics Indonesia (Badan Pusat Statistik—BPS), National
population and family planning board (BKKBN), and KementerianKesehatan (Kemenkes- MOH), and ICF International. Indonesiademographic and health survey 2012 (IDHS 2012). Jakarta: BPS,BKKBN, Kemenkes, and ICF International, 2013.
2. United Nations. The millennium development goals report.New York: United Nations, 2015. http://www.un.org/millenniumgoals/2015_MDG_Report/pdf/MDG%202015%20rev%20( July%201).pdf(accessed 19 Oct 2016).
3. UNICEF. Committing to child survival: a promise renewed—progressreport. New York: UNICEF, 2015. http://www.apromiserenewed.org/wpcontent/uploads/2015/09/APR_2015_8_Sep_15.pdf (accessed 11Nov 2016).
4. United Nations. Transforming our world: the 2030 agenda forsustainable development. New York: United Nations, 2015. http://www.undp.org/content/dam/undp/library/corporate/brochure/SDGs_Booklet_Web_En.pdf (accessed 11 Nov 2016).
5. UNICEF Indonesia. Children in Indonesia: the early years—frombirth to 5 years old. Jakarta: UNICEF Indonesia, 2016. http://www.unicef.org/indonesia/children.html (accessed 9 Jun 2016).
6. Statistics Indonesia (Badan Pusat Statistik—BPS) and MacroInternational. Indonesia demographic and health survey 2007.Calverton, MA: BPS and Macro International, 2008.
7. Titaley CR, Dibley MJ, Roberts CL. Factors associated withunderutilization of antenatal care services in Indonesia: results ofIndonesia demographic and health survey 2002/2003 and 2007.BMC Public Health 2010;10:485.
8. Paul VK, Sachdev HS, Mavalankar D, et al. Reproductive health,and child health and nutrition in India: meeting the challenge. Lancet2011;377:332–49.
9. Singh PK, Rai RK, Alagarajan M, et al. Determinants of maternitycare services utilization among married adolescents in rural India.PLoS ONE 2012;7:e31666.
10. World Health Organisation. Provision of effective antenatal care:integrated management of pregnancy and childbirth (IMPAC).Standards for maternal and neonatal care (1.6), Department ofmaking pregnancy safer. Geneva: World Health Organisation, 2006.http://www.who.int/reproductivehealth/publications/maternal_perinatal_health/effective_antenatal_care.pdf (accessed 9 June2016).
11. World Health Organization. Making pregnancy safer: the critical roleof the skilled attendant. A joint statement by WHO, ICM and FIGO.Geneva: World Health Organization, 2004.
12. Katti V. Regional disparities in Nepal. Int Stud 1987;24:209–24.13. Sreeramareddy CT, Harsha Kumar HN, Sathian B. Time trends and
inequalities of under-five mortality in Nepal: a secondary dataanalysis of four demographic and health surveys between 1996 and2011. PLoS ONE 2013;8:e79818.
14. Harrell FE. Regression modelling strategies with application to linearmodels, logistic regression and survival analysis. Berlin:Springer-Verlag, 2001.
15. Hosmer DW Jr, Lemeshow S, Sturdivant RX. Applied logisticregression. 3rd edn. New York: John Wiley & Sons, 2013.
16. Kleinbaum DG, Kupper LL, Muller KE, et al. Applied regressionanalysis and multivariable method. 3rd edn. Belmont: DuxburyPress, 1998.
17. Correia MIT, Waitzberg DL. The impact of malnutrition on morbidity,mortality, length of hospital stay and costs evaluated through amultivariate model analysis. Clin Nutr 2003;22:235–9.
18. Agus Y, Horiuchi S. Factors influencing the use of antenatal care inrural West Sumatra, Indonesia. BMC Pregnancy Childbirth 2012;12:9.
19. Doctor HV. Intergenerational differences in antenatal care andsupervised deliveries in Nigeria. Health Place 2011;17:480–9.
20. Pallikadavath S, Foss M, Stones RW. Antenatal care: provision andinequality in rural north India. Soc Sci Med 2004;59:1147–58.
21. Ansariadi A, Manderson L, Manderson L. Antenatal care andwomen’s birthing decisions in an Indonesian setting: does locationmatter. Rural Remote Health 2015;15:2959.
22. World Population Review. Indonesia population. Walnut, CA: WorldPopulation Review, 2016. http://worldpopulationreview.com/countries/indonesia-population/ (accessed 11 Jun 2016).
23. Titaley CR, Hunter CL, Dibley MJ, et al. Why do some women stillprefer traditional birth attendants and home delivery?: a qualitativestudy on delivery care services in West Java province, Indonesia.BMC Pregnancy Childbirth 2010;10:43.
24. Simkhada B, van Teijlingen ER, Porter M, et al. Factors affecting theutilization of antenatal care in developing countries: systematicreview of the literature. J Adv Nurs 2008;61:244–60.
25. Furuta M, Salway S. Women’s position within the household as adeterminant of maternal health care use in Nepal. Int Fam PlanPerspect 2006;32:17–27.
26. Lagarde M, Haines A, Palmer N. Conditional cash transfers forimproving uptake of health interventions in low- and middle-incomecountries: a systematic review. JAMA 2007;298:1900–10.
27. Taguchi N, Kawabata M, Maekawa M, et al. Influence ofsocio-economic background and antenatal care programmes onmaternal mortality in Surabaya, Indonesia. Trop Med Int Health2003;8:847–52.
28. Ronsmans C, Scott S, Qomariyah SN, et al. Professional assistanceduring birth and maternal mortality in two Indonesian districts. BullWorld Health Organ 2009;87:416–23.
29. Thind A, Banerjee K. Home deliveries in Indonesia: who providesassistance? J Community Health 2004;29:285–303.
30. Titaley CR, Dibley MJ, Roberts CL. Factors associated withnon-utilisation of postnatal care services in Indonesia. J EpidemiolCommunity Health 2009;63:827–31.
31. Darmstadt GL, Lee AC, Cousens S, et al. 60 million non-facilitybirths: who can deliver in community settings to reduce intrapartum-related deaths? Int J Gynaecol Obstet 2009;107(Suppl 1):S89–112.
32. Titaley CR, Dibley MJ, Roberts CL, et al. Type of delivery attendant,place of delivery and risk of early neonatal mortality: analyses of the1994–2007 Indonesia Demographic and Health Surveys. HealthPolicy Plan 2012;27:405–16.
33. Harimurti P, Pambudi E, Pigazzini A, et al. NICO studies series 8:the nuts & bolds of Jamkesmas, Indonesia’s Government-financedhealth coverage program for the poor and near-poor. WashingtonDC: World Bank, 2013. http://www.indonesia-investments.com/upload/documenten/world-bank-jamkesmas-indonesia-investments.pdf (accessed 12 Jun 2016).
34. World Health Organisation. Health statistics and information systems.Geneva: World Health Organisation, 2012. http://www.who.int/gho/publications/world health statistics/2012/en/ (accessed 10 Jun 2016).
35. World Health Organisation. Levels & trends in child mortality:estimates developed by the UN inter-agency group for child mortalityestimation. Geneva: World Health Organisation, 2012. http://www.childinfo.org/files/Child Mortality Report 2012.pdf (accessed 10 Jun2016).
36. Paxton A, Wardlaw T. Are we making progress in maternal mortality?N Engl J Med 2011;364:1990–3.
14 Tripathi V, Singh R. BMJ Open 2017;7:e013408. doi:10.1136/bmjopen-2016-013408