31
Open Africa Power Business Development in Distribution Grids Marcelo Castillo Head of Business Development Global Infrastructure & Networks Enel Group July, 2021

Open Africa PowerBusiness Development in Distribution Grids
Marcelo Castillo
Head of Business Development
Global Infrastructure & Networks
Enel GroupJuly, 2021

Enel Group
470 TWh
Distributed
32Countries
74MEnd Users
18 Bn €
EBITDA
88GW
Installed Capacity
(56% RES)
45M
Smart Meters
2M km
lines
8Countries
8 Bn €
EBITDA
67kPeople
32kPeople
2
Enel
Group
Enel
GI&N
December 2020

ROMANIA
2.9 M customers
ITALY
31.4 M customers
SPAIN
12.3 M customers
BRAZIL
18.0 M customers
ARGENTINA
2.5 M customers
COLOMBIA
3.6 M customers
PERU
1.4 M customers
CHILE
2.0 M customers
GI&N International Experience
3

Platform-based business models Managing increasing levels of complexity
4
TSO
4. Sustainability
2. Value for
customers
3. Open
Innovation
1. Scale &
efficiency
Models to create value through GI&N platform
Direct investments in growing renewables,
networks and customers supporting
long term sustainable growth
Ownership business model Platforms as business enhancer
Provide key services, products or
know-how enabled by our platforms,
catalyzing investments of third parties
to maximize our and their value creation
Stewardship business model Platforms as business generator
Why a Platform?

Regulation knowledge
Innovation
Customer centricity
Pillars for a Sustainable DSO
Energy Access
Technologies
5
Resilience
Enabling electrification
6
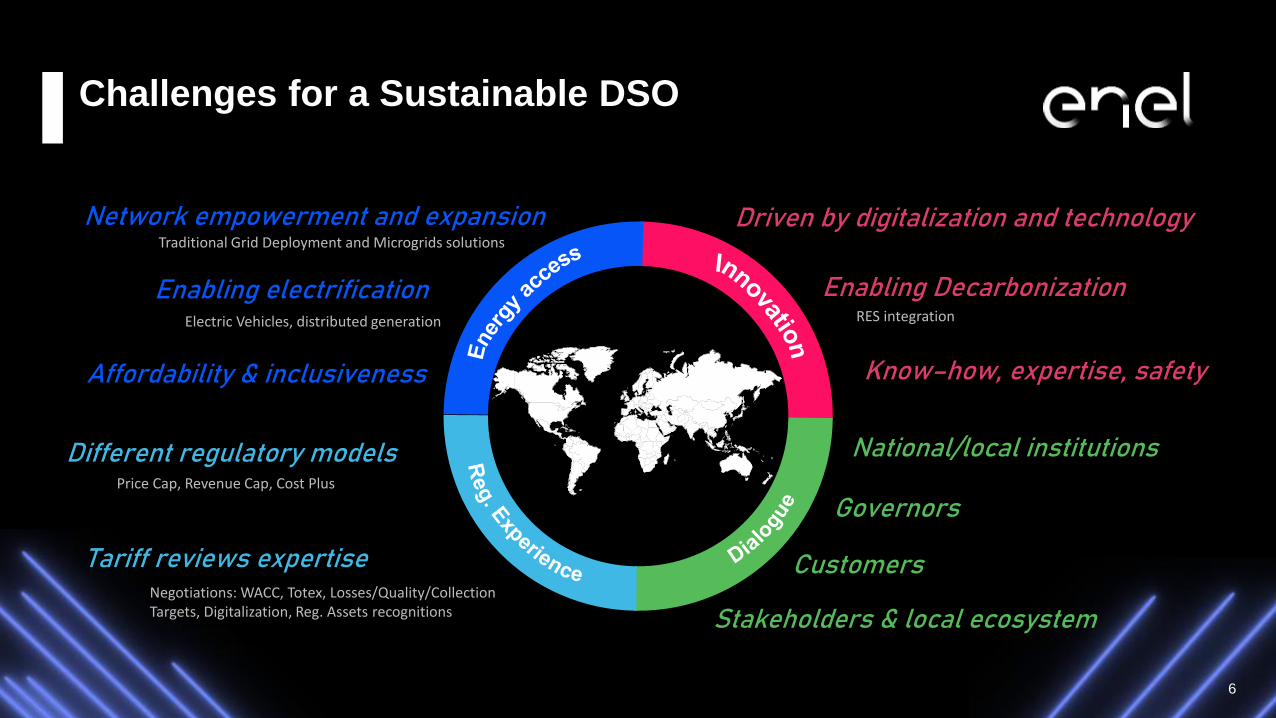
Challenges for a Sustainable DSO
Network empowerment and expansion Driven by digitalization and technology
Enabling Decarbonization
Know–how, expertise, safety
Different regulatory models
Tariff reviews expertise
National/local institutions
GovernorsPrice Cap, Revenue Cap, Cost Plus
Negotiations: WACC, Totex, Losses/Quality/CollectionTargets, Digitalization, Reg. Assets recognitions
Customers
RES integrationElectric Vehicles, distributed generation
Affordability & inclusiveness
Stakeholders & local ecosystem
Traditional Grid Deployment and Microgrids solutions

Resilient
Passionate
Disruptive
BravePioneer
Dynamic
BD profile
Analytical
Argumentative
7
Patient

What does scouting mean?
Scouting at USA’s airport Scouting in Asia Scouting in Italy
8

Sustainable business (collection and losses)
Demand growth
Rewarding regulation (profit sharing)
Room for operative improvement
Digitalization
Scouting / screening criteria
1
2
3
4
5
9

List of target
countriesCountry report List of main
stakeholdersScouting pre-valuation
Projects Phases (1/2)Scouting and screening
▪ Reg. Analysis
▪ Turnaround potential
▪ Liabilities and risk analysis
▪ Site visits
▪ Upsides
▪ Competitors’ WACC
Ou
tpu
t
Countries Analysis
1 2 3 4
▪ Macroeconomics
▪ Country risk
▪ Development Indicators
▪ Competitiveness Index
▪ Regulation
▪ Private Players and/or
Privatization
▪ Privatization Stage
▪ Mkt players
▪ Government representatives
▪ Regulator
▪ Partners and competitors
190 countries on 1st analysis
Dx sector Analysis Stakeholders engagement Deep Dive
10+30 countries screened
GO / NO GO

>30 BnEUR offered
Projects Phases (2/2)Due Diligence and Execution
Ou
tpu
t
Project team set-up
5 6 7 8
Data Room management Assumption coordination Offer submission
▪ GBL involvement
▪ Regulatory & Technical
Consultants
▪ Project timeline
▪ VDR access
▪ Q&A process
▪ Documents integrity
▪ Coordination of BL/ Countries
▪ Reg. & Mkt projections
▪ Operative parameters
▪ Potential upsides
▪ Business Plan
▪ AFC financial valuation
▪ M&A committee
▪ Offer proposal
▪ Competitor’s expected bid
Project
organizationRed flags report Assumption Book Bid submission
NBO/BO11
~200 people
Example DD project:
>50k documents
>1,3k questions Q&APreparing the Assumption Book in
coordination of > 20 other areas
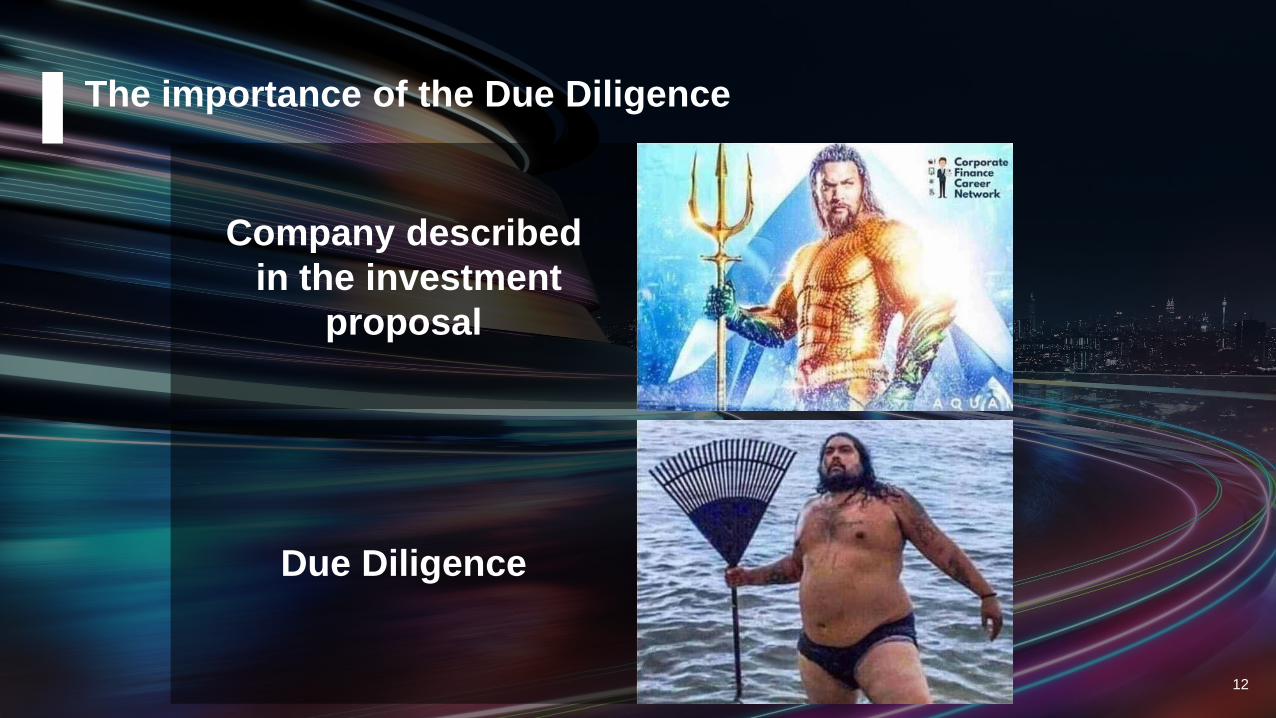
Company described
in the investment
proposal
Due Diligence
12
The importance of the Due Diligence

Experience in Regulatory Frameworks
America1,0 billion citizens
2X
National Benchmark / Conditioned pass through
>50% for Operator
30y / Permanent4y / 5y period
Yes
RAB x Reg. Rate Few years later / Ex-ant
Europe0,7 billion citizens
X
Actual cost Full pass through
50%
30 y4y / 6y period
Yes
RAB x Reg. Rate1 year later
Asia (India)1,4 billions citizens
25y3 y period
2X
3Y average Actual Cost
50%
Yes
RAB x Reg. Rate1 year later
Yes
Yes
Yes
Yes
Yes
Not yet
13
OPEX Remuneration
Investment remunerationTime to start remuneration
Regulated Rate
Profit sharing
Concession durationReg Period Length
Inflation adjustment
Commercial IncentivesQuality Incentives
Resilience Incentives No NoNo
1
2
3
4
5
6
7
8
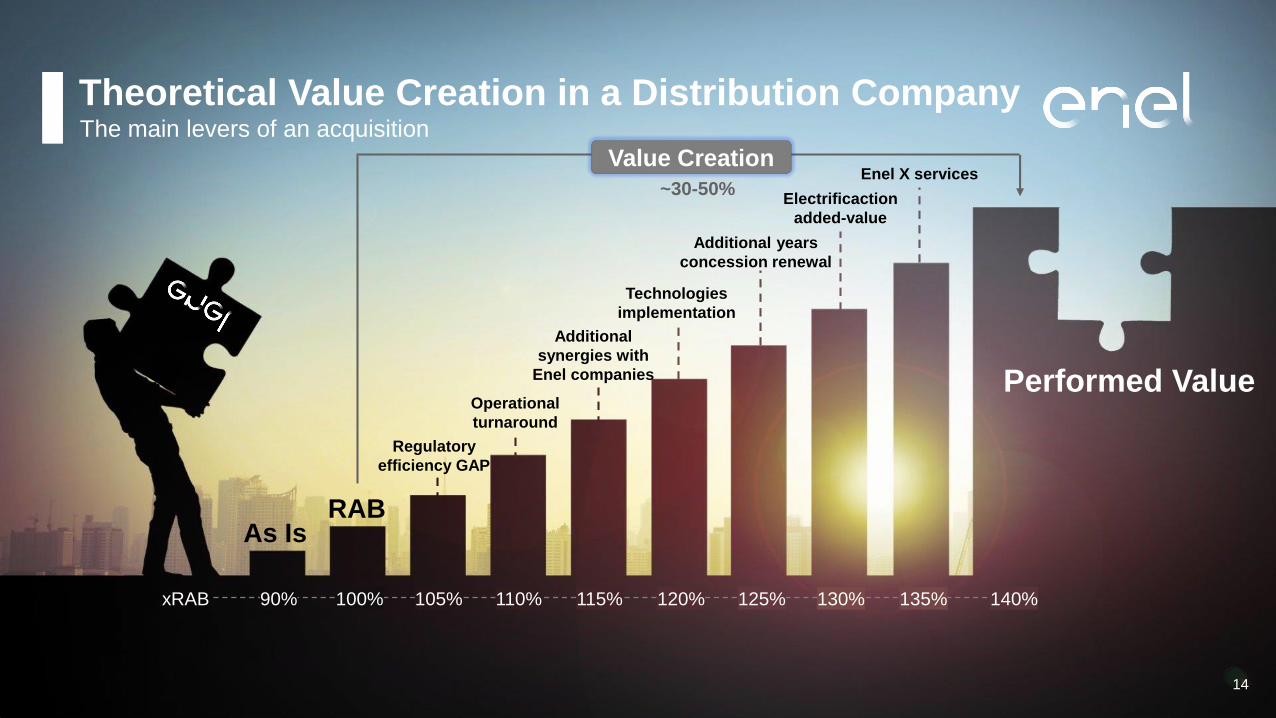
Regulatory
efficiency GAP
Theoretical Value Creation in a Distribution CompanyThe main levers of an acquisition
Operational
turnaround
Technologies
implementation
Enel X services
Additional years
concession renewal
As Is
14
Value Creation
RAB
Performed Value
Additional
synergies with
Enel companies
Electrificaction
added-value
~30-50%
90%xRAB 100% 105% 110% 115% 120% 125% 130% 135% 140%

Private investments socio-economic impactSustainable infrastructure investments
Infrastructure needs in Africa from 130-170bn$ a year with a financing gap up to ≈60%
▪ Creation of up to 20.000 new direct
jobs with 1bn$ investment in grids
(Based on private experiences, in Sub-
Saharan Africa)
Sources: McKinsey & Company, African Development Bank, others
▪ Energy transition acceleration
▪ Quality of life improvement
▪ Social education promotion
▪ Higher health/safety levels
Other benefitsJob creation impact
“Infrastructure has a socioeconomic rate of return around 20%: $1 of
investment can raise GDP by 20 cents in the long run”
15

Possible approach for success in developing countries
16
1. Public-private partnership
2. Subsidies divided between the utility, government and client
3. Ten years of stable rules
5. Involving the community from the beginning
4. Sustainable Funds with patient approach

Top 10 Megacities in 2035 – UN Data
Shanghai – CHI 34 M
Tokyo – JAP 36 M
Delhi – IND 43 M
Dhaka – BAN 31 M
Cairo –EGY28 M
Mumbai – IND 27 M
Kinshasa – CON 27M
Mexico city – MEX 25M
Beijing– CHI 25M
Private-owned
State-owned
San Paulo – BRA 24M
17

Sustainable models for colaboration
18
1
2
3
4
18
5
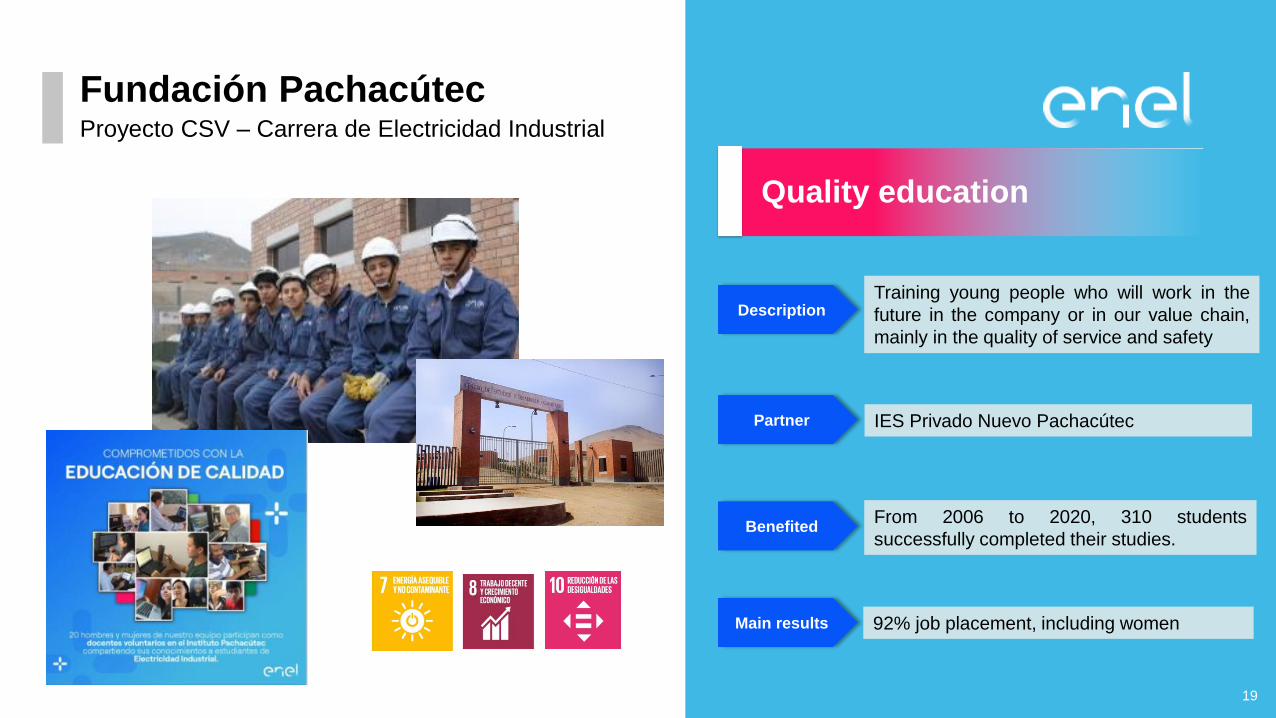
Fundación Pachacútec
19
Proyecto CSV – Carrera de Electricidad Industrial
Training young people who will work in the
future in the company or in our value chain,
mainly in the quality of service and safety
Description
Partner IES Privado Nuevo Pachacútec
BenefitedFrom 2006 to 2020, 310 students
successfully completed their studies.
92% job placement, including womenMain results
Quality education
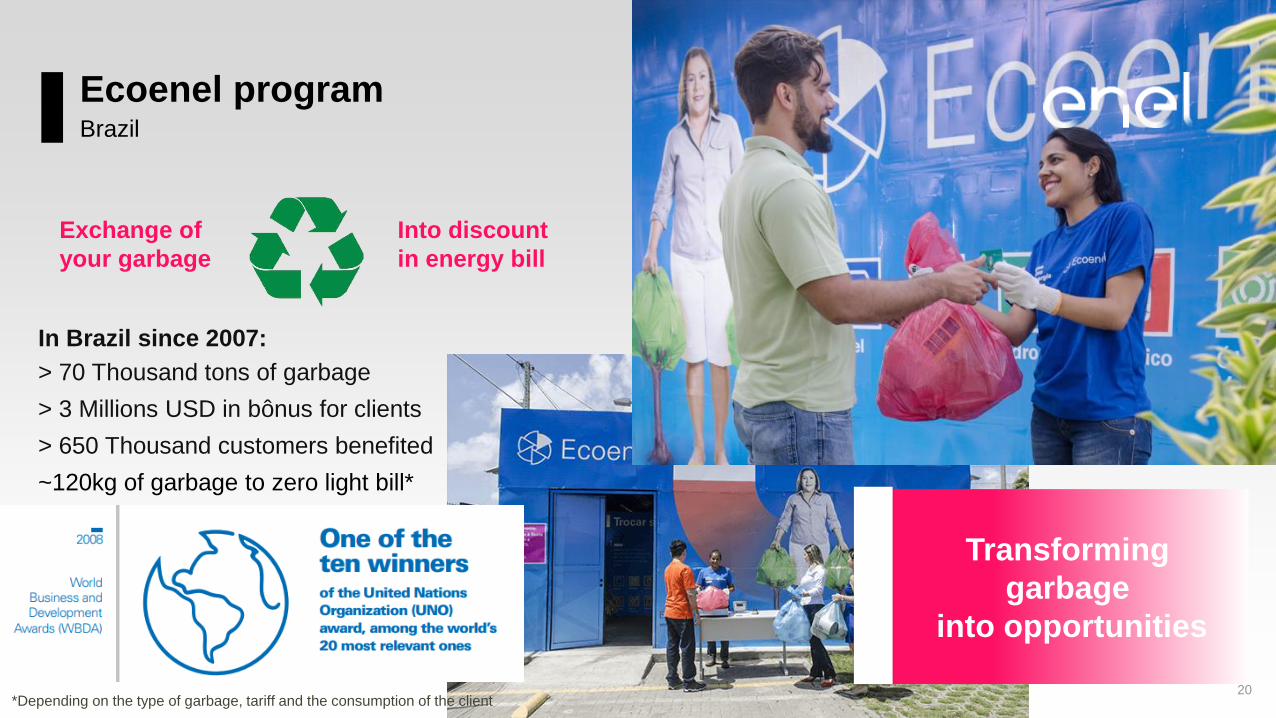
Ecoenel program
20
Brazil
In Brazil since 2007:
> 70 Thousand tons of garbage
> 3 Millions USD in bônus for clients
> 650 Thousand customers benefited
~120kg of garbage to zero light bill*
Transforming
garbage
into opportunities
Exchange of
your garbage
Into discount
in energy bill
*Depending on the type of garbage, tariff and the consumption of the client

“Luz para Todos” programBrazil
Public measures to bring electrification to remote
areas, with tariffs subsidized by the governments
and distributors
>15 Million people beneficiated in the country
21

“Tarifa Social”
22
Brazil
Public measure in which low-income
clients can have discounts in their light bill
The lower the consumption, the
greater the proportional discount

EXTERNAL WALLSUBESTATION COMPARTIR COLOMBIA
Substation Compartir Colombia
SOLID WASTE INTO FURNITURES 23
SOCIO-ECONOMIC CONTEXT
✓ The south of Bogotá and the municipality of Soacha
had a fast population growth: from 40k to 500k in
last 30yrs (DANE)
✓ High migration to the municipality as a result of the
armed conflict, displacement, search for
opportunities, residence at a lower cost and close
to the capital of the Country.
SUSTAINABILITY PLAN
1 Reforesting Soacha and Street art valorization
JAC* strengthening2
More than 700 plants planted and decoration of substation Compartir with local art
14 training sessions on politics, organizational management, project formulation
3 Photovoltaic System Lighting
Solid waste management4More than 2,500 kg of wood transformed into 743 pieces of furniture
8 poles and led lights (Danube) + 10 led lights and 38 lights switch (Tejares)
*JAC = Juntas de Accion Comunal (non-profit organizations made up of residents)
More energy for the economic development of the Region

24
Copacabana - Rio
24

25
Rio de Janeiro - Brazil
What does the cat in
the picture mean?
Spaghetti?

15,7%14,6%
12,6%
10,7%9,8%
8,0%
9,0%
10,0%
11,0%
12,0%
13,0%
14,0%
15,0%
16,0%
17,0%
Privatization y1 y2 y3 y4
Lima
20,4%18,8%
16,1%
13,6% 13,3%
19,5%
13,5%
10,5%11,4%
10,3%8,0%
10,0%
12,0%
14,0%
16,0%
18,0%
20,0%
22,0%
Privatization y1 y2 y3 y4
Santiago Bogotá
25,6%24,0%
23,0%22,0%
20,0%
26,0%
22,1%
16,2%
12,0% 11,2%9,0%
11,0%
13,0%
15,0%
17,0%
19,0%
21,0%
23,0%
25,0%
27,0%
Privatization y1 y2 y3 y4
Rio de Janeiro Buenos Aires
Losses Track Record Enel after privatization in Latam
1 2
1987
1998
1995
1996
3
1995
Energy Losses reduction in 4Y
Dx M clients Reduction
Buenos Aires (ARG) 2,5 -57%
Bogotá (COL) 3,5 -47%
Lima (PER) 1,4 -38%
Santiago (CHI) 2,0 -35%
Rio de Janeiro (BRA) 2,9 -22%
▪ Inspections
▪ Normalization
▪ Armouring
Main Actions
Today22,1% 18,9%
Today 8,8%
Today5,2% 7,6%
26
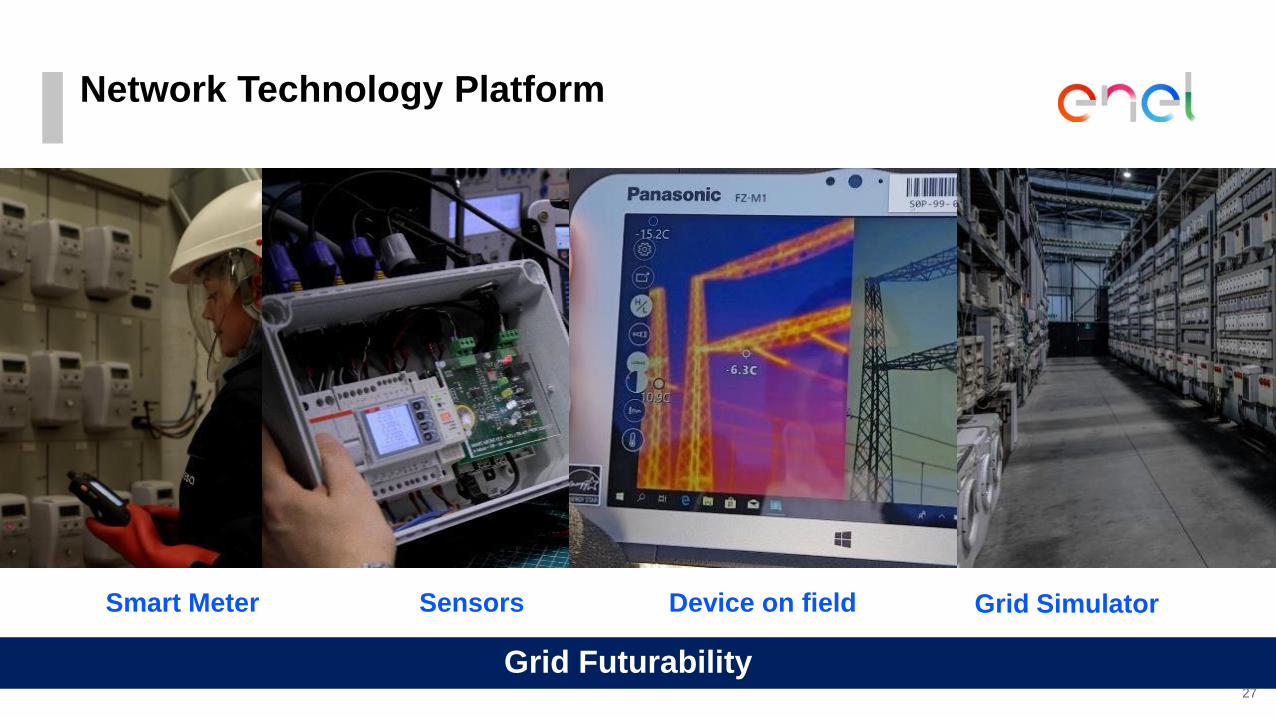
Smart Meter Sensors Grid Simulator
Network Technology Platform
Device on field
27
Grid Futurability
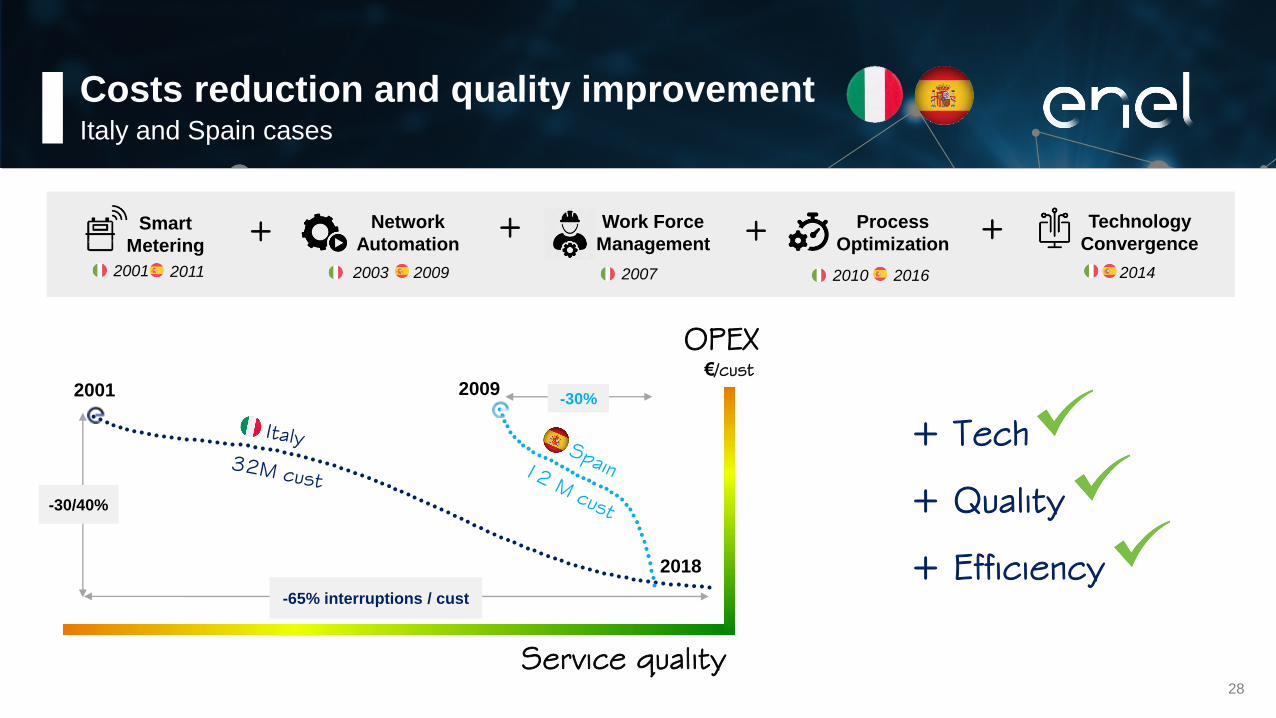
2001 2011
Network
Automation
2003 2009
Work Force
Management
2007
Process
Optimization
20162010
Technology
Convergence
2014
40
45
50
55
60
65
70
75
80
35455565758595105115125135
2001 2009
2018
OPEX
€/cust
Service quality
Smart
Metering
+ Tech
+ Quality
+ Efficiency
Costs reduction and quality improvementItaly and Spain cases
28
-30/40%
-65% interruptions / cust
-30%
+ +++

São Paulo and Goiás Opex optimizationTotal 10 M of customers related to recent Dx acquisitions
-60% Goias
-60% interruptions / cust
OPEX
€/cust
Service quality
-50% SP
-45% interruptions / cust
29*2024 Expected
2016
2020
2024 2024
2017
2018
Main actions
▪ Increasing CAPEX
By 2x - 3x the companies’ historic
▪ Processes optimization
▪ Fighting losses
▪ Opex Recognition negotiation
▪ A Good and Fair Asset Base
negotiation with regulator
▪ Increasing Digitalization
▪ Network resilience
São Paulo – urban area with ≈1.600 cust./Km2
Goiás – rural area with ≈9 cust./Km2

GI&N Stewardship for dummiesStewardship and Sustainability
Accelerate the
energy transition
Minimize
level of risk
Disseminate Enel’s
sustainable model
30
Reach new
countries
Stewardship
Offer Enel
Global expertise
Surpass Regulatory
restrictions
Leverage in our Platform
business models

31
THANK YOU


