This is an author-deposited version published in: http://oatao.univ-toulouse.fr/ Eprints ID : 5823 To link to this article: DOI:10.1080/01932690903224888 URL: http://dx.doi.org/10.1080/01932690903224888 To cite this version: Bendjaballah, Malek and Canselier, Jean-Paul and Oumeddour, Rabah (2010) Optimization of Oil-in-Water Emulsion Stability: Experimental Design, Multiple Light Scattering, and Acoustic Attenuation Spectroscopy. Journal of Dispersion Science and Technology, vol. 31 (n° 9). pp. 1260-1272. ISSN 0193-2691 Open Archive Toulouse Archive Ouverte (OATAO) OATAO is an open access repository that collects the work of Toulouse researchers and makes it freely available over the web where possible. Any correspondence concerning this service should be sent to the repository administrator: staff-oatao@listes-diff.inp-toulouse.fr
Transcript
This is an author-deposited version published in: http://oatao.univ-toulouse.fr/
Eprints ID: 5823
To link to this article: DOI:10.1080/01932690903224888
URL: http://dx.doi.org/10.1080/01932690903224888
To cite this version: Bendjaballah, Malek and Canselier, Jean-Paul and
Oumeddour, Rabah (2010) Optimization of Oil-in-Water Emulsion
Stability: Experimental Design, Multiple Light Scattering, and Acoustic
Attenuation Spectroscopy. Journal of Dispersion Science and Technology,
vol. 31 (n° 9). pp. 1260-1272. ISSN 0193-2691
Open Archive Toulouse Archive Ouverte (OATAO)OATAO is an open access repository that collects the work of Toulouse researchers and
makes it freely available over the web where possible.
Any correspondence concerning this service should be sent to the repository
Malek Bendjaballah,1 Jean Paul Canselier,2 and Rabah Oumeddour1
1Laboratoire d’Analyses Industrielles et Genie des Materiaux, Departement de Genie des Procedes,
Universite de Guelma, Guelma, Algerie2Universite de Toulouse, INPT, UPS, Laboratoire de Genie Chimique, Toulouse, France
To find an optimal formulation of oil-in-water (O/W) emulsions (/o¼ 0.05), the effect ofemulsifier nature and concentration, agitation speed, emulsifying time, storage temperatureand their mutual interactions on the properties and behavior of these dispersions is evaluatedby means of an experimental design (Nemrodw software). Long-term emulsion stability ismonitored by multiple light scattering (Turbiscan ags) and acoustic attenuation spectroscopy(Ultrasizer). After matching surfactant HLB and oil required HLB, a model giving the Sauterdiameter as a function of emulsifier concentration, agitation speed and emulsification time is pro-posed. The highest stability of C12E4-stabilized O/W emulsions is observed with 1% emulsifier.
According to Becher, ‘‘an emulsion is a heterogeneoussystem, consisting of at least one immiscible liquidintimately dispersed in another in the form of droplets,whose diameters, in general, exceed 0.1 mm. Such systemspossess a minimal stability, which may be accentuated bysuch additives as surface-active agents (surfactants),finely-divided solids, etc.’’[1] In this respect, surfactantsmay be present as monolayer or liquid crystals; polymersare another class of emulsifiers. Simple emulsions belongto two types: oil-in-water (O=W) and water-in-oil (W=O).There are also two kinds of multiple (double) emulsions:W=O=W and O=W=O. The so-called aqueous phase may
contain inorganic or organic solutes and the oilyphase, often a mixture of species, can be of mineral, veg-etable or animal origin. In spite of their thermodynamicinstability, natural emulsions are not rare (e.g., milk,rubber-tree latex). Synthetic ones are more often formu-lated products used in extremely various fields, such asfood, cosmetics, pharmacy and medicine, biotechnology,agrochemicals, petroleum, fabric, leather or metal proces-sing, pulp and paper industry, paints and lacquers, deter-gence, lubrication, road construction, automotive fuels,explosives.[2–5] It also happens that emulsions, desirableor not, are formed temporarily during industrial processes(e.g., polymerization, oil extraction). Fundamentally,emulsions ask questions concerning their preparation orformulation, their flow properties, their stability and theirdestruction.[6–8] The answers are related to the understand-ing of the mechanisms governing the formation of suchemulsions, therefore to the control of their formulationand processing. While formulating emulsions, compositionvariables (nature and proportions of ingredients and theirorder of addition), temperature and process parametershave to be considered: the former, including temperature,will mainly determine the type of emulsion, whereas thelatter will partly govern its stability. In fact, sooner or later,an emulsion will break and undergo phase separation.The observed changes involve reversible phenomena(flocculation, creaming, sedimentation), if particles onlymigrate, and irreversible phenomena (Ostwald ripening,
The authors thank the Algerian Government (Ministry ofHigher Education and Scientific Research) for a scholarship(M. B.) and a grant to the LGC. They acknowledge SEPPICCo. for gifting the surfactant samples; H. Dihang and Y.Lefeuvre’s assistance (Formulaction S.A.) with the stability studyperformed with the Turbiscan ags; and A. Jedidi and F. Theronfor checking the conductivity measurements. Last, deep thanksare extended to S. Schetrite (LGC) for performing measurementsand computing the model matrix of the emulsion (H2O=T22=C12E4) with the Ultrasizer analyzer.
Address correspondence to Jean Paul Canselier, Universite deToulouse, INPT, UPS, Laboratoire de Genie Chimique (CNRS5503), 4 allee Emile Monso, BP84234, 31432 Toulouse Cedex 4,France. E-mail: [email protected]
coalescence), if particle size is altered. Among the proper-ties enhancing emulsion stability, let us list: a lowdispersed-phase volume fraction, a low density differencebetween phases, a low (but not too low) interfacial tension,a high viscosity of the continuous phase, a high mechanicalresistance and elasticity of the interface, a high f potential,a high solubility of the emulsifier in the continuousphase (Bancroft’s rule), a narrow droplet size distribution.Increasing temperature often accelerates emulsionbreaking. Except in special cases where spontaneousemulsification can occur,[9,10] and without neglecting theadvantages of a lot of emulsification techniques,[11,12]
mechanical agitation under turbulent flow regime remainsthe most common emulsification method, especially inlarge-scale operation.[12–16] Emulsification under mechan-ical agitation is described either by a kinetic model adaptedto take into account the parameters of formulations or by ahydrodynamic approach better suited to describe the emul-sification process.[17] The formulation, properties and stab-ility of emulsions have been described throughout theliterature.[18–21] As for the theoretical analysis and com-parison of emulsification processes, they have given riseto a few recent papers.[11,12,17,20,22] The present study aimsat a better understanding of the effect of emulsifier andprocess variables on oil-in-water (O=W) emulsion proper-ties and behavior: droplet size distribution (DSD),viscosity, shelf stability and breakup modes, by evaluatingand optimizing emulsifier properties and process para-meters in order to prepare the most stable (optimal)mixture. Emulsion stability will be monitored with tworecently developed techniques (multiple light scatteringand acoustic attenuation spectroscopy), still rarely usedand providing immediately applicable practical guidelinesfor the control of emulsion properties.
MATERIAL AND METHODS
Materials
A mineral, mainly naphthenic, oil, ‘‘T22’’ (Nynas,Sweden), was used throughout as the dispersed phase. Thenonionic surfactants, whose characteristics are reported inTable 1, were given by SEPPIC (Castres, France).
Distilled water was used throughout.
Methods and Instruments
A rotor-stator stirrer, Ultra-Turrax type, IKA T47 S7(Janke and Kunkel, Germany, 10 000 rpm, 170W, 18 teethon the rotor, inside and outside diameters: 35mm and40mm, respectively) was used.
Conductivity measurements were performed with aLF538 digital conductometer (Wissenschaftlich-TechnischeWerkstatten, Germany).
Emulsion viscosity was measured with a C-VOR 200 Boh-lin rotational viscometer (Malvern, UK). 1 hour after the endof the emulsification process, about 40mL of emulsion weremaintained at 25� 2�C in a cylindrical cell (cone-platedevice). The same spindle (S61) was used throughout.
Photomicrographs of emulsion samples were taken witha binocular optical microscope Olympus BH2-RFCA.
The mean droplet size, expressed as the Sauter (surfaceaverage) diameter, d32 ðd32 ¼ ð
Pnid
3i Þ=ð
Pnid
2i Þ, and
droplet size distribution (DSD) were measured with aMastersizer 2000 (Malvern, UK) laser diffraction appar-atus. The samples were analyzed 1 hour after preparation.
Turbiscan (Formulaction, France), allows opticalcharacterization of various types of dispersions, namelymonitoring of emulsion stability. The recently developedTurbiscan ags, equipped with an auto-sampler, was usedin this study. The fresh emulsion (20mL) is contained ina flat-bottomed cylindrical glass measurement cell. Duringca. 45 seconds, each sample is scanned by a near-infraredpulsed light source (LED, k¼ 880 nm). Two synchronousdetectors collect transmission and backscattering(h¼ 135�) intensity data, relative to the initial referencestate every 40 mm. A pattern of intensity versus sampleheight is obtained, giving a macroscopic fingerprintof the sample at a given time (Figure 1). This kind ofapparatus, already used successfully to study emulsionstability,[11,23,24] is able to discriminate destabilizationprocesses consisting of droplet migration (creaming,sedimentation) or droplet growth (flocculation, coalesc-ence, Ostwald ripening) and to detect any of those
aHydrophile-lipophile balance.[1,19]bIn the formulas of the CiEjPk type, i, j and k represent the average
length of the carbon chain C (linear if no prefix, or deriving fromOxo alcohols), the number of moles of ethylene oxide, E, andpropylene oxide, P, involved in the alkoxylation, respectively. Thesecommercial surfactants still contain some unreacted alcohol.
cC18¼ oleyl alcohol chain.
phenomena much earlier than the naked eye, especially inthe case of opaque and concentrated systems. Moreover,the various destabilization rates can be calculated. Theacquisition of intensity data was repeated over 24 hoursor even 21 days at 23� 2�C, yielding a superimpositionof the product fingerprints characterizing emulsionbreaking behaviors.
On the other hand, emulsion DSD could be followed intheir original, concentrated state, in a continuous modewith another nonintrusive technique: acoustic (ultrasound)attenuation spectroscopy, using the Ultrasizer (Malvern,UK; Figure 2). Acoustic attenuation spectroscopy for par-ticle size measurement of emulsion consists of transmittingultrasound of different frequencies, typically from 1MHzup to 150MHz through a sample with the attenuationbeing accurately measured. In order to make DSDmeasurements, it is necessary to measure and calculatethe model matrix for particle-dispersion system (Water-C12E4-T22 in our case). The measured attenuation of thesound wave as a function of frequency is called the acousticattenuation spectrum and constitutes a signature for theparticular emulsion. If a sample is kept in the cell ofthe analyzer for a long time (according to emulsionstability), destabilization kinetics can be plotted.
Emulsion Formulation
Although the aqueous solubility of some surfactants isvery low (e.g., Simulsol P2 and P4 with cloud pointsmuch lower than room temperature), the emulsifier wasFIG. 1. Turbiscan ags device (Formulaction, France).
first dissolved or dispersed in water before dropwiseaddition of the Nynas T22 oil under stirring (Ultra-Turrax)at a constant temperature of 15� 2�C, until a volumefraction of 0.05 of dispersed phase. The reported emulsifierconcentration (in wt%) was calculated with respect tothe volume of the continuous phase. These emulsions canbe considered as simplified models of environmentally-friendly cutting fluids.
RESULTS AND DISCUSSION
Emulsion Type
The conductivity measurements, carried out withaddition of 10ÿ2M NaCl, confirm the O=W type of allthe formulated emulsions.
Effect of Emulsifier
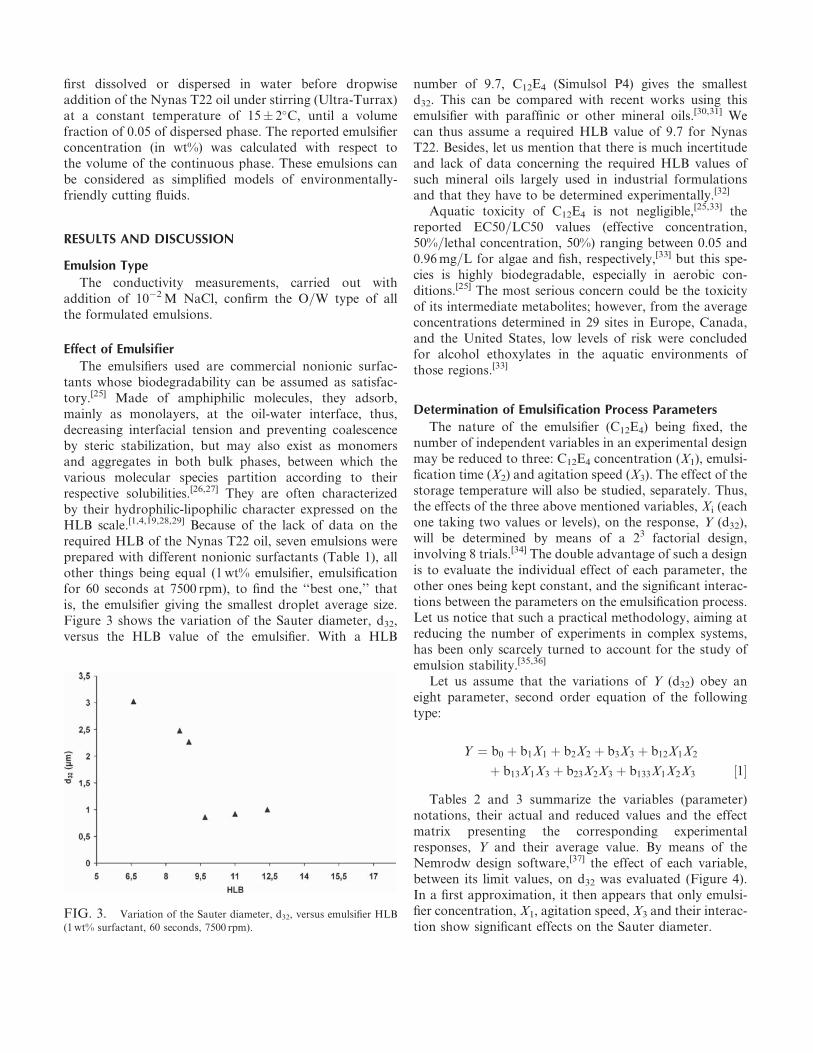
The emulsifiers used are commercial nonionic surfac-tants whose biodegradability can be assumed as satisfac-tory.[25] Made of amphiphilic molecules, they adsorb,mainly as monolayers, at the oil-water interface, thus,decreasing interfacial tension and preventing coalescenceby steric stabilization, but may also exist as monomersand aggregates in both bulk phases, between which thevarious molecular species partition according to theirrespective solubilities.[26,27] They are often characterizedby their hydrophilic-lipophilic character expressed on theHLB scale.[1,4,19,28,29] Because of the lack of data on therequired HLB of the Nynas T22 oil, seven emulsions wereprepared with different nonionic surfactants (Table 1), allother things being equal (1wt% emulsifier, emulsificationfor 60 seconds at 7500 rpm), to find the ‘‘best one,’’ thatis, the emulsifier giving the smallest droplet average size.Figure 3 shows the variation of the Sauter diameter, d32,versus the HLB value of the emulsifier. With a HLB
number of 9.7, C12E4 (Simulsol P4) gives the smallestd32. This can be compared with recent works using thisemulsifier with paraffinic or other mineral oils.[30,31] Wecan thus assume a required HLB value of 9.7 for NynasT22. Besides, let us mention that there is much incertitudeand lack of data concerning the required HLB values ofsuch mineral oils largely used in industrial formulationsand that they have to be determined experimentally.[32]
Aquatic toxicity of C12E4 is not negligible,[25,33] thereported EC50=LC50 values (effective concentration,50%=lethal concentration, 50%) ranging between 0.05 and0.96mg=L for algae and fish, respectively,[33] but this spe-cies is highly biodegradable, especially in aerobic con-ditions.[25] The most serious concern could be the toxicityof its intermediate metabolites; however, from the averageconcentrations determined in 29 sites in Europe, Canada,and the United States, low levels of risk were concludedfor alcohol ethoxylates in the aquatic environments ofthose regions.[33]
Determination of Emulsification Process Parameters
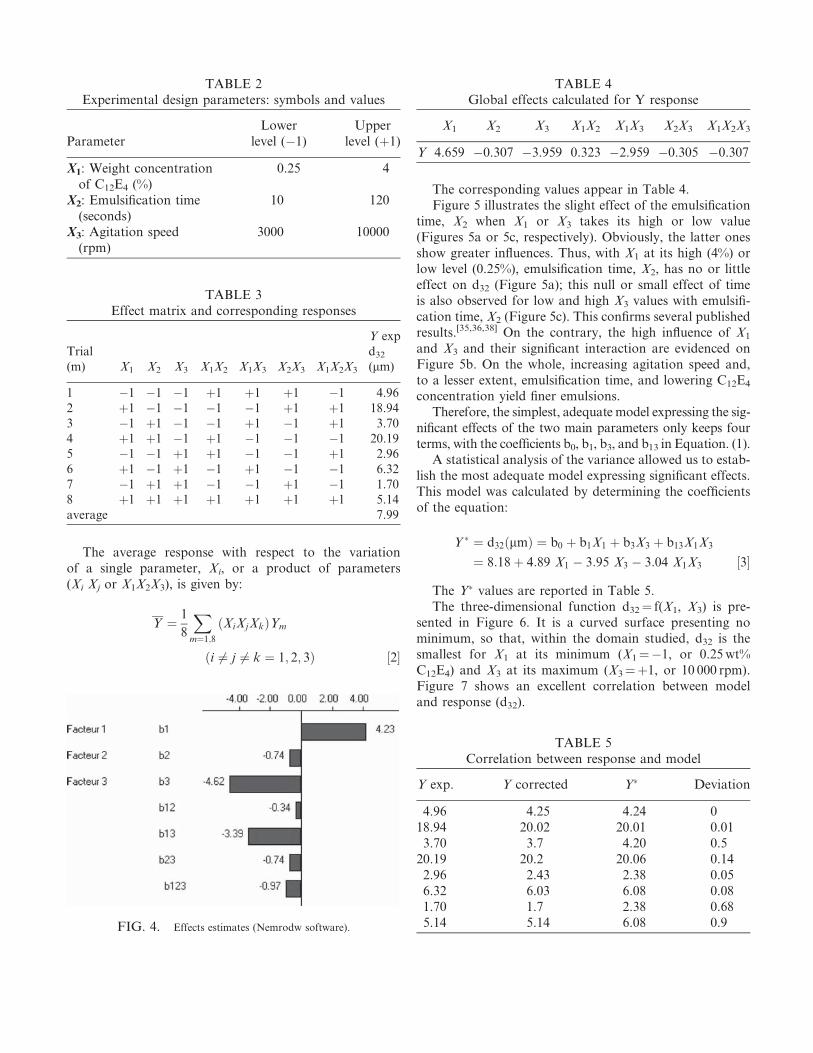
The nature of the emulsifier (C12E4) being fixed, thenumber of independent variables in an experimental designmay be reduced to three: C12E4 concentration (X1), emulsi-fication time (X2) and agitation speed (X3). The effect of thestorage temperature will also be studied, separately. Thus,the effects of the three above mentioned variables, Xi (eachone taking two values or levels), on the response, Y (d32),will be determined by means of a 23 factorial design,involving 8 trials.[34] The double advantage of such a designis to evaluate the individual effect of each parameter, theother ones being kept constant, and the significant interac-tions between the parameters on the emulsification process.Let us notice that such a practical methodology, aiming atreducing the number of experiments in complex systems,has been only scarcely turned to account for the study ofemulsion stability.[35,36]
Let us assume that the variations of Y (d32) obey aneight parameter, second order equation of the followingtype:
Y ¼ b0 þ b1X1 þ b2X2 þ b3X3 þ b12X1X2
þ b13X1X3 þ b23X2X3 þ b133X1X2X3 ½1�
Tables 2 and 3 summarize the variables (parameter)notations, their actual and reduced values and the effectmatrix presenting the corresponding experimentalresponses, Y and their average value. By means of theNemrodw design software,[37] the effect of each variable,between its limit values, on d32 was evaluated (Figure 4).In a first approximation, it then appears that only emulsi-fier concentration, X1, agitation speed, X3 and their interac-tion show significant effects on the Sauter diameter.
FIG. 3. Variation of the Sauter diameter, d32, versus emulsifier HLB
(1wt% surfactant, 60 seconds, 7500 rpm).
The average response with respect to the variationof a single parameter, Xi, or a product of parameters(Xi Xj or X1X2X3), is given by:
Y ¼1
8
X
m¼1;8
ðXiXjXkÞYm
ði 6¼ j 6¼ k ¼ 1; 2; 3Þ ½2�
The corresponding values appear in Table 4.Figure 5 illustrates the slight effect of the emulsification
time, X2 when X1 or X3 takes its high or low value(Figures 5a or 5c, respectively). Obviously, the latter onesshow greater influences. Thus, with X1 at its high (4%) orlow level (0.25%), emulsification time, X2, has no or littleeffect on d32 (Figure 5a); this null or small effect of timeis also observed for low and high X3 values with emulsifi-cation time, X2 (Figure 5c). This confirms several publishedresults.[35,36,38] On the contrary, the high influence of X1
and X3 and their significant interaction are evidenced onFigure 5b. On the whole, increasing agitation speed and,to a lesser extent, emulsification time, and lowering C12E4
concentration yield finer emulsions.Therefore, the simplest, adequate model expressing the sig-
nificant effects of the two main parameters only keeps fourterms, with the coefficients b0, b1, b3, and b13 in Equation. (1).
A statistical analysis of the variance allowed us to estab-lish the most adequate model expressing significant effects.This model was calculated by determining the coefficientsof the equation:
Y � ¼ d32ðmmÞ ¼ b0 þ b1X1 þ b3X3 þ b13X1X3
¼ 8:18þ 4:89 X1 ÿ 3:95 X3 ÿ 3:04 X1X3 ½3�
The Y� values are reported in Table 5.The three-dimensional function d32¼ f(X1, X3) is pre-
sented in Figure 6. It is a curved surface presenting nominimum, so that, within the domain studied, d32 is thesmallest for X1 at its minimum (X1¼ÿ1, or 0.25wt%C12E4) and X3 at its maximum (X3¼þ1, or 10 000 rpm).Figure 7 shows an excellent correlation between modeland response (d32).
Beside formulation properly said, one of the mainchallenges in the preparation of stable emulsions is thedetermination of the optimal process parameters duringemulsification. In principle, the evaluation of the kineticstability of an emulsion requires a long period of time.Accelerated aging tests can be applied to overcome thisproblem. Many studies use centrifugation,[7] ultrasound,[39]
or other techniques,[8] but, till now, none of them is reliableor precise enough to describe and explain the mechanismsthat govern destabilization phenomena.[40–43] A lot of
relationships, namely cited in,[16,17,22] have been establishedbetween d32 and various parameters for emulsification inturbulent regime under mechanical agitation. All thosestudies and the present one conclude that emulsion stabilityis linked to mean droplet diameter and to the variationof rheological properties.[31,35] In fact, when d32 is small,viscosity variation is slow and the emulsion is more stable.
The experimental design allowed us to set the bestranges for the parameters that affect emulsion stability:
. a low emulsifier concentration,
. an intermediate emulsification time,
. a high agitation speed.
As regards emulsifier concentration, 0.25% C12E4
yielded an emulsion with bimodal distribution and verypoor stability. On the other hand, some authors[17,19,21]
recommend an average agitation speed because the energyneeded for emulsification is lower compared with that lostin the aqueous phase under the form of heat. Namely, for aspeed of 10 000 rpm during 60 seconds, we recorded anincrease of the emulsion temperature (40�C). Let us nowcheck the optimum values of C12E4 concentration andagitation speed and, finally, find the best emulsificationtime. A classical, very efficient process was used for thedetermination of this optimum: the value of one parameterwas fixed and the other two varied within the limits setabove. Figures 8–10 illustrate our results. After Figure 8(d32 versus C12E4 concentration under 7500 rpm and during60 seconds), emulsion is more stable for lower emulsifierconcentrations and the smallest drop size is obtained fora concentration of 1%. Figure 9 shows d32 versus emulsifi-cation time and we can see that emulsification isaccomplished in two steps: during the first one, a periodof time shorter than 60 seconds, we have recorded a fast
FIG. 5. Interaction effects graphs (a) between X1 and X2; (b) between
d32 decrease favored by the interfacial tension decreasecaused by emulsifier adsorption, and agitation shear. Thesecond step consists of a plateau where, after a slightincrease, d32 remains fairly constant for any emulsificationtime, showing that a stationary state is reached, due to abalance between rupture and coalescence of the droplets,corresponding to the smallest possible, therefore optimal,d32 value. This validates the experimental design andclearly shows that, above 40 seconds, time have little effecton emulsification process and that a relatively short time issufficient.[2,12,19] As shown in Figure 10, plotting d32 versusagitation speed, we notice that low values of the Sauterdiameter are obtained within the range 4000–9000 rpm,
but, in fact, a 7500 rpm speed affords a very stable, mono-disperse emulsion, contrary to those obtained at 4000 and5500 rpm giving unstable emulsions characterized by bimo-dal DSD. Moreover, at 7500 rpm there is almost no foamformation, which happens at higher agitation speed. Asample of our emulsion, prepared at 10 000 rpm, after 60seconds, clearly shows an agglomeration of the smalldroplets, denoting an eventual destabilization (Figure 11).Therefore, for our system, the optimum conditions appearto be: 1% C12E4 concentration, 7500 rpm and 60 seconds.
Viscosity
Stokes’ law states that the rate of phase separation (V)between liquids 1 and 2 (of respective densities q1 and q2)depends on gravity (g) particle radius (r), and the viscosityðgÞ_
of the continuous medium (aqueous phase).
V ¼ 2r2ðq1 ÿ q2Þ g=9 g_
½4�
FIG. 8. Variation of the Sauter diameter, d32, versus C12E4 concen-
tration (7500 rpm, 60 seconds).
FIG. 9. Variation of the Sauter diameter, d32, versus emulsifying time
(7500 rpm, 1wt% surfactant).
FIG. 10. Variation of the Sauter diameter, d32, versus agitation speed
(60 seconds, 1wt% surfactant).
FIG. 11. Microscopic view of emulsions (a) under optimal conditions
The relative viscosity gq of very dilute emulsions(/� 0.02) only depends on the volume fraction of thedispersed phase, u, according to Einstein’s relation:
gq_
¼ g=g0 ¼ 1þ ð5=2Þ/_
½5�
where gq_
and g0 are the shear viscosities of the emulsionand the continuous phase, respectively. This relation isobeyed provided that there is no interaction (repulsiveCoulombic or attractive Van der Waals forces) betweenrigid, spherical droplets. If this is not the case, especiallyfor more concentrated emulsions, an empirical, polynomialform may be used:
g ¼ 1þ a/þ b_
/2 þ v_
/3 þ � � � ½6�
with b theoretically equal to 14.1, according to.[1]
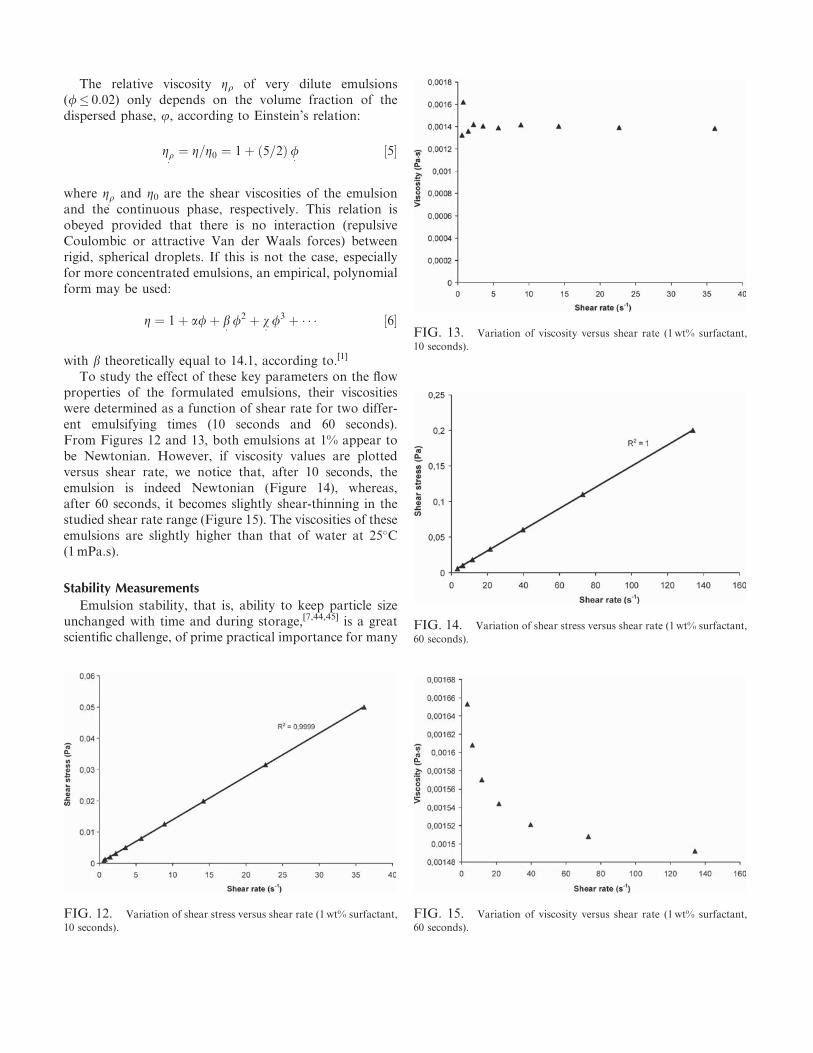
To study the effect of these key parameters on the flowproperties of the formulated emulsions, their viscositieswere determined as a function of shear rate for two differ-ent emulsifying times (10 seconds and 60 seconds).From Figures 12 and 13, both emulsions at 1% appear tobe Newtonian. However, if viscosity values are plottedversus shear rate, we notice that, after 10 seconds, theemulsion is indeed Newtonian (Figure 14), whereas,after 60 seconds, it becomes slightly shear-thinning in thestudied shear rate range (Figure 15). The viscosities of theseemulsions are slightly higher than that of water at 25�C(1mPa.s).
Stability Measurements
Emulsion stability, that is, ability to keep particle sizeunchanged with time and during storage,[7,44,45] is a greatscientific challenge, of prime practical importance for many
FIG. 12. Variation of shear stress versus shear rate (1wt% surfactant,
10 seconds).
FIG. 13. Variation of viscosity versus shear rate (1wt% surfactant,
10 seconds).
FIG. 14. Variation of shear stress versus shear rate (1wt% surfactant,
60 seconds).
FIG. 15. Variation of viscosity versus shear rate (1wt% surfactant,
60 seconds).
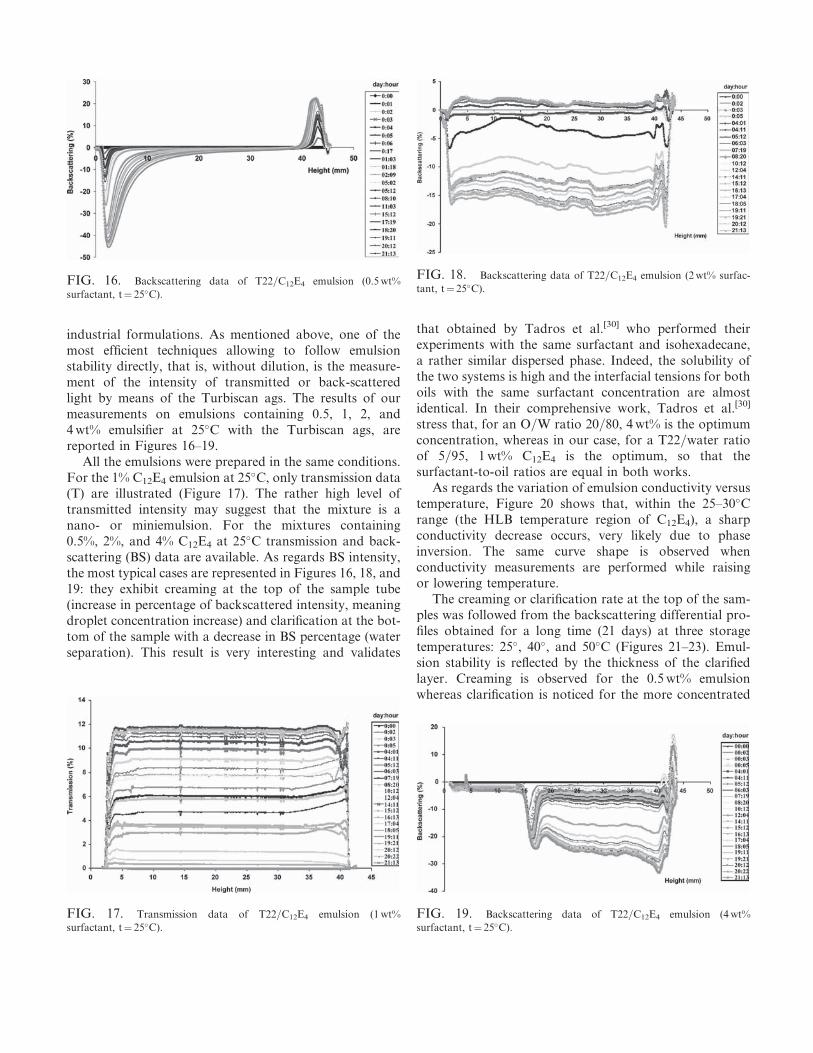
industrial formulations. As mentioned above, one of themost efficient techniques allowing to follow emulsionstability directly, that is, without dilution, is the measure-ment of the intensity of transmitted or back-scatteredlight by means of the Turbiscan ags. The results of ourmeasurements on emulsions containing 0.5, 1, 2, and4wt% emulsifier at 25�C with the Turbiscan ags, arereported in Figures 16–19.
All the emulsions were prepared in the same conditions.For the 1% C12E4 emulsion at 25�C, only transmission data(T) are illustrated (Figure 17). The rather high level oftransmitted intensity may suggest that the mixture is anano- or miniemulsion. For the mixtures containing0.5%, 2%, and 4% C12E4 at 25�C transmission and back-scattering (BS) data are available. As regards BS intensity,the most typical cases are represented in Figures 16, 18, and19: they exhibit creaming at the top of the sample tube(increase in percentage of backscattered intensity, meaningdroplet concentration increase) and clarification at the bot-tom of the sample with a decrease in BS percentage (waterseparation). This result is very interesting and validates
that obtained by Tadros et al.[30] who performed theirexperiments with the same surfactant and isohexadecane,a rather similar dispersed phase. Indeed, the solubility ofthe two systems is high and the interfacial tensions for bothoils with the same surfactant concentration are almostidentical. In their comprehensive work, Tadros et al.[30]
stress that, for an O=W ratio 20=80, 4wt% is the optimumconcentration, whereas in our case, for a T22=water ratioof 5=95, 1wt% C12E4 is the optimum, so that thesurfactant-to-oil ratios are equal in both works.
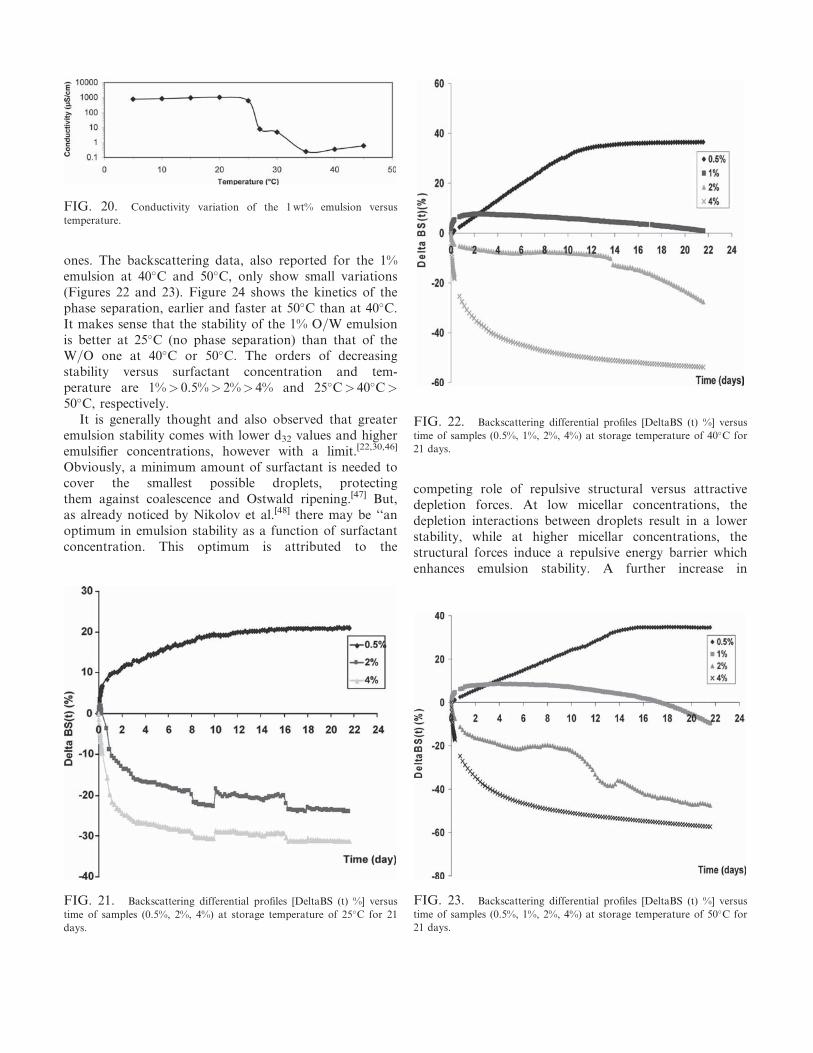
As regards the variation of emulsion conductivity versustemperature, Figure 20 shows that, within the 25–30�Crange (the HLB temperature region of C12E4), a sharpconductivity decrease occurs, very likely due to phaseinversion. The same curve shape is observed whenconductivity measurements are performed while raisingor lowering temperature.
The creaming or clarification rate at the top of the sam-ples was followed from the backscattering differential pro-files obtained for a long time (21 days) at three storagetemperatures: 25�, 40�, and 50�C (Figures 21–23). Emul-sion stability is reflected by the thickness of the clarifiedlayer. Creaming is observed for the 0.5wt% emulsionwhereas clarification is noticed for the more concentrated
FIG. 16. Backscattering data of T22=C12E4 emulsion (0.5wt%
surfactant, t¼ 25�C).
FIG. 17. Transmission data of T22=C12E4 emulsion (1wt%
surfactant, t¼ 25�C).
FIG. 18. Backscattering data of T22=C12E4 emulsion (2wt% surfac-
tant, t¼ 25�C).
FIG. 19. Backscattering data of T22=C12E4 emulsion (4wt%
surfactant, t¼ 25�C).
ones. The backscattering data, also reported for the 1%emulsion at 40�C and 50�C, only show small variations(Figures 22 and 23). Figure 24 shows the kinetics of thephase separation, earlier and faster at 50�C than at 40�C.It makes sense that the stability of the 1% O=W emulsionis better at 25�C (no phase separation) than that of theW=O one at 40�C or 50�C. The orders of decreasingstability versus surfactant concentration and tem-perature are 1%> 0.5%> 2%> 4% and 25�C> 40�C>50�C, respectively.
It is generally thought and also observed that greateremulsion stability comes with lower d32 values and higheremulsifier concentrations, however with a limit.[22,30,46]
Obviously, a minimum amount of surfactant is needed tocover the smallest possible droplets, protectingthem against coalescence and Ostwald ripening.[47] But,as already noticed by Nikolov et al.[48] there may be ‘‘anoptimum in emulsion stability as a function of surfactantconcentration. This optimum is attributed to the
competing role of repulsive structural versus attractivedepletion forces. At low micellar concentrations, thedepletion interactions between droplets result in a lowerstability, while at higher micellar concentrations, thestructural forces induce a repulsive energy barrier whichenhances emulsion stability. A further increase in
FIG. 20. Conductivity variation of the 1wt% emulsion versus
temperature.
FIG. 21. Backscattering differential profiles [DeltaBS (t) %] versus
time of samples (0.5%, 2%, 4%) at storage temperature of 25�C for 21
days.
FIG. 22. Backscattering differential profiles [DeltaBS (t) %] versus
time of samples (0.5%, 1%, 2%, 4%) at storage temperature of 40�C for
21 days.
FIG. 23. Backscattering differential profiles [DeltaBS (t) %] versus
time of samples (0.5%, 1%, 2%, 4%) at storage temperature of 50�C for
21 days.
surfactant concentration leads to an increase in polydisper-sity in micellar size which reduces emulsion stability.’’ Thehigher stability of the 1% emulsion is probably due to sucha compromise.
In order to confirm the high stability of the 1% emulsion,the acoustic attenuation spectra were drawn as a function oftime (Ultrasizer) (Figure 25). Apart a small change between24 hours and 72 hours, which should reveal a modifiedDSD, the spectrum is remarkably constant until 1 month.The evolution of the emulsion DSD versus time in these opti-mal conditions was also followed. Figure 26 confirms the verysmall mean droplet size (less than 0.2mm) and shows a verystable, narrow DSD. After 72 hours, larger droplets seemto appear, yielding a trimodal distribution with secondarymaxima at 0.6mm and ca. 1.6mm, which, apparently, agreeswith the attenuation spectra, but, according to those, this
could simply be due to the possibly erroneous points around100MHz in Figure 26. Anyway, since the ordinate axis isgraduated in volume%, the number of ‘‘large droplets’’should be very small.
CONCLUSIONS
Although the tools for characterizing emulsions are nowwell developed and the mechanisms of emulsificationreasonably understood, it is still difficult to predict the exactresult of an emulsification process, since this is a combi-nation of a lot of parameters, including formulation andprocess variables. The goal of this work was to optimize verysimple model formulations of ‘‘cutting fluids’’ (O=W emul-sions stabilized by surfactant). As regards the equipment,mechanical agitation apparatuses, especially rotor-statordevices will certainly continue to be widely used. Optimalconditions were first approached by choosing the emulsifieryielding the finest emulsion, provided it was readily biode-gradable: a commercial C12E4 was selected. Then thejudicious application of an experimental design to predictoptimal formulation of such systems provided guidelinesfor surfactant concentration, agitation speed and duration.The study of the influence of each parameter and that of theinteraction between the parameters allow understandingtheir effect and mechanisms governing these formulations.These conditions allowed us to perform very stable emul-sions having very small droplet size with d32 of about0.18 mm and a rather narrow DSD with a single surfactant.Specific, no intrusive techniques, needing no dilution of 5%emulsions (multiple light scattering with Turbiscan ags andacoustic attenuation spectroscopy withUltrasizer) helped usto follow destabilization phenomena. The higher stability of
FIG. 24. Thickness versus time for emulsion with 1wt% C12E4 at 40�
and 50�C.
FIG. 25. Acoustic attenuation spectrum versus time storage of T22=C12E4 emulsion (optimal conditions).
FIG. 26. Volume percentage of droplet size distribution of T22=C12E4
emulsion versus drop size at optimal conditions (1wt% surfactant, 60 s,
7500 rpm) (kinetic stability perfomed with Ultrasizer measurements).
emulsions containing 1wt% C12E4 can be attributed to thecompeting role of repulsive structural versus attractivedepletion forces.
REFERENCES
[1] Becher, P. (1965) Emulsions: Theory and Practice; 2nd ed.;New York: Rheinhold.
[2] Bibette, J., Leal Calderon, F., Schmitt, V., and Poulin, P. (2003)In Emulsion Science, edited by J. Bibette, F. Leal Calderon, V.
Schmitt, and P. Poulin; Berlin: Springer; pp. 79–93.
[3] Walstra, P. (1983) In Encyclopedia of Emulsion Technology,
edited by P. Becher; New York: Marcel Dekker; Vol. 1,
pp. 57–127.
[4] Szwach, I., Hreczuch, W., and Fochtman, P. (2003)5th World Conference on Detergents: Reinventing theIndustry-Opportunities Challenges, Montreux, Switzerland,October 13–17, 2002, Proceedings edited by A. Cahn;Champaign, IL: AOCS Press; pp. 163–165.
[5] Bibette, J. (1996) Emulsions: Concepts de base et Applications.
L’Actualite Chimique, March–May: 23–28.
[6] Salager, J.L. (2000) In Pharmaceutical Emulsions and
Suspensions; New York: Marcel Dekker; pp. 19–72.
[7] Curt, C. (1994) Sciences des Aliments. 14: 699–724.
[8] Horozov, T.S. and Binks, B.P. (2004) Langmuir, 20:
[12] Canselier, J.P. and Poux, M. (2004) Procedes d’emulsifi-
cation: mecanismes de formation des emulsions, Techniques
de l’Ingenieur; Paris: Editions TI Sciences et Techniques; J2
152, pp. 1–12.
[13] Nieuwenhuyze, K.V., Tanghe, T., and Verlhak, P. (2005) Pre-diction of emulsion properties from binder=emulsifier charac-teristics. ‘‘BRITE-EURAM’’ Project (OPTEL BE-1516), ABNynas Petroleum,GroupCompetence Center (GCC); Brussels.
[14] Bataller, H., Dicharry, C., Lachaise, J., and Graciaa, A.(2000) J. Dispersion Sci. Technol., 21 (5): 571–588.
[15] Dagreou, S., Mendiboure, B., Allal, A., Marin, G., Lachaise,J., Marchal, P., and Choplin, L. (2005) J. Colloid Interface
Sci., 282: 202–211.
[16] Pacek, A.W., Man, C.C., and Nienow, A.W. (1998) Chem.
Eng. Sci., 53 (11): 2005–2010.
[17] Nandi, A., Khakhar, D.V., and Mehra, A. (2001) Langmuir,
17: 2647–2655.
[18] Tadros, T.F. and Vincent, B. (1983) In Encyclopedia of
Emulsion Technology, edited by P. Becher; New York: Marcel
Dekker; Vol. 1, pp. 103–276.
[19] Brochette, P. (1999) Elaboration et etude des emulsions,
Techniques de l’Ingenieur; Paris: Edition TI Sciences et
Techniques, J2 150, pp. 1–18 and Doc J2 150, pp. 1–2.
[20] Holmberg, K., Jonsson, B., and Lindman, B. (2003)Surfactants and Polymers in Aqueous Solution; 2nd ed.;New York: John Wiley & Sons, pp. 459–471.
[21] Dalmazzone, C. (2000) Oil and Gas Sci. Technol.-Rev. IFP,
55 (3): 281–305.
[22] Kelbaliev, G. and Ceylan, K. (2005) J. Dispersion Sci.
Technol., 26: 487–494.
[23] Mengual, O., Meunier, G., Cayre, I., Puech, K., andSnabre, P. (1999) Talanta, 50: 445–456.
[24] Persson, C.M., Claesson, P.M., and Lunkenheimer, K.(2002) J. Colloid Interface Sci., 251: 182–192.
[25] Madsen, T. (2004) In Handbook of Detergents, Part B:
[31] Tadros, T.F. (2004) Application of rheology and predictionof the long-term physical stability of emulsions. Adv. ColloidInterface Sci., 108–109: 227–258.
[32] Sjoblom, J., (ed.). (1996) Emulsions and Emulsion Stability,
Surfactant Science Series, Vol. 61; New York: Marcel
Dekker.
[33] Belanger, S.E., Dorn, P.B., Toy, R., Boeije, G., Marshall,S.J., Wind, T., Van Compernolle, R., and Zelle, D. (2006)Ecotoxicology and Environmental Safety, 64 (1): 85–99.
[34] Sado, G. and Sado, M.C. (2000) Les Plans d’Experiences: del’Experimentation a L’Assurance Qualite. 2nd ed.; Paris:
AFNOR.
[35] Sanchez, M.C., Berjano, M., Guerrero, A., Brito, C., andGallegos, E. (1998) Can. J. Chem. Eng., 76 (3): 479–485.
[36] Catte, M., Poprawski, J., Aubry, J.M., and Hecke, E.V.(2002) J. Disp. Sci. Technol., 23 (1–3): 323–331.
[37] www.nemrodw.com, LPRAI Co., Marsailles, France.[38] Xu, Q., Nakajima, M., Nabetani, H., Ixamoto, S., and Liu,
X. (2001) J. Am. Oil Chem. Soc., 78 (12): 1185–1190.
[39] Gou, S.Q., Da, J.W., Zhang, Y.G., Han, P., and Zhang, J.G.(2005) A method and apparatus for demulsifying an oil-wateremulsion via ultrasonic effect. Chinese (world) Patent WO2005030360 (2005).
[40] Tsouris, C. and Tavlarides, L.L. (1994) AiChE J., 40:
395–406.
[41] Sajjadi, S., Zerfa, M., and Brook, B.W. (2002) Chem. Eng.
Sci., 57: 663–675.
[42] Patist, A., Bhagwat, S.S., Penfield, K.W., Aikens, P., andShah, D.O. (2000) J. Surf. Deterg., 3 (1): 53–58.
[43] Walstra, P. (1993) Principles of emulsion formation. Chem.
Eng. Sci., 48 (2): 333–349.
[44] Lindgren, A., Sjostrom, M., and Wold, S. (1996) J. Am. Oil
Chem. Soc., 73 (7): 863–875.
[45] Di Modugno, R., Polito, A., Monterisi, F., and Tramalloni,M. (2006) J. Com. Esp. Deterg., 36: 267–278.
[46] Exerowa, D., Gotchev, G., Kolarov, T., Kristov, K., Levecke,B., and Tadros, T.F. (2009) Colloids Surf. A, 334: 87–91.
[47] Solans, C., Esquena, J., Azemar, N., Rodriguez, C., andKunieda, H. (2004) In Emulsions: Structure, Stability and
Interactions, 4, edited by D.N. Petsev; Interface and
Technology Series; Amsterdam: Elsevier, ch. 13, pp. 511–556.
[48] Nikolov, A.D. and Wasan, D.T. (2000) Emulsion stability:
Role of structural and depletion forces. Book of Abstracts,219th ACS National Meeting, San Francisco, CA, March26–30, 2000.