17
Open-File Report 2010–1165 U.S. Department of the Interior U.S. Geological Survey

Open-File Report 2010–1165
U.S. Department of the InteriorU.S. Geological Survey


Development of Sea Level Rise Scenarios for Climate Change Assessments of the Mekong Delta, Vietnam
By Thomas W. Doyle, Richard H. Day, and Thomas C. Michot
Open-File Report 2010–1165
U.S. Department of the InteriorU.S. Geological Survey
U.S. Department of the InteriorKEN SALAZAR, Secretary
U.S. Geological SurveyMarcia K. McNutt, Director
U.S. Geological Survey, Reston, Virginia: 2010
This and other USGS information products are available at http://store.usgs.gov/U.S. Geological SurveyBox 25286, Denver Federal CenterDenver, CO 80225
To learn about the USGS and its information products visit http://www.usgs.gov/1-888-ASK-USGS
Any use of trade, product, or firm names is for descriptive purposes only and does not imply endorsement by the U.S. Government.
Although this report is in the public domain, permission must be secured from the individual copyright owners to reproduce any copyrighted materials contained within this report.
Suggested citation:Doyle, T.W., Day, R.H., and Michot, T.C., 2010, Development of sea level rise scenarios for climate change assessments of the Mekong Delta, Vietnam: U.S. Geological Survey Open-File Report 2010–1165, 110 p.

iii
ContentsAbstract ...........................................................................................................................................................1Vulnerability of Global Megadeltas to Sea Level Rise .............................................................................1Accelerated Sea Level Rise with Climate Change ...................................................................................2Historical Eustatic Sea Level Rise of the China Sea ................................................................................2Land-Surface Elevation Change of Deltas .................................................................................................2Relative Sea Level Trends for Coastal Vietnam ........................................................................................3Global Tide Gage Stations and Records for Vietnam ...............................................................................3Intra- and Inter-annual Sea Level Variability at Vung Tau ......................................................................3Rectification of the Vung Tau Sea Level Record ......................................................................................6Developing Sea Level Rise Scenarios for the 21st Century ....................................................................6Conclusion.......................................................................................................................................................8References Cited............................................................................................................................................9Appendix 1. Mean monthly water level for the period 1979–2001 for Vung Tau,
Vietnam, from the Permanent Service for Mean Sea Level Web site ...................................11 Appendix 2. Hourly tide level for the period 2007–9 for Vung Tau, Vietnam, from
the University of Hawaii Sea Level Center Web site ................................................................17 Appendix 3. Constructed sea level rise scenarios for the Mekong Delta based on
the IPCC A1F1 minimum accelerated eustacy rate for five different subsidence levels for 2010–2100..................................................................................................27
Appendix 4. Constructed sea level rise scenarios for the Mekong Delta based on the IPCC A1F1 maximum accelerated eustacy rate for five different subsidence levels for 2010–2100..................................................................................................48
Appendix 5. Constructed sea level rise scenarios for the Mekong Delta based on the IPCC B1 minimum accelerated eustacy rate for five different subsidence levels for 2010–2100..................................................................................................69
Appendix 6. Constructed sea level rise scenarios for the Mekong Delta based on the IPCC B1 maximum accelerated eustacy rate for five different subsidence levels for 2010–2100..................................................................................................90
Figures1. Graph showing mean monthly water level at Vung Tau, Vietnam, tide gage ..................................42. Graph showing sea level trend of about 6 millimeters per year of mean
monthly observations for the Vung Tau, Vietnam, tide gage record from 1979 to 2001 ..............................................................................................................................4
3. Graph showing linear regressions of the Vung Tau, Vietnam, tide gage demonstrating a near-zero slope or sea level trend from 1979 to 1989 and a 1.77 millimeters per year slope from 1992 to 2001 ............................................................5
4. Graph showing sea level variation of the Vung Tau, Vietnam, tide gage record after adjusting the time series to accomplish a zero-slope long-term trend .........................5
5. Graph showing seasonal variation of mean monthly water levels (± 1 standard error) for the Vung Tau, Vietnam, tide gage station after zero-slope adjustment for all years 1979 to 2001 ...............................................................5
iv
6. Graph showing monthly values of mean tide level, mean lower low water, and mean higher high water calculated from hourly sea level readings at Vung Tau, Vietnam, for the 2007–9 period ...............................................................6
7. Graph showing accelerated eustatic sea level curves for B1 and A1F1 emission scenarios ..........................................................................................................................7
8. Graph showing constructed sea level rise scenarios under climate change for the maximum A1F1 emission case including net subsidence at 9 mm/yr in contrast with the historical eustacy condition without climate change and rectified to the contemporary tide record .............................................................7
9. Bar graph showing timing and degree of projected submergence of a given land surface or feature 0.5 meter above current sea level heights in relation to a constructed sea level scenario based on maximum A1F1 emission projection and a net subsidence rate of 9 mm/yr ..................................................................................................................................................8
Table1. Maximum elevation of projected sea level heights extracted from constructed
sea level rise scenarios from 2010 to 2100 for minimum and maximum rates of B1 and A1F1 emission scenarios and different rates for net subsidence..................................................................................................................................8
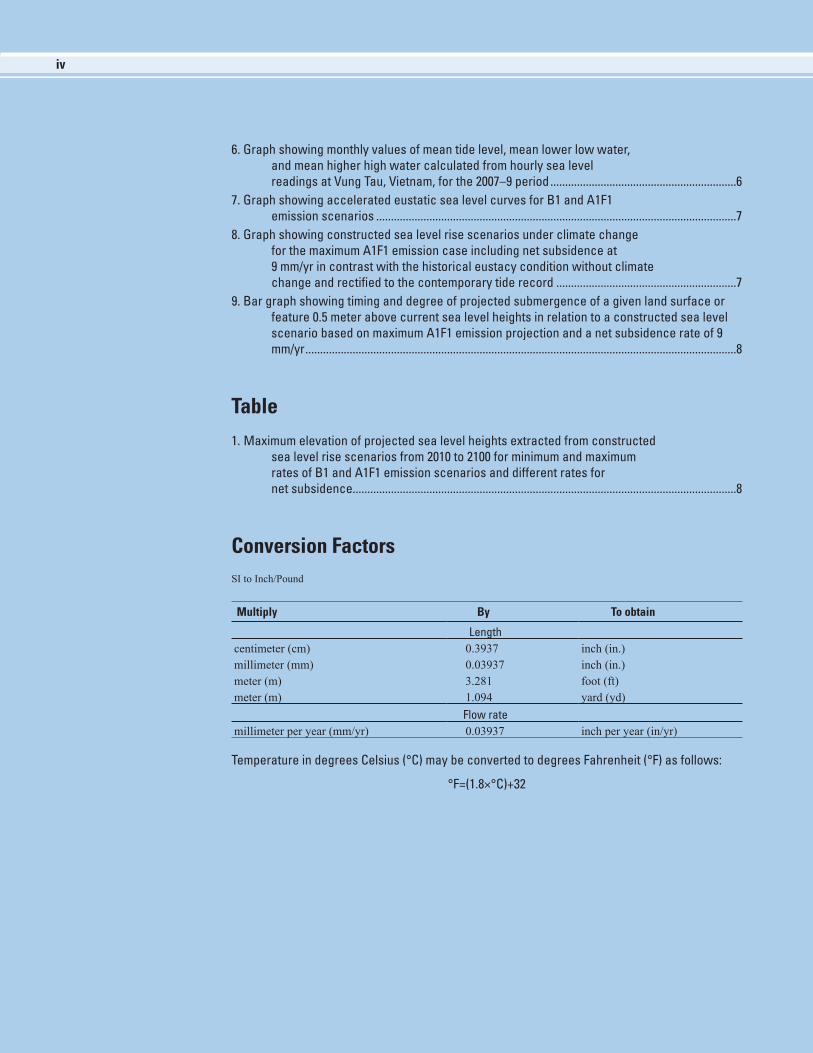
Conversion FactorsSI to Inch/Pound
Multiply By To obtain
Lengthcentimeter (cm) 0.3937 inch (in.)millimeter (mm) 0.03937 inch (in.)meter (m) 3.281 foot (ft) meter (m) 1.094 yard (yd)
Flow ratemillimeter per year (mm/yr) 0.03937 inch per year (in/yr)
Temperature in degrees Celsius (°C) may be converted to degrees Fahrenheit (°F) as follows:
°F=(1.8×°C)+32

Development of Sea Level Rise Scenarios for Climate Change Assessments of the Mekong Delta, Vietnam
By Thomas W. Doyle, Richard H. Day, and Thomas C. Michot
Abstract Rising sea level poses critical ecological and economical
consequences for the low-lying megadeltas of the world where dependent populations and agriculture are at risk. The Mekong Delta of Vietnam is one of many deltas that are especially vulnerable because much of the land surface is below mean sea level and because there is a lack of coastal barrier protection. Food security related to rice and shrimp farming in the Mekong Delta is currently under threat from saltwater intrusion, relative sea level rise, and storm surge potential. Understanding the degree of potential change in sea level under climate change is needed to undertake regional assessments of potential impacts and to formulate adaptation strategies. This report provides constructed time series of potential sea level rise scenarios for the Mekong Delta region by incorporating (1) aspects of observed intra- and inter-annual sea level variability from tide records and (2) projected estimates for different rates of regional subsidence and accelerated eustacy through the year 2100 corresponding with the Intergovernmental Panel on Climate Change (IPCC) climate models and emission scenarios.
Vulnerability of Global Megadeltas to Sea Level Rise
The world’s coastal areas and in particular its megadeltas are increasingly being inundated and eroded by rising sea level (Ericson and others, 2006; Syvitski and others, 2009). Warming of our global environment threatens to speed the rate of current sea level rise and perhaps further amplify the detrimental effects of tropical storms, droughts, and record rainfall. Potential effects of sea level rise include coastal erosion, saltwater intrusion into groundwater aquifers, and submergence of cultural and natural resources. Megadeltas are at greater risk where human-induced activities such as land-use change for agriculture and aquaculture, damming of rivers, and subsurface water and hydrocarbon extraction are causing accelerated subsidence and flooding of the land surface.
The latter activities—subsurface water and hydrocarbon extraction— are especially problematic in Asian delta regions where population densities and agricultural production are greatest and most critical for socioeconomic reasons (Jelgersma, 1996; Ericson and others, 2006; Woodroffe and others, 2006; Syvitski, 2008). In most cases, the rates of subsidence in deltaic environments, human-induced or even naturally occurring, are many times greater than the rates of historical or projected eustatic sea level rise expected with climate change (Jelgersma, 1996; Pont and others, 2002; Ericson and others, 2006).
The actual rate of effective or relative sea level rise within and among the world’s megadeltas varies with the specific local and regional conditions affecting sea level and land-surface change over time and space. Factors affecting the height of the sea are eustacy (the change in the global volume of the ocean) and annual and seasonal variation in the distribution of the ocean mass due to Earth’s movements and cycles of atmospheric heating and cooling (for example, El Niño and La Niña). Wind, waves, geometry of the coastline, and the bathymetry of the local tidal basin affect the daily and seasonal rhythm of local tides. Land-surface elevation is affected by large-scale tectonic movement of Earth’s land masses, as well as by the local factors of deposition, erosion, and subsidence caused by natural compaction, alluvial and marine processes, and human influences of various surface and subsurface activities and flood-control measures.
The Mekong Delta is one of many megadeltas worldwide that are in peril because of rising sea levels that may accelerate under climate change (Syvitski and others, 2009). Studies of potential climate change or salinity impacts in the Mekong Delta have used only relative or arbitrary projections of static sea level change for conducting assessments (Kaida, 1974; Tong and others, 2004; Wassman and others, 2004; Hanh and Furukawa, 2007; Nguyen 2007; Buschmann and others, 2008; Ninh and others, 2008). All of these investigations indicate that any rise in mean sea level will be expected to cause negative consequences in the erosion, submergence, or salinization of natural, agricultural, and aquacultural resources in the absence of mitigation or adaptation strategies. These same studies consider only a relative change in sea level and do not consider estimates of land subsidence or

2 Development of Sea Level Rise Scenarios for Climate Change Assessments of the Mekong Delta, Vietnam
diminished sedimentation rates that may be as important (or more important) in deltaic environments than is predicted acceleration of sea level under climate change. New tools, data, and models will be required to improve our understanding, forecasts, and planning for managing the Mekong and other megadeltas where coastal development, riverflow manipulations, subsurface withdrawals, and climate change threaten ecological and economical sustainability. This report provides constructed time series of potential sea level rise scenarios for the Mekong Delta region by incorporating (1) aspects of observed intra- and inter-annual sea level variability from tide records and (2) projected estimates for different rates of regional subsidence and accelerated eustacy through the year 2100 corresponding with the Intergovernmental Panel on Climate Change (IPCC) climate models and emission scenarios.
Accelerated Sea Level Rise with Climate Change
Global eustacy alone has accounted for a sea level rise of 14–20 centimeters (cm) during the 20th century (Douglas 1991, 1997, 2001; Mitrovica and Davis, 1995; Peltier and Jiang, 1997; IPCC, 2001, 2007; Holgate and Woodworth, 2004; Church and White, 2006; Bindoff and others, 2007), and this rise is expected to continue and most likely accelerate because of human-induced global warming over the 21st century. The IPCC Fourth Assessment Report (AR4) is the most current and conservative assessment of sea level rise; it projects an upper estimate of a 0.59-meter (m) rise in sea level on the basis of the A1F1 scenario and a lower estimate of 0.18-m rise for the B1 emission scenario by the year 2100 (IPCC, 2007). The family of A1 emission scenarios in the IPCC (2007) report (groups A1T, A1B, A1F1) is based on continued rapid economic growth and the higher range of expected temperature increase (1.4–6.4 degrees Celsius [°C]) and sea level rise (0.26–0.59 m). The B1 emission scenario represents the more conservative use of fossil fuels and global environmental sustainability with the lower range of projected temperature (1.1–2.9°C) and sea level rise (0.18–0.38 m). These AR4 estimates of sea level rise are used in this report to represent the range of accelerated sea level rise over the next century for constructing regionally specific scenarios of relative sea level rise for the Mekong Delta.
Historical Eustatic Sea Level Rise of the China Sea
In addition to the potential for accelerated rates of sea level under climate change, the historical rate of global eustacy for the past century has been measured on the basis
of analyses of long-term tide gage records at nearly 1.8 millimeters per year (mm/yr) for tectonically stable coasts (Douglas 1991, 1997, 2001; Mitrovica and Davis, 1995; Peltier and Jiang, 1997; IPCC 2001, 2007; Holgate and Woodworth, 2004; Church and White, 2006; Bindoff and others, 2007). Tide gages in coastal areas undergoing uplift or subsidence can provide local and regional estimates of relative sea level trends as related to vertical land movement. While numerous tide gages are in operation worldwide and throughout the China Sea Basin, few provide data records long enough (more than 50 years) to calculate relative sea level trends for extracting regional rates of vertical land movement. Regional estimates of sea level trend in the eastern part of the East China Sea estimated from the Shanghai tide record over the period of 1945–2001 measured 1.8 ± 0.2 mm/yr, which is consistent with other global eustacy estimates (Yu and others, 2002). Comparable estimates from the Hong Kong tide records show a long-term rise of 1.9 to 2.3 mm/yr in sea level (Ding and others, 2001, 2002; Wong and others, 2003). Sea level analysis of more than a dozen tide gages in Japan and the Philippines showed rising and falling sea levels due to the overriding influences of tectonic forces and groundwater withdrawal (Yanagi and Akaki, 1994). Consequently, a rate of 1.8 mm/yr was used in this report to represent the historical rate for global eustacy apart from the accelerated rate projected with future climate change.
Land-Surface Elevation Change of Deltas
Land-surface change is a more certain and constant process in deltaic settings; it usually far exceeds rates of eustatic sea level rise (Jelgersma, 1996; Pont and others, 2002; Ericson and others, 2006). Numerous factors and processes can be involved in increasing or decreasing land-surface elevation including sedimentation, compaction, dewatering, erosion, and organic accretion. Increasing land-surface elevation can occur with uplifts in tectonically active zones or with aggradation from high deposition of alluvial sedimentation. More deltas are sinking rather than building, however, for lack of sediment supply, which is cut off by upstream dams and reservoirs for hydropower and recreational needs or for flood-control measures involving channelization, levees, or dike construction (Ericson and others, 2006; Syvitski and others, 2009).
Natural subsidence rates in deltaic environments from soil compaction of sedimentary deposits are characteristically greater than the global average for eustatic sea level rise, ranging up to 10 mm/yr or more (Jelgersma, 1996; Pont and others, 2002; Ericson and others, 2006). Tide gage records and releveling surveys show that the Mississippi River Delta region, United States, is subsiding fourfold or greater than current eustatic sea level rise (Penland and Ramsey,

Intra- and Inter-annual Sea Level Variability at Vung Tau 3
1990; Gornitz, 1995; Shingle and Dokka, 2004). Human-caused effects of subsurface fluid withdrawal of water and minerals have also accounted for abrupt and accelerated subsidence. Other studies show that the city of Bangkok and the Chao Phraya Delta, Thailand, are rapidly subsiding from groundwater withdrawal that is employed to meet the water demands for a growing population and agricultural needs (Jelgersma and others, 1993; Ericson and others, 2006). Little is known, however, of the geology and actual rates of sedimentation and subsidence across the Mekong Delta region. Currently, the Mekong River is mostly unregulated and contributes some degree of sediment deposition across the flood plain and delta reaches (Ericson and others, 2006; Syvitski and others, 2009). Unlike the Mississippi River, the Mekong River is without constructed levees or flood controls in the delta region and annually undergoes overbank flooding. The difference between the rate of subsidence by compaction and the additive effect of sediment deposition represents the net effect of land-surface loss or gain or net subsidence. The actual rate of net subsidence is a function of the rates of compaction and tectonic influences offset by accretion from inorganic sedimentation and organic deposition. Because of the lack of published data and probable range of net subsidence rates throughout the Mekong Delta, values of 0, 1, 3, 6, and 9 mm/yr were used to account for potential net subsidence in generating alternative sea level rise scenarios.
Relative Sea Level Trends for Coastal Vietnam
Sea level trends from tide gage records can provide estimates of regional subsidence if those records are reliable and of sufficient length. There are 21 tide gages on the Vietnam coast, but only 7 stations record sea level hourly (Hanh and Furukawa, 2007). The longest reliable dataset is from the Hon Dau station in northern Vietnam. A relative sea level rise of 1.9 mm/yr was observed at Hon Dau during the period 1960–2000, which is concomitant with mean global eustacy (Hanh and Furukawa, 2007). Tuong (2001) calculated sea level trends varying from 1.75 to 2.56 mm/yr at four stations in Vietnam. Syvitski and others (2009) estimated a relative sea level rise of 6 mm/yr for the Mekong Delta based on data from the Vung Tau tide gage. The Vung Tau station in southern Vietnam is the closest tide gage to the Mekong Delta with readily available data; however, the tide gage at Vung Tau is adjacent to but not in the deltaic plain of the Mekong Delta. Furthermore, Hanh and Furukawa (2007) reported that the long-term trend of the Vung Tau gage dataset was unreliable because the location of the station had changed and there were missing data points. While problematic for estimating regional subsidence on the basis of location and record quality, the Vung Tau tide record was analyzed to add the seasonal
and inter-annual variability of South China Sea tides for construction of sea level rise scenarios.
Global Tide Gage Stations and Records for Vietnam
Two worldwide sea level data depositories that have archived data for tide gages in Vietnam supply the data digitally over the Internet. The Permanent Service for Mean Sea Level (PSMSL) has long-term historical datasets for five tide gages in Vietnam with at least 20 years of data: Hon Dau, Hon Ngu, Da Nang, Qui Nhon, and Vung Tau (Natural Environment Research Council [NERC], 2010; Woodworth and Player, 2003). Sea level records from tide gage stations along the Vietnam coast were downloaded from the PSMSL (NERC, 2010) Web site maintained at Proudman Oceanographic Laboratory, U.K., and contributed by the Marine Hydrometeorological Center of Vietnam. Most records from Vietnam and elsewhere in Southeast Asia around the South China Sea have operational data for only short periods and are problematic for coherency analysis among gage records because of high tectonic influences, groundwater withdrawal issues, or operational interruptions. The Vung Tau gage station has a long history dating back to 1918 and has readily available data from the PSMSL database for the period 1979–2001 for mean monthly (fig. 1) and annual sea level. Online automated hourly readings were also available for Vung Tau from 2007 to present from the University of Hawaii Sea Level Center (UHSLC, 2010).
Intra- and Inter-annual Sea Level Variability at Vung Tau
Analysis of the Vung Tau gage record was conducted to extract sea level trends while retaining the intra- and inter-annual variability of sea level in the South China Sea that primarily controls flooding patterns and frequency of the Mekong Delta region. Flooding in the Mekong Delta is also coupled with tides in the Gulf of Thailand but to a lesser degree and with a much lower tidal range (Wassmann and others, 2004). South China Sea tides at the mouth of the Mekong Delta are irregularly semidiurnal with a range of 1.2–3.5 m (Hanh and Furukawa, 2007). The tidal data used in this study are composed of mean monthly water levels, which capture both short-term seasonal deviations and long-term trends of sea level change. The mean monthly tide records from 1979 to 2001 (see app. 1) are interrupted by a few months in early 1992 when the gage station was relocated (see fig. 1). Linear trend analysis of the entire record showed a positive 6 mm/yr slope (fig. 2) that has also been reported by others (Syvitski and others, 2009). The pattern of inter-annual

4 Development of Sea Level Rise Scenarios for Climate Change Assessments of the Mekong Delta, Vietnam
variation, however, does not reflect coherency with other Vietnam gages and other South China Sea sites, indicating an apparent effect of gage relocation and rectification circa early 1992. Linear regressions of the gage record into pre- and post-1992 periods demonstrated a near zero (-0.62 mm/yr) slope or sea level trend from 1979 to 1989 and a 1.77 mm/yr slope from 1992 to 2001; this latter value is more consistent with expected intra- and inter-annual variation for the region (fig. 3). The latter period (1992–2001) is consistent with other gage trends in the region, which are concomitant with expected global eustacy rates for the 20th century: nearly 1.8 mm/yr.
Vung Tau gage records for the split time periods prior to and after 1992 were readjusted to a zero slope to provide a continuous record for the period of record reflecting the intra- and inter-annual variation of sea level change for the Mekong
Delta coastal reach of the South China Sea (fig. 4). Readjusted monthly values were averaged by month for all years (1979–2001) to provide an understanding of average seasonal pattern and to establish proxy values for the four missing months in late 1991 and early 1992 (fig. 5). A continuous record of mean sea level variation from 1979 to 2001 was constructed to mimic the natural cycle of high and low tidal variation attributed to astronomical and meteorological causes common to the Mekong Delta reach of the South China Sea. This record of 22 years provides a little more than a tidal epoch of continuous monthly data. A long-term time series of sea level variability was constructed by repeating this detrended historical record for the period 2002–2100 as the base component of constructed sea level scenarios.
Figure 1. Mean monthly water level at Vung Tau, Vietnam, tide gage obtained from the Permanent Service for Mean Sea Level (PSMSL) database, in which archived data are adjusted to a revised local reference datum defined to be approximately 7,000 millimeters below mean sea level.
YEAR
1975 1980 1985 1990 1995 2000 2005
MEA
N M
ONTH
LY W
ATER
LEVE
L, IN
MIL
LIM
ETER
S
6,600
6,800
7,000
7,200
7,400
7,600
YEAR
1975 1980 1985 1990 1995 2000 2005
MEA
N M
ONTH
LY W
ATER
LEVE
L, IN
MIL
LIM
ETER
S
6,600
6,800
7,000
7,200
7,400
7,600
y = 5.9125x - 4751.6R 2 = 0.057
Figure 2. Sea level trend of about 6 millimeters per year of mean monthly observations for the Vung Tau, Vietnam, tide gage record from 1979 to 2001.

Intra- and Inter-annual Sea Level Variability at Vung Tau 5
Year
1975 1980 1985 1990 1995 2000 2005
MEA
N M
ONTH
LY W
ATER
LEVE
L, IN
MIL
LIM
ETER
S
6,600
6,800
7,000
7,200
7,400
7,600y = -0.6184x + 8204.2R 2 = 0.0002
y = 1.7734x + 3526.2R 2 = 0.001
1979-1989 1992-2001
YEAR
1975 1980 1985 1990 1995 2000 2005
MEA
N M
ONTH
LY W
ATER
LEVE
L, IN
MIL
LIM
ETER
S
-400
-200
0
200
400
MONTH
Jan. Feb. Mar. Apr. May June July Aug. Sept. Oct. Nov. Dec.
MEA
N M
ONTH
LY W
ATER
LEVE
L, IN
MIL
LIM
ETER
S
-400
-300
-200
-100
0
100
200
300
400
Figure 3. Linear regressions of the Vung Tau, Vietnam, tide gage demonstrating a near-zero slope or sea level trend from 1979 to 1989 and a 1.77 millimeters per year slope from 1992 to 2001, which is more consistent with expected intra- and inter-annual variation for the region.
Figure 5. Seasonal variation of mean monthly water levels (± 1 standard error) for the Vung Tau, Vietnam, tide gage station after zero-slope adjustment for all years 1979 to 2001.
Figure 4. Sea level variation of the Vung Tau, Vietnam, tide gage record after adjusting the time series to accomplish a zero-slope long-term trend.

6 Development of Sea Level Rise Scenarios for Climate Change Assessments of the Mekong Delta, Vietnam
Rectification of the Vung Tau Sea Level Record
Hourly readings of sea level at Vung Tau for 2007–9 obtained from real-time gage monitoring by the UHSLC were used to determine monthly values of mean tide level (MTL), mean lower low water (MLLW), and mean higher high water (MHHW) for record rectification (fig. 6; app. 2). Rectification involved adjusting the relative historical record for the Vung Tau tide station to the current real-time gage readings and tide station datum. The seasonal pattern of low summer sea levels in contrast to high seas in late fall was consistent in the monthly and hourly datasets for Vung Tau. Reconstructed sea level scenarios were rectified to match the MHHW relation for the 2007–9 period because of the lack of alternate or available datums for sea level or land elevation. The MHHW condition was used to more appropriately reflect the potential for flood frequency at a given elevation relative to the Vung Tau gage station datum. The advantage of using the historical record includes (1) the retention of the local variability and seasonality of sea level heights and (2) long-term climatic autocorrelation.
Developing Sea Level Rise Scenarios for the 21st Century
Sea level scenarios for the Mekong Delta were generated and rectified from historical sea level variability at the Vung Tau tide station augmented with future projections for different
rates of net land subsidence, historical eustatic sea level rise, and accelerated global eustacy for IPCC AR4 projections of A1F1 and B1 emission scenarios under climate change. Projected scenarios of relative sea level rise (Prslr) were calculated as the sum of sea level variability of the Vung Tau gage record (VTslv), historical eustatic sea level rise (HEslr), net land subsidence (Nsub), and accelerated eustatic sea level rise (AEslr) as expressed in the following equation:
Prslr = VTslv + HEslr + Nsub + AEslr (1)
The Vung Tau sea level variability record (VTslv) was repeated for successive 22-year periods to the year 2100 to form the base zero-slope trend line for scenario construction. A rate of 1.8 mm/yr was used to represent the historical rate for global eustacy (HEslr) apart from the accelerated rate projected with future climate change. Estimates for net land subsidence (Nsub) in the Mekong Delta have been derived from the Vung Tau gage or by analog from other delta systems of similar age and history (Syvitski and others, 2009). The lack of long-term or reliable gage data within the Mekong Delta specifically precludes any single or accurate measure of geologic subsidence for the varied habitats and settings across the delta. Using the Mississippi River Delta as an analog delta of similar age and history, it can be assumed that subsidence rates could be expected to be as high as 10 mm/yr (Penland and Ramsey, 1990; Gornitz, 1995; Shingle and Dokka, 2004). Sea level scenarios were derived for a range of linear subsidence rates (Nsub) characteristic of deltaic environments which herein included 0, 1, 3, 6, and 9 mm/yr. These values reflect probable rates for natural subsidence of deltaic environments and do not include accelerated rates or human causes of subsidence such as groundwater withdrawals. Projected rates for accelerated eustatic sea level
Figure 6. Monthly values of mean tide level (MTL), mean lower low water (MLLW), and mean higher high water (MHHW) calculated from hourly sea level readings at Vung Tau, Vietnam, for the 2007–9 period.
Nov. 2007 Mar. 2008 July 2008 Nov. 2008 Mar. 2009 July 2009 Nov. 2009
MEA
N M
ONTH
LY W
ATER
LEVE
L, IN
MIL
LIM
ETER
S
500
1,000
1,500
2,000
2,500
3,000
3,500
4,000
4,500
MHHW
MTL
MLLW

Developing Sea Level Rise Scenarios for the 21st Century 7
rise (AEslr) were based on IPCC AR4 projections for the best case (B1) emission scenario with a minimum rise of 0.18 m and maximum rise of 0.38 m in contrast to the worst case (A1F1) emission scenario with a minimum rise of 0.26 m and maximum rise of 0.59 m (IPCC, 2007) (fig. 7). A total of 20 sea level scenarios were constructed on the basis of five subsidence and four accelerated eustacy alternatives (apps. 3–6). A representative scenario of the monthly chronology for the maximum case projected relative sea level rise (Prslr) in the scenario set for the A1F1 high accelerated eustatic sea level rise (AEslr) and the highest net subsidence (Nsub) at 9 mm/yr is contrasted with the historical eustacy condition (HEslr) without climate change (fig. 8).
Because these constructed scenarios are rectified to the station datum of the Vung Tau gage, these projections provide
elevations that can be readily compared with known or current land-based elevations of roads, wetlands, rice fields, or other features to determine the potential for submergence over the next century. Table 1 provides the projected maximum flood elevation for the different sea level rise scenarios for given subsidence rates and IPCC emission scenarios. The actual pattern and timing of submergence for a given surface elevation (for example, road, wetland, or rice field) are incremental from the start of inundation to complete submergence. With an example of an arbitrary elevation of 0.5 m above current sea level, sea level flooding is expected to take 30 years under the A1F1 maximum accelerated eustatic sea level rise (AEslr) and highest net subsidence (Nsub) (9 mm/yr) from first flood in 2035 to complete inundation by 2068 (fig. 9).
Figure 8. Constructed sea level rise scenarios under climate change for the maximum A1F1 emission case (IPCC, 2007) including net subsidence at 9 millimeters per year (mm/yr) (pink) in contrast with the historical eustacy condition without climate change (1.8 mm/yr sea level rise only) (blue) and rectified to the contemporary tide record (black).
A1F1 Max
B1 Max
B1 Min
A1F1 Min
YEAR
2000 2020 2040 2060 2080 2100
SEA
LEVE
L RIS
E, IN
MET
ERS
0.0
0.1
0.2
0.3
0.4
0.5
0.6
0.7Figure 7. Accelerated eustatic sea level curves for B1 and A1F1 emission scenarios, maximum and minimum estimates based on IPCC (2007) AR4 projections.
YEAR
2000 2020 2040 2060 2080 2100
MEA
N M
ONTH
LY H
IGHE
R HI
GH W
ATER
LEVE
L, IN
MET
ERS
3.0
3.5
4.0
4.5
5.0
5.5
6.0

8 Development of Sea Level Rise Scenarios for Climate Change Assessments of the Mekong Delta, Vietnam
Figure 9. Timing and degree of projected submergence (percentage of inundation) of a given land surface or feature 0.5 meter (m) above current sea level heights in relation to a constructed sea level scenario based on maximum A1F1 emission projection (IPCC, 2007) and a net subsidence rate of 9 millimeters per year (mm/yr).
Table 1. Maximum elevation of projected sea level heights extracted from constructed sea level rise scenarios from 2010 to 2100 for minimum (min) and maximum (max) rates of B1 and A1F1 emission scenarios (IPCC, 2007) and different rates for net subsidence.
[mm/yr, millimeters per year]
Net subsidence rate, in mm/yrB1 min, 0.18 m
by 2100, in metersB1 max, 0.38 m
by 2100, in metersA1F1 min, 0.26 m
by 2100, in metersA1F1 max, 0.59 m by 2100, in meters
0 4.30 4.47 4.38 4.68
1 4.39 4.57 4.47 4.77
3 4.57 4.75 4.65 4.96
6 4.85 5.02 4.93 5.23
9 5.12 5.30 5.20 5.50
YEAR
2000 2020 2040 2060 2080 2100
PERC
ENTA
GE IN
UNDA
TION
0
20
40
60
80
100
Conclusion The Mekong Delta is one of many megadeltas worldwide
that are in peril because of rising sea levels that may accelerate under climate change (Syvitski and others, 2009). We provide in this investigation a series of sea level scenarios relating to the tidal characteristics and variability of the South China Sea and estimated rates of net land subsidence and eustacy for the Mekong Delta region for the 21st century. These sea level rise scenarios were constructed from the present (year 2010) to the year 2100 to assist subsequent Mekong Delta science studies and environmental assessments of climate change.
This approach improves on static measures by allowing for a time-series analysis over seasons and years that show incremental rather than instantaneous submergence over time. Recognition of differential subsidence and sedimentation processes that vary over space or time within any delta system provides another important aspect of delta dynamics that are considered. Scientists, environmental planners, and policymakers will benefit from the more comprehensive perspective of potential sea level rise scenarios that include future changes in eustatic sea level and vertical land movement expected within deltaic environments and with changing climate.

References Cited 9
References Cited
Bindoff, N.L., Willebrand, J., Artale, V., Cazenave, A., Gregory, J., Gulev, S., Hanawa, K., Le Quéré, C., Levitus, S., Nojiri, Y., Shum, C.K., Talley, L.D., and Unnikrishnan, A., 2007, Observations—oceanic climate change and sea level, in Solomon, S., Qin, D., Manning, M., Chen, Z., Marquis, M., Averyt, K.B., Tignor, M., and Miller, H.L., eds., Climate change 2007—the physical science basis. Contribution of Working Group I to the Fourth Assessment Report of the Intergovernmental Panel on Climate Change: Cambridge, U.K., and New York, Cambridge University Press.
Buschmann, J., Berg, M., Stengel, C., Winkel, L., Sampson, M.L., Trang, P.T.K., and Viet, P.H., 2008, Contamination of drinking water resources in the Mekong Delta floodplains—arsenic and other trace metals pose serious health risks to population: Environment International, v. 34, p. 756–764.
Church, J.A., and White, N.H., 2006, A 20th century acceleration in global sea-level rise: Geophysical Research Letters, v. 33, L01602.
Ding, X., Zheng, D., Chen, Y., Chao, J., and Li, Z., 2001, Sea level change in Hong Kong from tide gauge measurements of 1954–1999: Journal of Geodesy, v. 74, p. 683–689.
Ding, X., Zheng, D., Chen, Y., Huang, C., and Chen, W., 2002, Sea level change in Hong Kong from tide gauge records, in Huang, C., and Qian, Z., eds., Proceedings of the Fourth Workshop of the Asia-Pacific Space Geodynamics Program, Shanghai, China, May 15–18, 2001: Shanghai Scientific and Technical Publishers.
Douglas, B.C., 1991, Global sea level rise: Journal of Geophysical Research, v. 96, p. 6981–6992.
Douglas, B.C., 1997, Global sea level rise—a redetermination: Surveys in Geophysics, v. 18, p. 279–292.
Douglas, B.C., 2001, Sea-level change in the era of the recording tide gauge, in Douglas, B.C., Kearney, M.S., Leatherman, S.P., eds., Sea-level rise—history and consequence: San Diego, Academic Press, p. 37–61.
Ericson, J.P., Vorosmarty, C.J., Dingman, S.L., Ward, L.G., and Meybeck, M., 2006, Effective sea- level rise and deltas—causes of change and human dimension implications: Global and Planetary Change, v. 50, p. 63–82.
Gornitz, V., 1995, Sea-level rise—a review of recent past and near-future trends: Earth Surface Processes and Landforms, v. 20, p. 7–20.
Hanh, P.T.T., and Furukawa, M., 2007, Impact of sea level rise on coastal zone of Vietnam: Bulletin of the Faculty of Science. University of the Ryukyus, v. 84, p. 45–59.
Holgate, S.J., and Woodworth, P.L., 2004, Evidence for enhanced coastal sea level rise during the 1990s: Geophysical Research Letters, v. 31, L07305.
IPCC (Intergovernmental Panel on Climate Change), 2001, Climate change 2001—the scientific basis: New York, Cambridge University Press.
IPCC (Intergovernmental Panel on Climate Change), 2007, Climate change 2007—the physical science basis: New York, Cambridge University Press.
Jelgersma, S., 1996, Land subsidence in coastal lowlands, in Milliman, J.D., and Haq, B.U., eds., Sea-level rise and coastal subsidence: Kluwer Academic Publishers, p. 47–62.
Jelgersma, S., Van der Zijp, M., and Brinkman, R., 1993, Sealevel rise and the coastal lowlands in the developing world: Journal of Coastal Research, v. 9, p. 958–972.
Kaida, Y., 1974, Hydrography of rice land in the Vietnamese part of the Mekong Delta: Southeast Asian Studies, v. 12, p. 143–156.
Mitrovica, J.X., and Davis, J.L., 1995, Present-day post-glacial sea level change far from the Late Pleistocene ice sheets—implications for recent analyses of tide gauge records: Geophysical Research Letters, v. 22, 2529–2532.
NERC (Natural Environment Research Council), 2010, Permanent Service for Mean Sea Level: National Oceanography Centre, Liverpool, U.K., accessed March 15, 2010, at http://www.psmsl.org/.
Nguyen, H.N., 2007, Flooding in Mekong River Delta, Vietnam: UNDP Human Development Report 2007/2008, paper no. 2007/53, 24 p.
Ninh, N.H., Huy, L.Q., Tuyet, L.T., Ly, C.T.P., and Uyen, N.T., 2008, The role of biodiversity in climate change mitigation in Vietnam—Red River estuary—Balat case study, in Biodiversity and climate change in Southeast Asia—Adaptations and Mitigation, Manila, Philippines, 19–20 February 2008, p. 1–20.
Peltier, W.R., and Jiang, X., 1997, Mantle viscosity, glacial isostatic adjustment and the eustatic level of the sea: Surveys in Geophysics, v. 18, p. 239–277.
Penland, S., and Ramsey, K., 1990, Relative sea-level rise in Louisiana and the Gulf of Mexico—1908–1988: Journal of Coastal Research, v. 6, p. 323–342.
Pont, D., Day, J.W., Hensel, P., Franquet, E., Torre, F., Rioual, P., Ibanez, C., and Coulet, E., 2002, Response scenarios for the deltaic plain of the Rhone in the face of an accelerated rate of sea-level rise with special attention to Salicornia-type environments: Estuaries, v. 25, p. 337–358.
10 Development of Sea Level Rise Scenarios for Climate Change Assessments of the Mekong Delta, Vietnam
Shingle, K.D., and Dokka, R.K., 2004, Rates of vertical displacement at benchmarks in the Lower Mississippi Valley and the northern Gulf Coast: U.S. Department of Commerce, NOAA Technical Report NOS/NGS 50, 135 p.
Syvitski, J.P.M., 2008, Deltas at risk: Sustainable Science, v. 3, p. 23–32.
Syvitski, J.P.M., Kettner, A.J., Overeem, I., Hutton, E.W.H., Hannon, M.T., Brakenridge, G.R., Day, J., Vorosmarty, C., Saito, Y., Giosan, L., and Nicholls, R.J., 2009, Sinking deltas due to human activities: Nature Geoscience, v. 2, p. 681–686.
Tong, P.H.S., Auda, Y., Populus, J., Aizpuru, M., Al Habshi, A., and Blasco, F., 2004, Assessment from space of mangroves evolution in the Mekong Delta, in relation to extensive shrimp farming: International Journal of Remote Sensing, v. 10, p. 4795–4812.
Tuong, N.T., 2001, Sea level measurement and sea level rise in Vietnam: Vietnam, Marine Hydrometeorological Centre.
UHSLC (University of Hawaii Sea Level Center), 2010, University of Hawaii Sea Level Center home page: http://uhslc.soest.hawaii.edu/, accessed March 15, 2010.
Wassmann, R., Hien, N.X., Hoanh, C.T., and Tuong, T.P., 2004, Sea level rise affecting the Vietnamese Mekong Delta—water elevation in the flood season and implications for rice production: Climate Change, v. 66, p. 89–107.
Wong, W.T, Li, K.W., and Yeung, K.H., 2003, Long term sea level change in Hong Kong: Hong Kong Meteorological Society Bulletin, v. 13, p. 24–40.
Woodroffe, C.D., Nicholls, R.J., Saito, Y., Chen, Z., and Goodbred, S.L., 2006, Landscape variability and the response of Asian megadeltas to environmental change, in Harvey, N., ed., Global change and integrated coastal management: The Asia-Pacific Region, Springer, p. 277–314.
Woodworth, P.L., and Player R., 2003, The Permanent Service for Mean Sea Level—an update to the 21st century: Journal of Coastal Research, v. 19, p. 287–295.
Yanagi, T., and Akaki, T., 1994, Sea level variation in eastern Asia: Journal of Oceanography, v. 50, p. 643–651.
Yu, N., Zheng, D., Ding, X., and Huang, C., 2002, Sea level change in Shanghai from tide gauge records, in Huang, C., and Qian, Z., eds., Proceedings of the Fourth Workshop of the Asia-Pacific Space Geodynamics Program, Shanghai, China, May 15–18, 2001: Shanghai Scientific and Technical Publishers.

Doyle and others—D
evelopment of Sea Level Rise Scenarios for Clim
ate Change Assessm
ents of the Mekong D
elta, Vietnam—
Open-File Report 2010–1165


