113
Open Object Business Intelligence Release 1.0 Tiny SPRL 2009-04-09

Open Object Business IntelligenceRelease 1.0
Tiny SPRL
2009-04-09


i
CONTENTS

ii

Open Object Business Intelligence, Release 1.0
CONTENTS 1
I Part 1 : Introduction 5
1 Goal of the project 7
2 What is for User? 9
2.1 For the end-user: . . . . . . . . . . . . . . . . . . . . . . . . . . . . . . . . . . . . . . . . . . . . . 9
2.2 For the administrator user: . . . . . . . . . . . . . . . . . . . . . . . . . . . . . . . . . . . . . . . . 9
2.3 For the developer: . . . . . . . . . . . . . . . . . . . . . . . . . . . . . . . . . . . . . . . . . . . . 9
3 OLAP 11
3.1 Who uses OLAP and Why? . . . . . . . . . . . . . . . . . . . . . . . . . . . . . . . . . . . . . . . 12
4 Terminologies 15
II Part 2 : Architecture 17
5 Schema 19
6 Components 21
6.1 The Cube . . . . . . . . . . . . . . . . . . . . . . . . . . . . . . . . . . . . . . . . . . . . . . . . . 21
6.2 The CLI interface . . . . . . . . . . . . . . . . . . . . . . . . . . . . . . . . . . . . . . . . . . . . 21
6.3 The Cube Definition . . . . . . . . . . . . . . . . . . . . . . . . . . . . . . . . . . . . . . . . . . . 21
6.4 The Web Client . . . . . . . . . . . . . . . . . . . . . . . . . . . . . . . . . . . . . . . . . . . . . . 22
6.5 The OpenOffice plugin . . . . . . . . . . . . . . . . . . . . . . . . . . . . . . . . . . . . . . . . . . 22
6.6 The Open ERP interface . . . . . . . . . . . . . . . . . . . . . . . . . . . . . . . . . . . . . . . . . 22
7 Extra libraries 23
8 Introduction to the OpenObject Module 25
8.1 Explanation of the components . . . . . . . . . . . . . . . . . . . . . . . . . . . . . . . . . . . . . 26
III Part 3 : MDXAlchemy 29
9 MDXOverview 31
9.1 Independent yet Integrated to OpenERP . . . . . . . . . . . . . . . . . . . . . . . . . . . . . . . . . 31
9.2 Supported Databases . . . . . . . . . . . . . . . . . . . . . . . . . . . . . . . . . . . . . . . . . . . 31
10 A look at few examples to write MDX Queries 33

Open Object Business Intelligence, Release 1.0
2 CONTENTS
IV Part 4 : Installing 35
11 Installation of BI 37
V Part 5 : Configuration 39
12 Configuration Interface 41
12.1 Introduction . . . . . . . . . . . . . . . . . . . . . . . . . . . . . . . . . . . . . . . . . . . . . . . 41
12.2 Connecting to an Existing Database . . . . . . . . . . . . . . . . . . . . . . . . . . . . . . . . . . . 47
12.3 Writing a Schema . . . . . . . . . . . . . . . . . . . . . . . . . . . . . . . . . . . . . . . . . . . . 47
13 Defining Schema in XML 49
14 XML in open object 51
14.1 Introduction to the OpenObject Module . . . . . . . . . . . . . . . . . . . . . . . . . . . . . . . . . 51
14.2 Explanation of the components . . . . . . . . . . . . . . . . . . . . . . . . . . . . . . . . . . . . . 52
15 Creating Cube Definition using XML file 55
VI Part 6 : Using CommandLine Interface (CLI) 61
16 Command Line Interface 63
16.1 Introduction to the cli . . . . . . . . . . . . . . . . . . . . . . . . . . . . . . . . . . . . . . . . . . 63
17 Running Automated Test Cases 65
18 Reports 67
19 WebService Interface 69
VII Part 7 : Using Cube Browser 71
20 Cube Browser 73
20.1 Goal behind Cube Browser . . . . . . . . . . . . . . . . . . . . . . . . . . . . . . . . . . . . . . . . 73
21 Loading the Cube 75
22 Creating your report with drag and drop 79
23 Swapping Rows and Columns 81
24 Adding Slicer 83

Open Object Business Intelligence, Release 1.0
CONTENTS 3
25 Drill Up/Down 85
25.1 Drill Down on a Member . . . . . . . . . . . . . . . . . . . . . . . . . . . . . . . . . . . . . . . . . 85
25.2 Drill Up on a Member . . . . . . . . . . . . . . . . . . . . . . . . . . . . . . . . . . . . . . . . . . 85
26 Graphs 87
VIII Part 8 : Using Cube Designer 89
27 Goal of Cube Designer 91
27.1 Basic features . . . . . . . . . . . . . . . . . . . . . . . . . . . . . . . . . . . . . . . . . . . . . . . 91
28 Database Introspection 93
29 Defining Cube 95
30 Defining Dimension 99
31 Defining Hierarchy 101
32 Defining Level 105
33 Defining Measure 107

Open Object Business Intelligence, Release 1.0
4 CONTENTS

5
Part I
Part 1 : Introduction


7
CHAPTER
ONE
GOAL OF THE PROJECT
In simple words Business Intelligence or BI is the act of capturing raw data, then transforming and combining that datainto information that can be proactively used to improve business. So,the goal of BI is to empower decision-makers,allowing them to make better and faster decisions. After all Better decisions make better business!
In general any Business Intelligence Solution must provide :
1. The first challenge business intelligence faces is gathering the necessary data about the business. The key forgathering data is automating the process. Gathering data was very time and money consuming in the past, butwith today’s modern computer systems, it’s much easier to collect data from various sources.
2. The second business intelligence task is to analyze the collected data and to extract information from it. Theextracted information is then turned into business knowledge.
3. The third and final business intelligence task is to use the newly gathered business knowledge to improve thebusiness.
Our goal of OpenObject BI is to provide python based BI Solution that can
1. Provide all BI functanality.
2. Creating cube on the fly with minimum steps.
3. Can access any type of database to make Schema and Cube.
4. Reports can be used directly in OpenOffice.
5. Making everything as object for easy expandability.

Open Object Business Intelligence, Release 1.0
8 Chapter 1. Goal of the project

9
CHAPTER
TWO
WHAT IS FOR USER?
The Open Object Business Intelligence system aims to be a full featured open source Business Intelligence systemwritten in Python. It implements a HOLAP (Hybride OLAP = ROLAP + MOLAP) cube and a MDX query enginebased on SQLAlchemy.
Comparing to most current business intelligence software in the market, our goal is to produce a BI for the mid market.It has to be:
2.1 For the end-user:
• Is easy and fast to use: a simple web-interface that does not require any dependencies and can be integrated inproprietary softwares, and an OpenOffice interface for complex dashboards creation.
• Is easy to install: auto-installation on Windows and Linux, a few dependencies
• Integrated and independent from Open ERP.
2.2 For the administrator user:
• A cube designer within Open ERP (application and web-client)
• Easy to configure: Automatic cube definition (5 clicks, using introspection on database),
• Easy to maintain: the application must be smart enough that do not require any fine tuning in the cube definition:run well on bad indexes, no need to explicitly define aggregated table, no need to define axes.
• No intervention at all from developers: everything through interfaces for end-user.
2.3 For the developer:
• Everything (dimensions, ) must be object oriented with a module system to allow to add your own code to extendthe software, like in Open ERP.
• It must support main database engine and aggregation of multiple database: PostgreSQL, MySQL, Oracle,MSSQL etc... to do reporting for any application.

Open Object Business Intelligence, Release 1.0
10 Chapter 2. What is for User?
11
CHAPTER
THREE
OLAP
Online Analytical Processing (OLAP) means analysing large quantities of data in real-time. Unlike Online TransactionProcessing (OLTP), where typical operations read and modify individual and small numbers of records, OLAP dealswith data in bulk, and operations are generally read-only. The term ‘online’ implies that even though huge quantitiesof data are involved — typically many millions of records, occupying several gigabytes — the system must respond toqueries fast enough to allow an interactive exploration of the data. As we shall see, that presents considerable technicalchallenges.
OLAP performs multidimensional analysis of business data and provides the capability for complex calculations,trend analysis, and sophisticated data modeling. Whereas a relational database stores all data in the form of rows andcolumns, a multidimensional dataset consists of axes and cells. Consider the dataset
Year 2000 2001 GrowthProduct Dollar sales Unit sales Dollar sales Unit sales Dollar sales Unit salesTotal $7,073.00 2693 $7,636.00 3008 8.00% 12.00%Books $2,753.00 824 $3,331.00 966 21.00% 17.00%Fiction $1,341.00 424 $1,202.00 380 -10.00% -10.00%Non-fiction $1,412.00 400 $2,129.00 586 51.00% 47.00%Magazines $2,753.00 824 $2,426.00 766 -12.00% -7.00%Greetings cards $1,567.00 1045 $1,879.00 1276 20.00% 22.00%
The rows axis consists of the members ‘All products’, ‘Books’, ‘Fiction’, and so forth, and the columns axis consistsof the cartesian product of the years ‘2000’ and ‘2001’, and the calculation ‘Growth’, and the measures ‘Unit sales’and ‘Dollar sales’. Each cell represents the sales of a product category in a particular year; for example, the dollarsales of Magazines in 2001 were $2,426.
This is a richer view of the data than would be presented by a relational database. The members of a multidimensionaldataset are not always values from a relational column. ‘Total’, ‘Books’ and ‘Fiction’ are members at successive levelsin a hierarchy, each of which is rolled up to the next. And even though it is alongside the years ‘2000’ and ‘2001’,‘Growth’ is a calculated member, which introduces a formula for computing cells from other cells.
The dimensions used here — products, time, and measures — are just three of many dimensions by which the datasetcan be categorized and filtered. The collection of dimensions, hierarchies and measures is called a cube.
The above simple example or outlook shows how one can get the smallest details from the data stored for years inthe database in form of relation. It helps in managing resources, forming policies , budgeting , Business ProcessManagement,designing strategic marketing policies, forecasting and many more. The options are endless
The multidimensional is above all is a way of presenting data. Although some multidimensional databases store thedata in multidimensional format, I shall argue that it is simpler to store the data in relational format and manipulate itusing OLAP.
Open Object Business Intelligence, Release 1.0
12 Chapter 3. OLAP
3.1 Who uses OLAP and Why?
OLAP applications span a variety of organizational functions. Finance departments use OLAP for applications such asbudgeting, activity-based costing (allocations), financial performance analysis, and financial modeling. Sales analysisand forecasting are two of the OLAP applications found in sales departments. Among other applications, marketingdepartments use OLAP for market research analysis, sales forecasting, promotions analysis, customer analysis, andmarket/customer segmentation. Typical manufacturing OLAP applications include production planning and defectanalysis.
Important to all of the above applications is the ability to provide managers with the information they need to makeeffective decisions about an organization’s strategic directions. The key indicator of a successful OLAP application isits ability to provide information as needed, i.e., its ability to provide “just-in-time” information for effective decision-making. This requires more than a base level of detailed data.
Just-in-time information is computed data that usually reflects complex relationships and is often calculated on the fly.Analyzing and modeling complex relationships are practical only if response times are consistently short. In addition,because the nature of data relationships may not be known in advance, the data model must be flexible. A truly flexibledata model ensures that OLAP systems can respond to changing business requirements as needed for effective decisionmaking. Although OLAP applications are found in widely divergent functional areas, they all require the followingkey features:
1. Multidimensional views of data
2. Calculation-intensive capabilities
3. Time intelligence
3.1.1 Multidimensional views of data
Multidimensional views are inherently representative of an actual business model. Rarely is a business model limitedto fewer than three dimensions. Managers typically look at financial data by scenario (for example, actual vs. budget),organization, line items and at sales data by product, geography, channel, and time.
A multidimensional view of data provides more than the ability to “slice and dice”; it provides the foundation foranalytical processing through flexible access to information. Database design should not prejudice which operationscan be performed on a dimension or how rapidly those operations are performed. Managers must be able to analyzedata across any dimension, at any level of aggregation, with equal functionality and ease. OLAP software shouldsupport these views of data in a natural and responsive fashion,insulating users of the information from complex querysyntax. After all, managers should not have to understand complex table layouts, elaborate table joins, and summarytables.
Whether a request is for the weekly sales of a product across all geographical areas or the year-to-date sales in a cityacross all products, an OLAP system must have consistent response times. Basic aggregation is performed on some ofthe dimensions (product, customer, and channel). More complex calculations are performed on other dimensions. Themeasure dimension computes ratios and averages. Variances are computed along the scenario dimension. A complexmodel based on historical performance is used to compute the forecast scenario. Consistently quick response times tothese kinds of queries are key to establishing a server’s ability to provide multidimensional views of information.
3.1.2 Calculation-intensive capabilities
The real test of an OLAP database is its ability to perform complex calculations. OLAP databases must be able todo more than simple aggregation. While aggregation along a hierarchy is important, there is more to analysis thansimple data roll-ups. Examples of more complex calculations include share calculations (percentage of total) andallocations(which use hierarchies from a top-down perspective).
Open Object Business Intelligence, Release 1.0
3.1. Who uses OLAP and Why? 13
Key performance indicators often require involved algebraic equations. Sales forecasting uses trend algorithms such asmoving averages and percentage growth. Analyzing the sales and promotions of a given company and its competitorsrequires modeling complex relationships among the players. The real world is complicated – the ability to modelcomplex relationships is key in analytical processing applications.
Whereas transaction processing systems are judged on their ability to collect and manage data, analytical processingsystems are judged on their ability to create information from data.
3.1.3 Time intelligence
Time is an integral component of almost any analytical application. Time is a unique dimension because it is sequentialin character (January always comes before February). True OLAP systems understand the sequential nature of time.Business performance is almost always judged over time, for example, this month vs. last month, this month vs. thesame month last year. The time hierarchy is not always used in the same manner as other hierarchies. For example,a manager might ask to see the sales for May or the sales for the first five months of 1995. The same manager mightalso ask to see the sales for blue shirts but would never ask to see the sales for the first five shirts. Concepts such asyear-to-date and period over period comparisons must be easily defined in an OLAP system.
In addition, OLAP systems must understand the concept of balances over time. For example, if a company sold 10shirts in January, five shirts in February, and 10 shirts in March, then the total balance sold for the quarter would be 25shirts. If, on the other hand, a company had a head count of 10 employees in January, only five employees in February,and 10 employees again in March, what was the company’s employee head count for the quarter? Most companieswould use an average balance. In the case of cash, most companies use an ending balance.

Open Object Business Intelligence, Release 1.0
14 Chapter 3. OLAP

15
CHAPTER
FOUR
TERMINOLOGIES
This page define all terminolgies. Objects in the OLAP cube use this convention.
Schema
A schema is a collection of N dimensions. It’s the meta description of cubes..
Hierarchy
A schema is divided in hierarchy, which are divided in dimensions. The main use of hierarchy is to check thatdifferent axis can not use dimensions of the same hierarchy.
Dimension
A dimension is an attribute, or set of attributes, by which you can divide measures into sub-categories. It’s atree structure that define the axis of the cube. They can be explicitly defined: partner_id.country_id.state_ids orrecursive ‘parent_id’. A dimension is divided in levels.
Level
One level of sub-categories defined by dimensions.
Measure
Meta data of the quantity your are measuring. (value) A measure may be complex, ex: the tuple (quantity,uom)Attributes which are also objects:
Agregator: an SQL function that define how we aggregate measures “sum”, “count”, “min”, “max”,“avg”, and “distinct-count” FormatString DataType (the measure/value datatype)
Open Object Business Intelligence, Release 1.0
16 Chapter 4. Terminologies
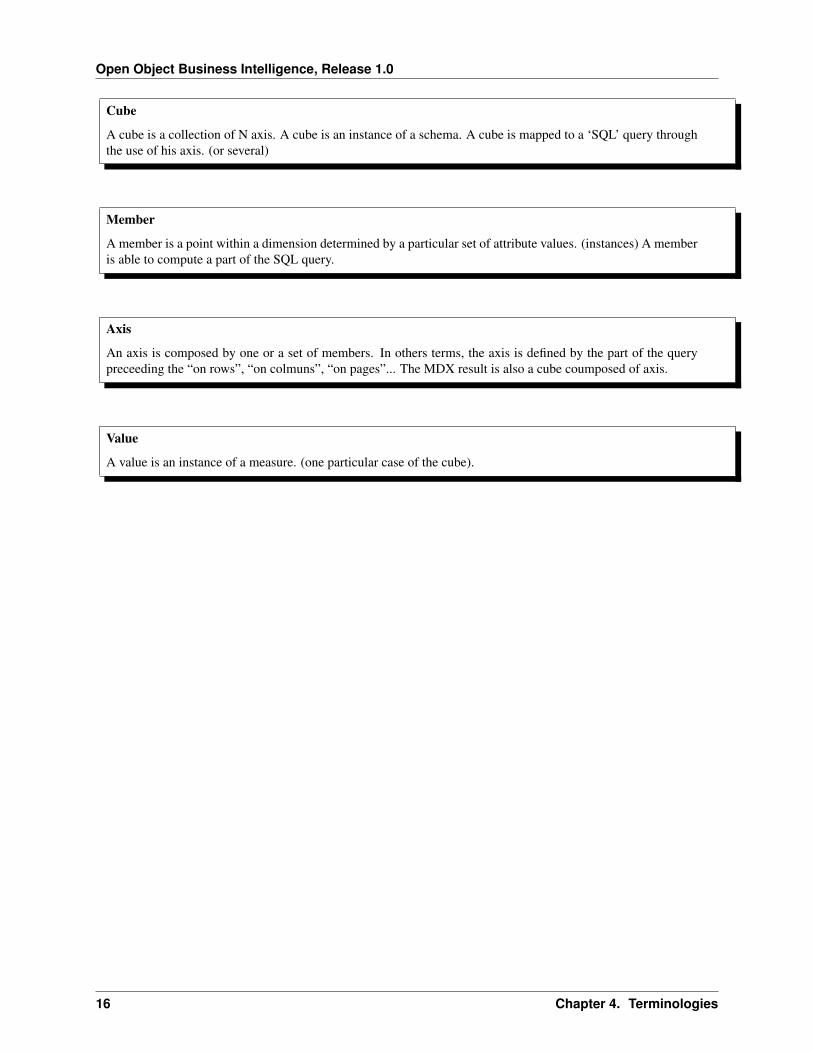
Cube
A cube is a collection of N axis. A cube is an instance of a schema. A cube is mapped to a ‘SQL’ query throughthe use of his axis. (or several)
Member
A member is a point within a dimension determined by a particular set of attribute values. (instances) A memberis able to compute a part of the SQL query.
Axis
An axis is composed by one or a set of members. In others terms, the axis is defined by the part of the querypreceeding the “on rows”, “on colmuns”, “on pages”... The MDX result is also a cube coumposed of axis.
Value
A value is an instance of a measure. (one particular case of the cube).

17
Part II
Part 2 : Architecture

19
CHAPTER
FIVE
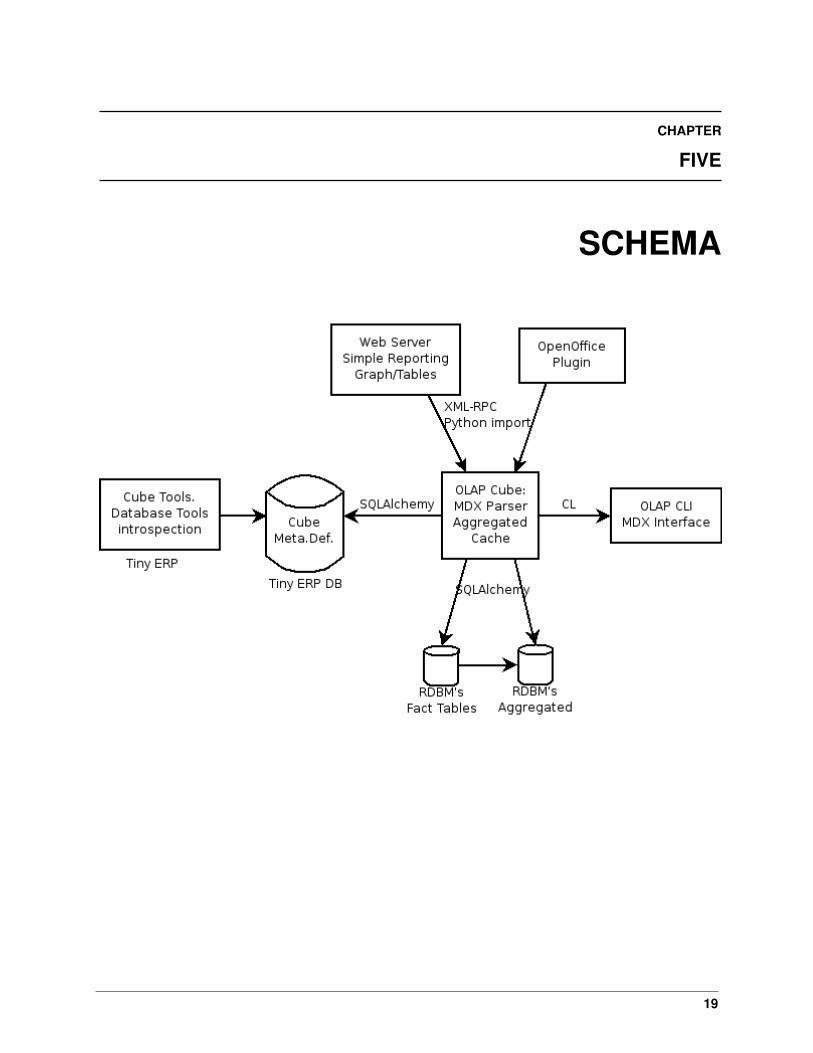
SCHEMA

Open Object Business Intelligence, Release 1.0
20 Chapter 5. Schema

21
CHAPTER
SIX
COMPONENTS
6.1 The Cube
The cube is based of the following component:
• A MDX parser that will transform an MDX expression to RDBMs queries: – Computed using a mix of: *Using star flow snake like in mondrian (based on joins)
* Using space hyerarchy cutting like in cubulus
• A memory cache system – On space hyerarchies (dimensions with space cutting)
• An aggregation system – Ability to create aggregated table to speed up all queries (automatic or user-defined)
– Queries will be computed on fact tables or aggregated tables
• A MDX Output (or several) to output the result
The cube will use:
• SQLAlchemy for all database communications
• XML-RPC for his external interfaces
• PyParser for MDX parsing
6.2 The CLI interface
Allows user to test MDX queries in this CLI command line interface. Simple script in python that will send XML-RPCqueries and print the result.
6.3 The Cube Definition
The meta data of the cube definition will be stored in the Open ERP database. The user interface to edit cubes is inOpen ERP. We will use the same concept of the one defined in the ... XML standard. So that we will be able, in a futurphase, to import such files.
This must not depend on any module of Open g ERP so that if you want to use the BI library independently, you maynot use Open ERP if cubes are defined. If cubes are not defined, you just install the minimal version of Open ERP

Open Object Business Intelligence, Release 1.0
22 Chapter 6. Components
that includes: the olap module, user management, workflow managements, access rights management, ... (the basemodule)
The goal is that the user never have to create the cubes himself. We will create a wizard that will compute cubes basedon introspection on the RDBM’s. The steps of this wizard:
• Selection of the database (type of db, then selection box like in the login of Open ERP)
• Selection of the factable (selection box)
• Selection of the measures and their attributes (selection box, aggregation func)
• Selection of the dimensions (click on a tree structure)
Then it’s done, the cube is computed. The aggrgated table may be also auto-matically computed by Open ERP.
The goal is to create new cube on the fly from the Open ERP client on every object, on user demand. This will alsoserver the online demo server.
The cube creation can be stored in the server of kept in memory for one time usage.
6.4 The Web Client
The web client is a web-server that display cubes and provide tools to browse them, it must provide at least theseoperations:
• switch view
• different type of charts
• drill up/down
• slice
• dice
6.5 The OpenOffice plugin
Similar to Palo but all operation of contruction and manipulation of cubes remains in Open ERP to limit developmenton OOo. The development on OOo just contains functions to:
• Insert new data (based on selection of dimensions and filters)
• Drill up/down functions
• Slice function
6.6 The Open ERP interface
From Open ERP, you should be able to right click/drag and drop any field to trigger the cube definition wizard tocreate your own cube on demand. For this, we will use the web client of the bi system.
We will intergate this on the gtk and web client of Open erp. For the GTK one, it will open the browser to browse thecube.

23
CHAPTER
SEVEN
EXTRA LIBRARIES
Libraries we will use:
• Turbogears for the web client to browse cube
• Mathplotlib for rendering graphs
• PyParsing to parse MDX Expressions
• SQLAlchemy to construct SQL queries and RDBMS connections
• XMLRPC lib for communication with the cube server
• PÿUNO for the OOo integration
We will use an object relationnal mapping system on all objects: dimensions, ...

Open Object Business Intelligence, Release 1.0
24 Chapter 7. Extra libraries

25
CHAPTER
EIGHT
INTRODUCTION TO THE OPENOBJECTMODULE
The OLAP module is used in validating , running and formatting the output of MDXExamples
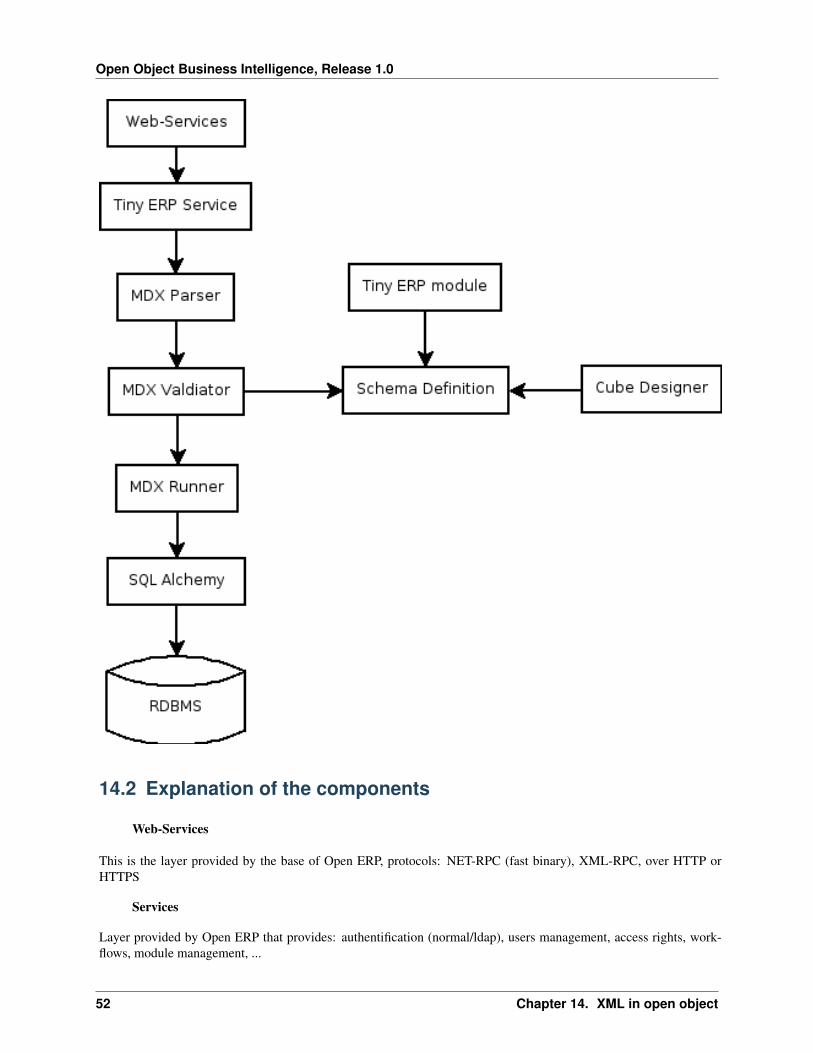
The general flow is of OLAP module is shown in following diagram:

Open Object Business Intelligence, Release 1.0
26 Chapter 8. Introduction to the OpenObject Module
8.1 Explanation of the components
8.1.1 Web-Services
This is the layer provided by the base of Open ERP, protocols: NET-RPC (fast binary), XML-RPC, over HTTP orHTTPS

Open Object Business Intelligence, Release 1.0
8.1. Explanation of the components 27
8.1.2 Services
Layer provided by Open ERP that provides: authentification (normal/ldap), users management, access rights, work-flows, module management, ...
8.1.3 MDX Parser
It parses the MDX query and convert it in the form of python objects. It uses pyparsing module of python to do this .It split the query in form of objects of axis, level, sub level, slicer (if any) and measures.
8.1.4 MDX Validator
It parse all the objects created and map it to the browse object ofOpen ERP resource. For example, the axis object willreceive a link to the Open ERP browse record on the related olap.axis object.
8.1.5 MDX Runner
It will run the query on the basis of objects using SQLAlchemy and return different subsets. On the basis of it the cubeis virtually made in the form of matrix. And it fills the cube by values using axis mapping
8.1.6 RDBMS connectors
The layer provided by SQL Alchemy, it supports: mysql, postgresql, oracle, ...
The schema definition is in the Open ERP database.

Open Object Business Intelligence, Release 1.0
28 Chapter 8. Introduction to the OpenObject Module

29
Part III
Part 3 : MDXAlchemy


31
CHAPTER
NINE
MDXOVERVIEW
MDX stands for Multidimensional Expressions. You use it to query OLAP databases. In a nutshell, MDX is to OLAPdatabases as SQL queries are to relational databases.
OLAP databases primarily consist of OLAP cubes, which store fact tables, measures (such as sales, purchase, etc.)and dimensions/hierarchies. An OLAP database is often an aggregation of a relational database; as a result, you canwrite MDX queries to retrieve key calculations that measure company performance, often with less code than standardSQL.
Because of the nature of OLAP databases, we need to write MDX code to retrieve data in far fewer lines of codethan would be required using SQL. This is a segue into the role that OLAP databases and MDX play in the world ofbusiness intelligence.
MDXAlchemy is developed taking care of all the aspects of becoming a complete OLAP Engine, to execute MDXquery and fetch data efficiently. MDXAlchemy is a complete MDX engine that provides your database with full MDXcapabilities.
MDXAlchemy use the services of SQLAlchemy to provide few of important feature that makes MDXAlchemy a fullcapable MDX Engine. The major is removing the clause of database dependency.
The dimensional meta data facility addresses the issue that although this application store dimensional data in relationaltables (usually in the form of fact and dimension tables), the user doesnot have to worry for database not aware ofthe dimensionality, or OLAP semantics, of this data. It provides a comprehensive meta data facility to define thesesemantics and an XML capability to enable meta data interchange with other external OLAP products.
9.1 Independent yet Integrated to OpenERP
MDXAlchemy engine is totally independent of OpenERP. It does not rely on OpenERP modules for its functionality.Yet being so diversified from OpenERP, it is fully integrated to OpenERP.
MDXAlchemy can be installed/intergrated as an internal module of OpenERP and it makes itself ready to assistOpenERP.
It is made of two major components, a cube engine and SQL Alchemy. It uses SQL Alchemy for connecting to thedatabase and cube engine processes the data to form the cube for the user.
9.2 Supported Databases
OpenObject BI takes care of independent database functionality.
It supports connectivity with most of the leading Databases programs.
Open Object Business Intelligence, Release 1.0
32 Chapter 9. MDXOverview
Just a compatible Dialect and valid connection parameters is all that is needed to use a database.
The Dialect is used to describe how to talk to a specific kind of database. Dialects are included with SQLAlchemyfor SQLite, Postgres, MySQL, MS-SQL, Firebird, Informix, and Oracle; these can be described as Python modulespresent in the sqlalchemy.databases package. Each dialect requires the appropriate DBAPI drivers to be installedseparately.
Downloads for each DBAPI to connect to supported Databases are as follows:
• Postgres: psycopg2
• SQLite : pysqlite
• MySQL : MySQLDB
• Oracle : cx_Oracle
• MS-SQL : pyodbc (recommended) adodbapi pymssql
• Firebird: kinterbasdb
• Informix: informixdb

33
CHAPTER
TEN
A LOOK AT FEW EXAMPLES TO WRITEMDX QUERIES
Writing a simple MDX on a SALES Schema:
select{[partner_country].[all]} on rows,{[measures].[Items Sold]} on columns
from sale_order_line
Gives results as,
/ Items SoldAll partner_country [43.0]
Expanding the partner country to its children, we change the MDX as.:
select{[partner_country].[all],[partner_country].children} on rows,{[measures].[Items Sold]} on columns
from sale_order_line
Gives result as,
/ Items SoldAll partner_country [43.0]Belgium [30.0]China [4.0]France [9.0]
One more example bit complex with slicer:
select{[date_order].children,[date_order].[2008].children,[date_order].[2008].[Q2].children},{[measures].[Items Sold]}
from sale_order_linewhere ([date_order].[2008])
Gives results as:
/ Items Sold2008.0 [43.0]Q1 [43.0]

Open Object Business Intelligence, Release 1.0
34 Chapter 10. A look at few examples to write MDX Queries

35
Part IV
Part 4 : Installing


37
CHAPTER
ELEVEN
INSTALLATION OF BI
To make BI working on any system. We need a OpenERP Server and preferably OpenERP GTK client if neededrunning on the system.
1. Installing Open ERP Server and OLAP module (in Open Object Business Intelligence)
2. Installing Web Interface (in Open Object Business Intelligence)

Open Object Business Intelligence, Release 1.0
38 Chapter 11. Installation of BI
39
Part V
Part 5 : Configuration


41
CHAPTER
TWELVE
CONFIGURATION INTERFACE
The main goal of any user connecting to OpenObject BI is to fetch the data from database using the powerful MDXqueries.
To run any MDX Query there is a need to make a cube and the user can define / configure its own custom cube usingtwo interface :
12.1 Introduction
Designer by default displays all schema in the tree form and provide options for adding the new.:
Creating the Schema : Schema defines the database from where the data is to be fetched. It gives a meaning ful nameto the database connection.:

Open Object Business Intelligence, Release 1.0
42 Chapter 12. Configuration Interface
Database Connection specified the paramaters for connecting to the database. It generally includes type of the database(postgres,oracle,mysql), username, password , database to use.:
Once we configure the database connection the next step is to load the database using introspection. This will loadthe structure of the database. by structure we mean tables, columns and the relations. This will help in defining cubeeasily. As the structure is loaded their will be no query to the database again and again:

Open Object Business Intelligence, Release 1.0
12.1. Introduction 43
The next step is to configure the database loaded. This is useful to hide unnecessary table and columns. If database isof openerp it can be auto configured:
Once the cube schema is created we can go for creating the cube:

Open Object Business Intelligence, Release 1.0
44 Chapter 12. Configuration Interface
Cube is the structure that is based on the schema (database), It will configure the way to retrieve the data:
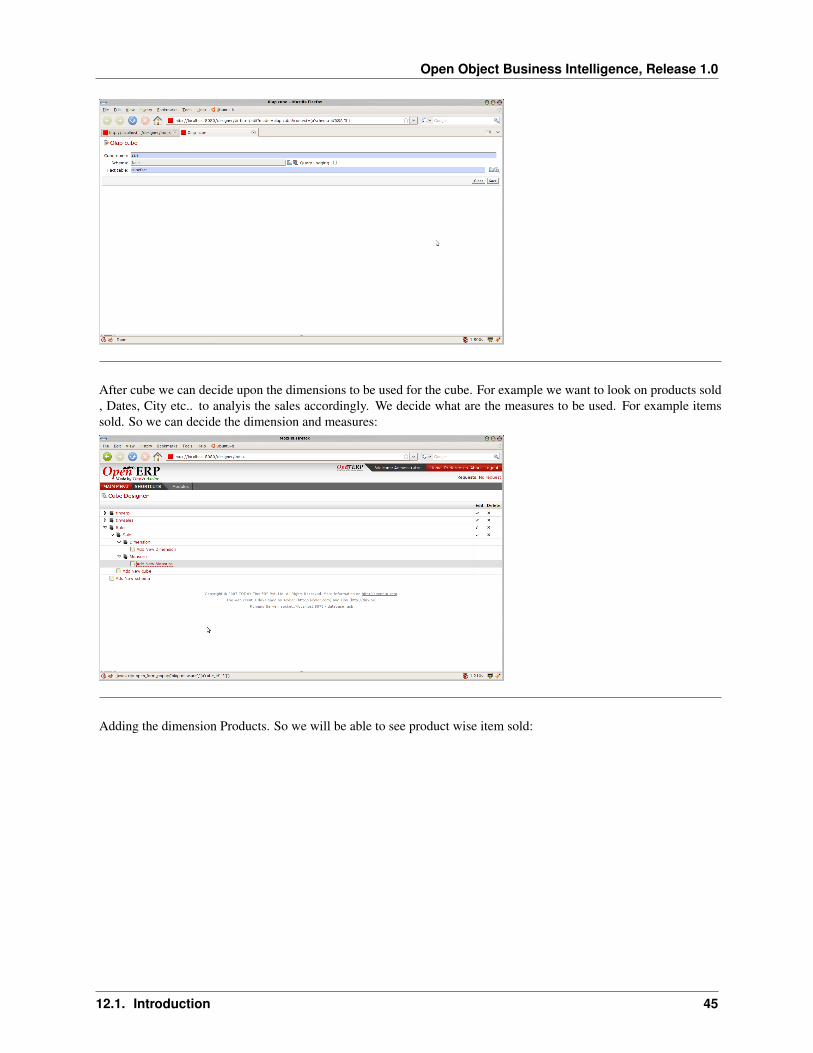
Cube requires the fact table to be define. Fact table are the key tables in which measures are stored and we can branchto other tables for other parameters. For example for sales we can define sale_order as our fact table as it will givesthe details of the sales. Fact table can be join of tables. The fact table is given meaningful name:
And the cube screen will be
Open Object Business Intelligence, Release 1.0
12.1. Introduction 45
After cube we can decide upon the dimensions to be used for the cube. For example we want to look on products sold, Dates, City etc.. to analyis the sales accordingly. We decide what are the measures to be used. For example itemssold. So we can decide the dimension and measures:
Adding the dimension Products. So we will be able to see product wise item sold:

Open Object Business Intelligence, Release 1.0
46 Chapter 12. Configuration Interface
After dimension we explain how to get the prodcuts details in the hierarchy. It requires to configure the fact table:
After adding the hierarchy we decide from which field the product name will come:
Open Object Business Intelligence, Release 1.0
12.2. Connecting to an Existing Database 47
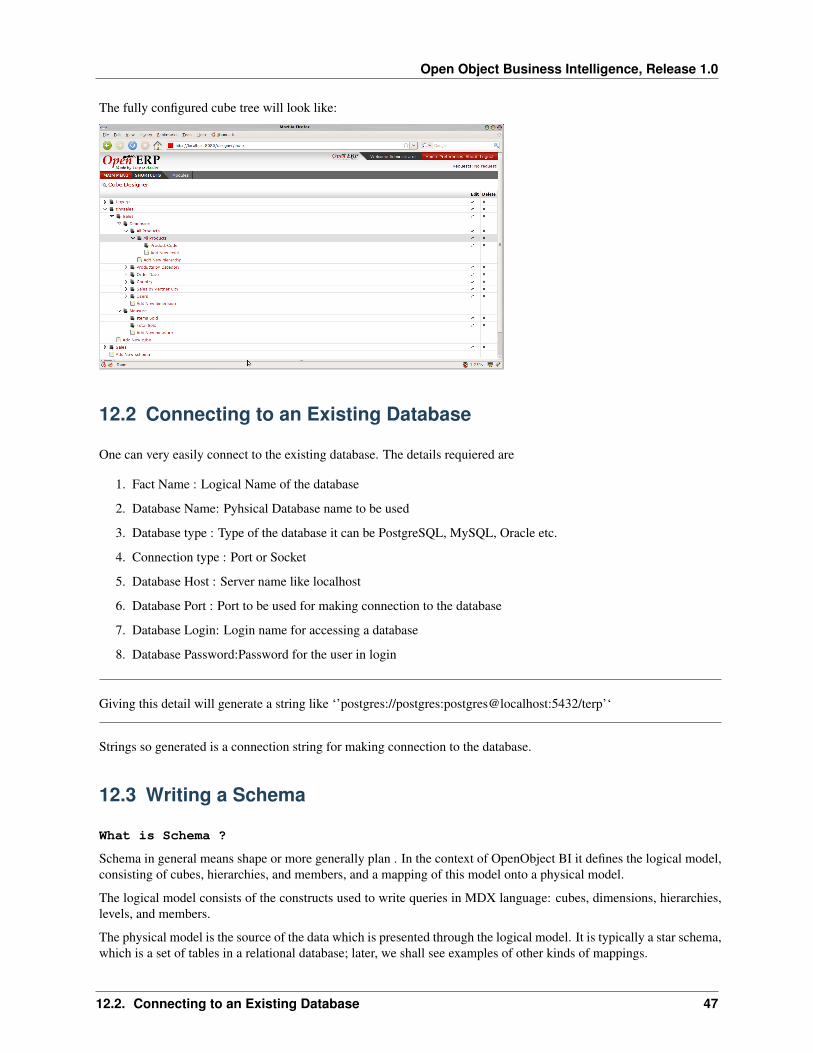
The fully configured cube tree will look like:
12.2 Connecting to an Existing Database
One can very easily connect to the existing database. The details requiered are
1. Fact Name : Logical Name of the database
2. Database Name: Pyhsical Database name to be used
3. Database type : Type of the database it can be PostgreSQL, MySQL, Oracle etc.
4. Connection type : Port or Socket
5. Database Host : Server name like localhost
6. Database Port : Port to be used for making connection to the database
7. Database Login: Login name for accessing a database
8. Database Password:Password for the user in login
Giving this detail will generate a string like ‘’postgres://postgres:postgres@localhost:5432/terp’‘
Strings so generated is a connection string for making connection to the database.
12.3 Writing a Schema
What is Schema ?
Schema in general means shape or more generally plan . In the context of OpenObject BI it defines the logical model,consisting of cubes, hierarchies, and members, and a mapping of this model onto a physical model.
The logical model consists of the constructs used to write queries in MDX language: cubes, dimensions, hierarchies,levels, and members.
The physical model is the source of the data which is presented through the logical model. It is typically a star schema,which is a set of tables in a relational database; later, we shall see examples of other kinds of mappings.
Open Object Business Intelligence, Release 1.0
48 Chapter 12. Configuration Interface
12.3.1 Making Schema
In OpenObject BI schemas are represented in a XML file. It can be designed in the way Open ERP does. The detailsof XML file can be seen at Creating XML
49
CHAPTER
THIRTEEN
DEFINING SCHEMA IN XML
Why XML for Schema?
• XML is a meta language used to describe the structure and content of documents.
• XML, although originally a document markup language, is increasingly used for data exchange on the Web.
• The application of XML as a standard exchange format for data available on the Web makes it attractive to usein conjunction with OLAP tools.
• An XML document has both structure and content, and XML provides a means for separating one from theother in the electronic document.
• The structure of a document is given by use of matching tag pairs (termed an element) and the informationbetween matching tags is referred to as the content of the element. Furthermore, an element is permitted to haveadditional attributes, where values are assigned to the attributes in the start tag of the element.
• XML documents can also contain a description of their logical structure, which is called a document typedefinition (DTD). A DTD is a context free grammar defining, in terms of element content specifications, allallowable elements,their attributes, and the elements nesting structure. Given a DTD it can be verified that anXML document conforms to the DTD, and if so, the XML document is said to be valid.
So all these features make XML a attracted language to make use of it in making a schema.

Open Object Business Intelligence, Release 1.0
50 Chapter 13. Defining Schema in XML
51
CHAPTER
FOURTEEN
XML IN OPEN OBJECT
14.1 Introduction to the OpenObject Module
The OLAP module is used in validating , running and formatting the output of MDXExamples/MDX Queries
The general flow is of OLAP module is shown in following diagram:
Open Object Business Intelligence, Release 1.0
52 Chapter 14. XML in open object
14.2 Explanation of the components
Web-Services
This is the layer provided by the base of Open ERP, protocols: NET-RPC (fast binary), XML-RPC, over HTTP orHTTPS
Services
Layer provided by Open ERP that provides: authentification (normal/ldap), users management, access rights, work-flows, module management, ...

Open Object Business Intelligence, Release 1.0
14.2. Explanation of the components 53
MDX Parser
It parses the MDX query and convert it in the form of python objects. It uses pyparsing module of python to do this .It split the query in form of objects of axis, level, sub level, slicer (if any) and measures.
MDX Validator
It parse all the objects created and map it to the browse object ofOpen ERP resource. For example, the axis object willreceive a link to the Open ERP browse record on the related olap.axis object.
MDX Runner
It will run the query on the basis of objects using SQLAlchemy and return different subsets. On the basis of it the cubeis virtually made in the form of matrix. And it fills the cube by values using axis mapping
RDBMS connectors
The layer provided by SQL Alchemy, it supports: mysql, postgresql, oracle, ...
The schema definition is in the Open ERP database.

Open Object Business Intelligence, Release 1.0
54 Chapter 14. XML in open object

55
CHAPTER
FIFTEEN
CREATING CUBE DEFINITION USINGXML FILE
Things to know
Before going through XML details its good to have an idea of all Terminolgies of OLAP.
Lets understand XML file in details
Step: 1. The first step is to specify the database it will use with parameter like name, database name , databaselogin and database password
<record model="olap.fact.database" id="fact_databases_BI"><field name="name">Tiny ERP databases</field><field name="db_name">Sales</field><field name="db_login">postgres</field><field name="db_password">postgres</field>
</record>
• This will create the connection parameters needed for connecting to the database.
Step: 2. Defining Schema
<record model="olap.schema" id="schema_main_sales"><field name="name">tinysales</field><field name="state">none</field><field name="database_id" ref="fact_databases_BI"/>
</record>
• This will create schema name tinysales for fact_database_BI made in step 1
Step: 3. Defining fact table to be used (In this case, sale_order_line)
<record model="olap.cube.table" id="table_sales_order_line"><field name="name">sale_order_line</field>
<field name=’schema_id’ ref=’schema_main_sales’/></record>
Step: 4. Making Cube on fact_table
Open Object Business Intelligence, Release 1.0
56 Chapter 15. Creating Cube Definition using XML file
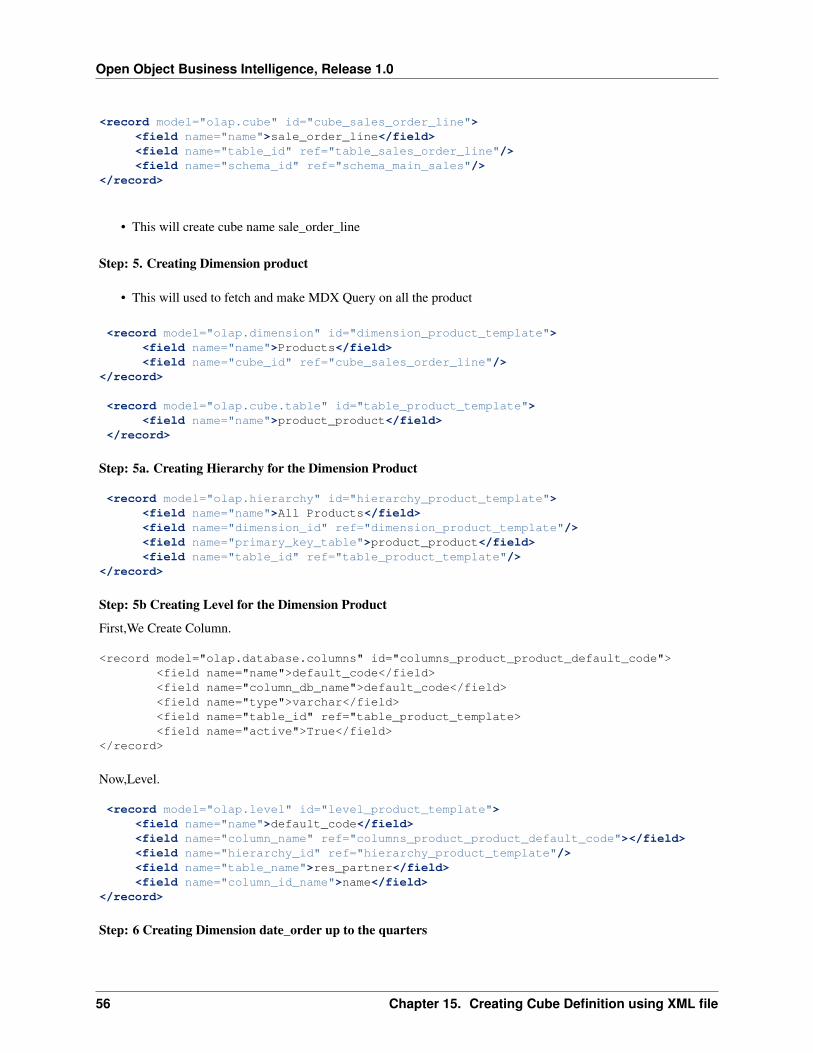
<record model="olap.cube" id="cube_sales_order_line"><field name="name">sale_order_line</field><field name="table_id" ref="table_sales_order_line"/><field name="schema_id" ref="schema_main_sales"/>
</record>
• This will create cube name sale_order_line
Step: 5. Creating Dimension product
• This will used to fetch and make MDX Query on all the product
<record model="olap.dimension" id="dimension_product_template"><field name="name">Products</field><field name="cube_id" ref="cube_sales_order_line"/>
</record>
<record model="olap.cube.table" id="table_product_template"><field name="name">product_product</field>
</record>
Step: 5a. Creating Hierarchy for the Dimension Product
<record model="olap.hierarchy" id="hierarchy_product_template"><field name="name">All Products</field><field name="dimension_id" ref="dimension_product_template"/><field name="primary_key_table">product_product</field><field name="table_id" ref="table_product_template"/>
</record>
Step: 5b Creating Level for the Dimension Product
First,We Create Column.
<record model="olap.database.columns" id="columns_product_product_default_code"><field name="name">default_code</field><field name="column_db_name">default_code</field><field name="type">varchar</field><field name="table_id" ref="table_product_template><field name="active">True</field>
</record>
Now,Level.
<record model="olap.level" id="level_product_template"><field name="name">default_code</field><field name="column_name" ref="columns_product_product_default_code"></field><field name="hierarchy_id" ref="hierarchy_product_template"/><field name="table_name">res_partner</field><field name="column_id_name">name</field>
</record>
Step: 6 Creating Dimension date_order up to the quarters
Open Object Business Intelligence, Release 1.0
57
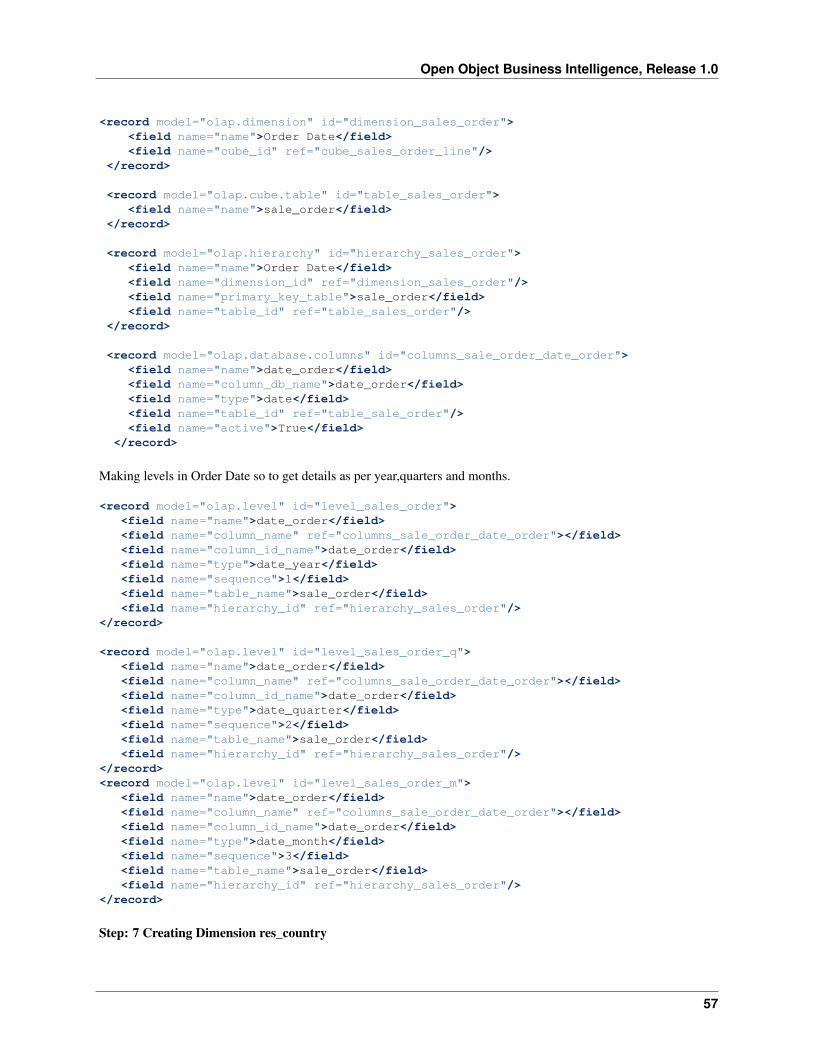
<record model="olap.dimension" id="dimension_sales_order"><field name="name">Order Date</field><field name="cube_id" ref="cube_sales_order_line"/>
</record>
<record model="olap.cube.table" id="table_sales_order"><field name="name">sale_order</field>
</record>
<record model="olap.hierarchy" id="hierarchy_sales_order"><field name="name">Order Date</field><field name="dimension_id" ref="dimension_sales_order"/><field name="primary_key_table">sale_order</field><field name="table_id" ref="table_sales_order"/>
</record>
<record model="olap.database.columns" id="columns_sale_order_date_order"><field name="name">date_order</field><field name="column_db_name">date_order</field><field name="type">date</field><field name="table_id" ref="table_sale_order"/><field name="active">True</field>
</record>
Making levels in Order Date so to get details as per year,quarters and months.
<record model="olap.level" id="level_sales_order"><field name="name">date_order</field><field name="column_name" ref="columns_sale_order_date_order"></field><field name="column_id_name">date_order</field><field name="type">date_year</field><field name="sequence">1</field><field name="table_name">sale_order</field><field name="hierarchy_id" ref="hierarchy_sales_order"/>
</record>
<record model="olap.level" id="level_sales_order_q"><field name="name">date_order</field><field name="column_name" ref="columns_sale_order_date_order"></field><field name="column_id_name">date_order</field><field name="type">date_quarter</field><field name="sequence">2</field><field name="table_name">sale_order</field><field name="hierarchy_id" ref="hierarchy_sales_order"/>
</record><record model="olap.level" id="level_sales_order_m">
<field name="name">date_order</field><field name="column_name" ref="columns_sale_order_date_order"></field><field name="column_id_name">date_order</field><field name="type">date_month</field><field name="sequence">3</field><field name="table_name">sale_order</field><field name="hierarchy_id" ref="hierarchy_sales_order"/>
</record>
Step: 7 Creating Dimension res_country

Open Object Business Intelligence, Release 1.0
58 Chapter 15. Creating Cube Definition using XML file
<record model="olap.cube.table" id="table_sale_order"><field name="name">sale_order</field>
<field name=’schema_id’ ref=’schema_main_sales’/></record>
<record model="olap.cube.table" id="table_partner_address_0"><field name="name">res_partner_address</field><field name=’schema_id’ ref=’schema_main_sales’/>
</record><record model="olap.cube.table" id="table_partner_address_1">
<field name="name">res_country</field><field name=’schema_id’ ref=’schema_main_sales’/>
</record>
<record model="olap.cube.table" id="table_partner_address"><field name="name">res_partner_address</field><field name=’schema_id’ ref=’schema_main_sales’/>
</record>
<record model="olap.cube.table" id="table_partner_country"><field name="name">sale_order_country</field><field name=’schema_id’ ref=’schema_main_sales’/>
</record>
<record model="olap.dimension" id="dimension_partner_country"><field name="name">Sales From Partners</field><field name="cube_id" ref="cube_sales_order_line"/>
</record>
<record model="olap.hierarchy" id="hierarchy_partner_country"><field name="name">partner_country</field><field name="dimension_id" ref="dimension_partner_country"/><field name="primary_key_table">sale_order</field><field name="table_id" ref="table_partner_country"/>
</record>
<record model="olap.level" id="level_partner_country"><field name="name">country_id</field><field name="column_name" ref="columns_sale_order_date_order"></field><field name="column_id_name">name</field><field name="table_name">res_country</field><field name="hierarchy_id" ref="hierarchy_partner_country"/>
</record>
Step: 8 Creating Dimension res_parnter_address
<record model="olap.database.columns" id="columns_res_partner_address"><field name="name">name</field><field name="column_db_name">name</field><field name="type">varchar</field><field name="table_id" ref="table_sales_order"/><field name="active">True</field>
</record><record model="olap.cube.table" id="table_address">
<field name="name">res_partner_address</field><field name=’schema_id’ ref=’schema_main_sales’/>
</record>
Open Object Business Intelligence, Release 1.0
59
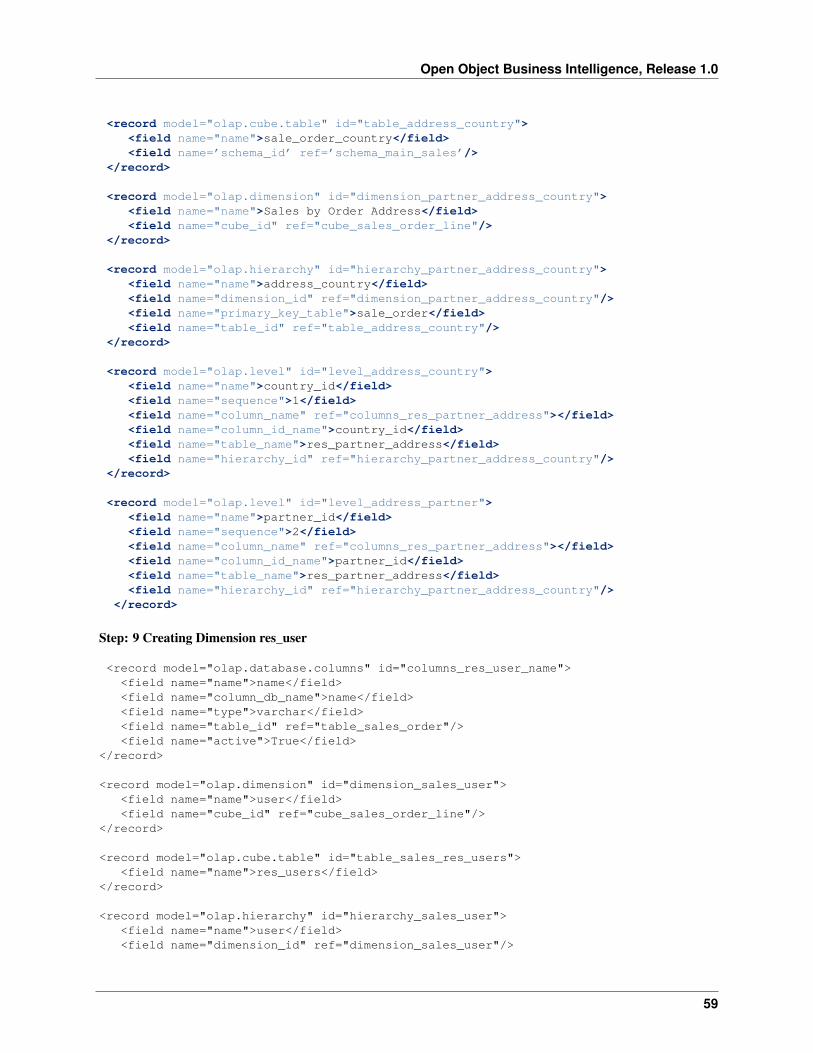
<record model="olap.cube.table" id="table_address_country"><field name="name">sale_order_country</field><field name=’schema_id’ ref=’schema_main_sales’/>
</record>
<record model="olap.dimension" id="dimension_partner_address_country"><field name="name">Sales by Order Address</field><field name="cube_id" ref="cube_sales_order_line"/>
</record>
<record model="olap.hierarchy" id="hierarchy_partner_address_country"><field name="name">address_country</field><field name="dimension_id" ref="dimension_partner_address_country"/><field name="primary_key_table">sale_order</field><field name="table_id" ref="table_address_country"/>
</record>
<record model="olap.level" id="level_address_country"><field name="name">country_id</field><field name="sequence">1</field><field name="column_name" ref="columns_res_partner_address"></field><field name="column_id_name">country_id</field><field name="table_name">res_partner_address</field><field name="hierarchy_id" ref="hierarchy_partner_address_country"/>
</record>
<record model="olap.level" id="level_address_partner"><field name="name">partner_id</field><field name="sequence">2</field><field name="column_name" ref="columns_res_partner_address"></field><field name="column_id_name">partner_id</field><field name="table_name">res_partner_address</field><field name="hierarchy_id" ref="hierarchy_partner_address_country"/>
</record>
Step: 9 Creating Dimension res_user
<record model="olap.database.columns" id="columns_res_user_name"><field name="name">name</field><field name="column_db_name">name</field><field name="type">varchar</field><field name="table_id" ref="table_sales_order"/><field name="active">True</field>
</record>
<record model="olap.dimension" id="dimension_sales_user"><field name="name">user</field><field name="cube_id" ref="cube_sales_order_line"/>
</record>
<record model="olap.cube.table" id="table_sales_res_users"><field name="name">res_users</field>
</record>
<record model="olap.hierarchy" id="hierarchy_sales_user"><field name="name">user</field><field name="dimension_id" ref="dimension_sales_user"/>
Open Object Business Intelligence, Release 1.0
60 Chapter 15. Creating Cube Definition using XML file
<field name="primary_key_table">res_users</field><field name="table_id" ref="table_sales_res_users"/>
</record>
<record model="olap.level" id="hierarchy_sales_user_level"><field name="name">name</field><field name="column_name" ref="columns_res_user_name""></field><field name="hierarchy_id" ref="hierarchy_sales_user"/>
</record>
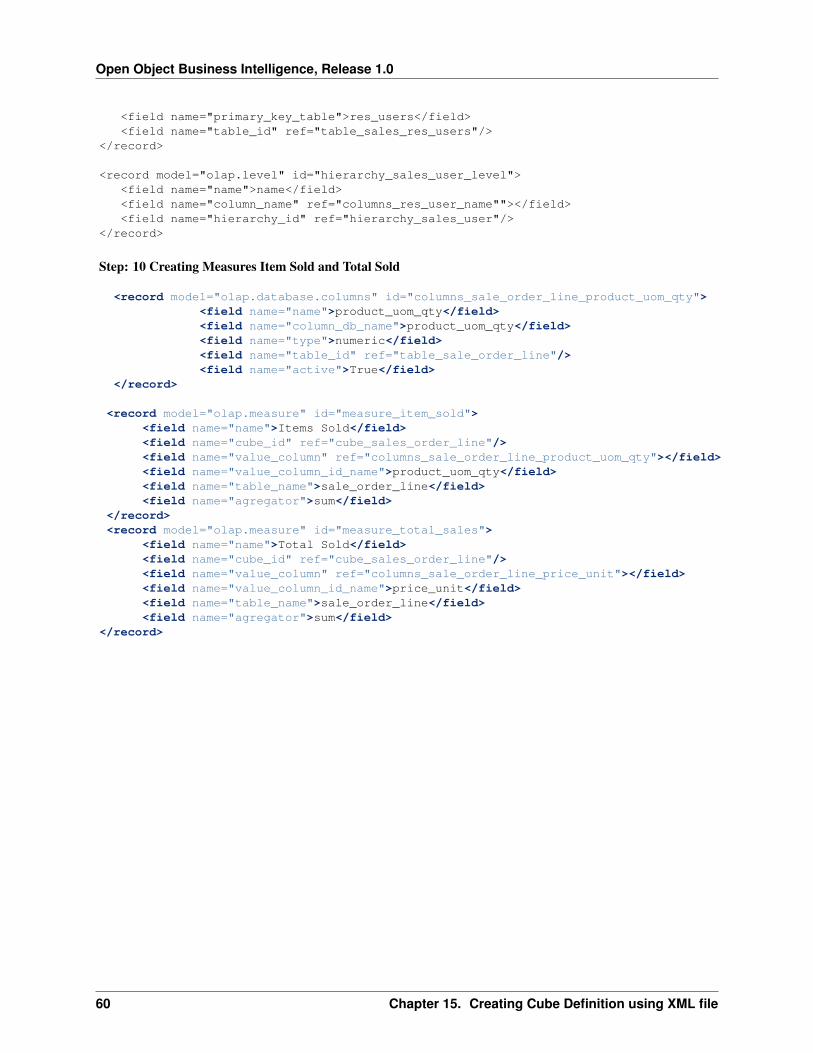
Step: 10 Creating Measures Item Sold and Total Sold
<record model="olap.database.columns" id="columns_sale_order_line_product_uom_qty"><field name="name">product_uom_qty</field><field name="column_db_name">product_uom_qty</field><field name="type">numeric</field><field name="table_id" ref="table_sale_order_line"/><field name="active">True</field>
</record>
<record model="olap.measure" id="measure_item_sold"><field name="name">Items Sold</field><field name="cube_id" ref="cube_sales_order_line"/><field name="value_column" ref="columns_sale_order_line_product_uom_qty"></field><field name="value_column_id_name">product_uom_qty</field><field name="table_name">sale_order_line</field><field name="agregator">sum</field>
</record><record model="olap.measure" id="measure_total_sales">
<field name="name">Total Sold</field><field name="cube_id" ref="cube_sales_order_line"/><field name="value_column" ref="columns_sale_order_line_price_unit"></field><field name="value_column_id_name">price_unit</field><field name="table_name">sale_order_line</field><field name="agregator">sum</field>
</record>

61
Part VI
Part 6 : Using CommandLine Interface(CLI)

63
CHAPTER
SIXTEEN
COMMAND LINE INTERFACE
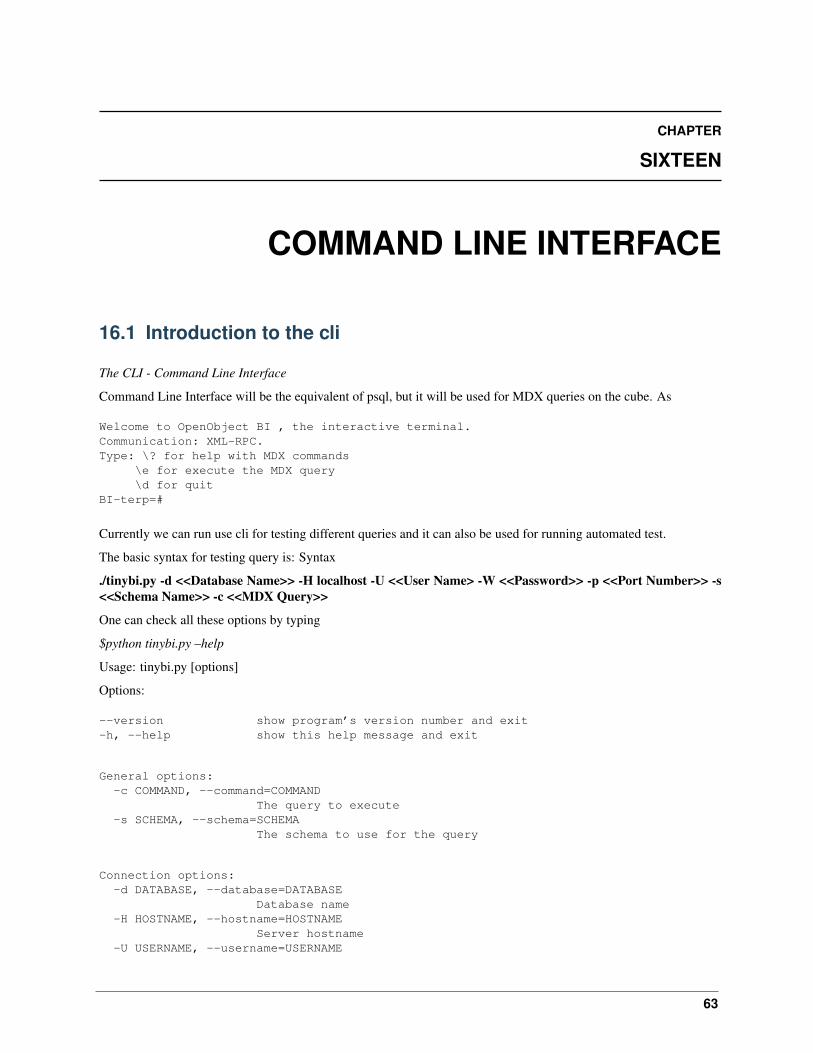
16.1 Introduction to the cli
The CLI - Command Line Interface
Command Line Interface will be the equivalent of psql, but it will be used for MDX queries on the cube. As
Welcome to OpenObject BI , the interactive terminal.Communication: XML-RPC.Type: \? for help with MDX commands
\e for execute the MDX query\d for quit
BI-terp=#
Currently we can run use cli for testing different queries and it can also be used for running automated test.
The basic syntax for testing query is: Syntax
./tinybi.py -d <<Database Name>> -H localhost -U <<User Name> -W <<Password>> -p <<Port Number>> -s<<Schema Name>> -c <<MDX Query>>
One can check all these options by typing
$python tinybi.py –help
Usage: tinybi.py [options]
Options:
--version show program’s version number and exit-h, --help show this help message and exit
General options:-c COMMAND, --command=COMMAND
The query to execute-s SCHEMA, --schema=SCHEMA
The schema to use for the query
Connection options:-d DATABASE, --database=DATABASE
Database name-H HOSTNAME, --hostname=HOSTNAME
Server hostname-U USERNAME, --username=USERNAME

Open Object Business Intelligence, Release 1.0
64 Chapter 16. Command Line Interface
Username-W PASSWORD, --password=PASSWORD
Password-p PORT, --port=PORT
Server port
Example
./tinybi.py -d “terp” -H localhost -U admin -W admin -p 8069 -s “tinyerp” -c “select {[user].[all]} on rows, {[mea-sures].[credit_limit],[measures].[count]} on columns from res_partner”
This will give output on CLI as :
credit_limit countAll user [66700.0] [21.0]

65
CHAPTER
SEVENTEEN
RUNNING AUTOMATED TEST CASES
We can check all the queries on CLI by making a file with queries to be tested with the syntax given in CLI
For example we can create test_query file with the content like
DATABASE=’terp’
./tinybi.py -d ${DATABASE} -H localhost -U admin -W admin -p 8069 -s "tinyerp" -c "select <br />{[user].[all]} on rows, {[measures].[credit_limit],[measures].[count]} <br />on columns from res_partner"
./tinybi.py -d ${DATABASE} -H localhost -U admin -W admin -p 8069 -s "tinyerp" -c "select <br /> {[measures].[credit_limit],[measures].[count]} on rows, {[user].[all],[user].children} <br /> on columns from res_partner"
The file can be run on command prompt and it will give output for queries and error if its not able to run it on
The output of this file can be viewed CubeCliExample test_query

Open Object Business Intelligence, Release 1.0
66 Chapter 17. Running Automated Test Cases

67
CHAPTER
EIGHTEEN
REPORTS
The report generated for the test_query file is:
credit_limit countAll user [66700.0] [21.0]
All userRoot Administrator Demo User
credit_limit [66700.0] [2700.0] [49000.0]count [21.0] [2.0] [6.0]

Open Object Business Intelligence, Release 1.0
68 Chapter 18. Reports

69
CHAPTER
NINETEEN
WEBSERVICE INTERFACE
Another component of OpenObject - BI, enables application access to dimensional data using Web Services. Thisfacility will allow applications to issue XML-based queries across a Web-based connection using XML-RPC. Thissupport will be based more on XML query languages rather than on OLAP language.
By providing a flexible, platform-neutral way for rendering diverse data types, XML has become a standard for ex-changing information across heterogeneous applications. Web services, a set of XML based protocols for finding andcommunicating between loosely-coupled, internet callable application “services” have therefore become the preferredmechanism for integrating heterogeneous applications and enabling service architectures.
Emphasising on XML and Web services for data exchange and integration provides significant IT benefits includingflexibility, interoperability and reach.

Open Object Business Intelligence, Release 1.0
70 Chapter 19. WebService Interface
71
Part VII
Part 7 : Using Cube Browser


73
CHAPTER
TWENTY
CUBE BROWSER
Cube Browser of Open Object-BI Platforme, aims at allowing user to design his own Reports through a clean andeffective Web-based environment.
It provides user with a friendly layer to create MDX Query on his previously designed OLAP Cubes with just fewmouse operations, and retrieve the desired information in a comprehensible tabular layout. He can further re-formatthe layout, to drill to fetch further fine information and easily analyze it to understand business currents and causes.
And if they don’t require the full power of query capabilities, users can simply explore information in existing re-ports—formatting and interacting with data to meet his reporting needs.
20.1 Goal behind Cube Browser
Provide user with a thin client to make reporting far more efficient. Let user use full power of MDXAlchemy engine.Wrapping the process of designing queries into a lot easier steps like clicks, drags and drops. Keeping the interface assimple yet powerful reporting tool.

Open Object Business Intelligence, Release 1.0
74 Chapter 20. Cube Browser
75
CHAPTER
TWENTYONE
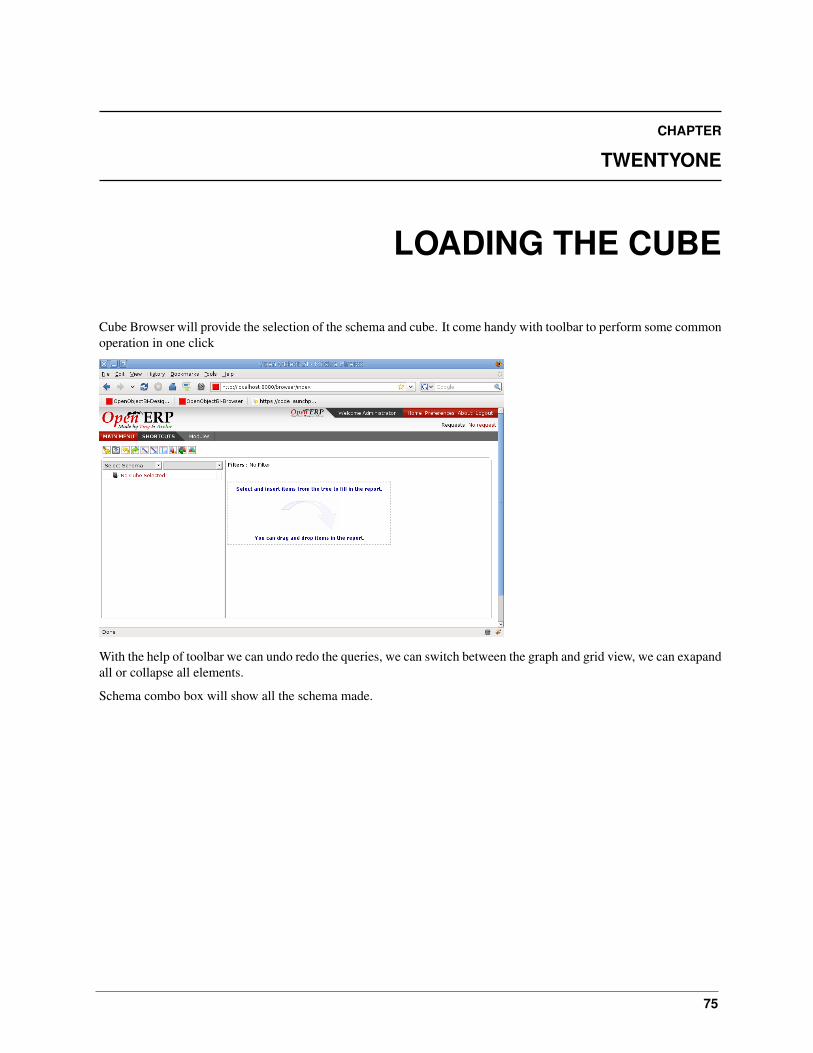
LOADING THE CUBE
Cube Browser will provide the selection of the schema and cube. It come handy with toolbar to perform some commonoperation in one click
With the help of toolbar we can undo redo the queries, we can switch between the graph and grid view, we can exapandall or collapse all elements.
Schema combo box will show all the schema made.

Open Object Business Intelligence, Release 1.0
76 Chapter 21. Loading the Cube
Once we select the schema next combo box will show all the cube that belong to selected schema.
Once we select the cube, the cube is loaded in the tree form in the space below. We can expand each node and it willdispplays to the depth of the level configured.

Open Object Business Intelligence, Release 1.0
77

Open Object Business Intelligence, Release 1.0
78 Chapter 21. Loading the Cube
79
CHAPTER
TWENTYTWO
CREATING YOUR REPORT WITH DRAGAND DROP
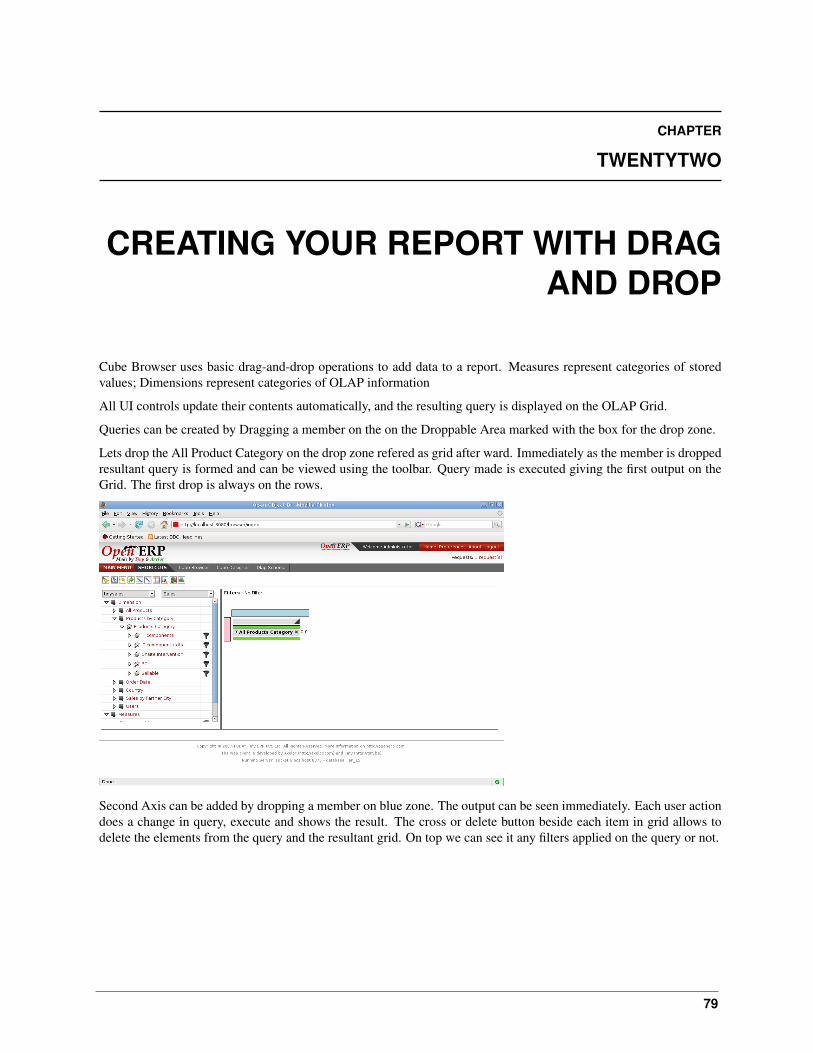
Cube Browser uses basic drag-and-drop operations to add data to a report. Measures represent categories of storedvalues; Dimensions represent categories of OLAP information
All UI controls update their contents automatically, and the resulting query is displayed on the OLAP Grid.
Queries can be created by Dragging a member on the on the Droppable Area marked with the box for the drop zone.
Lets drop the All Product Category on the drop zone refered as grid after ward. Immediately as the member is droppedresultant query is formed and can be viewed using the toolbar. Query made is executed giving the first output on theGrid. The first drop is always on the rows.
Second Axis can be added by dropping a member on blue zone. The output can be seen immediately. Each user actiondoes a change in query, execute and shows the result. The cross or delete button beside each item in grid allows todelete the elements from the query and the resultant grid. On top we can see it any filters applied on the query or not.

Open Object Business Intelligence, Release 1.0
80 Chapter 22. Creating your report with drag and drop
We can see the query by selecting on the MDX button on the toolbar. This will open the pop up to show the mdx queryfor the current grid.

81
CHAPTER
TWENTYTHREE
SWAPPING ROWS AND COLUMNS
Once the report is generated in the cube browser we can swap it so the rows moves in to the columns area and columnmoves in to the rows area. This will make swapping in query part too.
We can form query by drag and drop which will form the report.
Once the report is generated, we can swap which will form the report which is shown below

Open Object Business Intelligence, Release 1.0
82 Chapter 23. Swapping Rows and Columns
Now after swapping, we can move on with drag and drop to form queries and generate report.

83
CHAPTER
TWENTYFOUR
ADDING SLICER
A Slicer is filtering on the data fetched by a MDX Query.
It can be added by clicking on filter images on right side on the members.
Filtering gives user a powerful tool for slicing the multidimensional data for organizing and analyzing in more detail.
This filtering of the data allows user to get the required information to the lowest level and analysed the same so to getthe best use of his cube’s multidimensional data.

Open Object Business Intelligence, Release 1.0
84 Chapter 24. Adding Slicer
85
CHAPTER
TWENTYFIVE
DRILL UP/DOWN
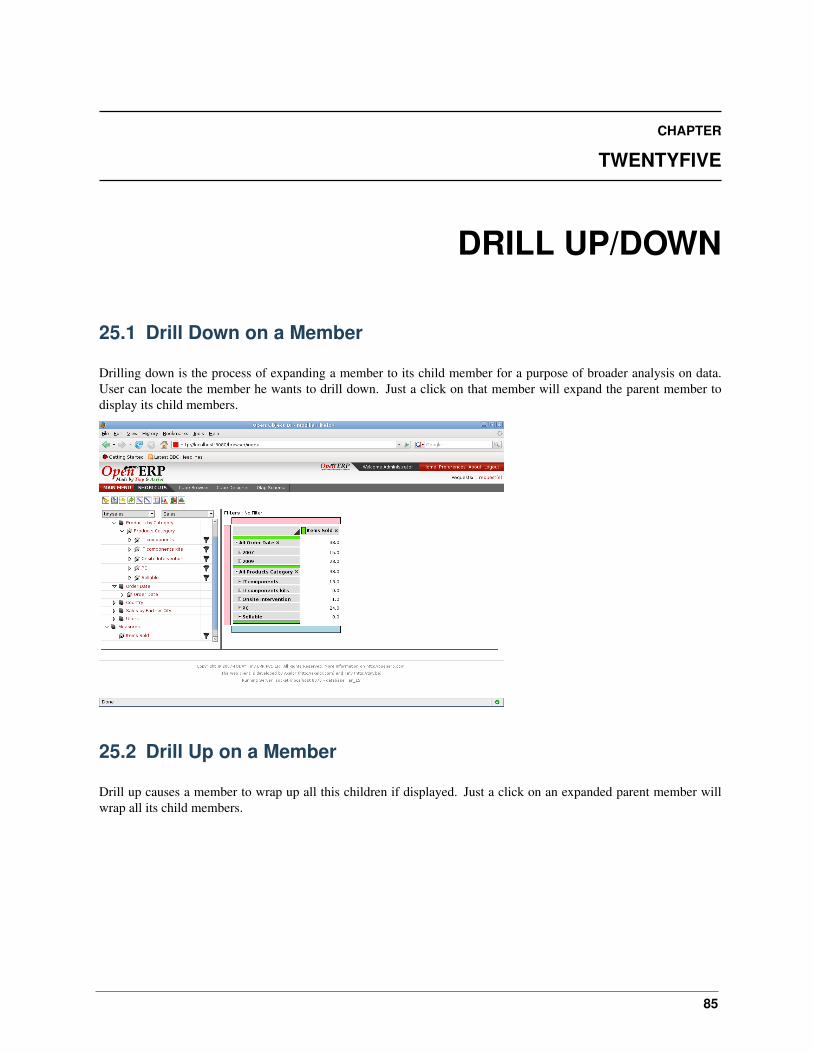
25.1 Drill Down on a Member
Drilling down is the process of expanding a member to its child member for a purpose of broader analysis on data.User can locate the member he wants to drill down. Just a click on that member will expand the parent member todisplay its child members.
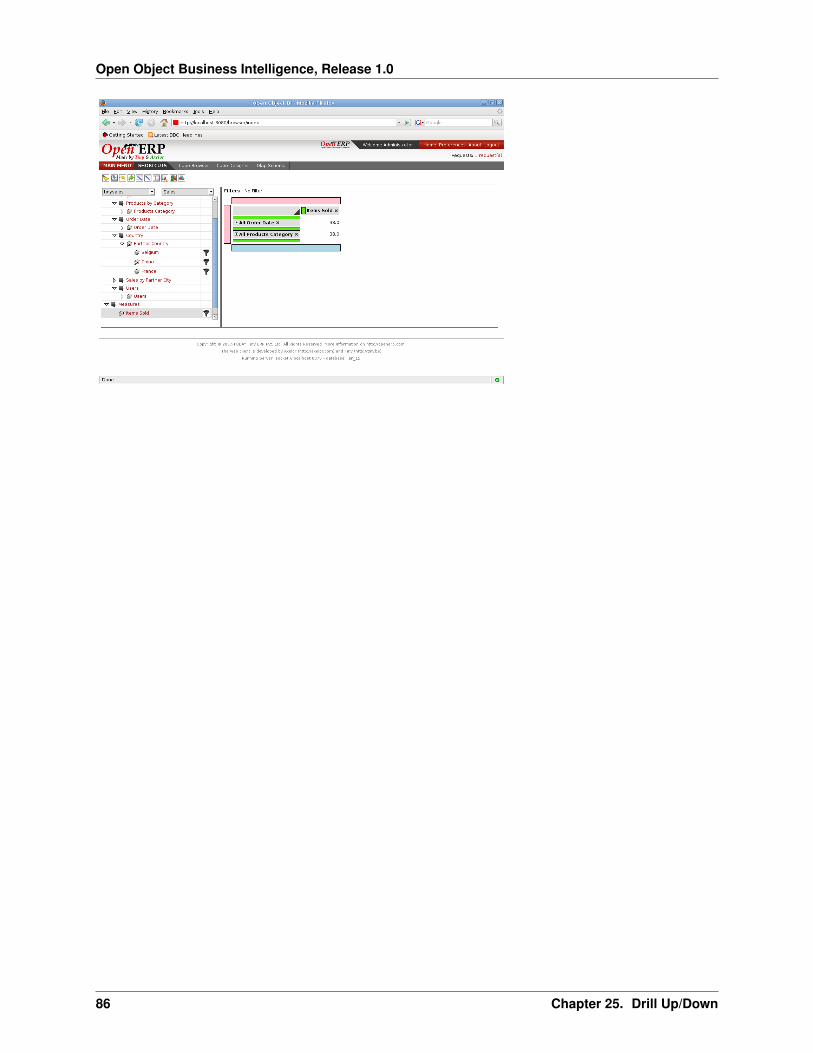
25.2 Drill Up on a Member
Drill up causes a member to wrap up all this children if displayed. Just a click on an expanded parent member willwrap all its child members.
Open Object Business Intelligence, Release 1.0
86 Chapter 25. Drill Up/Down
87
CHAPTER
TWENTYSIX
GRAPHS
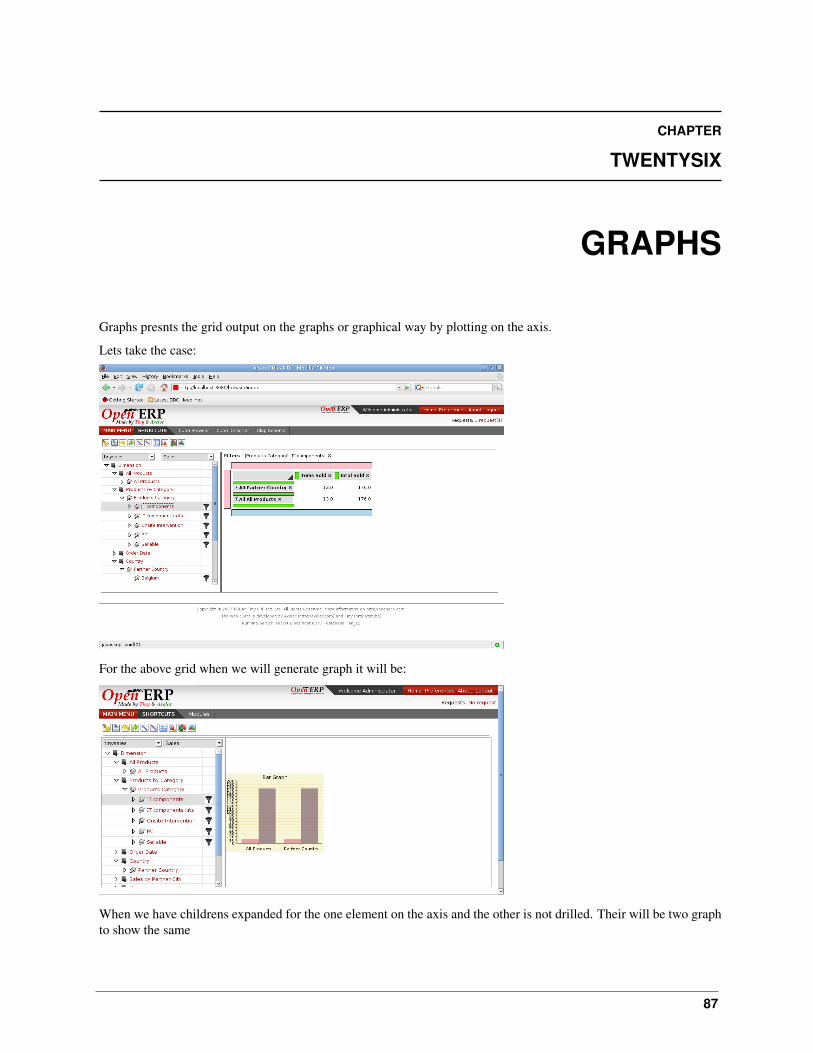
Graphs presnts the grid output on the graphs or graphical way by plotting on the axis.
Lets take the case:
For the above grid when we will generate graph it will be:
When we have childrens expanded for the one element on the axis and the other is not drilled. Their will be two graphto show the same

Open Object Business Intelligence, Release 1.0
88 Chapter 26. Graphs

89
Part VIII
Part 8 : Using Cube Designer


91
CHAPTER
TWENTYSEVEN
GOAL OF CUBE DESIGNER
The goal is to develop a User Friendly Cube Designer for Open Object - BI that allows a user to define and / or modifyan OLAP cube definition starting from any database. (Oracle, MySQL, PostgreSQL). This has to be user friendly sothat a end-user can define his own cube on his own database without any development knowledge.
27.1 Basic features
The cube designer of the OpenObject – BI Solutions helps the User to Create New cubes and Modify the existingcubes. First the User checks the connection with its database and if he is connected after that only the user can createcubes in two ways #Wizard Flow #Generic Flow.
27.1.1 Wizard Flow
In the wizard flow a wizard will guide the user through the entire process of cube creation. Navigation can be donethrough Next and Previous button.
Note: Clicking on the “Save” button on every form causes the data to be written in the database and simultaneouslythe “Next” button is activated and the user is navigated to the next form. Next button will not be activated until thedata is “Saved”.
27.1.2 Generic Flow
The cube can be modified / created by the user in a normal way.
Modify / Create A Schema
The user specifies the desired schema name. He selects the desired database or creates it with the help of [new]. Hespecifies the schema description. He saves it.
Modify / Create A Fact Table
User Makes a perticuler Type for Fact table He select desired database or Schema for perticular Fact Table and alsocreate by its own [new] button.
Modify / Create A Database
User specifies the “General Parameters” He specifies the “Connection Parameters” that specify which database is usedfor the connection with which port number. He tests the connection for error and the “Connection URL” is generated.On connection string being correct the new database is created.

Open Object Business Intelligence, Release 1.0
92 Chapter 27. Goal of Cube Designer
Modify / Create A Cube
The user provides desired cube name along with the fact tables and schema name. The user can select the alreadycreated fact tables via a drop down box or can create a new fact table by clicking on [new]. Same goes for schema too.The dimensions and measures at this point will be empty as they are not created as of now.
Modify / Create A Dimension
The user provides with the dimension name. The cube name that was provided by him will appear in the drop downbox. He can select a cube name from the list else he can create a new cube by clicking on [new]. Hierarchies areabsent.
Modify / Create A Hierarchies
The user provides the hierarchy name. The dimension name will come in the dropdown box. User can create a newdimension by clicking on [new]. User will provide with the hierarchy field name,sequence,hierarchy type,all memberand default member fields. User will give the fact table by selecting it from a drop down box or by creating a new facttable altogether by clicking on [new]
Modify / Create A Levels
The user has to specify the level name,column name,column id,level class,table name,sequence and hierarchy. Hierar-chy will appear in the drop down box. He can create a new hierarchy by clicking on [new].
Note: Clicking on the “Save” button on every form causes the data to be written in the database. Double Click onrow opens modification window of respective record.
Modify / Create A Measures
The user provides with the Measure name. The cube name that was provided by him will appear in the drop downbox. He can select a cube name from the list else he can create a new cube by clicking on the [new]. It defines the allcalculation / aggregation with fact column name. Here all calculation / aggregation are interdepended with the fieldsof fact column name, aggregator, data type and format of string.

93
CHAPTER
TWENTYEIGHT
DATABASE INTROSPECTION

Open Object Business Intelligence, Release 1.0
94 Chapter 28. Database Introspection
95
CHAPTER
TWENTYNINE
DEFINING CUBE
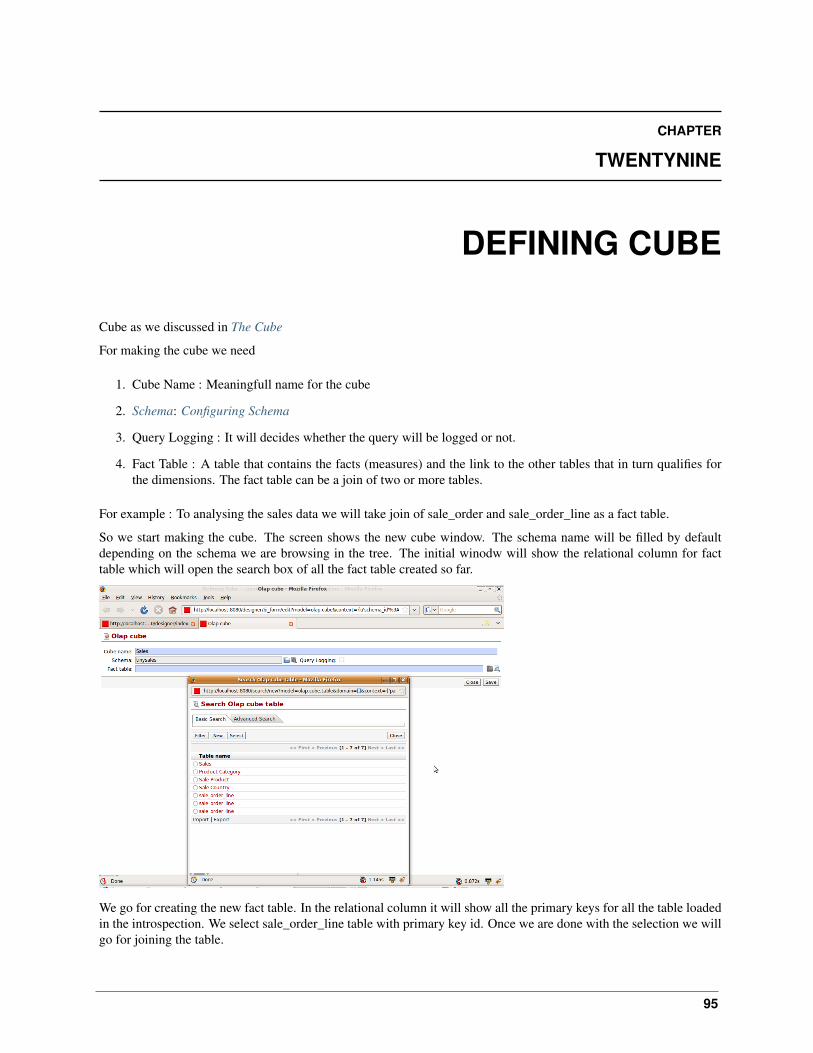
Cube as we discussed in The Cube
For making the cube we need
1. Cube Name : Meaningfull name for the cube
2. Schema: Configuring Schema
3. Query Logging : It will decides whether the query will be logged or not.
4. Fact Table : A table that contains the facts (measures) and the link to the other tables that in turn qualifies forthe dimensions. The fact table can be a join of two or more tables.
For example : To analysing the sales data we will take join of sale_order and sale_order_line as a fact table.
So we start making the cube. The screen shows the new cube window. The schema name will be filled by defaultdepending on the schema we are browsing in the tree. The initial winodw will show the relational column for facttable which will open the search box of all the fact table created so far.
We go for creating the new fact table. In the relational column it will show all the primary keys for all the table loadedin the introspection. We select sale_order_line table with primary key id. Once we are done with the selection we willgo for joining the table.

Open Object Business Intelligence, Release 1.0
96 Chapter 29. Defining Cube
Join Table will open all the tables that are referenced from the sale_order_line, according to the table name fromthe relational column. We select order_id as it is the field related to the sale_order. Hence, we made the join of thesale_order_line and sale_order
If we want more table to be joined we can do that by adding more on Join Tables. Now the search will be on all thereference from sale_order and sale_order_line

Open Object Business Intelligence, Release 1.0
97
Finally the cube page will look like

Open Object Business Intelligence, Release 1.0
98 Chapter 29. Defining Cube

99
CHAPTER
THIRTY
DEFINING DIMENSION
Dimension need to name to be identified. Cube will be filled by default according to the schema opened.

Open Object Business Intelligence, Release 1.0
100 Chapter 30. Defining Dimension
101
CHAPTER
THIRTYONE
DEFINING HIERARCHY
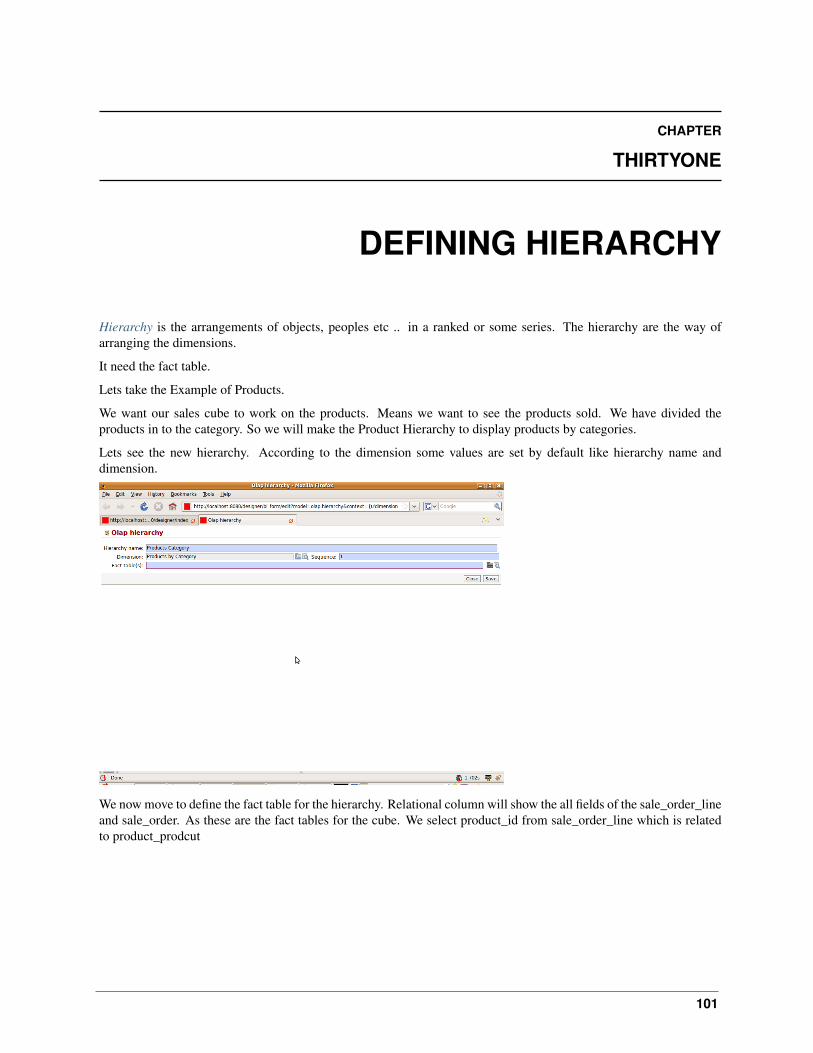
Hierarchy is the arrangements of objects, peoples etc .. in a ranked or some series. The hierarchy are the way ofarranging the dimensions.
It need the fact table.
Lets take the Example of Products.
We want our sales cube to work on the products. Means we want to see the products sold. We have divided theproducts in to the category. So we will make the Product Hierarchy to display products by categories.
Lets see the new hierarchy. According to the dimension some values are set by default like hierarchy name anddimension.
We now move to define the fact table for the hierarchy. Relational column will show the all fields of the sale_order_lineand sale_order. As these are the fact tables for the cube. We select product_id from sale_order_line which is relatedto product_prodcut
Open Object Business Intelligence, Release 1.0
102 Chapter 31. Defining Hierarchy
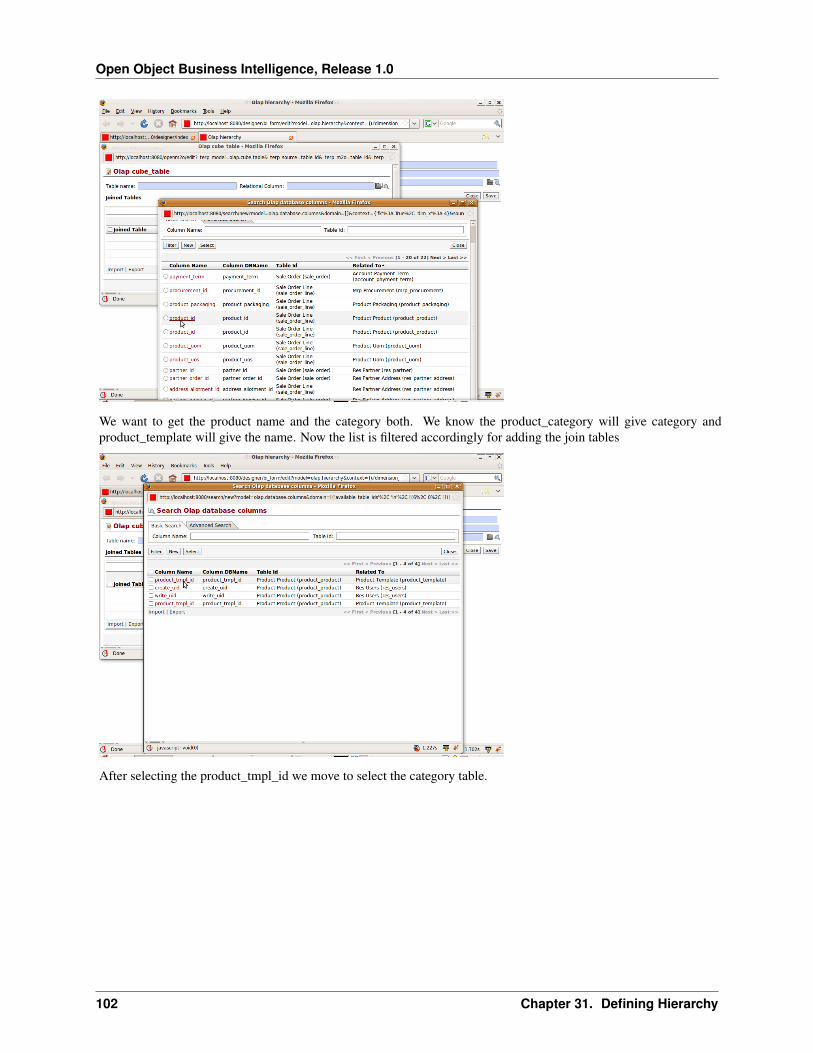
We want to get the product name and the category both. We know the product_category will give category andproduct_template will give the name. Now the list is filtered accordingly for adding the join tables
After selecting the product_tmpl_id we move to select the category table.
Open Object Business Intelligence, Release 1.0
103
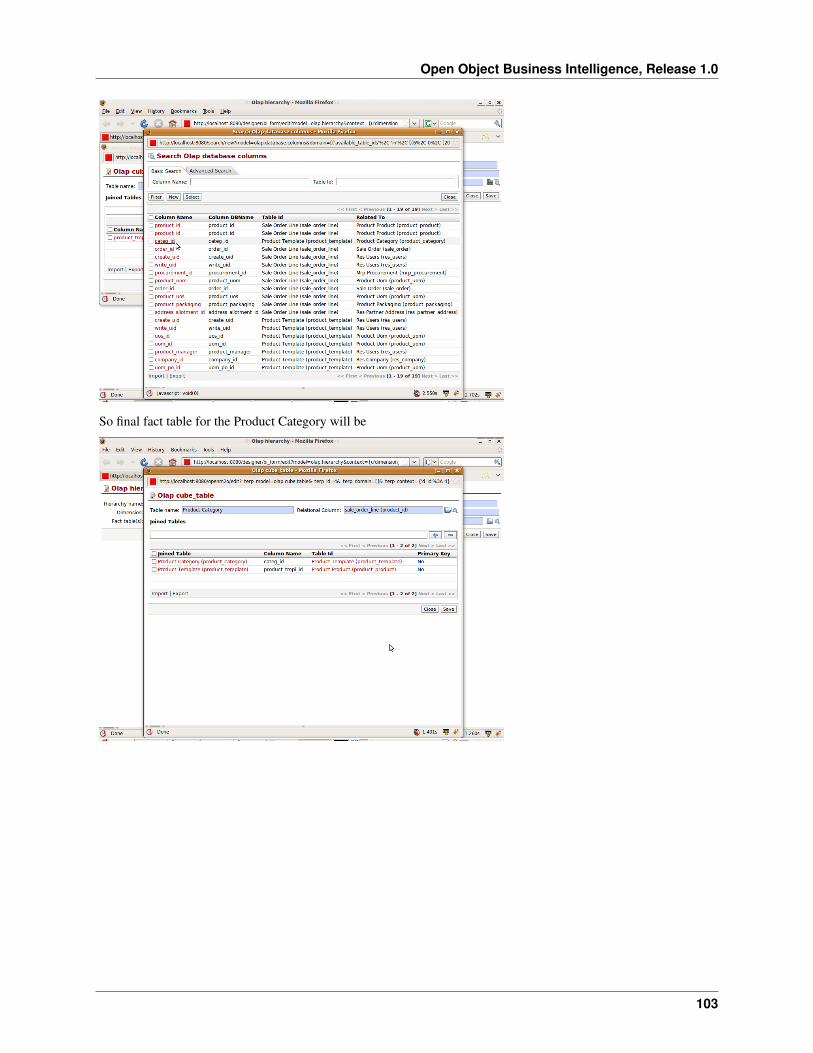
So final fact table for the Product Category will be

Open Object Business Intelligence, Release 1.0
104 Chapter 31. Defining Hierarchy
105
CHAPTER
THIRTYTWO
DEFINING LEVEL
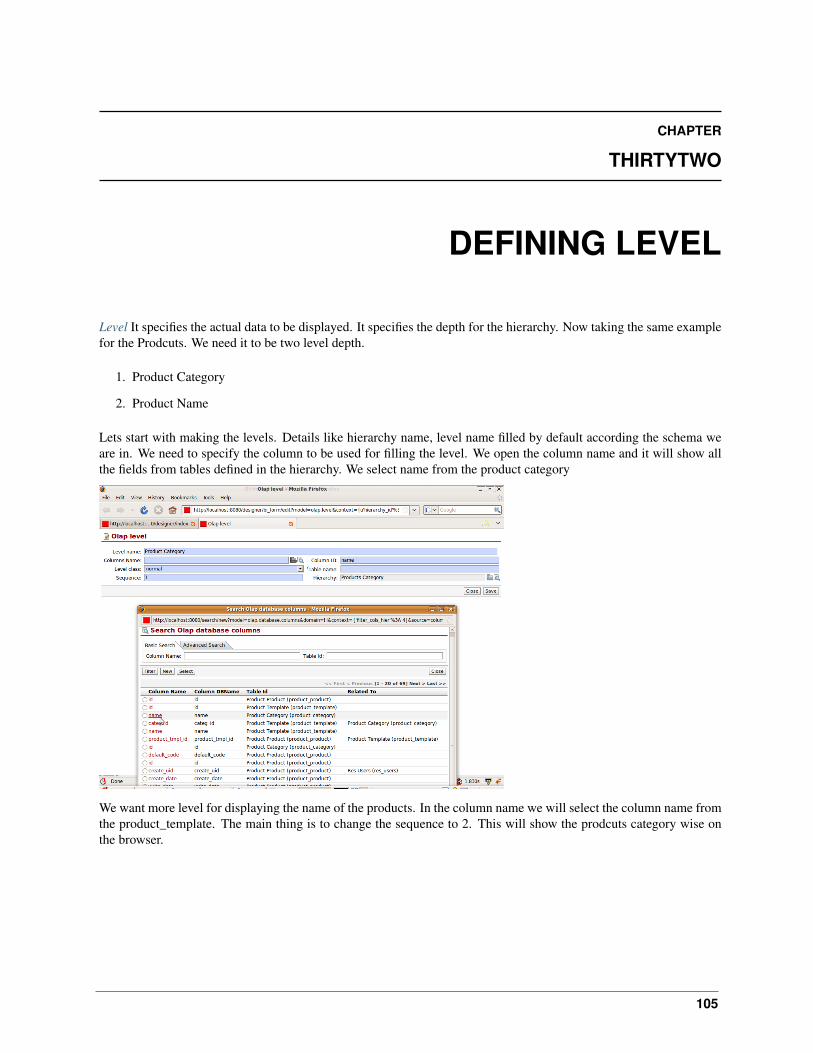
Level It specifies the actual data to be displayed. It specifies the depth for the hierarchy. Now taking the same examplefor the Prodcuts. We need it to be two level depth.
1. Product Category
2. Product Name
Lets start with making the levels. Details like hierarchy name, level name filled by default according the schema weare in. We need to specify the column to be used for filling the level. We open the column name and it will show allthe fields from tables defined in the hierarchy. We select name from the product category
We want more level for displaying the name of the products. In the column name we will select the column name fromthe product_template. The main thing is to change the sequence to 2. This will show the prodcuts category wise onthe browser.

Open Object Business Intelligence, Release 1.0
106 Chapter 32. Defining Level

107
CHAPTER
THIRTYTHREE
DEFINING MEASURE
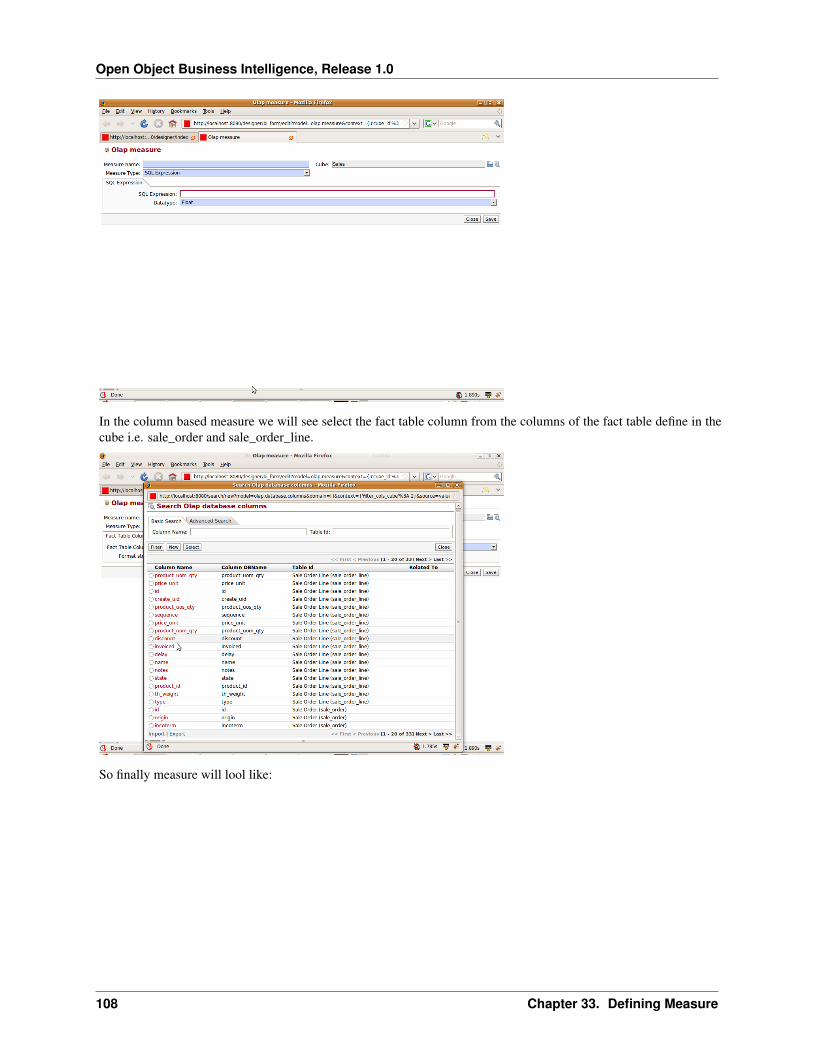
Measure are the fact or quantitative values. It comes from the fact table configured in the cube.
We will make the measure for the same example. Measure type specifies whether it will be column base or sqlexpression based.
Column Based:
SQL Expression Based:
Open Object Business Intelligence, Release 1.0
108 Chapter 33. Defining Measure
In the column based measure we will see select the fact table column from the columns of the fact table define in thecube i.e. sale_order and sale_order_line.
So finally measure will lool like:

Open Object Business Intelligence, Release 1.0
109


