Open Skies over the Middle East *Anca Cristea Russell Hillberry Aaditya Mattoo † Dept of Economics DECTI DECTI U of Oregon World Bank World Bank April 2015 Abstract The dynamism of air traffic markets in the Middle East obscures the persistence of restrictions on international competition. But how important are such restrictions for passenger traffic? This paper uses detailed data on worldwide passenger aviation to estimate the effect of air transport policy on international air traffic. The policy variable is a quantitative measure of the commitments under international agreements. The paper analyzes, for the first time, not only bilateral agreements, but also plurilateral agreements such as the one among Arab states. The analysis finds that more liberal policy is associated with greater passenger traffic between countries. Higher traffic levels appear to be driven by larger numbers of city pairs being served, as well as by more passengers traveling along given routes. To demonstrate the quantitative implication of the estimates, two liberalization scenarios in the Middle East are evaluated. Deepening the plurilateral agreement among Arab states would lead to a 30 percent increase in intraregional passenger traffic. Widening the agreement to include Turkey would generate significantly larger gains because current policy vis-à-vis Turkey is much more restrictive. Keywords: air transport; air service agreements; services liberalization; plurilateral agreements JEL: F13; L93; R48 Sector Board: Economic Policy (EPOL) * We thank Sibel Kulaksiz for encouraging to us undertake this work. We also thank Antonia Carzaniga for generously providing us with the policy data, and Guoliang Feng for excellent research assistance. Any remaining errors are our own. † Contact: Cristea: Department of Economics, University of Oregon, 1285 University of Oregon, Eugene, OR 97405; E-mail: [email protected]. Russell Hillberry: Development Research Group, World Bank, 1818 H Street NW, Washington DC, 20433, United States; E-mail: [email protected]. Aaditya Mattoo: Development Research Group, World Bank, 1818 H Street NW, Washington DC, 20433, United States; Email: [email protected].
Transcript
Open Skies over the Middle East *
Anca Cristea Russell Hillberry Aaditya Mattoo†
Dept of Economics DECTI DECTI
U of Oregon World Bank World Bank
April 2015
Abstract
The dynamism of air traffic markets in the Middle East obscures the persistence of restrictions on
international competition. But how important are such restrictions for passenger traffic? This paper uses
detailed data on worldwide passenger aviation to estimate the effect of air transport policy on
international air traffic. The policy variable is a quantitative measure of the commitments under
international agreements. The paper analyzes, for the first time, not only bilateral agreements, but also
plurilateral agreements such as the one among Arab states. The analysis finds that more liberal policy is
associated with greater passenger traffic between countries. Higher traffic levels appear to be driven by
larger numbers of city pairs being served, as well as by more passengers traveling along given routes. To
demonstrate the quantitative implication of the estimates, two liberalization scenarios in the Middle East
are evaluated. Deepening the plurilateral agreement among Arab states would lead to a 30 percent
increase in intraregional passenger traffic. Widening the agreement to include Turkey would generate
significantly larger gains because current policy vis-à-vis Turkey is much more restrictive.
Keywords: air transport; air service agreements; services liberalization; plurilateral agreements
JEL: F13; L93; R48
Sector Board: Economic Policy (EPOL)
* We thank Sibel Kulaksiz for encouraging to us undertake this work. We also thank Antonia Carzaniga for
generously providing us with the policy data, and Guoliang Feng for excellent research assistance. Any remaining
errors are our own.
† Contact: Cristea: Department of Economics, University of Oregon, 1285 University of Oregon, Eugene, OR
97405; E-mail: [email protected]. Russell Hillberry: Development Research Group, World Bank, 1818 H Street
NW, Washington DC, 20433, United States; E-mail: [email protected]. Aaditya Mattoo: Development
Research Group, World Bank, 1818 H Street NW, Washington DC, 20433, United States; Email:
Turkey, long a fulcrum between the West and the East, has deepened its economic links with the
European Union and is now turning to the Middle East. In this sometimes turbulent neighborhood, it is
beginning to create dynamic trade links which echo past relationships albeit in a new international
context. Even in the age of the internet, where geography seems passe, physical connectivity matters.
Goods must be delivered, businesspersons must meet, and people must travel to forge bonds and catalyze
trade. In facilitating each of these links, air transport is critical, especially in a region where terrestrial
travel is fraught with difficulty.2
Turkey’s Arab neighbors are already party to the Intra-Arab Freedom of the Air Programme of
the Arab Civil Aviation Commission (henceforth referred to as the “ACAC”). This Programme has in
principle created conditions for more liberalized air transport, but more could be done to create fully open
conditions (Schlumberger, 2010). By comparison, the bilateral air service agreements (BASAs) between
Turkey and its Arab neighbors are quite restrictive. Looking ahead, policy makers must make choices:
whether to deepen a plurilateral agreement like the ACAC, and whether to negotiate more liberal bilateral
agreements with partners such as Turkey. We attempt to inform such decisions with quantitative
estimates. In particular, we assess the benefits of a more meaningful open skies agreement in the Middle
East, which would both deepen the ACAC and include Turkey as a full-fledged member. Our focus is on
the Middle East but these issues have global relevance, as regions from ASEAN to Africa pursue
integration of their air transport markets.
We begin by estimating a gravity model of bilateral air traffic, which helps us relate passenger
flows to measures of openness in air services agreements, while controlling for other determinants of
international travel. In this respect, our study builds upon prior work. Our paper contributes to a small but
2 Emin Sazak, president of Turkey’s contractors union, was quoted as saying, “When you want to do business in a
new market…you need as direct flights as possible…” in “Companies no longer content to rely on traditional ties
with west,” by Funja Guler and Daniel Dombey, Financial Times Special Report on “New Trade Routes: Turkey,”
Thursday May 9, 2013.
2
growing literature that examines the implications of liberalization in international aviation markets. 3 One
branch of the literature has exploited the high quality data available for air travel involving US airports,
and variation in the timing of US bilateral agreements.4 This literature gives us a fairly nuanced
understanding of the effects of the US agreements, including estimates of the effect of an agreement on
the number of city pairs with direct flights. But the insights of this literature are related to the US market,
and to the specifics of the agreements the US has signed. Another branch of the literature has used cross-
sectional variation in the level of policy commitments in agreements world-wide.5 This literature offers
an understanding of the effects outside the US, but there is not yet evidence on particular outcomes such
as growth in the number of city pairs served by direct flights.
We extend the analysis and add to the existing literature in four different ways. First, we employ
a rich cross-sectional dataset on origin-destination pairs worldwide that combines the extensive country
coverage observed in prior studies with the city-pair level detail that has only been exploited in studies of
agreements involving the United States or, in some cases, Europe. 6 This improved dataset acquired from
3 Fu et al. (2010) offer a review of this and related literatures, including much earlier work on liberalizations within
the United States and the European Union. Important lessons from this review about the implications of
liberalization include increased hubbing and of low cost carriers for passenger growth and price competition.
Dobruszkes (2009) finds that European liberalization led to service between many new city-to-city pairs, but did
relatively little to increase competition within existing routes. One lesson Dobruskes draws that is perhaps
applicable to other plurilateral settings is that the carriers that took most advantage of the new freedoms of the air
were typically new low-cost carriers rather than existing national carriers. 4 Brueckner and Whalen (2000), Brueckner (2003), Whalen (2007), and Bilotkach (2007) employ US international
data on true origin-destination city-pair air traffic to investigate the price effects of inter-airline strategic alliances
and market competition following the signing of OSAs. Cristea et al. (2012) and Jia and Winston (2012) consolidate
the various market responses associated with the liberalization of air passenger traffic into a welfare calculation.
Booz-Allen Hamilton (2007) uses time series data to link passenger growth to the timing of liberalizations between
US and specific EU countries, Micco and Serebrisky (2006) find that OSAs reduce air cargo freight rates by 9
percent and increase the share of US imports arriving by air by 5 percent after 5 years or more after the agreements
enter into force. 5 Gonenc and Nicoletti (2001) and Doove et al. (2001) use factor analysis and information on a wide array of
industry characteristics to construct aviation restrictiveness indexes. Piermartini and Rousova (2012), use
information on 2300 bilateral Air Service Agreement (ASA) in force in 2005 among 184 countries to estimate the
impact of air service liberalization on bilateral passenger flows. They find that increasing the degree of
liberalization between two countries from the 25th
to 75th
percentile observed in the sample increases total passenger
traffic by approximately 18 percent. InterVISTAS (2006) estimates a gravity model using country-pair data and
specific components of the ALI index. Their estimates suggest that agreements with predetermined capacity have
lower levels of passenger traffic, ceteris paribus. 6 Schipper et al (2002) study liberalizations within the European Union, using the same source of data for city-to-
city passenger traffic that we use. Their more limited geographic scope means that they are able to obtain richer
3
the International Civil Aviation Organization (ICAO) allows us to expand our investigation beyond
country-level gravity regressions. Second, our econometric analysis focuses not only on bilateral aviation
agreements but also on plurilateral agreements. Third, we go beyond understanding the impact of aviation
policy on air passenger flows and explore how liberalization affects the extensive margin of global
aviation through the introduction of new direct services at the city-pair level. Finally, we use the results of
our model to derive counterfactual calculations and predictions of the impact of policy changes.
The results of the paper suggest that more liberal bilateral air service agreements are associated
with more passenger traffic between countries and between cities, and with more city-pairs served by
direct flights. There appears to be no consistent statistically significant difference between the effects of
bilateral and plurilateral agreements once we take into account the respective policy content. We use our
empirical results in a counterfactual analysis in two steps.7 First, we quantify the impact of deepening the
ACAC agreement by assessing how much more traffic there would be among ACAC members if the
policy commitments were extended to match those of the most liberal international agreements (e.g. UK-
Singapore). Using country-level data we find that traffic flows would grow by approximately 30 percent.
The city-pair estimates suggest that traffic along given routes would grow modestly (by 7 to 18 percent),
and that there would be a significant increase in the number of city pairs served by direct international
flights within the ACAC.
In the second step, we estimate the implications of Turkey’s accession to the ACAC agreement,
assuming the more liberal commitments. This implies very large changes in the openness of the policy
commitments, because Turkey’s existing agreements with countries in the region are quite restrictive,
when such agreements exist at all. The country level analysis of Turkey’s accession to the ACAC at
data on prices, costs, and frequency of flights, and to exploit time series variation. Because our study is global, we
lack comprehensive data on prices, costs and frequency, and our policy data limit us to cross-sectional analysis. 7 The counterfactual analysis we conduct relies solely on parameters we estimate in the reduced form econometric
models, and not on a fully specified model of the behavior of market participants. As such we only calculate first
order effects of liberalization, assuming that the coefficients remain constant and that other right hand side variables
do not change in response to our policy shock. We are potentially missing secondary effects that might operate, for
example, through binding capacity constraints, or through spillovers to other markets. But these effects are difficult
to estimate without substantially more data and a richer model structure, so we employ transparent calculations that
rely on the reduced form estimates.
4
increased levels of policy commitments suggests that passenger traffic between Turkey and ACAC
countries would more than double.8 City level analysis suggests that the increase in traffic would occur
both through the growth of traffic on given routes and substantial increases in the number of city pairs
served.9 In the full liberalization policy scenario that we consider, passenger growth along existing routes
is modest, but the likelihood that a direct flight would occur between a given pairing of a Turkish and an
ACAC city nearly triples. These large increases reflect both the significant changes in policy that we
contemplate and the low probability that such city pairs are currently served by direct flights.
The remainder of the paper is organized as follows. Section II describes the two main sources of
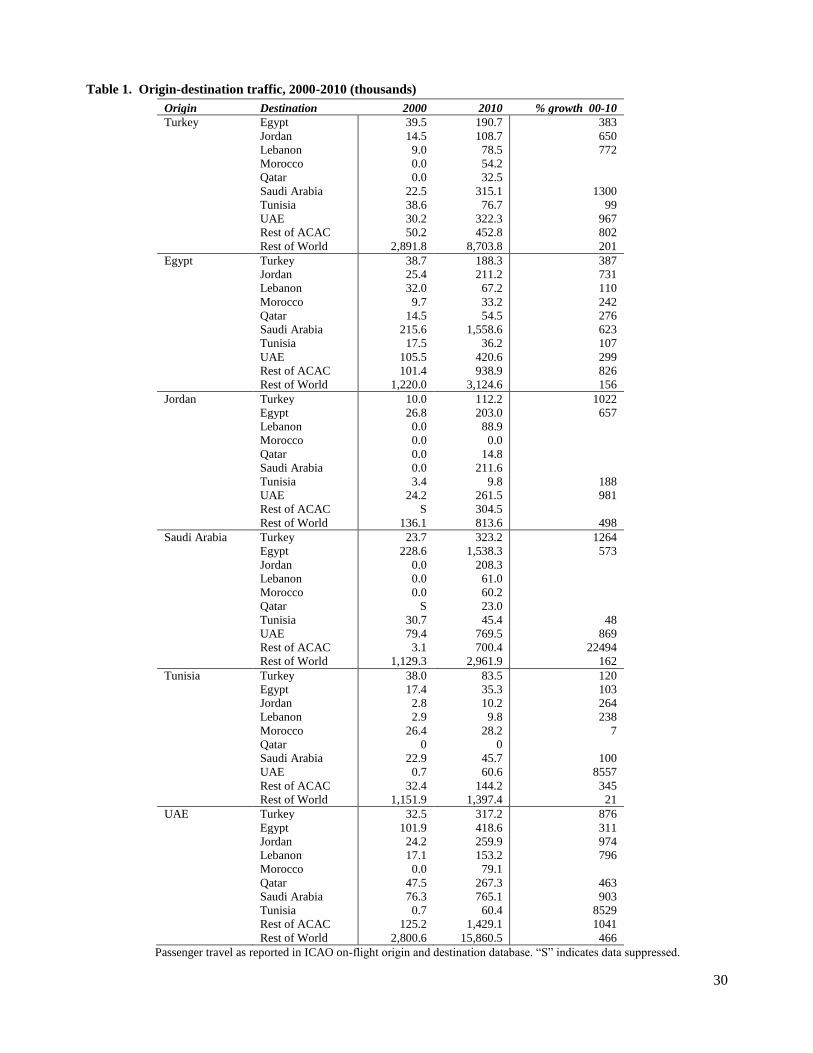
data used in our analysis. Section III chronicles trends in international air passenger travel and the
restrictiveness of existing bilateral air services agreements among the countries in our sample. Section IV
describes the gravity model used to estimate the links between bilateral traffic and policy while
controlling for other determinants of air traffic. Section V presents the results and their main
implications, while Section VI concludes.
II. Data
This section describes several data sets that we combine in our analysis. Our principal measure
of air traffic activity is passenger travel on scheduled international flights between origin and destination
cities. We seek to understand how this and related measures of air passenger traffic are associated with
measures of international air policy embedded in bilateral and plurilateral air services agreements. Our
data also include a number of control variables that we also describe in this section.
Passenger data. The primary data set that we use to document air passenger travel is the on-
flight origin and destination (OFOD) database purchased from the ICAO. The ICAO collects information
from national governments on international flight segments for scheduled air flights. The data we employ
8 A policy scenario in which Turkey enters at the existing level of ACAC commitments generates a rough doubling
of passenger traffic between Turkey and the ACAC member states. 9 An increase in the number of cities served by international travel reflects an improvement in the overall quality of
air transport services because more people have the ability to take a direct flight.
5
is the number of passengers travelling on scheduled flights for each pair of cities connected by an
international flight.
This traffic measure differs from that used in Piermartini and Rousova (2012), which employs
data from the International Air Travel Association (IATA) on numbers of international tickets, rather than
flights.10
Ticket information follows a passenger from origin airport to destination airport, and this may
contain multiple flights. Ticket information is useful for understanding customers’ demand for
international travel; flight information presents in detail the manner in which airlines supply segments of
passengers’ international travel.
The information we study, then, is best at documenting the existence of direct flights, and the
degree to which flights between specific city-pairs are used. The information we have does not contain
information on prices (i.e. ticket fares), nor does it indicate class of service offered, only passenger
numbers. Perhaps its most useful attribute is that it indicates whether or not a passenger travelling
between two cities has to change planes, which is a key indicator of quality.11
In focusing our attention on
flights, rather than tickets, we seek to complement existing evidence on the effects of air services policy
on passenger travel as measured by tickets.12
The ICAO data is incomplete for years following 2010, so we use passenger data for 2010. Thus
all our estimates characterize the situation in 2010. Our counterfactual analysis indicates what would
have been the situation in 2010, if the policy scenarios we consider had been in place then. For example,
we calculate the predicted air travel patterns if the ACAC were to adopt more liberal policy commitments.
The predicted passenger routes are an estimate of what routes would have existed if the proposed policies
had been in place in 2010.
10
The data used by Piermartini and Rousova (2012) are also aggregated at the country level, while we have
information for city-to-city flights. In some cases, we also aggregate to the country level, but some suppressions in
our city pair data make the city-to-city data preferable. 11
Some very long flights in our database would involve a change in planes. For example, the Chicago, USA to
Sydney, Australia flights in the database involve a stopover in Los Angeles, US, and a plane change. We are not
able to distinguish such flights but consider the ICAO indication that there is a flight between two cities to be a close
enough proxy for the existence of a direct flight. 12
In their study of US data, Cristea et al (2012) find that policy does affect both flights and ticketing demand.
Nonetheless they find that much of the increased passenger activity that is attributed to the air services agreement
can be linked to the increased number of flights on the initial international segment.
6
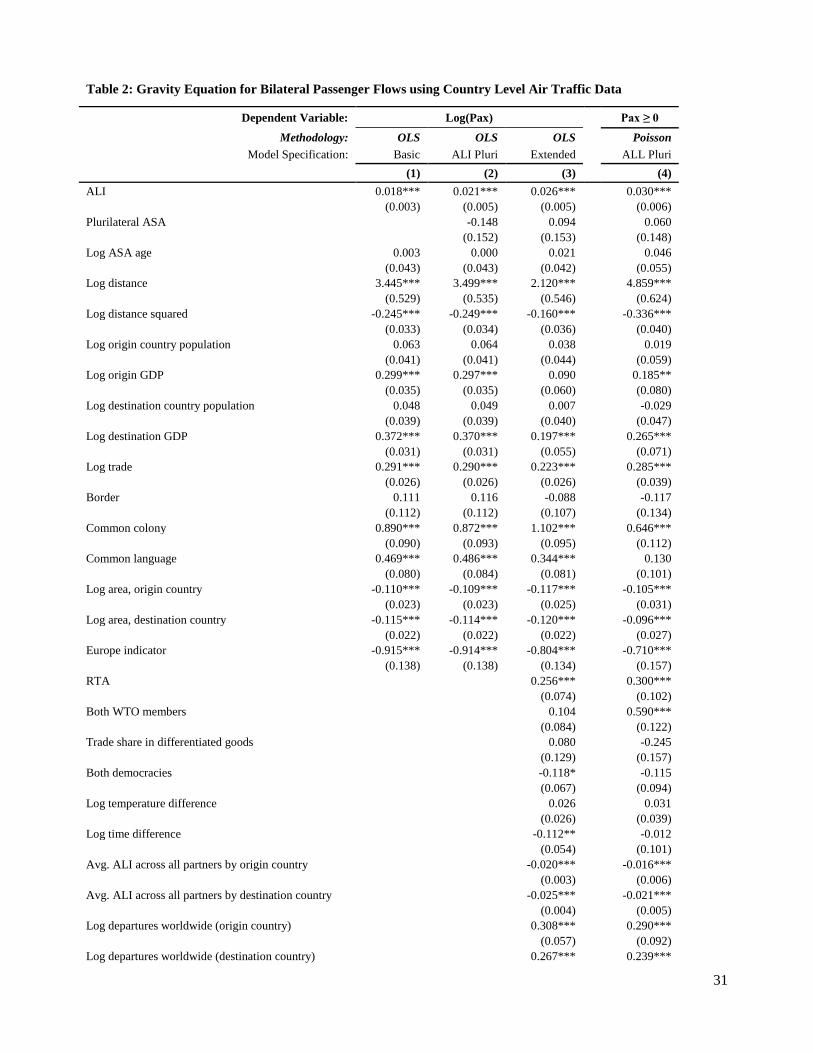
Policy data. Our primary indicator of policy is the Air Liberalization Index (ALI) score assigned
to each agreement by an analysis done at the World Trade Organization (WTO). The WTO created four
summary indicators of policy embodied in air services agreements. These indicators are weighted sums
of individual features of the agreements: traffic rights, (lack of) restrictions on capacity, flexibility of
pricing allowed, withholding restrictions such as ownership or place of business, designation, and other
elements. We also examine separately the impact of these individual components of air service
agreements, but because of concerns about gaps in the disaggregated data and multicollinearity between
the components, our preferred specification includes only the composite ALI. We employ the standard
measure of ALI produced by the WTO. Like the other measures, the standard ALI runs from 0 to 50;
agreements that score 50 are the most liberal agreements. Two agreements in the database have a score of
50, the UK-Singapore agreement and the New Zealand - Brunei Darussalam agreement. One empirical
difficulty is that the WTO did not provide an ALI score for the European Union, which has a common
policy on international flights within the region and might be understood as a plurilateral agreement. We
score the European Union at ALI = 50, but we also include a dummy variable that captures any
idiosyncratic differences between the EU arrangements and bilateral arrangements that are scored at ALI
= 50.13
The WTO index was created to score bilateral air services agreements, which are the binding
agreements for most international air traffic, but more recently, a number of plurilateral arrangements
have been signed. These agreements regulate air services among groups of countries, rather than just
pairs of countries. While the WTO has applied to the plurilateral agreements the methodology it applied
to bilateral agreements, there are some difficulties with the interpretation of these scores in the plurilateral
context. Notably, third-country travel arrangements are often allowed within a plurilateral agreement’s
membership but often not outside the membership. In order to account for possible differences in the
13
The dummy variable can also be understood as a control for the deep integration of transportation markets in
Europe, which provides readily available alternatives to air passenger travel. With that interpretation in mind, we
also included flows involving Iceland, Norway and Switzerland in our Europe Indicator dummy.
7
effect of policy on traffic we also include a dummy variable indicating that the two countries’ air travel is
governed by a plurilateral rather than bilateral air services agreement.
Finally, we also include a variable indicating the age of the air services agreement. This should be
understood primarily as a control variable. Older agreements might link countries that were especially
prominent in early air travel. Agreement age might also affect policy if recent agreements tend to be
more open. Whatever the dominant effect, it is useful to allow agreements to have differentiated effects
based upon their age.
Control data. In order to identify the impact of policy on traffic we must also control for non-
policy determinants of international traffic. Since our primary interest is in city-to-city traffic, we include
a number of controls at the city and the city-pair levels. The primary city-specific data we include is city
population.14
City-to-city distances are included as further controls; specifically, we employ great-circle
distances as calculated from the geographic coordinates of each city. Logged distances are included in
the regression as are squared log distances. We also include a measure of the absolute number of hours of
difference in time between the two cities as such time differences might affect air travel demand.
There are several control variables at the country and country-pair levels. Country level measures
of GDP per capita, population, and land area are taken from the World Development Indicators (WDI),
and are included as potential determinants of the overall demand for air travel. Since our data pertains to
the number of passengers traveling on direct flights between specific pairs of cities, rather than the entire
origin to destination journey, we control for the attractiveness of locations that serve as hubs by including
the total number of departures from each location (also from the WDI dataset). Country-pair control
measures include dummy variables indicating that a) one country colonied the other, b) the two countries
share a common language, c) the countries share a land border, d) are both democracies, e) are both WTO
14
The population data are taken, in the first instance from UN Department of Economic and Social Affairs,
Population Division. This data set does not report populations for some smaller cities. We supplement this data
with data from the web site www.citypopulation.de, an aggregator of national population statistics. In each case the
city populations are reflective of larger urban areas, not simply the city boundaries.
Log destination country population 0.048 0.049 0.007
-0.029
(0.039) (0.039) (0.040)
(0.047)
Log destination GDP 0.372*** 0.370*** 0.197***
0.265***
(0.031) (0.031) (0.055)
(0.071)
Log trade 0.291*** 0.290*** 0.223***
0.285***
(0.026) (0.026) (0.026)
(0.039)
Border 0.111 0.116 -0.088
-0.117
(0.112) (0.112) (0.107)
(0.134)
Common colony 0.890*** 0.872*** 1.102***
0.646***
(0.090) (0.093) (0.095)
(0.112)
Common language 0.469*** 0.486*** 0.344***
0.130
(0.080) (0.084) (0.081)
(0.101)
Log area, origin country -0.110*** -0.109*** -0.117***
-0.105***
(0.023) (0.023) (0.025)
(0.031)
Log area, destination country -0.115*** -0.114*** -0.120***
-0.096***
(0.022) (0.022) (0.022)
(0.027)
Europe indicator -0.915*** -0.914*** -0.804***
-0.710***
(0.138) (0.138) (0.134)
(0.157)
RTA
0.256***
0.300***
(0.074)
(0.102)
Both WTO members
0.104
0.590***
(0.084)
(0.122)
Trade share in differentiated goods
0.080
-0.245
(0.129)
(0.157)
Both democracies
-0.118*
-0.115
(0.067)
(0.094)
Log temperature difference
0.026
0.031
(0.026)
(0.039)
Log time difference
-0.112**
-0.012
(0.054)
(0.101)
Avg. ALI across all partners by origin country
-0.020***
-0.016***
(0.003)
(0.006)
Avg. ALI across all partners by destination country
-0.025***
-0.021***
(0.004)
(0.005)
Log departures worldwide (origin country)
0.308***
0.290***
(0.057)
(0.092)
Log departures worldwide (destination country)
0.267***
0.239***
32
(0.055)
(0.086)
Observations 2,074 2,074 2,074
2,074
R-squared 0.50 0.50 0.55
Counterfactual Scenario 21.9 26.0 33.1
39.1 % change if ACAC liberalizes fully (ALI = 50)
Robust standard errors in parentheses*** p<0.01, ** p<0.05, * p<0.1
Notes: The results reported in this table are obtained by estimating the regression model given by equation (1) in the text.
The unit of observation is a country pair. The dependent variable is the number of air passengers traveling between two
countries.
33
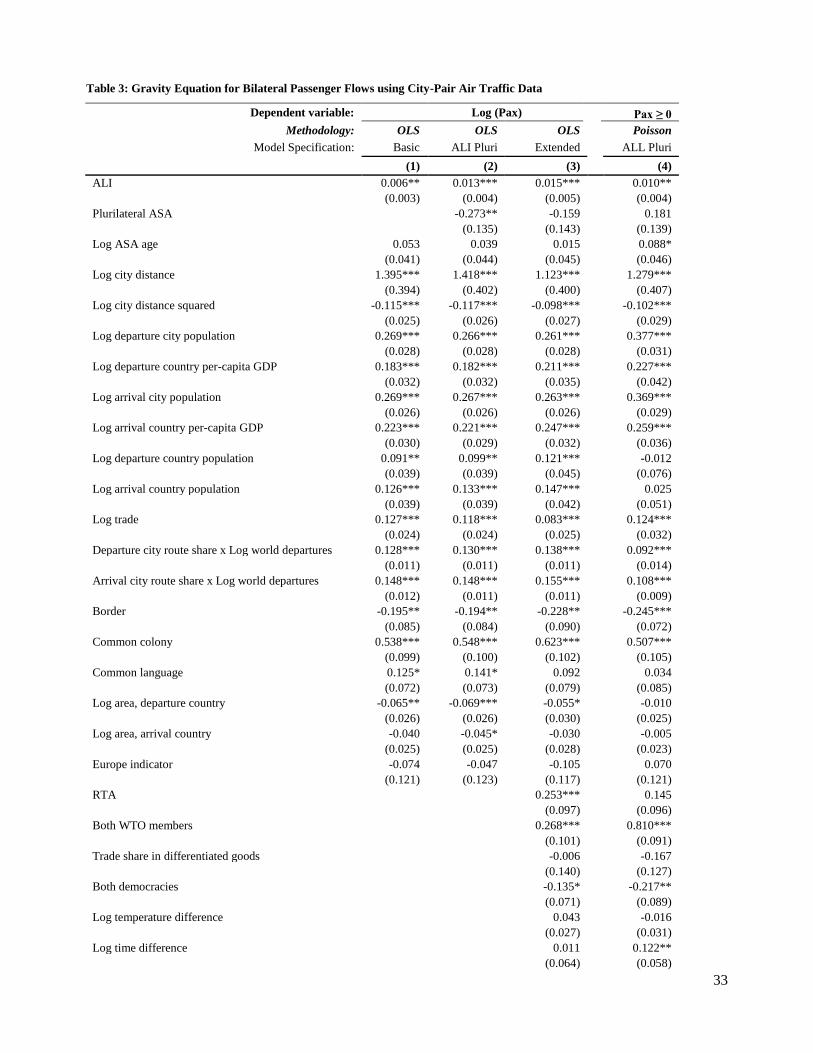
Table 3: Gravity Equation for Bilateral Passenger Flows using City-Pair Air Traffic Data
Dependent variable: Log (Pax) Pax ≥ 0
Methodology: OLS OLS OLS
Poisson
Model Specification: Basic ALI Pluri Extended
ALL Pluri
(1) (2) (3) (4)
ALI 0.006** 0.013*** 0.015***
0.010**
(0.003) (0.004) (0.005)
(0.004)
Plurilateral ASA
-0.273** -0.159
0.181
(0.135) (0.143)
(0.139)
Log ASA age 0.053 0.039 0.015
0.088*
(0.041) (0.044) (0.045)
(0.046)
Log city distance 1.395*** 1.418*** 1.123***
1.279***
(0.394) (0.402) (0.400)
(0.407)
Log city distance squared -0.115*** -0.117*** -0.098***
-0.102***
(0.025) (0.026) (0.027)
(0.029)
Log departure city population 0.269*** 0.266*** 0.261***
0.377***
(0.028) (0.028) (0.028)
(0.031)
Log departure country per-capita GDP 0.183*** 0.182*** 0.211***
0.227***
(0.032) (0.032) (0.035)
(0.042)
Log arrival city population 0.269*** 0.267*** 0.263***
0.369***
(0.026) (0.026) (0.026)
(0.029)
Log arrival country per-capita GDP 0.223*** 0.221*** 0.247***
0.259***
(0.030) (0.029) (0.032)
(0.036)
Log departure country population 0.091** 0.099** 0.121***
-0.012
(0.039) (0.039) (0.045)
(0.076)
Log arrival country population 0.126*** 0.133*** 0.147***
0.025
(0.039) (0.039) (0.042)
(0.051)
Log trade 0.127*** 0.118*** 0.083***
0.124***
(0.024) (0.024) (0.025)
(0.032)
Departure city route share x Log world departures 0.128*** 0.130*** 0.138***
0.092***
(0.011) (0.011) (0.011)
(0.014)
Arrival city route share x Log world departures 0.148*** 0.148*** 0.155***
0.108***
(0.012) (0.011) (0.011)
(0.009)
Border -0.195** -0.194** -0.228**
-0.245***
(0.085) (0.084) (0.090)
(0.072)
Common colony 0.538*** 0.548*** 0.623***
0.507***
(0.099) (0.100) (0.102)
(0.105)
Common language 0.125* 0.141* 0.092
0.034
(0.072) (0.073) (0.079)
(0.085)
Log area, departure country -0.065** -0.069*** -0.055*
-0.010
(0.026) (0.026) (0.030)
(0.025)
Log area, arrival country -0.040 -0.045* -0.030
-0.005
(0.025) (0.025) (0.028)
(0.023)
Europe indicator -0.074 -0.047 -0.105
0.070
(0.121) (0.123) (0.117)
(0.121)
RTA
0.253***
0.145
(0.097)
(0.096)
Both WTO members
0.268***
0.810***
(0.101)
(0.091)
Trade share in differentiated goods
-0.006
-0.167
(0.140)
(0.127)
Both democracies
-0.135*
-0.217**
(0.071)
(0.089)
Log temperature difference
0.043
-0.016
(0.027)
(0.031)
Log time difference
0.011
0.122**
(0.064)
(0.058)
34
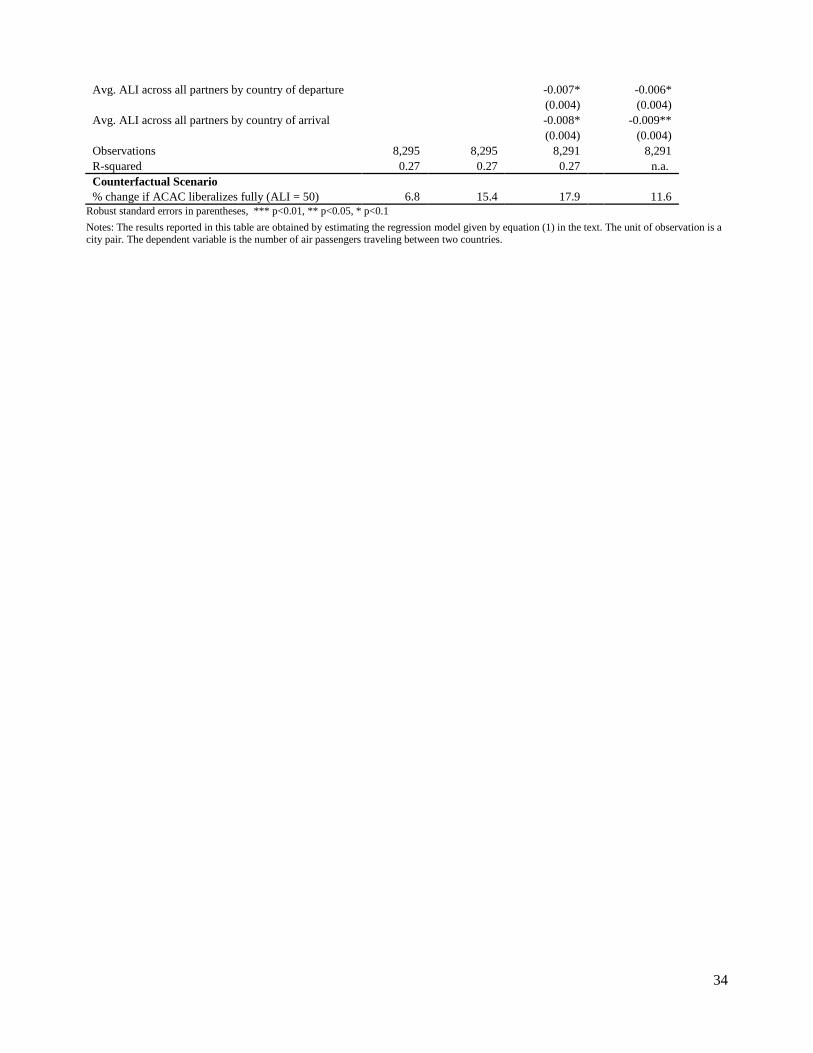
Avg. ALI across all partners by country of departure
-0.007*
-0.006*
(0.004)
(0.004)
Avg. ALI across all partners by country of arrival
-0.008*
-0.009**
(0.004)
(0.004)
Observations 8,295 8,295 8,291
8,291
R-squared 0.27 0.27 0.27 n.a.
Counterfactual Scenario
% change if ACAC liberalizes fully (ALI = 50) 6.8 15.4 17.9 11.6
Robust standard errors in parentheses, *** p<0.01, ** p<0.05, * p<0.1
Notes: The results reported in this table are obtained by estimating the regression model given by equation (1) in the text. The unit of observation is a city pair. The dependent variable is the number of air passengers traveling between two countries.
35
Table 4: Likelihood of Market Entry for Direct Air Service at City-Pair Level
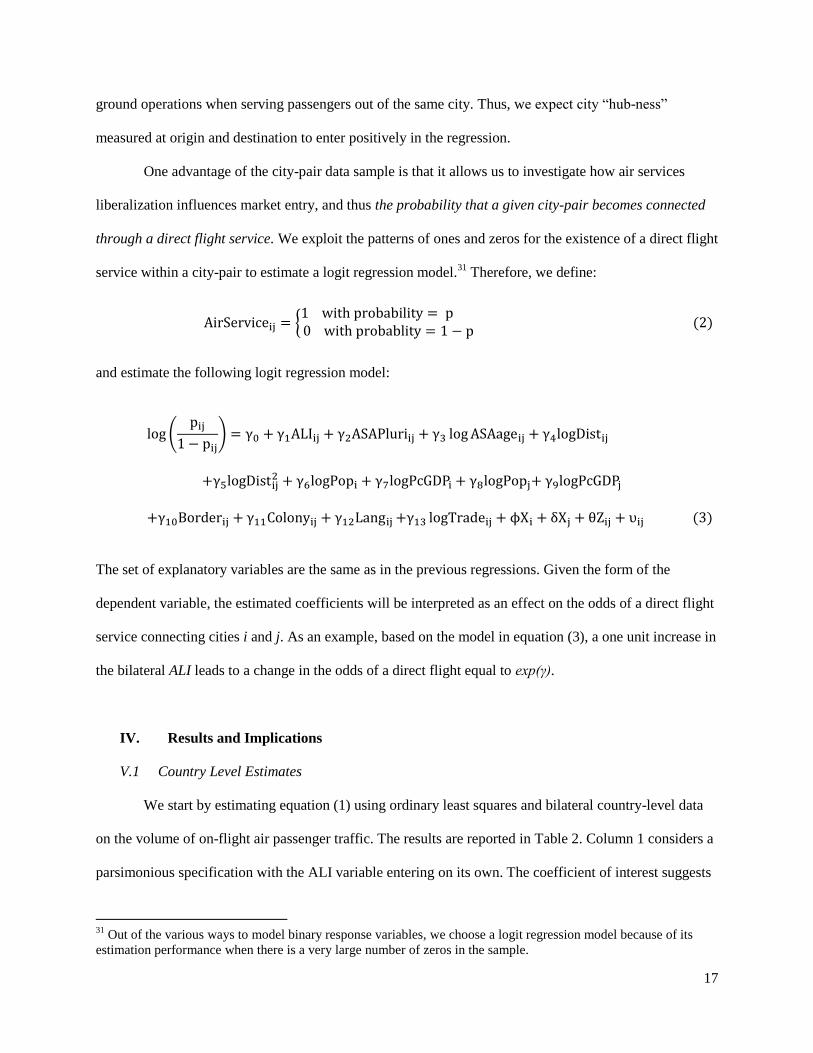
Dependent variable: Pr(Pax > 0)
Methodology: Logit Logit Logit
Model Specification: Basic ALI Pluri Extended
(1) (2) (3)
ALI 0.025*** 0.031*** 0.019***
(0.004) (0.005) (0.005)
Plurilateral ASA
-0.286* -0.104
(0.160) (0.155)
Log ASA age 0.089* 0.073 0.007
(0.051) (0.053) (0.050)
Log city distance 4.682*** 4.764*** 4.382***
(0.405) (0.410) (0.389)
Log city distance squared -0.372*** -0.378*** -0.358***
(0.026) (0.027) (0.027)
Log departure city population 0.491*** 0.491*** 0.533***
(0.032) (0.032) (0.035)
Log departure country per-capita GDP 0.219*** 0.217*** 0.263***
(0.046) (0.045) (0.046)
Log arrival city population 0.487*** 0.487*** 0.510***
(0.034) (0.034) (0.036)
Log arrival country per-capita GDP 0.232*** 0.230*** 0.288***
(0.040) (0.040) (0.042)
Log departure country population -0.035 -0.031 -0.049
(0.048) (0.048) (0.052)
Log arrival country population -0.047 -0.043 -0.012
(0.051) (0.051) (0.050)
Log trade 0.272*** 0.264*** 0.195***
(0.029) (0.028) (0.029)
Departure city route share x Log world departures 0.270*** 0.269*** 0.267***
(0.012) (0.011) (0.011)
Arrival city route share x Log world departures 0.261*** 0.260*** 0.264***
(0.012) (0.012) (0.012)
Border -0.115 -0.132 -0.274**
(0.116) (0.118) (0.112)
Common colony 0.403*** 0.441*** 0.553***
(0.136) (0.139) (0.136)
Common language 0.544*** 0.546*** 0.481***
(0.093) (0.092) (0.091)
Log area, departure country 0.021 0.015 0.088***
(0.027) (0.027) (0.028)
Log area, arrival country 0.014 0.007 0.047*
(0.027) (0.027) (0.027)
Europe indicator -0.644*** -0.624*** -0.524***
(0.205) (0.207) (0.192)
RTA
0.349***
(0.099)
Both WTO members
1.067***
(0.134)
Trade share in differentiated goods
0.277*
(0.150)
Both democracies
-0.278***
(0.073)
Log temperature difference
0.057*
(0.029)
Log time difference
-0.004
36
(0.069)
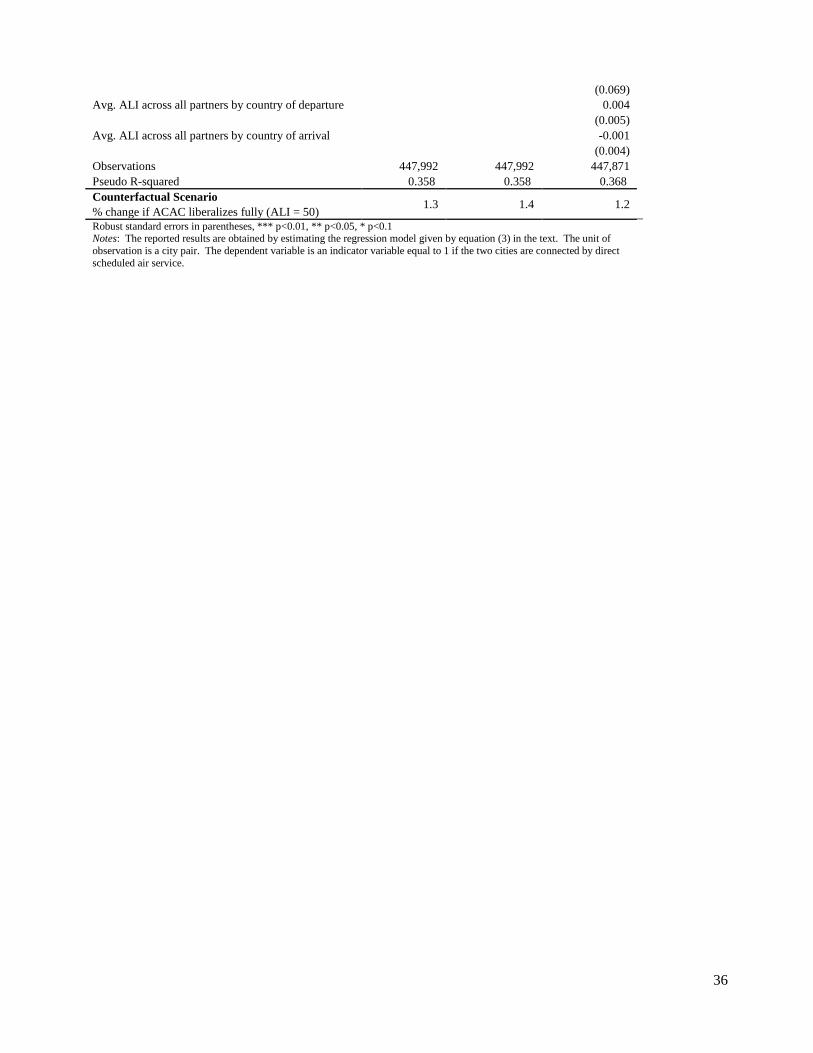
Avg. ALI across all partners by country of departure
0.004
(0.005)
Avg. ALI across all partners by country of arrival
-0.001
(0.004)
Observations 447,992 447,992 447,871
Pseudo R-squared 0.358 0.358 0.368
Counterfactual Scenario 1.3 1.4 1.2
% change if ACAC liberalizes fully (ALI = 50)
Robust standard errors in parentheses, *** p<0.01, ** p<0.05, * p<0.1 Notes: The reported results are obtained by estimating the regression model given by equation (3) in the text. The unit of
observation is a city pair. The dependent variable is an indicator variable equal to 1 if the two cities are connected by direct
scheduled air service.
37
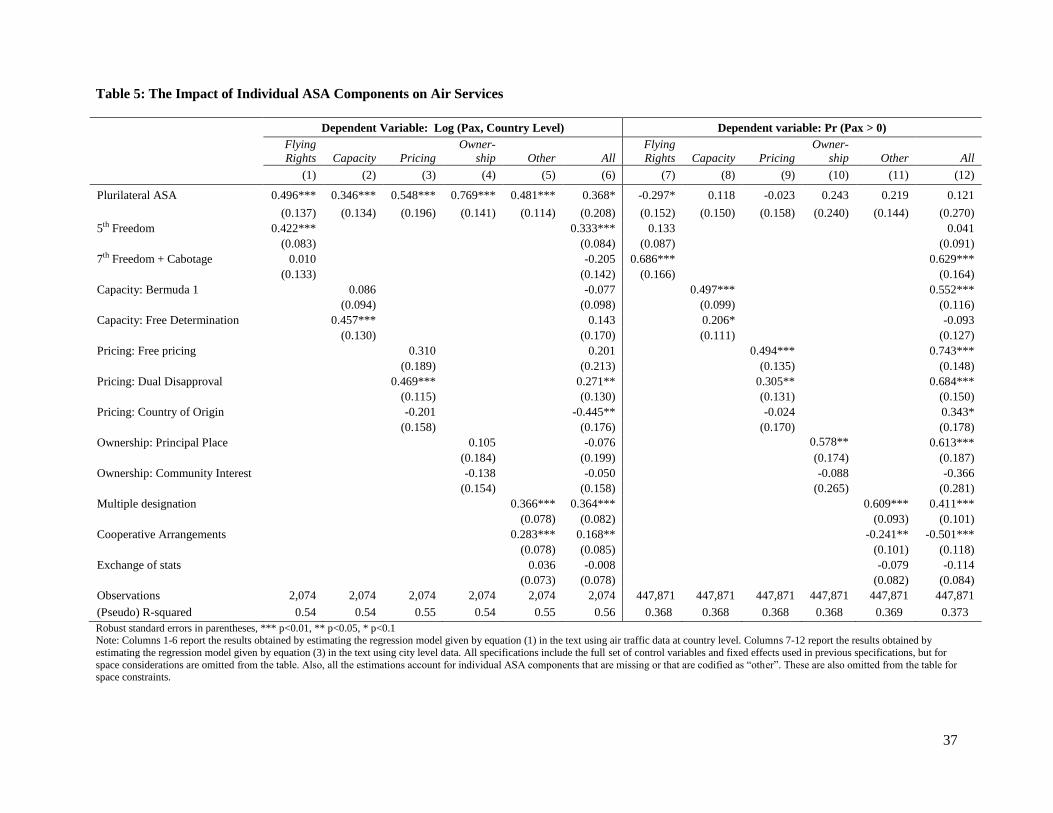
Table 5: The Impact of Individual ASA Components on Air Services
Robust standard errors in parentheses, *** p<0.01, ** p<0.05, * p<0.1 Note: Columns 1-6 report the results obtained by estimating the regression model given by equation (1) in the text using air traffic data at country level. Columns 7-12 report the results obtained by
estimating the regression model given by equation (3) in the text using city level data. All specifications include the full set of control variables and fixed effects used in previous specifications, but for
space considerations are omitted from the table. Also, all the estimations account for individual ASA components that are missing or that are codified as “other”. These are also omitted from the table for space constraints.
38
Table 6: Counterfactual Exercise for the Case of Turkey Joining the Intra-Arab Freedom of the Air Programme at most liberal policy (ALI = 50)
UNITED ARAB EMIRATES 317167 322272 5 12.7 37.3 89 190 24 49
YEMEN 14356 12740 1 5.0 45.0 122 254 37 68
Avg Predicted change 105 221 30 58
Note: This table reports counterfactual calculation for the case of an increase in the aviation liberalization index (ALI) between Turkey and each of the
member countries of the Intra-Arab Freedom of the Air Programme from the actual ALI level to a value of 50 corresponding to the plurilateral
agreement. The predictions for the change in aggregate passengers, number of air services, and city-pair level air traffic are based on regression coefficients
reported in Tables 2 and 3 respectively.
39
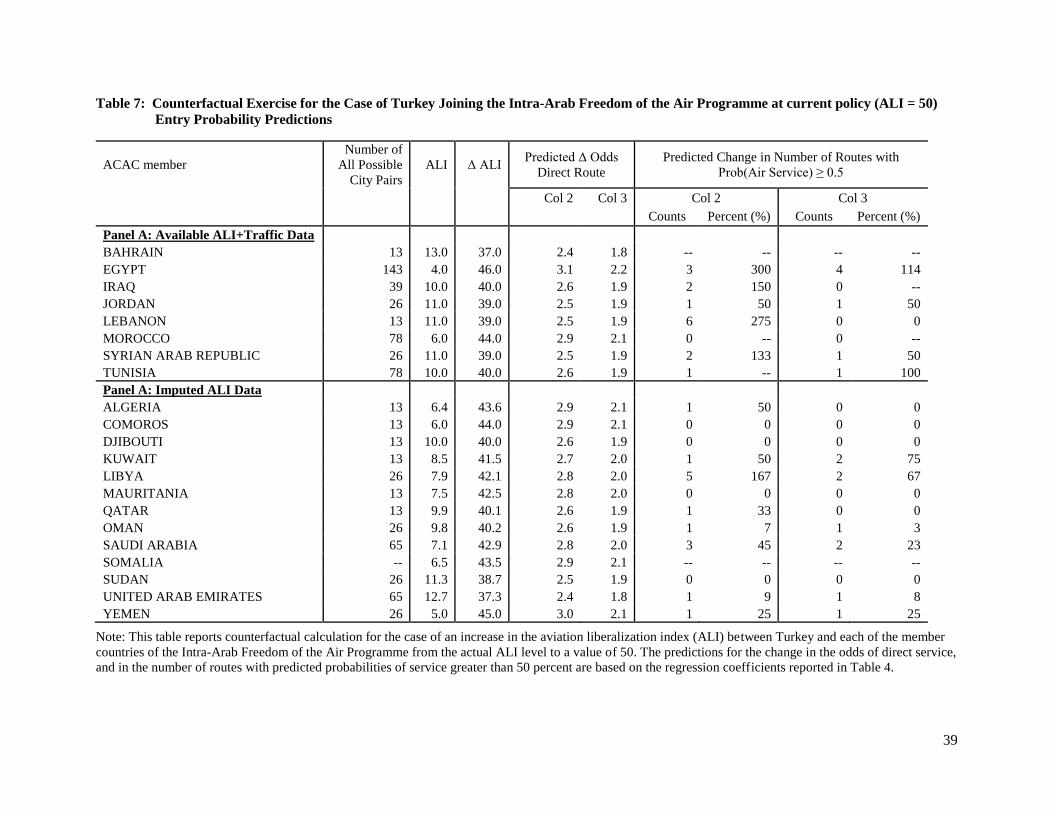
Table 7: Counterfactual Exercise for the Case of Turkey Joining the Intra-Arab Freedom of the Air Programme at current policy (ALI = 50)
Note: This table reports counterfactual calculation for the case of an increase in the aviation liberalization index (ALI) between Turkey and each of the member
countries of the Intra-Arab Freedom of the Air Programme from the actual ALI level to a value of 50. The predictions for the change in the odds of direct service,
and in the number of routes with predicted probabilities of service greater than 50 percent are based on the regression coefficients reported in Table 4.
40
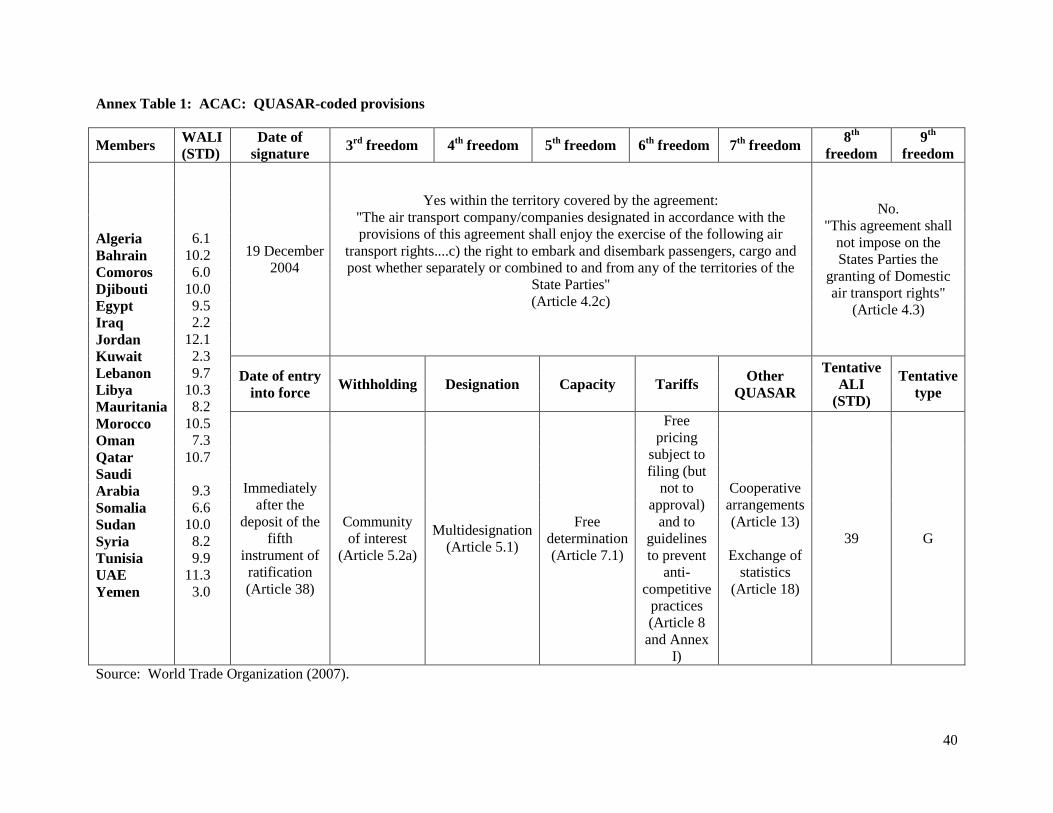
Annex Table 1: ACAC: QUASAR-coded provisions
Members WALI
(STD)
Date of
signature 3
rd freedom 4
th freedom 5
th freedom 6
th freedom 7
th freedom
8th
freedom
9th
freedom
Algeria
Bahrain
Comoros
Djibouti
Egypt
Iraq
Jordan
Kuwait
Lebanon
Libya
Mauritania
Morocco
Oman
Qatar
Saudi
Arabia
Somalia
Sudan
Syria
Tunisia
UAE
Yemen
6.1
10.2
6.0
10.0
9.5
2.2
12.1
2.3
9.7
10.3
8.2
10.5
7.3
10.7
9.3
6.6
10.0
8.2
9.9
11.3
3.0
19 December
2004
Yes within the territory covered by the agreement:
"The air transport company/companies designated in accordance with the
provisions of this agreement shall enjoy the exercise of the following air
transport rights....c) the right to embark and disembark passengers, cargo and
post whether separately or combined to and from any of the territories of the
State Parties"
(Article 4.2c)
No.
"This agreement shall
not impose on the
States Parties the
granting of Domestic
air transport rights"
(Article 4.3)
Date of entry
into force Withholding Designation Capacity Tariffs
Other
QUASAR
Tentative
ALI
(STD)
Tentative
type
Immediately
after the
deposit of the
fifth
instrument of
ratification
(Article 38)
Community
of interest
(Article 5.2a)
Multidesignation
(Article 5.1)
Free
determination
(Article 7.1)
Free
pricing
subject to
filing (but
not to
approval)
and to
guidelines
to prevent
anti-
competitive
practices
(Article 8
and Annex
I)
Cooperative
arrangements
(Article 13)
Exchange of
statistics
(Article 18)
39 G
Source: World Trade Organization (2007).
41
Annex Table 2: ACAC Relationship with other Air Services Agreements and third parties
Air Services Agreements/third parties
concerned Provision Description or text
Past bilateral ASAs between members of the
plurilateral
Article 2.3 "The provisions of this Agreement shall supersede any conflicting provisions of the bilateral or
multilateral agreements concluded to regulate air transport between the States Parties. Any
provisions of such agreements that are not stipulated in this Agreement shall remain in force."
Past and future bilateral ASAs between
members of the plurilateral and third parties
Article 31 "1. The States Parties shall not grant rights or give undertakings to third party States where such
rights or undertakings could restrict or affect the rights conferred upon the States Parties under
this Agreement.
2. The rights conferred upon the States Parties under this Agreement shall not be subject to
individual negotiations or dealings with any third party state or states where such negotiations or
dealings could affect the rights of the other State Party/States Parties.
3. The arrangements and mechanisms relating to group or multilateral negotiations referred to in
paragraph (2) of this article shall be subject to a regulatory framework in the form of an
agreement which shall enter into force in accordance with the constitutional procedures of each
State."
Provision to address overlaps with other
plurilateral agreements
Article 34 "1. Any State Party linked to another State Party or third party State by commitments in the field
of air transport which are in conflict with the provisions of this Agreement shall take the
necessary steps to release itself from such commitments without delay.
2. Any State Party whose air transport company/companies has/have entered into commitments
which are in conflict with this Agreement shall take the steps necessary to secure release from
such obligations as soon as possible.
3. The State Party concerned shall inform the General Secretariat to the Commission of the steps
taken in respect of the two eventualities referred to above."
Algeria, Libya, Mauritania, Somalia and Tunisia are also members of Yamoussoukro.
Comoros, Egypt, Djibouti and Sudan are also members of COMESA and of Yamoussoukro
Accession provisions for third parties
Article 32 "The State Party/States Parties shall have the right to exchange the air transport rights stipulated
in this agreement on a basis of reciprocity with any alliance of third party states grouped in a
regional or sub-regional economic integration organization. To this end, the States Parties may
call on the assistance of the Arab Civil Aviation Commission or any other negotiating body which
may be entrusted with this task."
Source: World Trade Organization (2007).
42
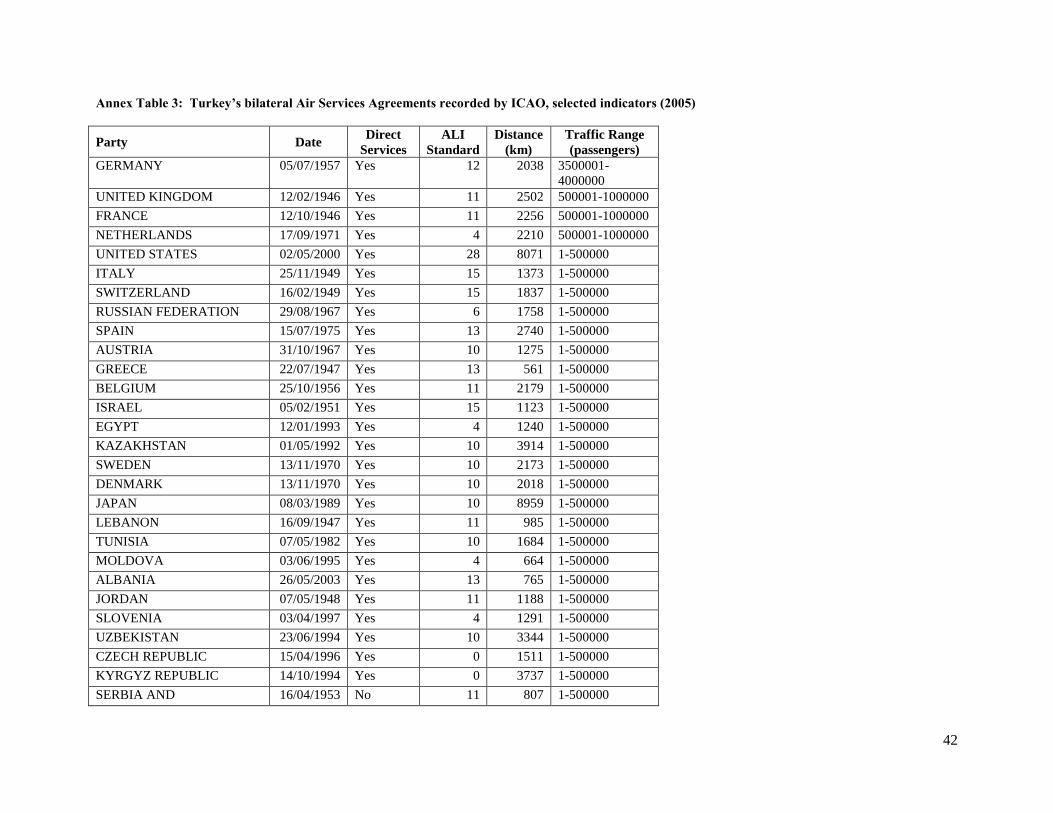
Annex Table 3: Turkey’s bilateral Air Services Agreements recorded by ICAO, selected indicators (2005)
Party Date Direct
Services
ALI
Standard
Distance
(km)
Traffic Range
(passengers)
GERMANY 05/07/1957 Yes 12 2038 3500001-
4000000
UNITED KINGDOM 12/02/1946 Yes 11 2502 500001-1000000
FRANCE 12/10/1946 Yes 11 2256 500001-1000000
NETHERLANDS 17/09/1971 Yes 4 2210 500001-1000000
UNITED STATES 02/05/2000 Yes 28 8071 1-500000
ITALY 25/11/1949 Yes 15 1373 1-500000
SWITZERLAND 16/02/1949 Yes 15 1837 1-500000
RUSSIAN FEDERATION 29/08/1967 Yes 6 1758 1-500000
SPAIN 15/07/1975 Yes 13 2740 1-500000
AUSTRIA 31/10/1967 Yes 10 1275 1-500000
GREECE 22/07/1947 Yes 13 561 1-500000
BELGIUM 25/10/1956 Yes 11 2179 1-500000
ISRAEL 05/02/1951 Yes 15 1123 1-500000
EGYPT 12/01/1993 Yes 4 1240 1-500000
KAZAKHSTAN 01/05/1992 Yes 10 3914 1-500000
SWEDEN 13/11/1970 Yes 10 2173 1-500000
DENMARK 13/11/1970 Yes 10 2018 1-500000
JAPAN 08/03/1989 Yes 10 8959 1-500000
LEBANON 16/09/1947 Yes 11 985 1-500000
TUNISIA 07/05/1982 Yes 10 1684 1-500000
MOLDOVA 03/06/1995 Yes 4 664 1-500000
ALBANIA 26/05/2003 Yes 13 765 1-500000
JORDAN 07/05/1948 Yes 11 1188 1-500000
SLOVENIA 03/04/1997 Yes 4 1291 1-500000
UZBEKISTAN 23/06/1994 Yes 10 3344 1-500000
CZECH REPUBLIC 15/04/1996 Yes 0 1511 1-500000
KYRGYZ REPUBLIC 14/10/1994 Yes 0 3737 1-500000
SERBIA AND 16/04/1953 No 11 807 1-500000
43
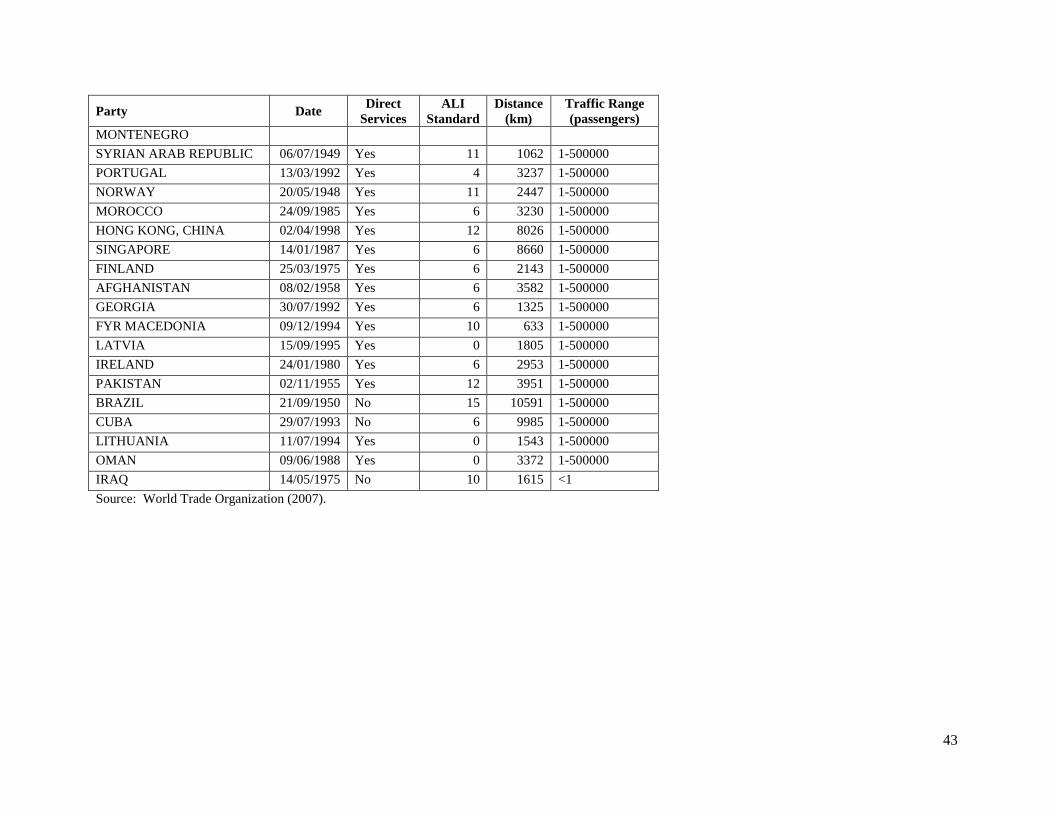
Party Date Direct
Services
ALI
Standard
Distance
(km)
Traffic Range
(passengers)
MONTENEGRO
SYRIAN ARAB REPUBLIC 06/07/1949 Yes 11 1062 1-500000