17
OTC : Open Text Corporation March 13 th , 2016
| Date post: | 17-Feb-2017 |
| Category: |
Documents |
| Upload: | zachary-leranbaum |
| View: | 340 times |
| Download: | 4 times |

OTC : Open Text CorporationMarch 13th, 2016

Disclaimer
The analyses and conclusions of Queen’s Capital contained herein are based on publicly availableinformation. The analyses provided may include certain statements, estimates and projections prepared withrespect to, among other things, the historical and anticipated operating performance of the companies, access tocapital markets and the values of assets and liabilities. Such statements, estimates, and projections reflectvarious assumptions by Queen’s Capital concerning anticipated results that are inherently subject to significanteconomic, competitive, and other uncertainties and contingencies and have been included solely for illustrativepurposes. Actual results may vary materially from the estimates and projected results contained herein.
Queen’s Capital assumes no responsibility or liability for any error, inaccuracy, or omission contained that may bemade of such information by the viewer. No information herein may be replicated without prior consent by theExecutive Board of Queen’s Capital.
www.queenscapital.ca 2

Executive Summary
www.queenscapital.ca 3
Content Slide
Company Overview 4
Industry Outlook 5
Investment Thesis 6-7
Catalysts & Risks 8-9
Valuation 10-13
Appendix 13-16

Company OverviewOperational Overview
• Open Text provides a suite of software products and services that assist organizations in finding, utilizing, and sharing business information from various devices.
• The company offers enterprise content management products that provide content management, records management, archiving, email management solutions, and capture solutions, as well as Core, a software as a service-based, multi-tenant cloud solution
• The company has four main sources of revenue - license, maintenance, services and cloud
Overview
4
Industry Outlook Investment Thesis Catalysts & Risks Valuation Appendix
www.queenscapital.ca
Market Data
Last Price 64.42 Market Cap (mm) 7,758.0
52 wk High/Low 71.92 /47.68 Shares Out. (mm) 121.21
Dividend Yield %
1.6% Float % 98.0%
Beta 5Y 1.02 TEV 8,852.0
TEV / Total Rev 3.8x TEV / EBITDA 13.1x
all numbers in USD

Industry Outlook
Overview
5
Industry Outlook Investment Thesis Catalysts & Risks Valuation Appendix
www.queenscapital.ca
IT Cloud Spending Content Management Software Revenue Growth
• Commoditization of hardware will continue to drive software as the primary differentiator for technology companies in 2016.
• All sections of the cloud -- infrastructure, platform and applications -- should see greater spending as companies move away from a client-server IT architecture.
• Greater demand for connected devices, along with increased cyber attacks, may fuel more security software spending.
• A software vendor's ability to provide advanced analytics may become a key distinguishing factor in the marketplace.
Industry Outlook
Investment Thesis – Market Overreaction to Cloud Transition
6www.queenscapital.ca
Overview Industry Outlook Investment Thesis Catalysts & Risks Valuation Appendix
Summary
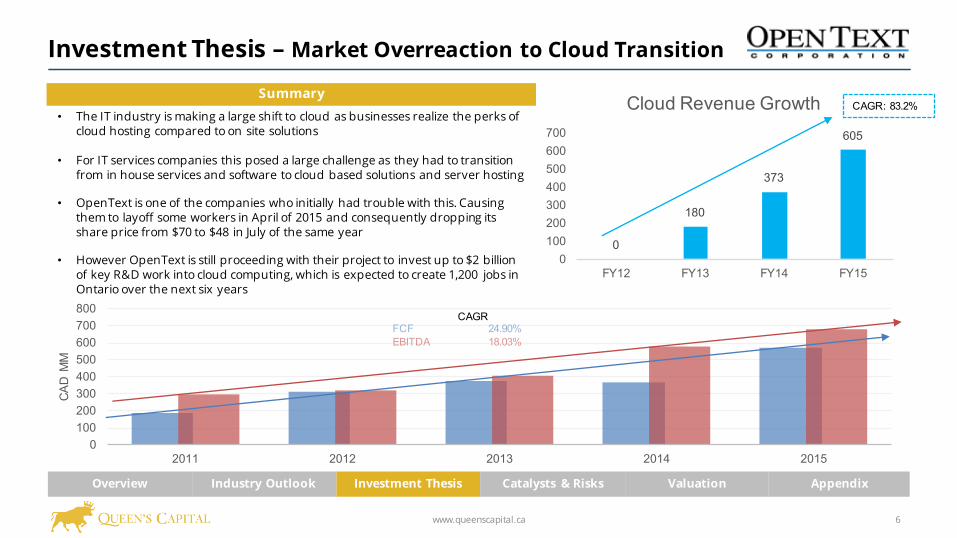
0
180
373
605
0100200300400500600700
FY12 FY13 FY14 FY15
Cloud Revenue Growth CAGR: 83.2%• The IT industry is making a large shift to cloud as businesses realize the perks of
cloud hosting compared to on site solutions
• For IT services companies this posed a large challenge as they had to transition from in house services and software to cloud based solutions and server hosting
• OpenText is one of the companies who initially had trouble with this. Causing them to layoff some workers in April of 2015 and consequently dropping its share price from $70 to $48 in July of the same year
• However OpenText is still proceeding with their project to invest up to $2 billion of key R&D work into cloud computing, which is expected to create 1,200 jobs in Ontario over the next six years
0100200300400500600700800
2011 2012 2013 2014 2015
CAD
MM
CAGRFCF 24.90%EBITDA 18.03%
Investment Thesis A and R&D – Outperforming competitors
7www.queenscapital.ca
Overview Industry Outlook Investment Thesis Catalysts & Risks Valuation Appendix
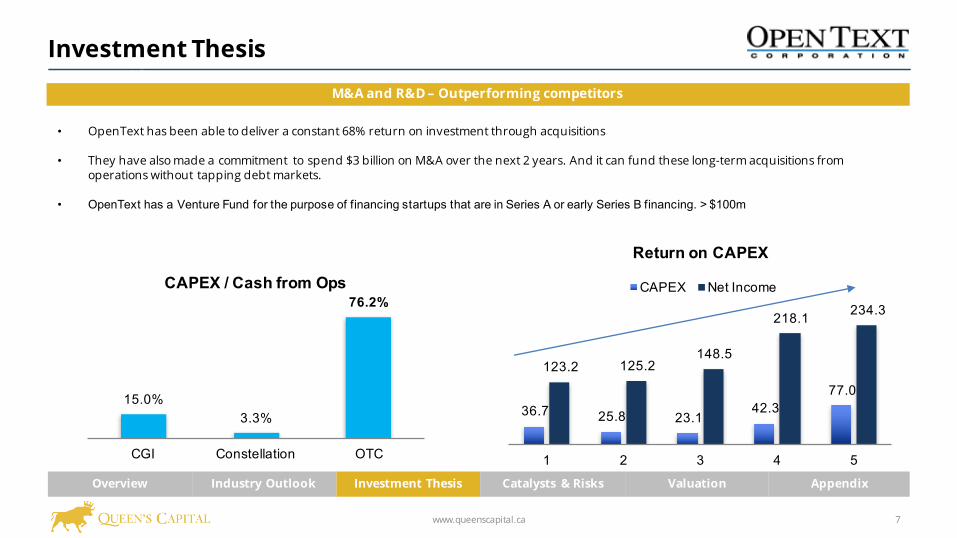
M&A and R&D – Outperforming competitors
36.7 25.8 23.1 42.3
77.0
123.2 125.2 148.5
218.1 234.3
1 2 3 4 5
Return on CAPEX
CAPEX Net Income
• OpenText has been able to deliver a constant 68% return on investment through acquisitions
• They have also made a commitment to spend $3 billion on M&A over the next 2 years. And it can fund these long-term acquisitions from operations without tapping debt markets.
• OpenText has a Venture Fund for the purpose of financing startups that are in Series A or early Series B financing. > $100m
15.0%3.3%
76.2%
CGI Constellation OTC
CAPEX / Cash from Ops

Catalysts
8www.queenscapital.ca
Overview Industry Outlook Investment Thesis Catalysts & Risks Valuation Appendix
Blue Carbon Release
• The current CEO, also serves as the CTO of the company. This speaks to the CEO’s knowledge of his own product outside of just management, but additionally the technology side as well.
• Additionally, management has a strong track record in tech and is expected to continue delivering superior results to shareholders now and in the future.
• Open Text rolled out new versions of its product suites for both on-premises and SaaS users, incorporating new analytics functionality from its purchase of Actuate earlier in the year
• The new products revolve around enterprise information management and is an effort in integrating its products more closely
• This new product suite combines traditional reporting and dash boarding with some of the big data analytics
Strong Management Team Margins
• Margins: Its operating margin has quickly risen over the last year from 27% to 31% and now 37% during this most recent quarter.
• Last year, management guided for operating margins above 34% on a consistent basis, which it has now exceeded

9
Overview Industry Outlook Investment Thesis Catalysts & Risks Valuation Appendix
RisksDependent on Strategic Partners
• A portion of license revenues is derived from the licensing of Open Text’s software products through third parties
• Distributors may also give higher priority to the licensing of software products other than Open Text’s (which could include competitors' products) or may not devote sufficient resources to marketing Open Text’s software products
• Need to continue to develop technologically advanced products that successfully integrate with the software products and enhancements used by their customers
• Often, we must integrate software licensed or acquired from third parties with our proprietary software to create or improve our products. If we are unable to achieve a successful integration with third party software, we may not be successful in developing and marketing our new software products, services, and enhancements
Must Keep up with industry advancements
www.queenscapital.ca

Valuation - Comps
10www.queenscapital.ca
Overview Industry Outlook Investment Thesis Catalysts & Risks Valuation Appendix
Price/ EV/(USD$ millions, except share data)
Equity Value
Enterprise Value
LTM Earnings
FY1 Earnings
FY2 Earnings
LTM Sales
FY1 Sales
FY2 Sales
LTM EBITDA
FY1 EBITDA
FY2 EBITDA
ComparablesCONSTELLATION SOFTWARE INC $ 10,610.18 $ 8,336.49 40.55x 19.25x 16.82x 3.83x 3.83x 3.32x 19.49x 15.42x 13.46xCGI GROUP INC - CLASS A $ 17,946.82 $ 19,571.92 17.80x 16.56x 15.43x 1.67x 1.67x 1.63x 10.13x 9.68x 9.30x
DESCARTES SYSTEMS GRP/THE $ 1,778.87 $ 1,326.20 66.66x 21.09x 18.21x 6.69x 6.69x 6.06x 22.61x 19.05x 16.61x
COGNIZANT TECH SOLUTIONS-A $ 36,090.39 $ 32,428.39 21.40x 17.44x 15.43x 2.59x 2.59x 2.30x 13.31x 11.24x 9.97xCA INC $ 12,811.29 $ 12,422.29 17.89x 12.76x 12.38x 3.20x 3.20x 3.17x 7.90x 7.11x 7.76xSYMANTEC CORP $ 12,131.34 $ 11,602.34 15.46x 15.60x 16.52x 2.93x 2.93x 3.34x 12.87x 7.76x 9.46x
Max $ 36,090.39 $ 32,428.39 66.66x 21.09x 18.21x 6.69x 6.69x 6.06x 22.61x 19.05x 16.61xMin $ 1,778.87 $ 1,326.20 15.46x 12.76x 12.38x 1.67x 1.67x 1.63x 7.90x 7.11x 7.76xMean $ 15,228.15 $ 14,281.27 29.96x 17.12x 15.80x 3.49x 3.49x 3.30x 14.39x 11.71x 11.09x
OPEN TEXT CORP $ 7,803.11 $ 6,843.38 24.01x 13.57x 13.07x 3.26x 3.26x 3.19x 11.67x 9.97x 9.70x

Valuation - DCF
11www.queenscapital.ca
Overview Industry Outlook Investment Thesis Catalysts & Risks Valuation Appendix
Terminal Value Calculation & Implied Target Price
Cumulative PV of UFCF 1600.636833
Terminal Growth Rate 2.00%
2020E Unlevered Free Cash Flow 526.722021E Unlevered Free Cash Flow 537.2496538
2020E PV of Terminal Value 12244.31926
PV of Terminal Value 8984.14
Implied OTC Enterprise Value 10584.78
Add: Cash & Cash Equivalents 726.00Less: Market Value of Total Debt 1576.00Less: Market Value of Total Preferred Equity 0.00Less: Total Minority Interest 0.60
Implied OTC Equity Value 9734.18
Fully Diluted Shares Outstanding 122.01
OTC Target Price Per Share $79.78
DCF Sensitivity Analysis
Perpetuity Growth Rate (%)1.50% 1.75% 2.00% 2.25% 2.50%
WACC (%) 5.89% $42.20 $44.59 $47.52 $50.47 $54.15 6.14% $39.76 $41.84 $44.21 $46.91 $50.03 6.39% $37.58 $39.41 $41.48 $43.82 $46.49 6.64% $35.65 $37.27 $39.09 $41.13 $43.45 6.89% $33.90 $35.35 $36.96 $38.76 $40.78
Multiple Price Target Sensitivity Analysis
2016E EV/Sales Multiple3.50x 4.00x 4.50x 5.00x 5.50x
Sales 2016E
$131.30 $(3.20) $(2.66) $(2.12) $(1.59) $(1.05)$156.30 $(2.48) $(1.84) $(1.20) $(0.56) $0.08 $181.30 $(1.77) $(1.02) $(0.28) $0.46 $1.21 $206.30 $(1.05) $(0.20) $0.64 $1.49 $2.33 $231.30 $(0.33) $0.62 $1.56 $2.51 $3.46

Valuation – WACC and Target Price
12www.queenscapital.ca
Weighted Average Cost of Capital (WACC) BuildupMarket Value of Total Debt 1576.00Market Value of Total Equity 1,853.90
Total Capitalization 3429.9
Weight of Debt 85.01%Weight of Equity 54.05%
Raw Beta (6 Months) 0.471Adjusted Beta (6 Months) 0.647
Risk Free Rate of Return 1.29%Equity Market Risk Premium 6.00%
Cost of Common Equity 5.17400%
Pre-Tax Weighted Average YTM on Outstanding Bonds 5.63%Marginal Tax Rate 24.90%
Cost of Debt 4.22%
Weighted Average Cost of Capital (WACC) 6.39%
Valuation III - Relative Valuation & Target Price
EV/Sales 2016E 3.80xOTC Revenue 2016E 2136.23
OTC Enterprise Value 2016E 8117.69
Add: Cash & Cash Equivalents 726.00Less: Total Debt 1576.00Less: Preferred Equity 0.00Less: Minority Interest 0.60
INGN Equity Value 2016E 7267.69Fully Diluted Shares Outstanding 122.01
OTC Price Target (Multiples) $59.57
OTC Price Target (DCF) $79.78
OTC Price Target (70% DCF, 30% Multiples) $73.72
Current Share Price $64.52 Current Dividend Yield 1.66%
Implied 1 Year Equity Upside 15.92%
Overview Industry Outlook Investment Thesis Catalysts & Risks Valuation Appendix

Appendix
13www.queenscapital.ca
Overview Industry Outlook Investment Thesis Catalysts & Risks Valuation Appendix
Historical Forecast PeriodUnlevered Free Cash Flow Projections 2012A 2013A 2014A 2015A 2016E 2017E 2018E 2019E 2020E 2021ERevenue 1207.5 1363.3 1624.7 1851.9 2136.2 2464.2 2842.6 3279.0 3782.5 4363.2
Growth Rate N/A 12.9% 19.2% 14.0% 15.4% 15.4% 13.6% 12.1% 11.1% 10.6%
Annual Increase In Growth Rate 1.4% 0.0% -1.8% -1.5% -1.0% -0.5%
Gross Profit 874.0 971.0 1182.9 1331.1 1494.9 1776.1 2048.8 2363.3 2726.2 3144.8
% margin 72.4% 71.2% 72.8% 71.9% 70.0% 72.1% 72.1% 72.1% 72.1% 72.1%
Annual Increase in Gross Profit Margin N/A -1.2% 1.6% -0.9% -1.9% -2.7% 0.5% 0.5% 0.0% 0.0%
Operating Expenses 700.1 749.3 851.1 969.6 1162.6 1341.1 1547.0 1784.5 2058.5 2374.6
% of sales 58.0% 55.0% 52.4% 52.4% 54.4% 54.4% 54.4% 54.4% 54.4% 54.4%
Annual Increase in Operating Expenses % of Sales N/A 2.1% 0.0% -1.2% -1.0% -1.0% -1.0%
EBIT 173.9 221.7 331.8 361.5 332.3 435.0 501.8 578.8 667.7 770.2
% margin 14.4% 16.3% 20.4% 19.5% 15.6% 17.7% 17.7% 17.7% 17.7% 17.7%
Marginal Corporate Tax Rate 24.9% 24.9% 24.9% 24.9% 24.9% 24.9% 24.9% 24.9% 24.9% 24.9%Provis ion for Normalized Income Taxes 43.3 55.2 82.6 90.0 82.7 108.3 124.9 144.1 166.3 191.8Earnings Before Interest After Taxes (EBIAT) 130.6 166.5 249.2 271.5 249.6 326.7 376.8 434.7 501.4 578.4
Add: Depreciation & Amortization 21.6 24.5 35.2 50.9 33.1 49.5 57.1 65.9 76.0 87.7% revenue 1.8% 1.8% 2.2% 2.7% 1.5% 2.0% 2.0% 2.0% 2.0% 2.0%Annual Increase in D&A % of Revenues
Less: Capital Expenditures (25.8) (23.1) (42.3) (77.0) (42.1) (65.3) (75.3) (86.8) (100.2) (115.5)% revenue 2.1% 1.7% 2.6% 4.2% 2.0% 2.6% 2.6% 2.6% 2.6% 2.6%Annual Increase in Capex % of Revenue
Less: Increase in Net Working Capital (35.5) (25.2) 38.7 (37.5) (14.9) (17.2) (15.5) (17.9) (20.7) (23.9)% revenue 0.0% 1.8% -2.4% 2.0% 0.7% 0.7% 0.5% 0.5% 0.5% 0.5%Annual Increase in NWC % of Revenue
Unlevered Free Cash Flow 161.9 193.1 203.5 282.9 225.71 293.8 343.1 395.8 456.6 526.7Unlevered Free Cash Flow for Remaining Quarters: 225.7 293.8 343.1 395.8 456.6 526.7
Discount Period 0.5 1.5 2.5 3.5 4.5 5.5PV of Unlevered Free Cash Flow 218.8 267.7 293.9 318.7 345.6 374.7

Appendix
14www.queenscapital.ca
Overview Industry Outlook Investment Thesis Catalysts & Risks Valuation Appendix

Appendix
15www.queenscapital.ca
Overview Industry Outlook Investment Thesis Catalysts & Risks Valuation Appendix

Appendix
16www.queenscapital.ca
Overview Industry Outlook Investment Thesis Catalysts & Risks Valuation Appendix

Thank You
17
Zachary Leranbaum
Senior Analyst – Queen’s Capital
Calum Bruton
Analyst – Queen’s Capital
www.queenscapital.ca
Anish Sharma
Portfolio Manager – Queen’s Capital


