70
OPeNDAP Matlab Interface Handbook Version 1.15 Tom Sgouros December 21, 2004
OPeNDAP Matlab Interface HandbookVersion 1.15
Tom Sgouros
December 21, 2004

ii
Preface
This document describes version 6.0 of the Open Source Project for a DataAccess Protocol (OPeNDAP) Matlab Graphical User Interface (GUI), a systemintended to allow researchers transparent access to earth science data—stored inany of several different file formats—across the Internet. The OPeNDAP MatlabGUI was originated by Deirdre Byrne and Peter Cornillon.
This document is relevant to the following software versions:
OPeNDAP Matlab GUI 6.0OPeNDAP data access protocol 2.0loaddods (Matlab command-line client) 3.4.5loaddap (enhanced Matlab command-line client) 3.4.4
We are interested in feedback and bug reports about the OPeNDAP Matlab GUIPlease send them to: [email protected].
Using the OPeNDAP Matlab GUI, a researcher can browse and retrieve earthscience data from many different sources, importing it directly into Matlab, whereit is available for display or for further manipulation. The OPeNDAP Matlab GUIprovides a graphical environment within which a researcher can browse manydatasets to find appropriate data, can select or subsample that data, and candisplay it as well, all by using a simple point-and-click user interface.
An overview of the system’s use is presented, and specific tasks illustrated, fordata providers as well as for users.
This document also covers the Open Source Project for a Data Access ProtocolMatlab command-line clients, with which a researcher can download data directlyinto Matlab, for further analysis. The OPeNDAP Matlab GUI provides a graphicalfront-end to such a client, but you can use them directly as well, which can be ofuse in automating data analysis, for example.
iv Preface
0.1 Tasks Illustrated in this Guide
For a quick start to getting, installing, and using OPeNDAP Matlab GUI software,see the list below of tasks described in this document.
➼ Quick start. (page 2) (You may also appreciate OPeNDAP Quick StartGuidefor a quick overview of the Open Source Project for a Data AccessProtocol.)
➼ Getting and installing the OPeNDAP Matlab GUI software. (page 53)
➼ Installing the rest of the OPeNDAP software. (page 53)
➼ Updating the dataset list to include the most recent versions of all thedatasets. (page 15)
➼ Reading your own datasets into the browser. (page 35)
➼ Using OPeNDAP from the Matlab command line. (page 10)
0.2 Who is this Guide for?
This guide is for people who wish to use Matlab to browse and retrieve data fromexisting on-line OPeNDAP datasets. Scientists who wish to share their data withcolleagues may also find this a useful system, since it is a relatively simple matterto set up a server that can allow remote access to your data.
This documentation assumes that the readers are familiar with computers and theinternet, but are not necessarily programmers. More than a passing familiaritywith Matlab will be useful, as will an understanding of elementary internetconcepts, such as URLs and http.
0.3 Organization of this Document v
0.3 Organization of this Document
This book contains both introductory and reference material. There is also adescription of the installation procedure.
Chapter 1 provides an overview of the entire system, including an introductionto its use, and some tutorial-style examples.
Chapter 2 Provides a reference to the menus and operations used in theOPeNDAP Matlab GUI.
Chapter 3 Describes how to add your own datasets to the OPeNDAP MatlabGUI.
Appendix A on page 53 Contains the instructions for installing the OPeNDAPMatlab GUI, and the related OPeNDAP software you may require.
0.4 Conventions
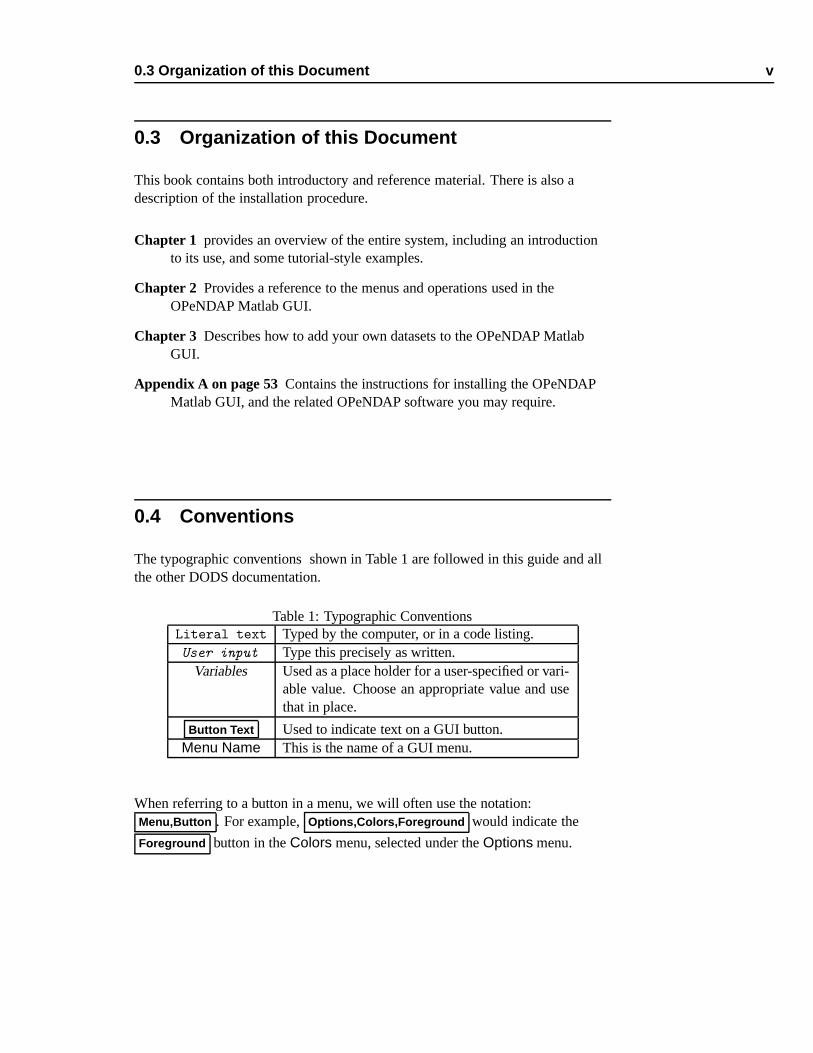
The typographic conventions shown in Table 1 are followed in this guide and allthe other DODS documentation.
Table 1: Typographic ConventionsLiteral text Typed by the computer, or in a code listing.User input Type this precisely as written.
Variables Used as a place holder for a user-specified or vari-able value. Choose an appropriate value and usethat in place.
Button Text Used to indicate text on a GUI button.Menu Name This is the name of a GUI menu.
When referring to a button in a menu, we will often use the notation:Menu,Button . For example, Options,Colors,Foreground would indicate the
Foreground button in the Colors menu, selected under the Options menu.

vi Preface
Contents
Preface iii0.1 Tasks Illustrated in this Guide . . . . . . . . . . . . . . . . . . iv0.2 Who is this Guide for? . . . . . . . . . . . . . . . . . . . . . . iv0.3 Organization of this Document . . . . . . . . . . . . . . . . . v0.4 Conventions . . . . . . . . . . . . . . . . . . . . . . . . . . . . v
1 The OPeNDAP Matlab Graphical User Interface 11.1 Quick Start . . . . . . . . . . . . . . . . . . . . . . . . . . . . 21.2 What is the OPeNDAP Matlab GUI? . . . . . . . . . . . . . . 3
1.2.1 Setting up a data request . . . . . . . . . . . . . . . . 31.2.2 Querying a Dataset . . . . . . . . . . . . . . . . . . . 41.2.3 Issuing a Data Request . . . . . . . . . . . . . . . . . 51.2.4 Displaying the Data . . . . . . . . . . . . . . . . . . . 6
1.3 Example Sessions . . . . . . . . . . . . . . . . . . . . . . . . 81.3.1 Drawing a Simple Picture . . . . . . . . . . . . . . . . 81.3.2 Creating a Time Series . . . . . . . . . . . . . . . . . 12
1.4 Updating the Dataset List . . . . . . . . . . . . . . . . . . . . 151.5 Editing Bookmarks . . . . . . . . . . . . . . . . . . . . . . . . 16
2 The DODS GUI Menu Reference 192.1 The Buttons . . . . . . . . . . . . . . . . . . . . . . . . . . . . 192.2 The Menus . . . . . . . . . . . . . . . . . . . . . . . . . . . . 21
2.2.1 Data . . . . . . . . . . . . . . . . . . . . . . . . . . . . 212.2.2 Resolution . . . . . . . . . . . . . . . . . . . . . . . . 232.2.3 Display . . . . . . . . . . . . . . . . . . . . . . . . . . 242.2.4 Preferences . . . . . . . . . . . . . . . . . . . . . . . . 252.2.5 DODS Help . . . . . . . . . . . . . . . . . . . . . . . . 292.2.6 Display Data . . . . . . . . . . . . . . . . . . . . . . . 302.2.7 Bookmarks . . . . . . . . . . . . . . . . . . . . . . . . 30
2.3 Browser Preferences . . . . . . . . . . . . . . . . . . . . . . . 32
viii Contents
3 Adding Your Own Datasets to the OPeNDAP Matlab GUI 353.1 The Archive File . . . . . . . . . . . . . . . . . . . . . . . . . 36
3.1.1 An example . . . . . . . . . . . . . . . . . . . . . . . . 363.1.2 Getrectg function variables . . . . . . . . . . . . . . . 383.1.3 Another example . . . . . . . . . . . . . . . . . . . . . 40
3.2 The “Get” Function . . . . . . . . . . . . . . . . . . . . . . . . 423.2.1 getxxx Function Modes . . . . . . . . . . . . . . . . . 433.2.2 getxxx Function Tools . . . . . . . . . . . . . . . . . . 47
3.3 Adding a New Dataset . . . . . . . . . . . . . . . . . . . . . . 51
A Getting Started with the OPeNDAP Matlab GUI Software 53A.1 Getting the OPeNDAP Matlab GUI Software . . . . . . . . . . 54A.2 Unpacking the OPeNDAP Matlab GUI Software . . . . . . . . 54A.3 Installing the OPeNDAP Matlab GUI Software . . . . . . . . . 55A.4 The Archive Files . . . . . . . . . . . . . . . . . . . . . . . . . 56
List of Figures
1.1 The OPeNDAP Matlab GUI Main Window . . . . . . . . . . . 31.2 The OPeNDAP Matlab GUI Main Window . . . . . . . . . . . 41.3 Data returned to Matlab . . . . . . . . . . . . . . . . . . . . . 51.4 The Display Dialog . . . . . . . . . . . . . . . . . . . . . . . . 71.5 The Display Dialog, Contour plotting . . . . . . . . . . . . . . 81.6 The Bookmarks Menu . . . . . . . . . . . . . . . . . . . . . . 91.7 The “Display Data” menu . . . . . . . . . . . . . . . . . . . . 111.8 The Variables Menu . . . . . . . . . . . . . . . . . . . . . . . 131.9 GUI Server Dialog . . . . . . . . . . . . . . . . . . . . . . . . 151.10 Update Datasets Dialog . . . . . . . . . . . . . . . . . . . . . 161.11 Bookmark Editor Window . . . . . . . . . . . . . . . . . . . . 171.12 Bookmark Properties Window . . . . . . . . . . . . . . . . . . 171.13 Adding Bookmarks . . . . . . . . . . . . . . . . . . . . . . . . 18
2.1 The GUI Menubar . . . . . . . . . . . . . . . . . . . . . . . . 212.2 The Data Menu . . . . . . . . . . . . . . . . . . . . . . . . . . 222.3 The (Text) Search Dialog Menu . . . . . . . . . . . . . . . . . 232.4 The Resolution Menu . . . . . . . . . . . . . . . . . . . . . . 242.5 Display Menu . . . . . . . . . . . . . . . . . . . . . . . . . . . 242.6 Preferences Menu . . . . . . . . . . . . . . . . . . . . . . . . 252.7 The Data Threshold Dialog . . . . . . . . . . . . . . . . . . . 262.8 Color Menu . . . . . . . . . . . . . . . . . . . . . . . . . . . . 272.9 Color Palette Dialog . . . . . . . . . . . . . . . . . . . . . . . 272.10 Bookmarks File Menu . . . . . . . . . . . . . . . . . . . . . . 312.11 Bookmarks Edit Menu . . . . . . . . . . . . . . . . . . . . . . 31
Contents ix
List of Tables
1 Typographic Conventions . . . . . . . . . . . . . . . . . . . . v

1The OPeNDAP Matlab Graphical User
InterfaceThe OPeNDAP Matlab GUI combines OPeNDAP, a powerful data accessprotocol, with a convenient set of display functions, and the flexibility and powerof the Matlab mathematics programming environment. The effect of theOPeNDAP Matlab GUI is to turn Matlab into a powerful network browser,capable of reading specialized data messages from the Internet. For this reason,we often refer to it as an Open Source Project for a Data Access Protocol“browser.”
This chapter contains an overview of the browser, which will be useful for mostbrowser users. It starts in Section 1.2 on page 3.
2 The OPeNDAP Matlab Graphical User Interface
1.1 Quick Start
If you are already somewhat familiar with Matlab and OPeNDAP, you may find itsimplest to jump right in. (You might want to consult OPeNDAP Quick StartGuide before this book, for a brief description of how OPeNDAP works.) Afterthe OPeNDAP Matlab GUI has been installed, and the necessary environmentSome find it easiest to
jump right in. variables set (See Appendix A on page 53), run Matlab.
$ matlab
When Matlab has started up, start the browser by typing:
>> browse
Three windows will pop up. One big one, for selecting geographic regions inwhich to search for data, and for displaying it, and two smaller ones. One of theseis for selecting datasets to browe or display, and one for selecting the variablesyou want to display.
Use the mouse to select a dataset to look at. (Click once to selet a dataset. Clicktwice to open a dataset folder.) You’ll see that the lists of available variableschanges to list only those variables in that dataset. Move to the Variable window,and choose a variable from the list presented. Now, switch to the big main windowand use the Set Data Range button to outline a geographic rectangle and a time
and depth range to look at. Click Get Details to get an indication about where thedata is, and some information you can use to estimate the size of the dataset you’rerequesting. Click Get Data , and follow the directions, and you should soon see amap of your data in the display window. The browser imports data in a consistentset of units, so that data from any source in the list will appear in the same units.
Subsequent requests for data will not overwrite the original ones. Each set ofdownloaded data is stored with a unique Matlabvariable name, so that manyrequests can be made in each Matlabsession.
You can also begin by setting a data range to specify a time period or geographicarea of interest, and then selecting a dataset and variable, or the other way around.All of these parameters must be set before making a data request, but they can beset in any order.
You will find a useful reference to the OPeNDAP Matlab GUI buttons and menusin Chapter 2.
1.2 What is the OPeNDAP Matlab GUI? 3
1.2 What is the OPeNDAP Matlab GUI?
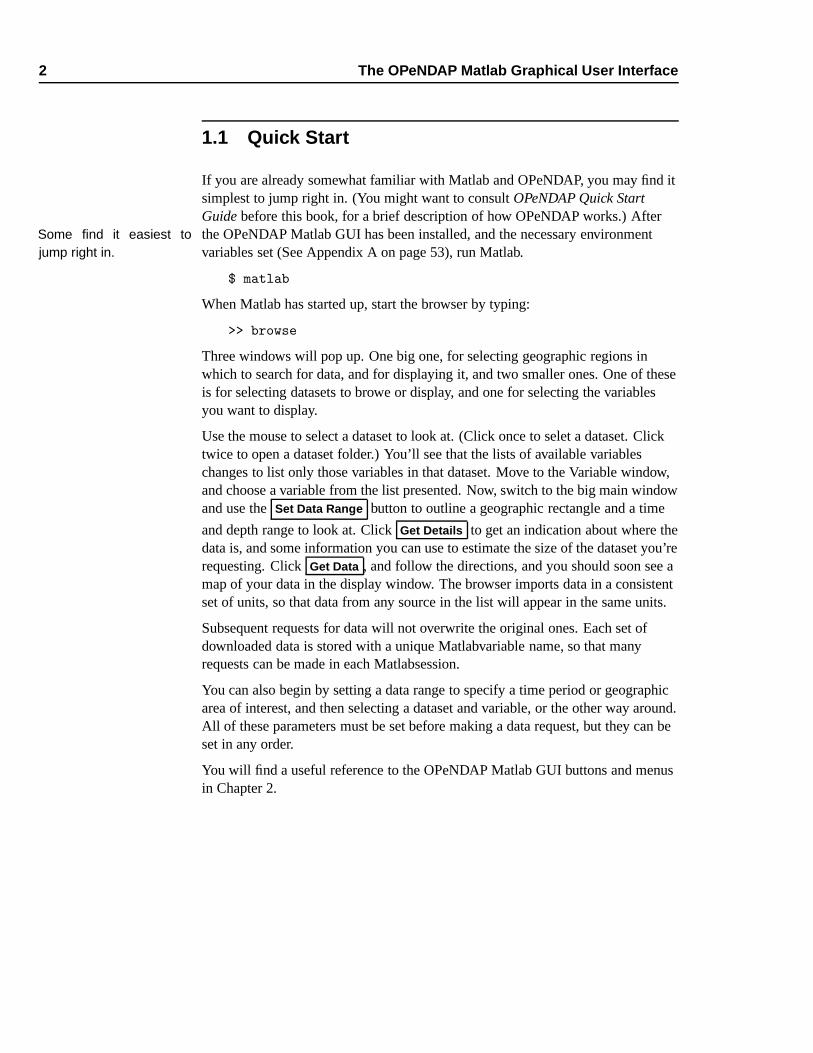
The OPeNDAP Matlab GUI display consists of a map, a timeline, a depth range, asmall array of pushbuttons, and several drop-down menus (Figure 1.1).
You can use the OPeNDAP Matlab GUI for four distinct operations: setting theparameters of a request for data, querying a dataset about its contents, issuing arequest for data, and displaying the results of a request.
Figure 1.1: The OPeNDAP Matlab GUI Main Window
You can also see a text version of the window, by clicking on the View Text
button. Return to the graphical view by clicking View Plots .
1.2.1 Setting up a data request
To set up a data request, you must select the variable and dataset you wish toexamine. Select these from the variable and dataset lists that appear when youstart the browser. If you’ve closed those windows, you can recall them with theData,Show Data Bookmarks button. Choose the dataset and
variable you want to see.The Variable and Dataset menus depend on each other. Once you’ve selectedsomething from one menu, the other menu changes to display the corresponding
4 The OPeNDAP Matlab Graphical User Interface
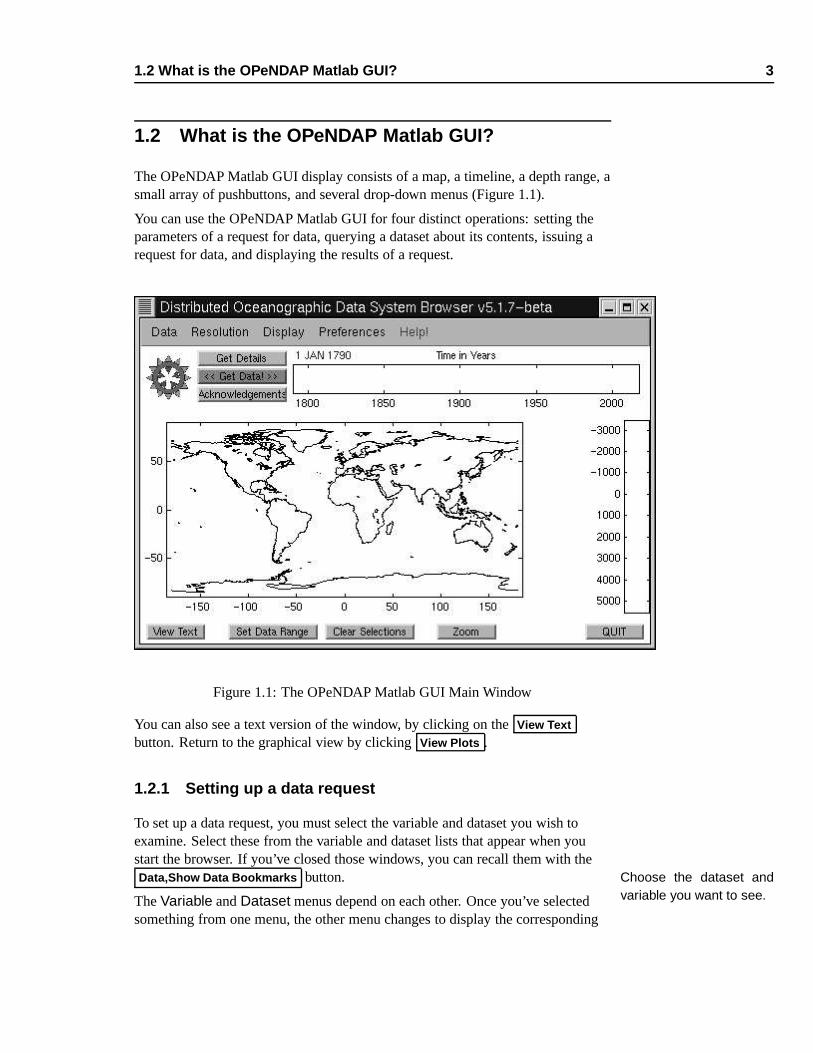
Figure 1.2: The OPeNDAP Matlab GUI Main Window
entries. For example, if you are interested in temperatures, you can select it in theVariables menu. After this, the datasets that contain temperature data will behighlighted (displayed with bold font) in the Bookmarks menu. Once these havebeen selected, the spatial and time ranges of the selected dataset are indicated onthe display map. You can use the Zoom button to examine any of the datadisplays more closely.
You can also begin your data selection by selecting the region, time, or depth youwish to examine. The Datasets and Variable menus will be updated to showonly datasets that contain data in those regions.
The OPeNDAP Matlab GUI uses locally-cached archives of “metadata” todescribe datasets which may be stored on any machine connected to the Internet.This allows the OPeNDAP Matlab GUI to download its data in a consistent set ofunits, allowing comparisons among datasets. You can use theData,Update Bookmarks button to update the local archives with any new
datasets or changes in existing datasets.
1.2.2 Querying a Dataset
After a dataset, variable, and region (space and time) are chosen, you can find outroughly how much data (and what kind) you have selected with the Get Details
button. Clicking this will send a query to the dataset to find out how much of it fits
1.2 What is the OPeNDAP Matlab GUI? 5
your chosen ranges; for example, how many images fall within your time range,or how many XBT casts fall within your geographic selection box.
For gridded data, the Get Details button will display a star in the Time windowfor each grid available. That is, if you are looking at a dataset consisting of aseries of complete grids, one per day, you will see a star drawn for each day in therequested time range. If you’re looking at a dataset containing non-gridded data,you’ll see stars in the geographic and depth windows, too.
1.2.3 Issuing a Data Request
Once the parameters of a data request have been specified, you can issue therequest by clicking the Get Data button.
Sometimes, inadvertently or not, you ask for a lot of data. The browser has a datasize threshold you can set to notify you when you make a request like this. Thedata source you’ve selected may give the browser an estimate of how much data ison the way, and the browser will ask you for confirmation in the event that theestimated size of the data requested takes up more memory than the data sizethreshold specified in the Preferences,Get Data Threshold popup menu.
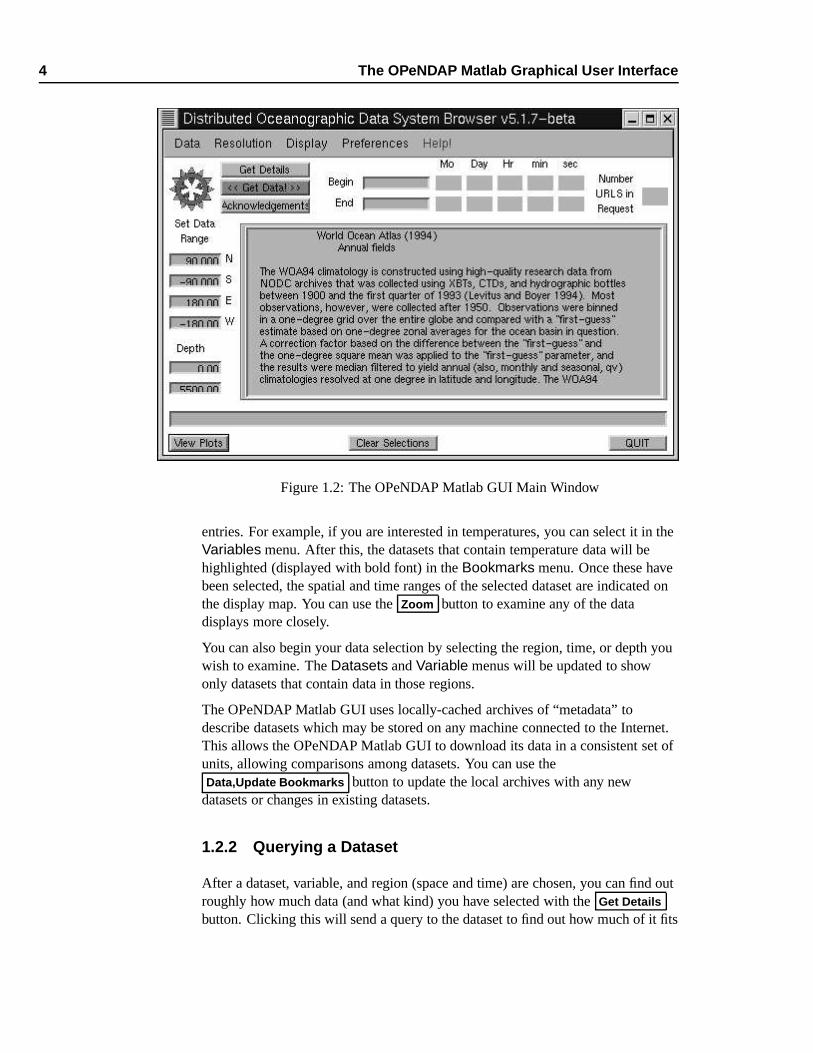
If you approve the request (or if you weren’t asked), the requested data areretrieved, loaded into Matlab, and displayed according to the directions (you willbe asked for these directions, see section 1.2.4). The browser displays a messagetelling you what has been loaded into Matlab (figure 1.3).
Figure 1.3: Data returned to Matlab
Note that along with the data you requested, the URL that pointed to that data, aswell as the text of any credits that apply to the data are also returned. To duplicate The request returns the
URL, which you can uselater.
the request just made, say in some later session, you could issue the followingcommand:
6 The OPeNDAP Matlab Graphical User Interface
>> loaddods(R1_URL)
(This assumes that R1 URL has not changed. Since the browser is likely to re-usethat name in future sessions, it is good practice to save it in a different name if youthink you might request that data again.)
Of course, once the data are incorporated into Matlab variables, the entire powerof the Matlab analysis package is available. For many users, this is the real goal.Other users may find the data display functions of the OPeNDAP Matlab GUIvaluable.
1.2.4 Displaying the Data
Each time you use the browser to request data, it will ask how the data are to bedisplayed. The first thing that happens is that the browser makes a guess as the X,Y, and Z coordinates you want to display. It confirms the guess by presenting adialog to you like the one in figure 1.4. Using this dialog, you can select the threeChoose the display axes.coordinates to be displayed from among all the variables returned by the datarequest.
Using this Display dialog, you can modify your earlier choices, and you can alsoselect the type of display you want (color image, contour plot, quiver plot, and soon), and further select the returned data.
You can call this dialog up with the Data, Plot acquired Rxx button.
In some circumstances, the Z data might be returned as a three-dimensional array.To display it, the array must be subsampled. You can do this by typing a Matlabexpression right into the Z-data text box. For some datasets, the Matlab matrixtransposition operator (’) is important to use here. Others might require a matrixsampling.You can use the Display
Dialog to subsample ormodify data arrays.
The dialog contains the following fields to modify:
Plot Number This is the number of the plot, assigned and incremented by thebrowser.
Acquisition Number Requests for OPeNDAP data are numbered within aMatlab session. Names of data variables from the first request are prefixedwith R1 . The second request makes variables with R2 , and so on. Thiskeeps data from being overwritten as requests are made after other requests.
Plot Type A list of available plot types. These are standard Matlab types.
Plot Data Depending on the plot type selected, the display dialog will present anassortment of selection lists to set plot parameters.
Display Window A selection list is presented to allow you to specify whether theplotting should be done in a new window, in the existing browser window,or in a window to be specified.
1.2 What is the OPeNDAP Matlab GUI? 7
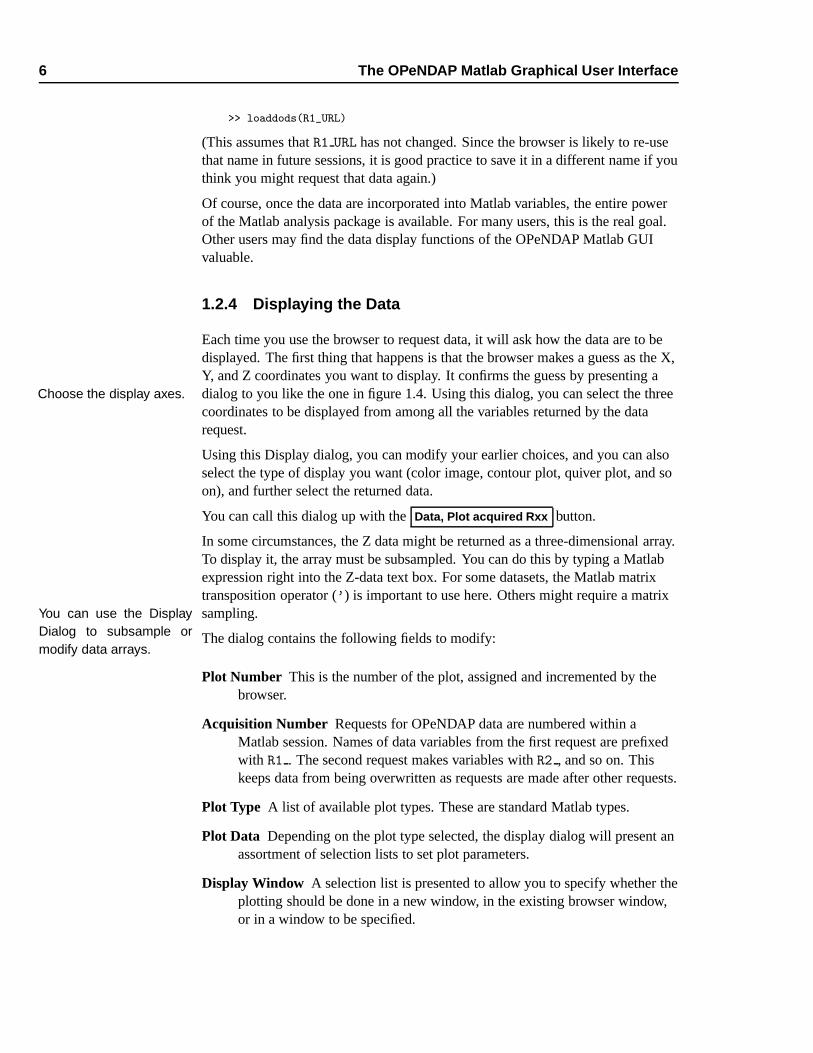
Figure 1.4: The Display Dialog
X-data, Y-data, Z-data, V-data The data to be plotted must be specified in thesefields. If any of these arrays must be trimmed, processed, transposed, orsampled, you can enter valid Matlab expressions to do so in the text boxes.For example, if you have an array that needs transposing, you can type theMatlab array inversion operator (’) after the array name.
At the bottom of the display dialog, there are four buttons. Use the Cancel buttonif you’ve thought better of the whole thing, and wish to make another datarequest. The data will still be available inside Matlab, but the browser will skipplotting it. The Plot Selected button will plot the data selected in the dialog. Ifyou want to plot several layers at once, use Plot All , and all the data will beplotted at once. A Next Plot button will appear on the browser window to allowyou to flip through the plots.
The Overplot button is a toggle button. When it’s activated, the browser will notclear the previous plot when drawing a new one. Click it to activate, and click it
8 The OPeNDAP Matlab Graphical User Interface
again to de-activate this mode.
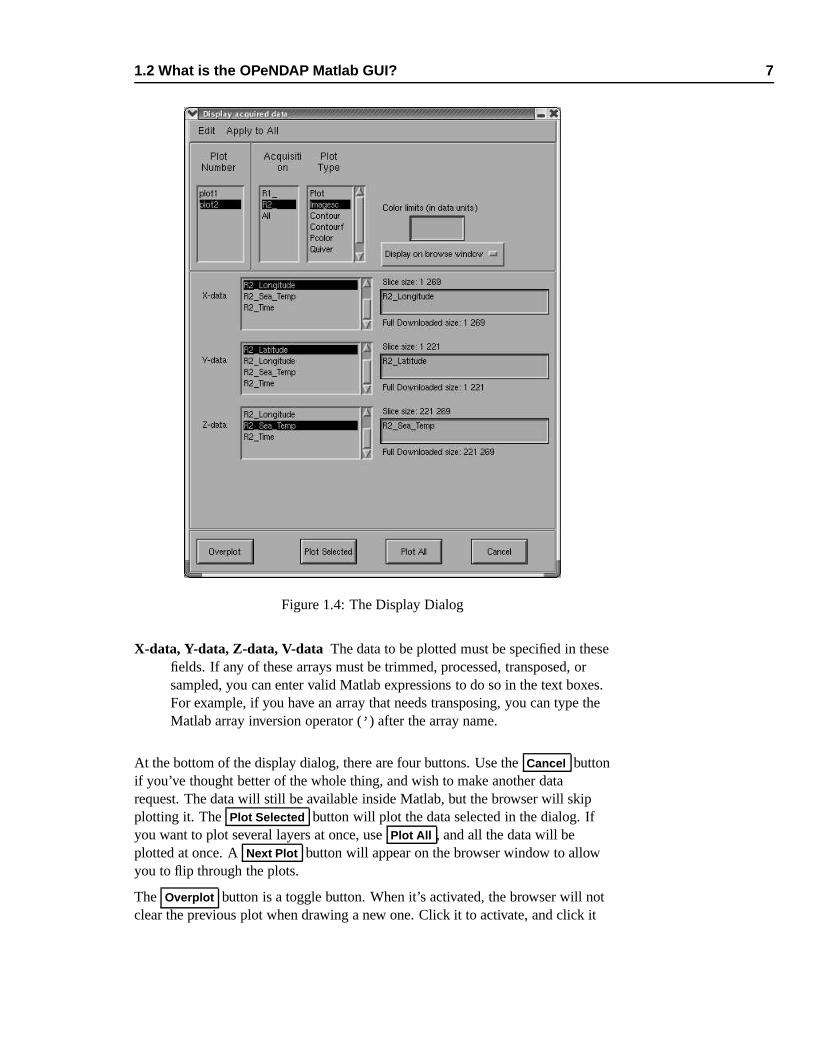
Figure 1.5: The Display Dialog, Contour plotting
Several of the plotting modes require different settings. When you select the plotmode, drop-down lists and dialogs will appear to allow these settings. Seefigure 1.5 for an example.
1.3 Example Sessions
The simplest way to begin to use the OPeNDAP Matlab GUI is to follow alongwith a simple session. Two examples follow: the first uses the OPeNDAP MatlabGUI window to display data, and the second uses the browser only as amechanism to retrieve data, which is then examined with some other Matlabfunctions.
1.3.1 Drawing a Simple PictureSelect the dataset and thevariable. Start Matlab, and start up the browser. (See page 2).
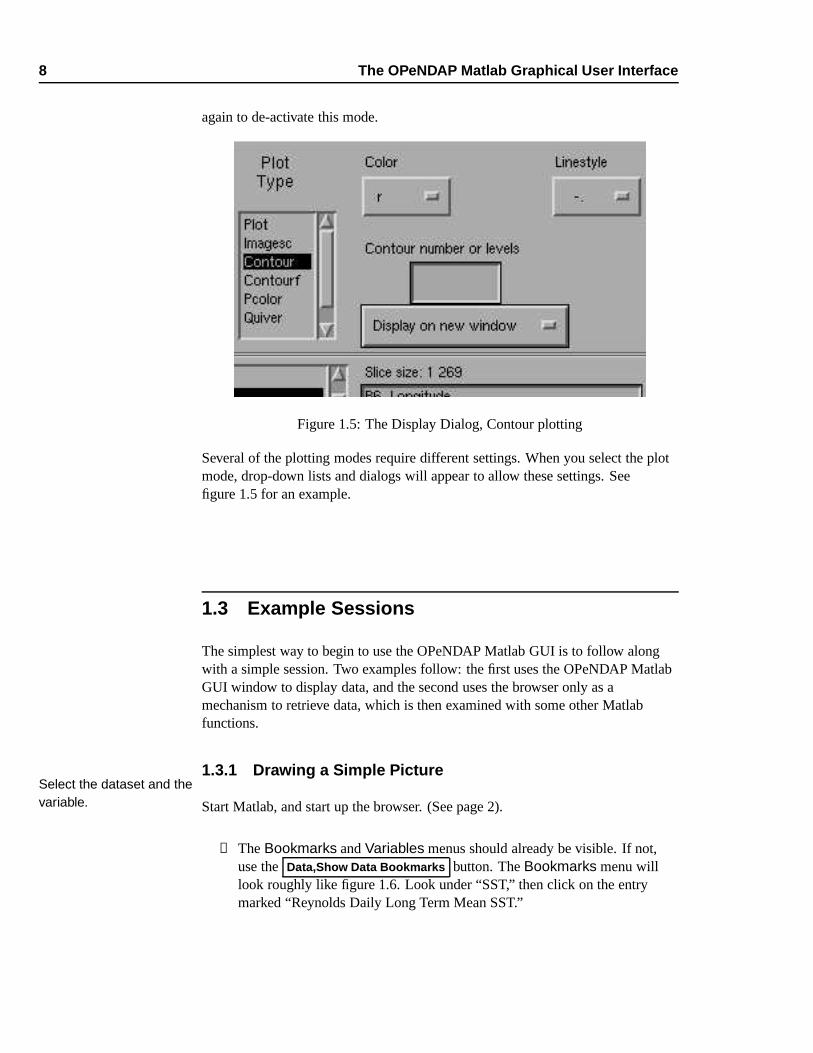
❶ The Bookmarks and Variables menus should already be visible. If not,use the Data,Show Data Bookmarks button. The Bookmarks menu willlook roughly like figure 1.6. Look under “SST,” then click on the entrymarked “Reynolds Daily Long Term Mean SST.”

1.3 Example Sessions 9
NOTE: When you click on this dataset, you’ll see a little messagecome up labeled “Policy.” This describe where you candownload this data yourself. Data providers often requiremessages like this when programs like the OPeNDAP MatlabGUI incorporate their data.
Figure 1.6: The Bookmarks Menu
This dataset contains sea surface temperatures for the entire globe, in onedegree squares, for each day since about 1800. You will see a rectangle inthe main window outlining the entire globe. The time window contains asmall line starting around 1800, and moving forward. Zoom in to select the time.
❷ Click the Zoom button, and click the left mouse button near the Reynoldstime line a few times, until the time is measured in days or months. (If youfind the default colors hard to see, click on the Preferences,Colors button
to adjust them to your liking. Use the Preferences,Save Preferences buttonto save your colors for the next time.) The left mouse button zooms in, andthe right button zooms out. You can also select a small range by clickingand dragging, and that range will be mapped over the timeline.
❸ Click on Set Data Range , and select a time range by clicking and draggingin the time window (be patient). Remember that this dataset has a globalgrid recorded every day. Be careful not to select more than you’r willing towait for.
10 The OPeNDAP Matlab Graphical User Interface
While you are selecting the range, you might notice the Datasets orVariables menus changing. These menus are dynamically loaded with allthe datasets and variables that might overlap the data range you select.However, the changes will not affect your selection.
NOTE: If you select a date or geographic range not covered by thedataset you’ve selected, the browser will unselect it. Messagesfor such events are printed in the main Matlab window.
Select the geographicrange.
❹ Now select a geographic range by clicking and dragging in the mainwindow. By default, the whole world is selected, so if you skip this step,you will still get data. When selecting a time range, remember that thisdataset is made up of weekly means, so be careful you don’t ask for toomuch.
❺ Click the Get Details button. This will put a star at each point on the timeline where data is available. You may see that you’ve selected 29 points,which could bring a lot of data back. You can refine your selection at thispoint to select the few data points of interest.
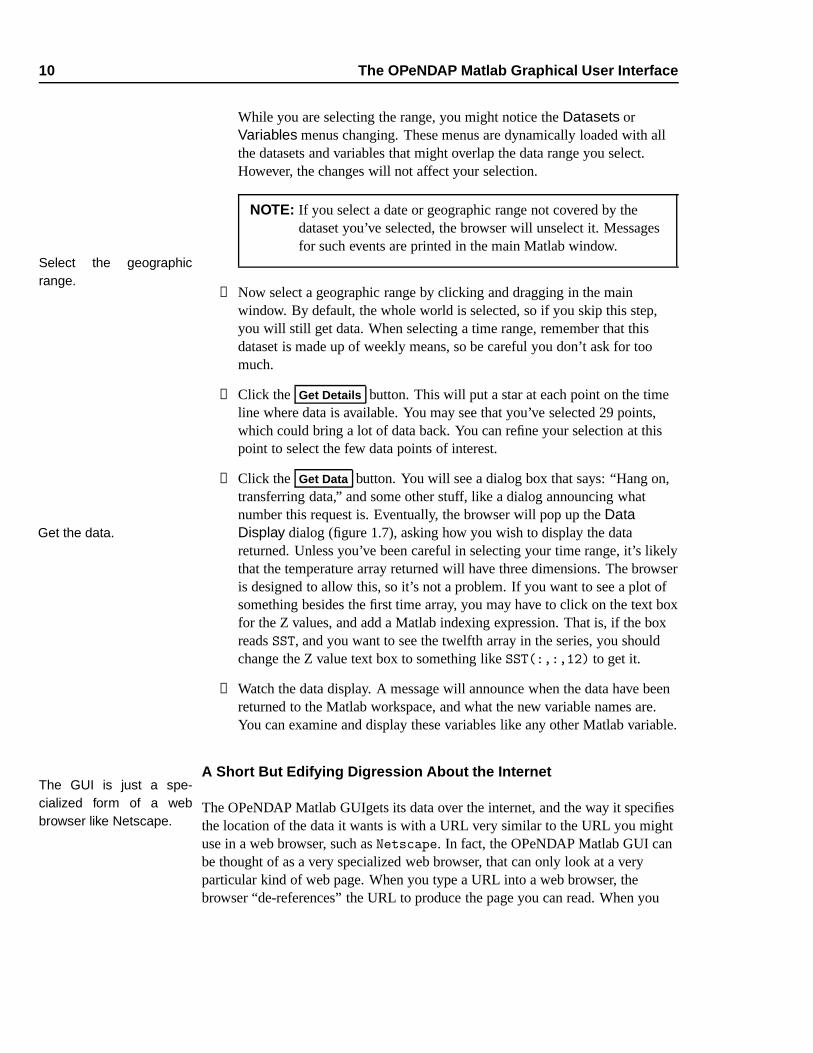
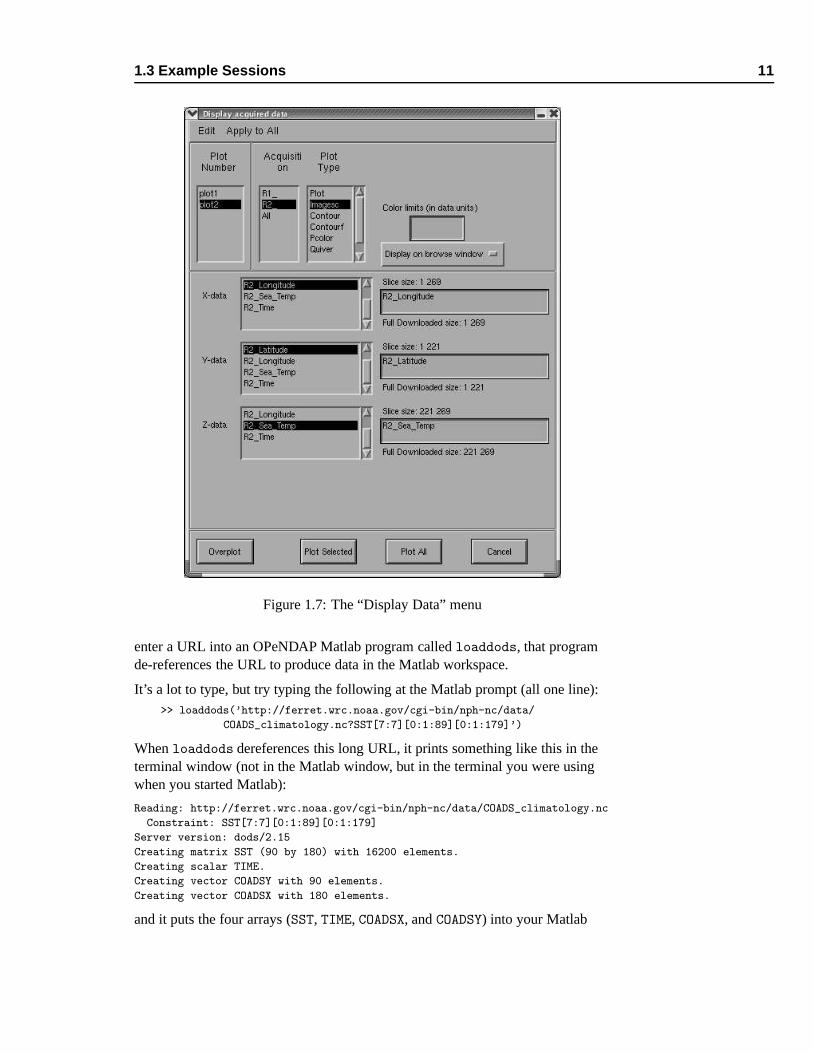
❻ Click the Get Data button. You will see a dialog box that says: “Hang on,transferring data,” and some other stuff, like a dialog announcing whatnumber this request is. Eventually, the browser will pop up the DataDisplay dialog (figure 1.7), asking how you wish to display the dataGet the data.returned. Unless you’ve been careful in selecting your time range, it’s likelythat the temperature array returned will have three dimensions. The browseris designed to allow this, so it’s not a problem. If you want to see a plot ofsomething besides the first time array, you may have to click on the text boxfor the Z values, and add a Matlab indexing expression. That is, if the boxreads SST, and you want to see the twelfth array in the series, you shouldchange the Z value text box to something like SST(:,:,12) to get it.
❼ Watch the data display. A message will announce when the data have beenreturned to the Matlab workspace, and what the new variable names are.You can examine and display these variables like any other Matlab variable.
A Short But Edifying Digression About the InternetThe GUI is just a spe-cialized form of a webbrowser like Netscape.
The OPeNDAP Matlab GUIgets its data over the internet, and the way it specifiesthe location of the data it wants is with a URL very similar to the URL you mightuse in a web browser, such as Netscape. In fact, the OPeNDAP Matlab GUI canbe thought of as a very specialized web browser, that can only look at a veryparticular kind of web page. When you type a URL into a web browser, thebrowser “de-references” the URL to produce the page you can read. When you
1.3 Example Sessions 11
Figure 1.7: The “Display Data” menu
enter a URL into an OPeNDAP Matlab program called loaddods, that programde-references the URL to produce data in the Matlab workspace.
It’s a lot to type, but try typing the following at the Matlab prompt (all one line):>> loaddods(’http://ferret.wrc.noaa.gov/cgi-bin/nph-nc/data/
COADS_climatology.nc?SST[7:7][0:1:89][0:1:179]’)
When loaddods dereferences this long URL, it prints something like this in theterminal window (not in the Matlab window, but in the terminal you were usingwhen you started Matlab):
Reading: http://ferret.wrc.noaa.gov/cgi-bin/nph-nc/data/COADS_climatology.nc
Constraint: SST[7:7][0:1:89][0:1:179]
Server version: dods/2.15
Creating matrix SST (90 by 180) with 16200 elements.
Creating scalar TIME.
Creating vector COADSY with 90 elements.
Creating vector COADSX with 180 elements.
and it puts the four arrays (SST, TIME, COADSX, and COADSY) into your Matlab
12 The OPeNDAP Matlab Graphical User Interface
workspace.
>> whos
Name Size Bytes Class
COADSX 180x1 1440 double array
COADSY 90x1 720 double array
SST 90x180 129600 double array
TIME 1x1 8 double array
The loaddods program is the heart of the OPeNDAP Matlab GUI. The rest of theOPeNDAP Matlab GUI is simply a “front-end” to the loaddods program thatyou use to construct URLs and make some housekeeping chores somewhat easier.
You can use this to your advantage, as is shown in the next example.
Incidentally, when the OPeNDAP Matlab GUI returns data, one of the returnedvariables is the exact URL that was used to issue the request for that data. Thisprovides a unique identifier should you want to recreate a request or expand on it,perhaps in your own Matlab script.
1.3.2 Creating a Time Series
It is often the case that the data you wish to see cannot be easily displayed in theOPeNDAP Matlab GUI window. OPeNDAP allows much richer access to the datathan the browser can accommodate. This means that you can often use theOPeNDAP Matlab GUI to help construct a URL, even though you may not use itto submit the data request.You can also use OPeN-
DAP from the Matlab com-mand line.
The following example shows how you might go about constructing anddisplaying a time series from the OPeNDAP Matlab GUI datasets, even thoughthere is limited browser capacity for displaying this kind of data. The OPeNDAPMatlab GUI actually is flexible enough to plot this example, but there are othersfor which this technique is useful. It’s also useful to become familiar withloaddods in case you want to include access to OPeNDAP datasets in your ownscripts.
❶ Start up the browser and select the “Surface - COADS Monthly Datasets -PMEL” dataset.
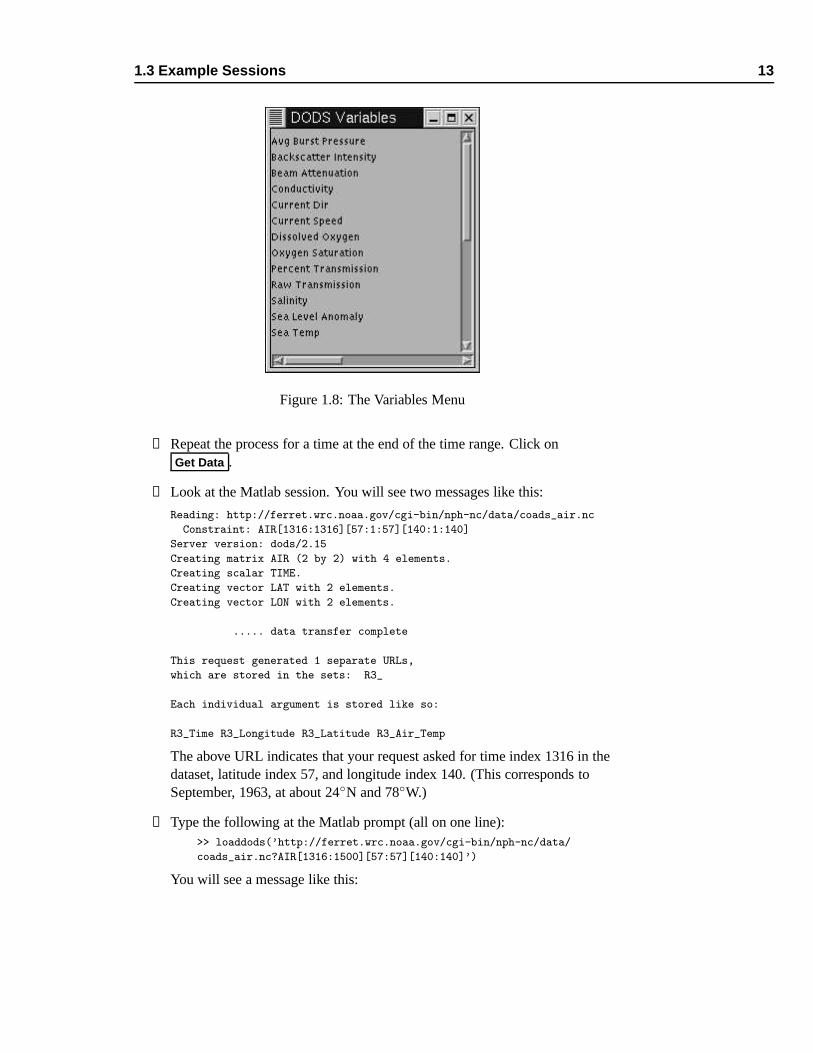
❷ Select “Air Temperature” from the Variables menu. (See figure 1.8.) If it’snot there, you haven’t selected a dataset containing that variable.
❸ Using the Zoom and Select Data Range buttons, select a very smallgeographic range. This dataset is arranged in two-degree squares, so pick atwo-degree square somewhere. Pick a wide time range.
❹ Click on Get Details . Select a time at the beginning of the range. Click onGet Data .
1.3 Example Sessions 13
Figure 1.8: The Variables Menu
❺ Repeat the process for a time at the end of the time range. Click onGet Data .
❻ Look at the Matlab session. You will see two messages like this:
Reading: http://ferret.wrc.noaa.gov/cgi-bin/nph-nc/data/coads_air.nc
Constraint: AIR[1316:1316][57:1:57][140:1:140]
Server version: dods/2.15
Creating matrix AIR (2 by 2) with 4 elements.
Creating scalar TIME.
Creating vector LAT with 2 elements.
Creating vector LON with 2 elements.
..... data transfer complete
This request generated 1 separate URLs,
which are stored in the sets: R3_
Each individual argument is stored like so:
R3_Time R3_Longitude R3_Latitude R3_Air_Temp
The above URL indicates that your request asked for time index 1316 in thedataset, latitude index 57, and longitude index 140. (This corresponds toSeptember, 1963, at about 24◦N and 78◦W.)
❼ Type the following at the Matlab prompt (all on one line):>> loaddods(’http://ferret.wrc.noaa.gov/cgi-bin/nph-nc/data/
coads_air.nc?AIR[1316:1500][57:57][140:140]’)
You will see a message like this:
14 The OPeNDAP Matlab Graphical User Interface
Reading: http://ferret.wrc.noaa.gov/cgi-bin/nph-nc/data/coads_air.nc
Constraint: AIR[1316:1500][57:57][140:140]
Server version: dods/2.15
Creating vector AIR with 185 elements.
Creating vector TIME with 185 elements.
Creating scalar LAT.
Creating scalar LON.
❽ You now have, in the Matlab workspace, a vector of temperatures, AIR,whose entries correspond to a vector of times, TIME. The scalars LAT andLON give the location of the data. You can display the data with Matlabfunctions. Type the following at the Matlab prompt:
>> figure
>> plot(TIME,AIR)
CAUTION: There are some pitfalls to using loaddods directly. TheOPeNDAP Matlab GUI does quite a bit of housekeeping for you,including some unit conversions. When you use the browser, youget your data back in consistent units, whatever dataset you arelooking at. When you use loaddods, you get the data arereturned in the units they are stored in. The COADS time data,used in the above example, comes in units of days since 1700.
Similarly, different data providers use different values withintheir datasets to indicate “bad” or “missing” data points.Through the browser, these data flags are transformed intoMatlab NaNs. (See Matlab ‘help nan’ if you are not familiar withthe NaN symbol.) Again, downloading the data directly withloaddods skips this transformation.
If you like, you can save your data with the Matlab save command and restore itwith the load command. See the Matlab documentation for more informationabout these commands.
1.4 Updating the Dataset List 15
1.4 Updating the Dataset ListMaintaining your set ofdataset bookmarks.The OPeNDAP Matlab GUI consists of two sets of files: the M-files and
associated data used to run the display and user interface, and a second collectionof Matlab M-files used to describe the datasets available through the OPeNDAPMatlab GUI. These “metadata” files (also called the “archive M-files ”) containdescriptions of the datasets, and retrieval and catalog functions tailoredspecifically for them.
The metadata files are stored in a sub-directory of the main OPeNDAP MatlabGUI directory, called DATASETS. Generally speaking, most users will be quiteunlikely to want to edit the OPeNDAP Matlab GUI M-files. However, there areseveral reasons why you might have to edit the archive M-files: adding a dataset,adding comments to a dataset, or otherwise editing the metadata. Chapter 3contains information about the structure of the archive M-files and their associatedfunctions.
For example, the archive M-file for the declouded Hatteras to Nova Scotia 1.1kmresolution AVHRR dataset is called htn decld.m. You will find this script in thebrowser subdirectory DATASETS.
The dataset descriptions are stored in Matlab M-files, but the way a browser userselects these M-files is through a “bookmark” file, comparable to the bookmarksused in a web browser like Netscape. You can edit and rearrange thesebookmarks into folders like in Netscape, too. If you want to add your own M-filedataset descriptions to the bookmark file, you can just add it with the bookmarkeditor.
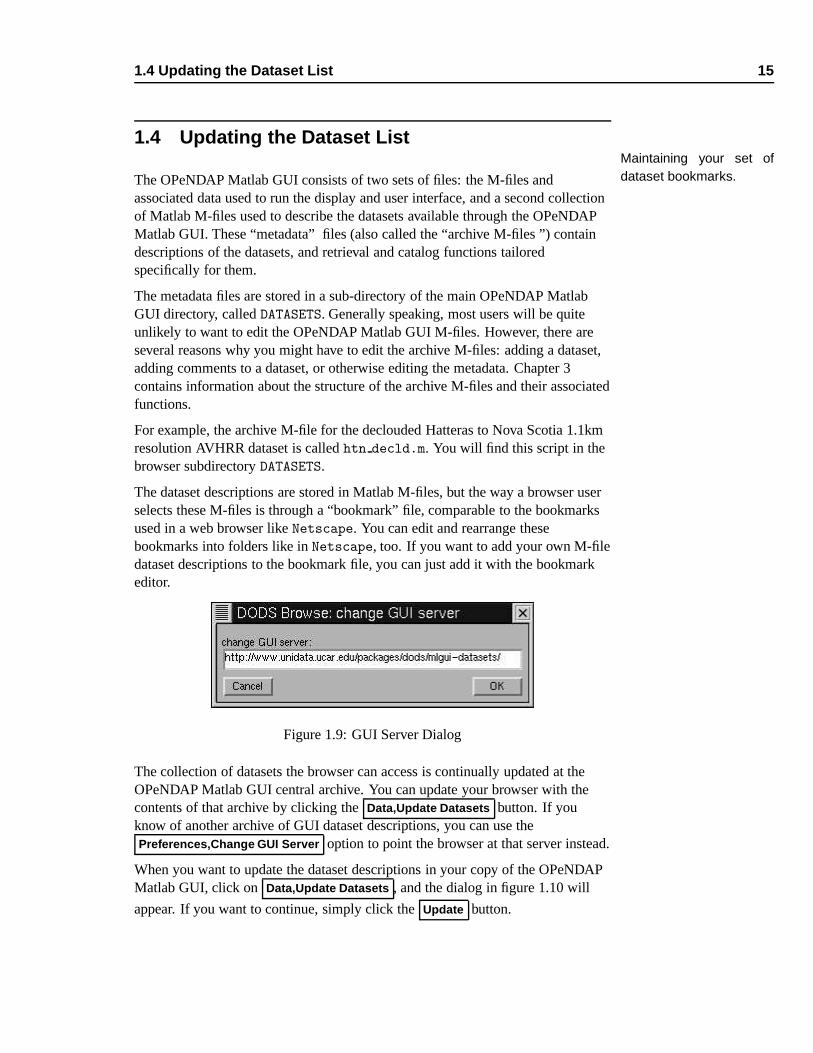
Figure 1.9: GUI Server Dialog
The collection of datasets the browser can access is continually updated at theOPeNDAP Matlab GUI central archive. You can update your browser with thecontents of that archive by clicking the Data,Update Datasets button. If youknow of another archive of GUI dataset descriptions, you can use thePreferences,Change GUI Server option to point the browser at that server instead.
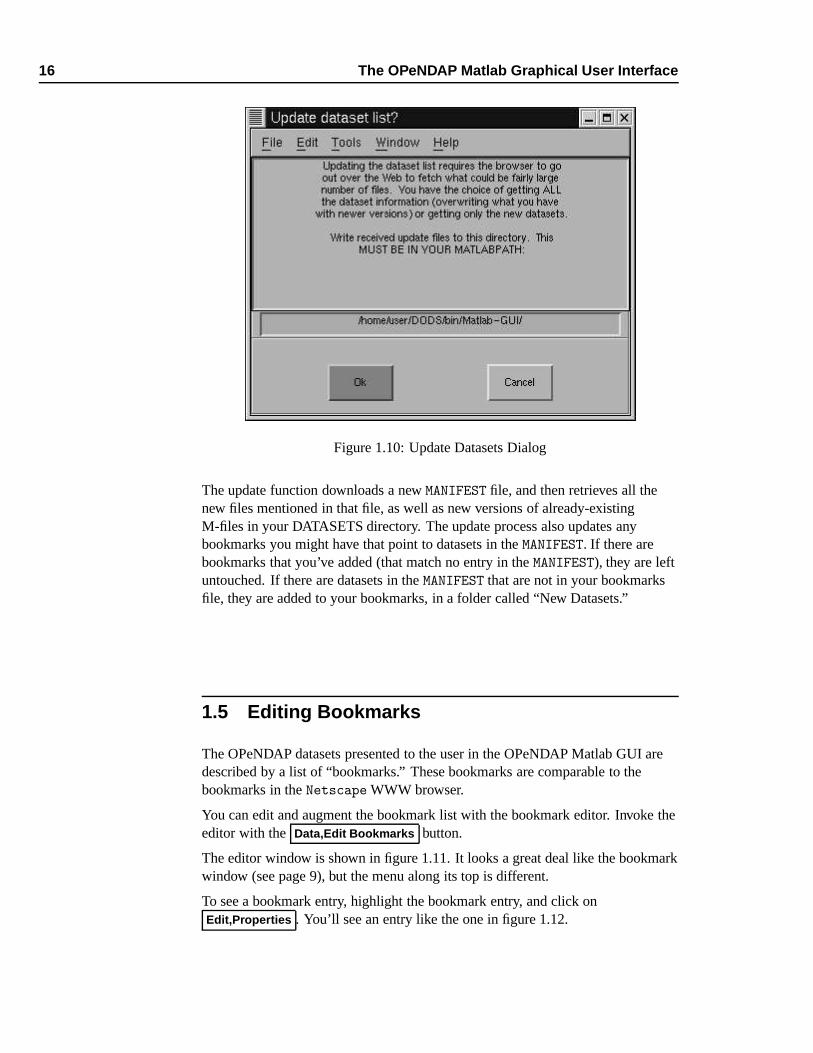
When you want to update the dataset descriptions in your copy of the OPeNDAPMatlab GUI, click on Data,Update Datasets , and the dialog in figure 1.10 will
appear. If you want to continue, simply click the Update button.
16 The OPeNDAP Matlab Graphical User Interface
Figure 1.10: Update Datasets Dialog
The update function downloads a new MANIFEST file, and then retrieves all thenew files mentioned in that file, as well as new versions of already-existingM-files in your DATASETS directory. The update process also updates anybookmarks you might have that point to datasets in the MANIFEST. If there arebookmarks that you’ve added (that match no entry in the MANIFEST), they are leftuntouched. If there are datasets in the MANIFEST that are not in your bookmarksfile, they are added to your bookmarks, in a folder called “New Datasets.”
1.5 Editing Bookmarks
The OPeNDAP datasets presented to the user in the OPeNDAP Matlab GUI aredescribed by a list of “bookmarks.” These bookmarks are comparable to thebookmarks in the Netscape WWW browser.
You can edit and augment the bookmark list with the bookmark editor. Invoke theeditor with the Data,Edit Bookmarks button.
The editor window is shown in figure 1.11. It looks a great deal like the bookmarkwindow (see page 9), but the menu along its top is different.
To see a bookmark entry, highlight the bookmark entry, and click onEdit,Properties . You’ll see an entry like the one in figure 1.12.
1.5 Editing Bookmarks 17
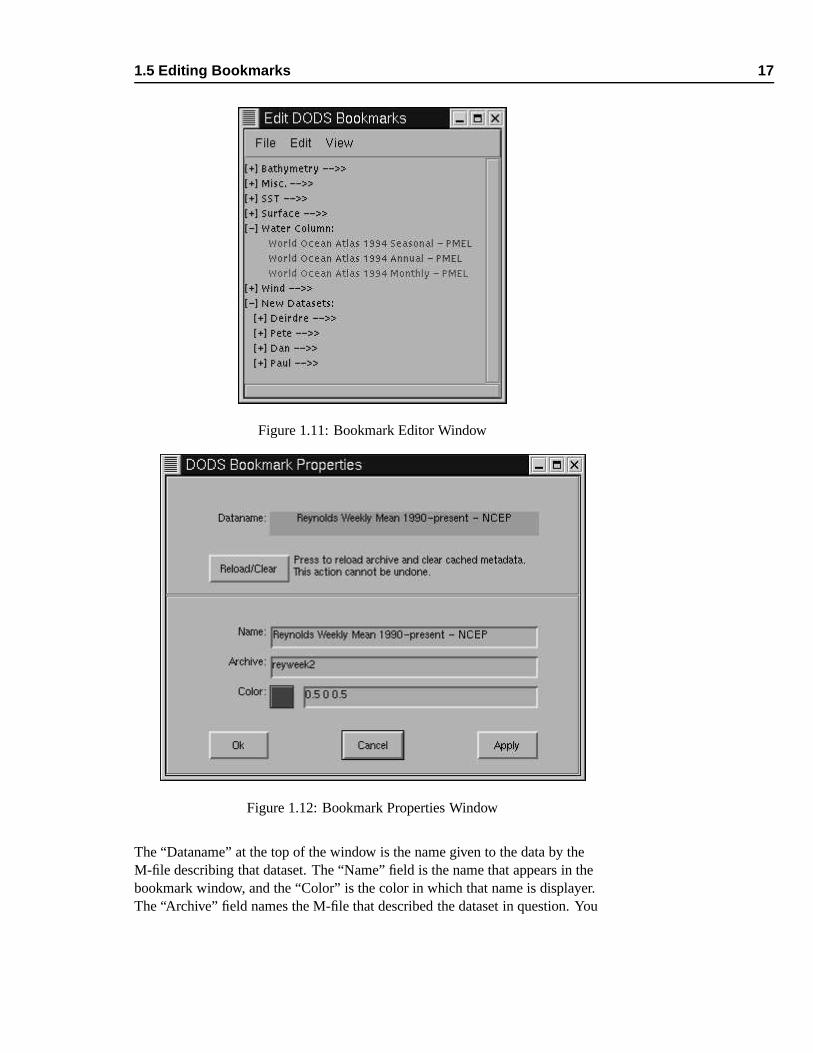
Figure 1.11: Bookmark Editor Window
Figure 1.12: Bookmark Properties Window
The “Dataname” at the top of the window is the name given to the data by theM-file describing that dataset. The “Name” field is the name that appears in thebookmark window, and the “Color” is the color in which that name is displayer.The “Archive” field names the M-file that described the dataset in question. You
18 The OPeNDAP Matlab Graphical User Interface
can edit fields here and save the changes with the Ok or Apply buttons.
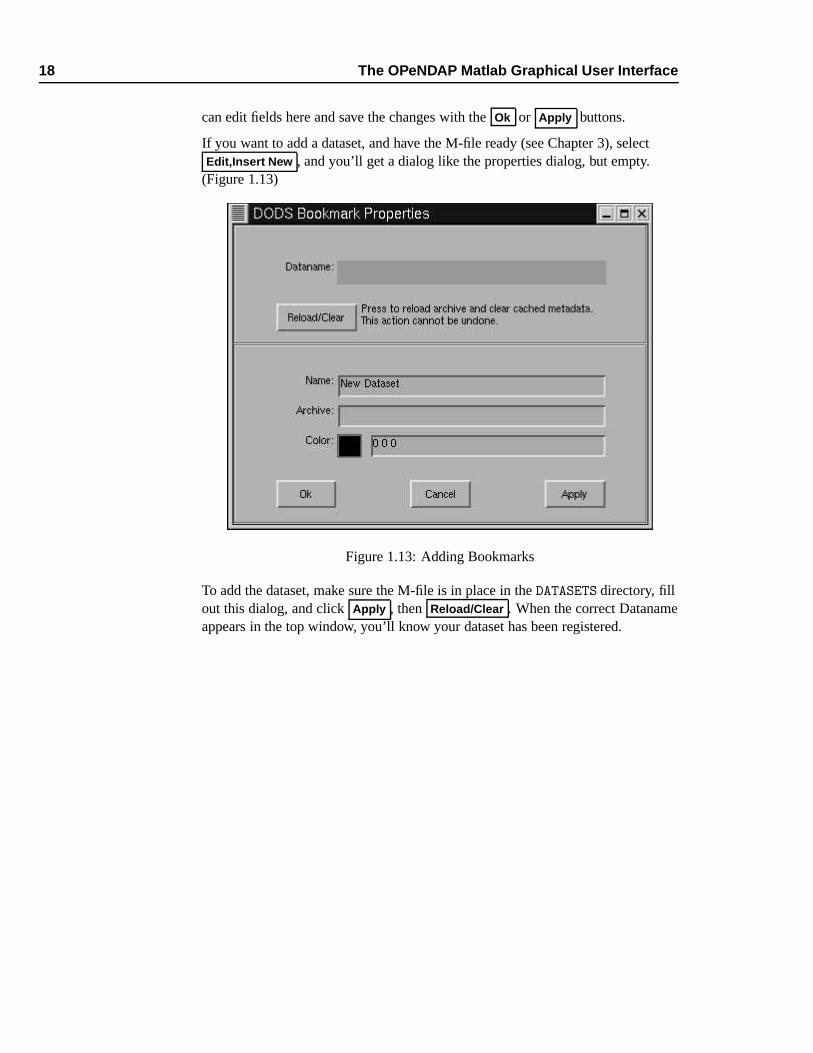
If you want to add a dataset, and have the M-file ready (see Chapter 3), selectEdit,Insert New , and you’ll get a dialog like the properties dialog, but empty.
(Figure 1.13)
Figure 1.13: Adding Bookmarks
To add the dataset, make sure the M-file is in place in the DATASETS directory, fillout this dialog, and click Apply , then Reload/Clear . When the correct Datanameappears in the top window, you’ll know your dataset has been registered.
2The DODS GUI Menu Reference
This chapter contains a description of each of the menus and buttons that make upthe OPeNDAP Matlab GUI. They are arranged by function, and by containingmenu. The buttons and menus are also referenced in the index.
2.1 The Buttons
The following buttons are available on the main screen of the OPeNDAP MatlabGUI. (See figure 1.1.) They are roughly arranged by function.
Set Data Range Before a query can be made to a dataset, the dataset andvariables must be selected, and a range must be selected in space and time.If you are looking at the graphical view, you can click this button, and thenselect an area in any of the selection windows (global location, time, anddepth) by clicking and dragging the left mouse button.
You can also enter the boundaries of the selected range by hand. Simplyswitch to the text view with the View Text button, and enter the values inthe entry windows provided.
Zoom Use this button to examine any of the displayed axes more closely. Whenthe zoom operation is in effect, the left mouse button zooms in to a closerview, while the right mouse button zooms out to a more distant view. If youclick and drag, the enclosed area will be enlarged to fill the selectionwindow. (This is the standard Matlab “zoom” function.)
20 The DODS GUI Menu Reference
NOTE: Zooming in on the map, time line, or depth line does not selecta region. In order to submit a request for data, you must selecta range with the Set Data Range button.
Get Details Once you have selected a dataset, variables, and range, you can clickthe Get Details button for information about the volume and location of thedata in the dataset. For example, if you select the Reynolds Weekly SeaSurface Temperature dataset, Get Details will produce an asterisk at eachtime within the selected time range where there is data. If you zoom in onthese asterisks, you will see one of them every seven days. If multipleasterisks appear in the range you have selected, you might choose to refineyour range to make a smaller request before you submit the data request. Ofcourse, you can request data from several times, in which case there will bemultiple accesses to the remote dataset. Each request will be internedseparately into the Matlab workspace.
Get Data Use this button to submit a request for data from the remote server. Ifyour data range contains several data points, your data may be returned inseveral Matlab arrays, or in a multi-dimensional array that will need to besubsampled to display. A message box will announce the names underwhich the data are to be stored.
For very large requests, a warning window may appear to remind you thatthe request you are about to make is a large one. Press “OK” to confirm youstill want the request to be submitted. See page 25 for more information.
Next Plot This button only appears when you’ve plotted many variables at once.You can use this button to flip through the plots, one at a time, until the end.
Acknowledgements Selecting this button displays a text window containing textdescribing the source and authors of the dataset currently selected. You canuse this text to cite the source of the data, should you end up using it in acontext where this is appropriate, such as a publication. If you make dataproducts available to other scientists using this data, it is also consideredgood form to include this citation with that data in some way.
View Text The text version of the main GUI window allows you to type theboundaries of the data range, and displays the dataset comments, whichcontain detailed descriptions of the datasets.
Press this button if you are looking at the graphic version of the mainwindow and you want to be looking at the text version.
View Plot The graphic version of the main GUI window allows you to select thesearch boundaries by pointing and dragging with the mouse. This is alsowhere you can see the displayed results of a search.
Press this button if you are looking at the text version of the main windowand you want to be looking at the graphic version.
2.2 The Menus 21
Clear Selection This button clears all the selections you have made: data range,variable and dataset. The Datasets and Variables menu windows arerestored to their initial conditions.
Quit This button terminates the browser. Matlab continues running after thebrowser finishes; you have to type quit at the Matlab prompt to end yourMatlab session.
2.2 The Menus
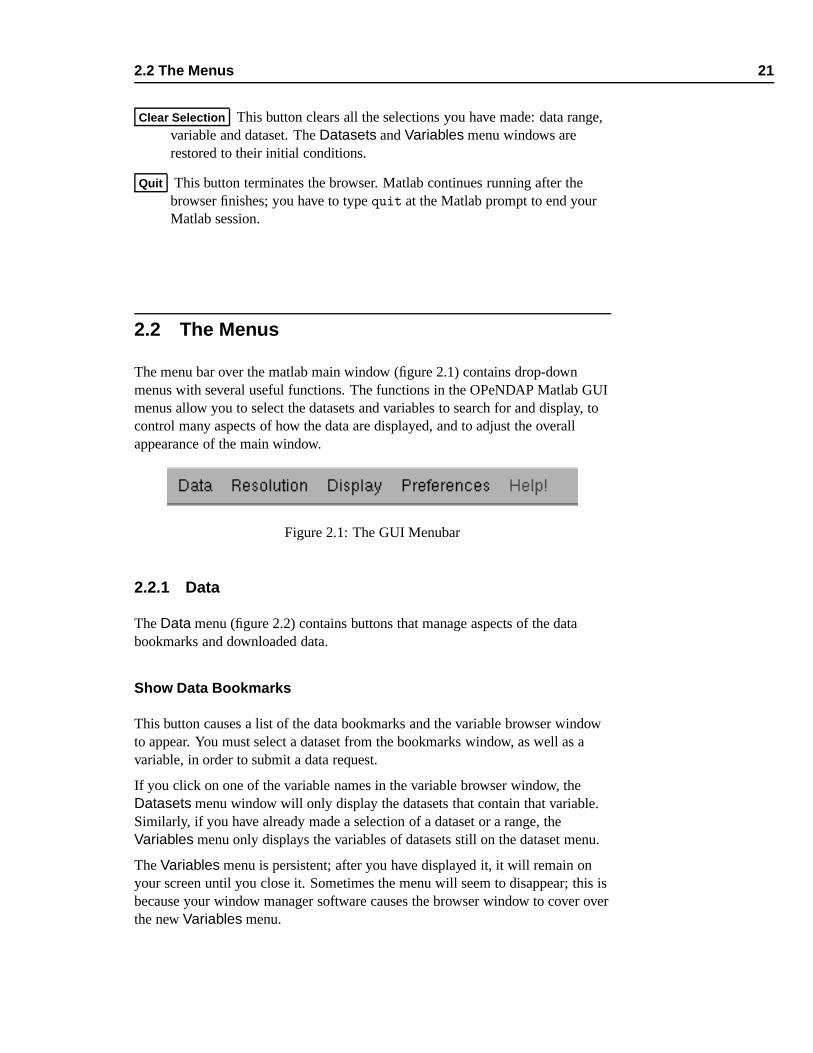
The menu bar over the matlab main window (figure 2.1) contains drop-downmenus with several useful functions. The functions in the OPeNDAP Matlab GUImenus allow you to select the datasets and variables to search for and display, tocontrol many aspects of how the data are displayed, and to adjust the overallappearance of the main window.
Figure 2.1: The GUI Menubar
2.2.1 Data
The Data menu (figure 2.2) contains buttons that manage aspects of the databookmarks and downloaded data.
Show Data Bookmarks
This button causes a list of the data bookmarks and the variable browser windowto appear. You must select a dataset from the bookmarks window, as well as avariable, in order to submit a data request.
If you click on one of the variable names in the variable browser window, theDatasets menu window will only display the datasets that contain that variable.Similarly, if you have already made a selection of a dataset or a range, theVariables menu only displays the variables of datasets still on the dataset menu.
The Variables menu is persistent; after you have displayed it, it will remain onyour screen until you close it. Sometimes the menu will seem to disappear; this isbecause your window manager software causes the browser window to cover overthe new Variables menu.
22 The DODS GUI Menu Reference
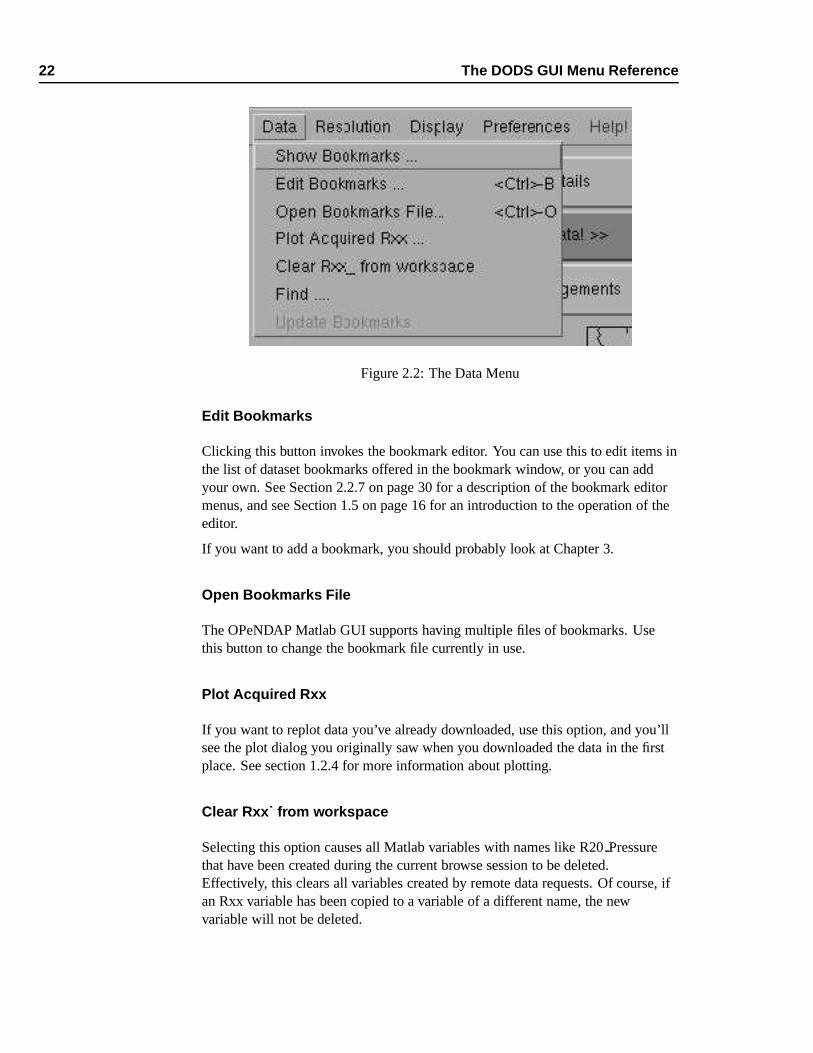
Figure 2.2: The Data Menu
Edit Bookmarks
Clicking this button invokes the bookmark editor. You can use this to edit items inthe list of dataset bookmarks offered in the bookmark window, or you can addyour own. See Section 2.2.7 on page 30 for a description of the bookmark editormenus, and see Section 1.5 on page 16 for an introduction to the operation of theeditor.
If you want to add a bookmark, you should probably look at Chapter 3.
Open Bookmarks File
The OPeNDAP Matlab GUI supports having multiple files of bookmarks. Usethis button to change the bookmark file currently in use.
Plot Acquired Rxx
If you want to replot data you’ve already downloaded, use this option, and you’llsee the plot dialog you originally saw when you downloaded the data in the firstplace. See section 1.2.4 for more information about plotting.
Clear Rxx˙ from workspace
Selecting this option causes all Matlab variables with names like R20 Pressurethat have been created during the current browse session to be deleted.Effectively, this clears all variables created by remote data requests. Of course, ifan Rxx variable has been copied to a variable of a different name, the newvariable will not be deleted.
2.2 The Menus 23
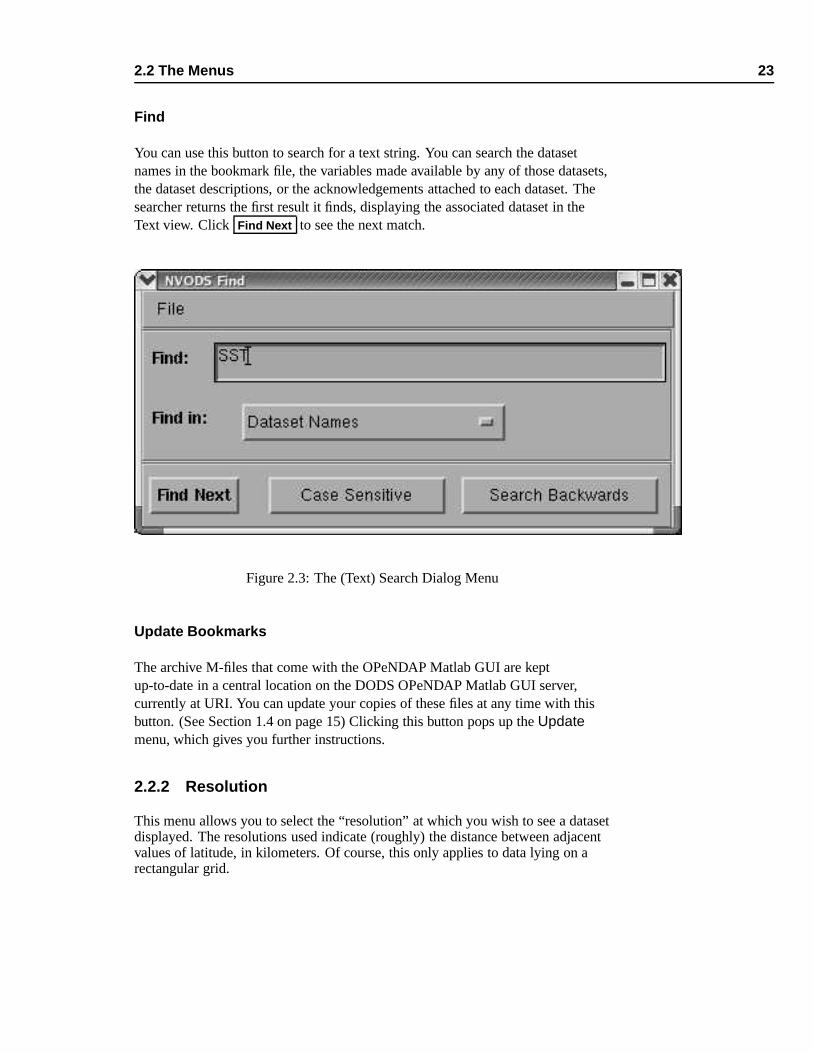
Find
You can use this button to search for a text string. You can search the datasetnames in the bookmark file, the variables made available by any of those datasets,the dataset descriptions, or the acknowledgements attached to each dataset. Thesearcher returns the first result it finds, displaying the associated dataset in theText view. Click Find Next to see the next match.
Figure 2.3: The (Text) Search Dialog Menu
Update Bookmarks
The archive M-files that come with the OPeNDAP Matlab GUI are keptup-to-date in a central location on the DODS OPeNDAP Matlab GUI server,currently at URI. You can update your copies of these files at any time with thisbutton. (See Section 1.4 on page 15) Clicking this button pops up the Updatemenu, which gives you further instructions.
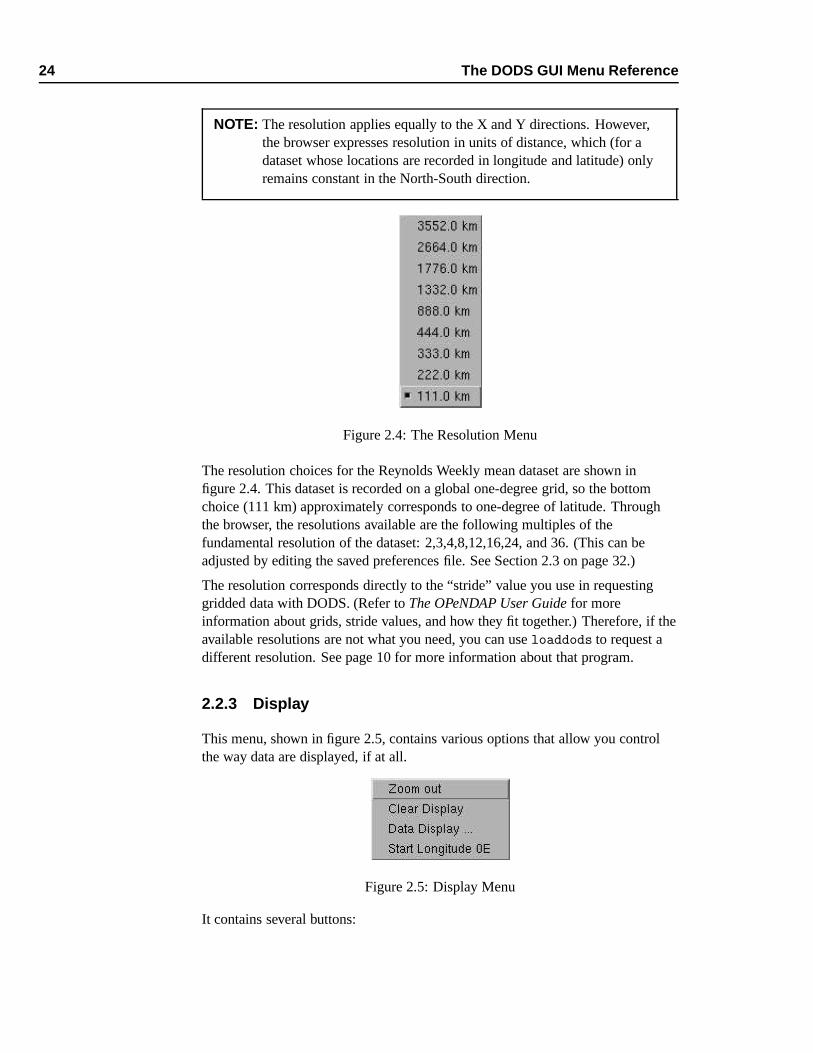
2.2.2 Resolution
This menu allows you to select the “resolution” at which you wish to see a datasetdisplayed. The resolutions used indicate (roughly) the distance between adjacentvalues of latitude, in kilometers. Of course, this only applies to data lying on arectangular grid.
24 The DODS GUI Menu Reference
NOTE: The resolution applies equally to the X and Y directions. However,the browser expresses resolution in units of distance, which (for adataset whose locations are recorded in longitude and latitude) onlyremains constant in the North-South direction.
Figure 2.4: The Resolution Menu
The resolution choices for the Reynolds Weekly mean dataset are shown infigure 2.4. This dataset is recorded on a global one-degree grid, so the bottomchoice (111 km) approximately corresponds to one-degree of latitude. Throughthe browser, the resolutions available are the following multiples of thefundamental resolution of the dataset: 2,3,4,8,12,16,24, and 36. (This can beadjusted by editing the saved preferences file. See Section 2.3 on page 32.)
The resolution corresponds directly to the “stride” value you use in requestinggridded data with DODS. (Refer to The OPeNDAP User Guide for moreinformation about grids, stride values, and how they fit together.) Therefore, if theavailable resolutions are not what you need, you can use loaddods to request adifferent resolution. See page 10 for more information about that program.
2.2.3 Display
This menu, shown in figure 2.5, contains various options that allow you controlthe way data are displayed, if at all.
Figure 2.5: Display Menu
It contains several buttons:

2.2 The Menus 25
Zoom Out If you’ve zoomed in on some part of the world map, this buttonrestores the map to cover the whole world. It also restores the time line andthe depth range to their original values.
Clear Display This button erases the displayed data from the browser mainwindow.
Reset Display Erases the displayed data from the browser main window, andzooms out to view the whole world, the complete time line, and all depths.
Start Longitude This changes the display map longitude boundaries. Start thelongitude at 180W (the international date line) if you want to see theAtlantic, but start at 0E (the greenwich meridian) if you want to see thePacific entire. This is a toggle switch.
2.2.4 Preferences
The preferences menu is shown in figure 2.6.
Figure 2.6: Preferences Menu
Time The date can be displayed as Year/Month/Day triples, or as the year andthe ordinal number of the day for that year. This is a toggle switch.
Messages Messages to the user can be directed either to pop-up windows(“Messages to Pop-up Window”) or to the Matlab command-line interface(“Messages to Workspace”). This is a toggle switch, click it to change itsvalue.
Get Data Threshold This button calls up a dialog box that controls the datarequest threshold. (See figure 2.7.)
26 The DODS GUI Menu Reference
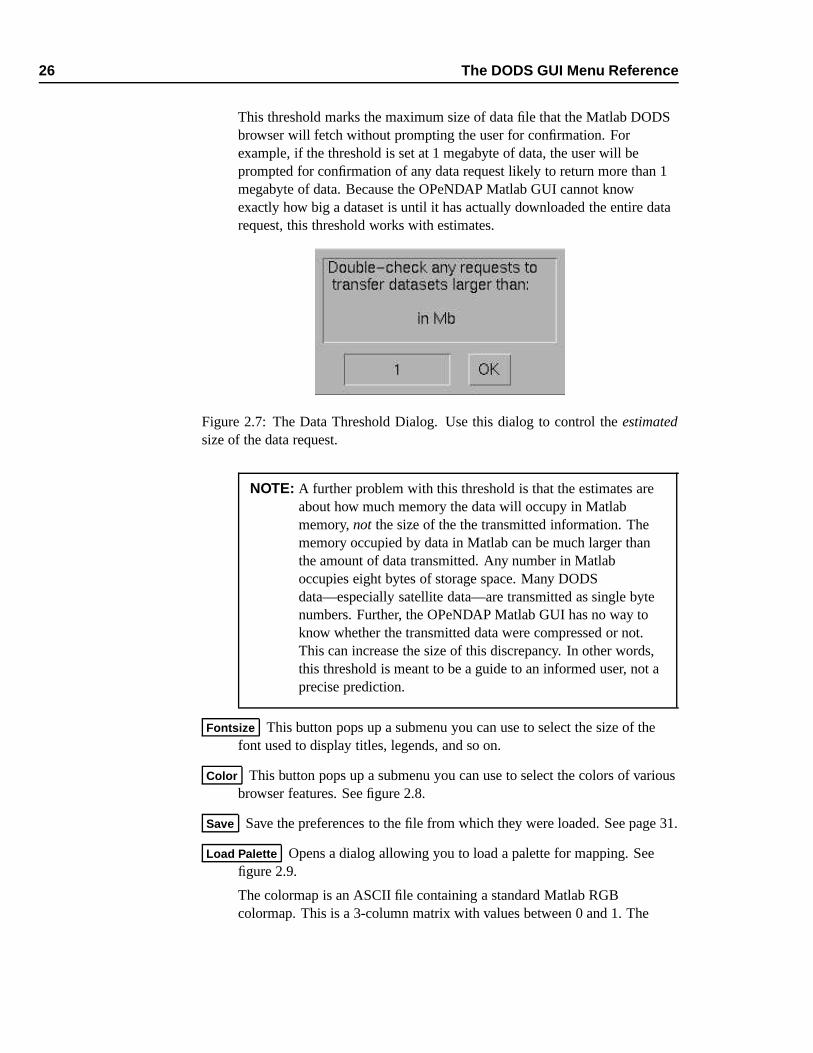
This threshold marks the maximum size of data file that the Matlab DODSbrowser will fetch without prompting the user for confirmation. Forexample, if the threshold is set at 1 megabyte of data, the user will beprompted for confirmation of any data request likely to return more than 1megabyte of data. Because the OPeNDAP Matlab GUI cannot knowexactly how big a dataset is until it has actually downloaded the entire datarequest, this threshold works with estimates.
Figure 2.7: The Data Threshold Dialog. Use this dialog to control the estimatedsize of the data request.
NOTE: A further problem with this threshold is that the estimates areabout how much memory the data will occupy in Matlabmemory, not the size of the the transmitted information. Thememory occupied by data in Matlab can be much larger thanthe amount of data transmitted. Any number in Matlaboccupies eight bytes of storage space. Many DODSdata—especially satellite data—are transmitted as single bytenumbers. Further, the OPeNDAP Matlab GUI has no way toknow whether the transmitted data were compressed or not.This can increase the size of this discrepancy. In other words,this threshold is meant to be a guide to an informed user, not aprecise prediction.
Fontsize This button pops up a submenu you can use to select the size of thefont used to display titles, legends, and so on.
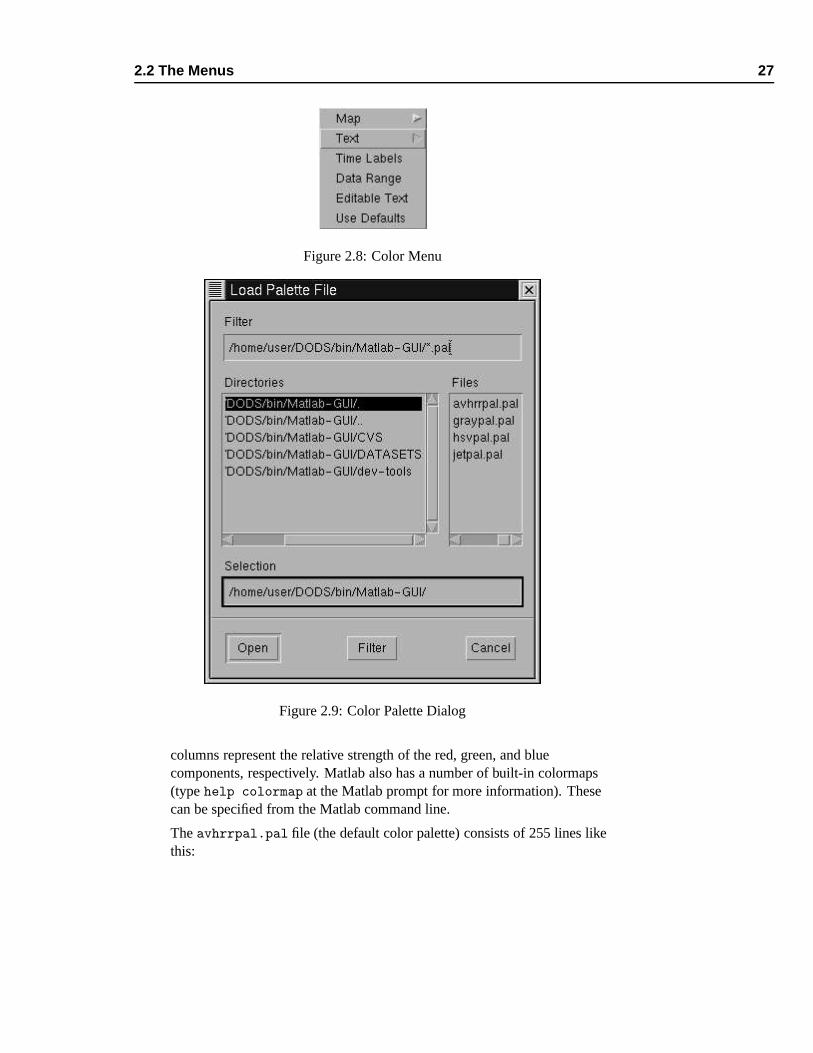
Color This button pops up a submenu you can use to select the colors of variousbrowser features. See figure 2.8.
Save Save the preferences to the file from which they were loaded. See page 31.
Load Palette Opens a dialog allowing you to load a palette for mapping. Seefigure 2.9.
The colormap is an ASCII file containing a standard Matlab RGBcolormap. This is a 3-column matrix with values between 0 and 1. The
2.2 The Menus 27
Figure 2.8: Color Menu
Figure 2.9: Color Palette Dialog
columns represent the relative strength of the red, green, and bluecomponents, respectively. Matlab also has a number of built-in colormaps(type help colormap at the Matlab prompt for more information). Thesecan be specified from the Matlab command line.
The avhrrpal.pal file (the default color palette) consists of 255 lines likethis:
28 The DODS GUI Menu Reference
...
0.2000 0.0000 0.3000
0.3700 0.0000 0.5000
0.4516 0.0000 0.7000
0.4548 0.0323 0.8710
0.4548 0.2323 1.0000
...
The file represents a 255x3 array. You can think of it as a list of 255 colors,each of which is specified as a combination of red, green, and blue values(from left to right). Each value represents the fraction of intensity, with 1.0equal to full intensity of that color component.
To use one of the colormaps that come with Matlab, you can create a palettein an external file with the following steps:
❶ Create a color map with the following command:
>> newpalette = hsv(256);
Any of the following could substitute for the hsv in the aboveexample. They are all colormaps supplied with Matlab:
hsv Hue-saturation-value color map.
hot Black-red-yellow-white color map.
gray Linear gray-scale color map.
bone Gray-scale with tinge of blue color map.
copper Linear copper-tone color map.
pink Pastel shades of pink color map.
white All white color map.
flag Alternating red, white, blue, and black color map.
lines Color map with the line colors.
colorcube Enhanced color-cube color map.
jet Variant of HSV.
prism Prism color map.
cool Shades of cyan and magenta color map.
autumn Shades of red and yellow color map.
spring Shades of magenta and yellow color map.
winter Shades of blue and green color map.
summer Shades of green and yellow color map.
❷ Save the result into an ASCII file:>> fid = fopen(’newpalette.pal’);
>> fprintf(fid,’%g %g %g\n’,newpalette’);
>> fclose(fid);
Set GUI Server You can use the dialog summoned by this button (see figure 1.9)to update your master list of datasets from some other source than theDODS central archive.
2.2 The Menus 29
Save As If you have changed preferences such as color, font, threshold oranything else, you can save these values by selecting this option. When theOPeNDAP Matlab GUI is next started, these same values will be read fromthe startup file, by default called browsopt.m. You can control the namewith the Save As dialog box. To reload a preference file, use thePreferences,Load Prefs File button. Browser preference files are simple
Matlab scripts and may be edited by hand.
The browser options saved with this command are described inSection 2.3 on page 32.
Load Prefs File This button allows you to load a set of user preferences savedfrom a previous browser session. Clicking the button brings up the dialog..The browser will execute the given preferences file, expecting it to be a filesuch as are saved by the Save Preferences command. Note that thepreferences file must be somewhere on your Matlab path. If you are unsure,type path at the Matlab prompt and examine the result.
The browser preferences loaded with this command are described inSection 2.3 on page 32. Saves the current preferences in a file of yourchoosing.
Use Defaults Selecting this option will restore to their default values:
➼ The size and screen position of the browse windows
➼ The resolution factors (multiples of the dataset stride availablethrough the Resolution menu)
➼ The font size
➼ The color scheme for the user display
➼ The time format (this is year/month/day)
➼ The axis limits
➼ The data size threshold (1Mb)
➼ The color limits (0 255)
➼ The color palette.
➼ The limits of the four browser axes (time, depth, latitude, longitude).
Clicking this button also clears the ranges, dataset and variable selections.See Section 2.3 on page 32 for more information about the options.
2.2.5 DODS Help
This menu allows you to see several short hints addressing frequently askedquestions. You can also select DODS GUI User Manual , which will start an htmlbrowser on your system, reading a hypertext version of this document. Your
30 The DODS GUI Menu Reference
Matlab file, docopt.m must be properly configured to use the appropriatebrowser. See your system administrator if it is not set correctly. Similarly, you canedit the browsopt.m file (part of the OPeNDAP Matlab GUI) to control the URLsubmitted to the browser. The default is to read the copy of the documentation onthe DODS server: http://opendap.org/support/docs.html/user/mgui-html/.
If you have a local copy of the hypertext documentation, you may want to refer tothat copy instead, to make browsing the text faster.
2.2.6 Display Data
The data display dialog is described in Section 1.2.4.
There are two pull-down menus on the data display dialog:
Edit
This menu contains three buttons:
Add New Plot Create a new, empty, plot window.
Delete Plot Delete one of the existing plots.
Delete All Plots Delete all the existing plots.
Apply to All
If you have a set of plots and wish to operate on them all simultaneously, you canchange some aspect of the Display Dialog, and then select the appropriate buttonon this menu, and that aspect of all the plots will be updated.
2.2.7 Bookmarks
The bookmark editor looks like the bookmark selection window, but with adifferent menu bar. The menu bar has three pull-down menus, File, Edit andView.
File
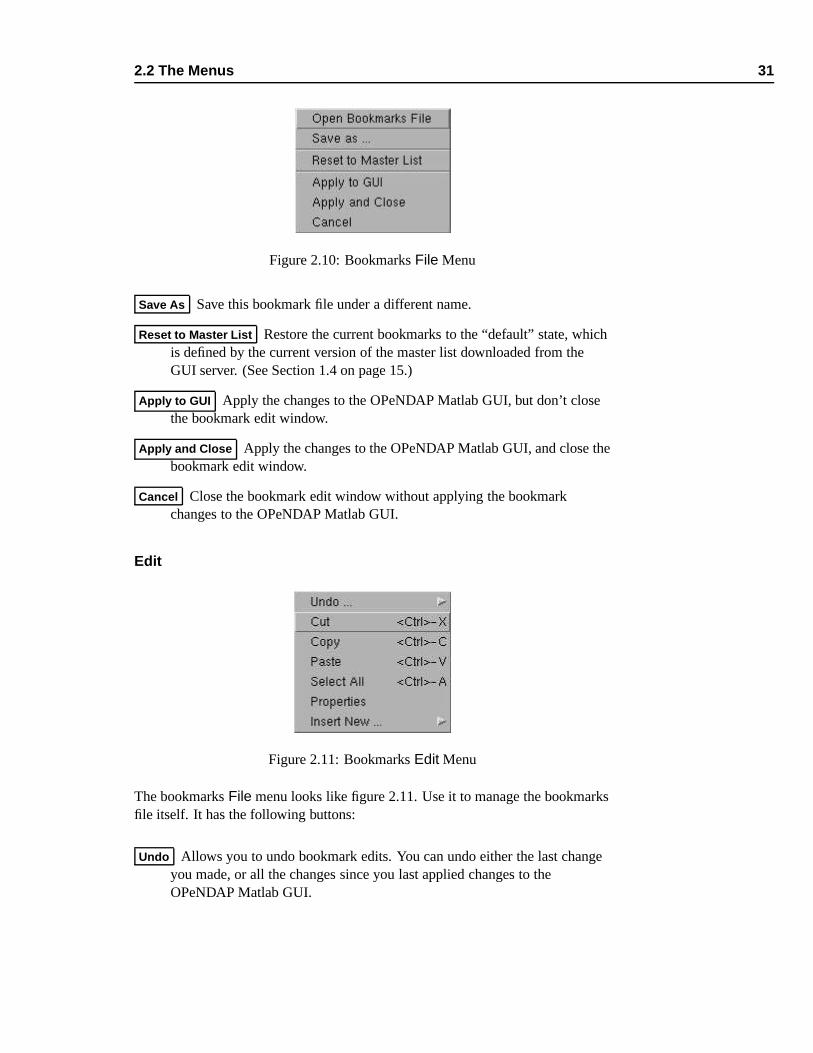
The bookmarks File menu looks like figure 2.10. Use it to manage the bookmarksfile itself. It has the following buttons:
Open Bookmarks File Select a different bookmarks file to edit.
2.2 The Menus 31
Figure 2.10: Bookmarks File Menu
Save As Save this bookmark file under a different name.
Reset to Master List Restore the current bookmarks to the “default” state, whichis defined by the current version of the master list downloaded from theGUI server. (See Section 1.4 on page 15.)
Apply to GUI Apply the changes to the OPeNDAP Matlab GUI, but don’t closethe bookmark edit window.
Apply and Close Apply the changes to the OPeNDAP Matlab GUI, and close thebookmark edit window.
Cancel Close the bookmark edit window without applying the bookmarkchanges to the OPeNDAP Matlab GUI.
Edit
Figure 2.11: Bookmarks Edit Menu
The bookmarks File menu looks like figure 2.11. Use it to manage the bookmarksfile itself. It has the following buttons:
Undo Allows you to undo bookmark edits. You can undo either the last changeyou made, or all the changes since you last applied changes to theOPeNDAP Matlab GUI.
32 The DODS GUI Menu Reference
Cut Cut the selected bookmark or range of bookmarks. Store them in aninvisible buffer, to be pasted if desired.
Copy Copy the selected bookmark or range of bookmarks to an invisible buffer,to be pasted if desired.
Paste Copy any contents of the invisible copy buffer to the bookmark list.
Select All Select all the bookmarks in the list.
Properties Display the properties of the highlighted bookmark. See figure 1.12.
Insert New Insert a new bookmark or bookmark folder into the bookmark list.See Section 1.5 on page 16.
View
There is only one option under the View menu, which is Master List . Selectingthis button provides a view of the current version of the master list, from whichentries can be copied and pasted.
2.3 Browser Preferences
The OPeNDAP Matlab GUI uses a set of preferences to control several aspects ofits use, including selection ranges, font sizes, colors and so on. These preferencescan be loaded with the Preferences,Load File button, and saved with the
Preferences,Save or Preferences, Save As buttons (See page 29). Thesecommands load and save a Matlab script whose function is to define the values ofthe various preferences. You may find it convenient to edit the file by hand; it isonly an ASCII file of Matlab commands.
If the preferences file is called browsopt.m, and is stored somewhere in theMatlab path, it will be loaded automatically when the browser starts up.
Following is a list of all the options a preference file may contain.
timetoggle This option (controlled with the Display,Time button) controlswhether times are displayed as Year/Month/Day or as the Year/Yearday,where Yearday is the ordinal number of the day of that year.
dods colors This is the set of colors, expressed in RGB values in a 10 × 3array, used to display various aspects of the browser window. The colors areused as follows:
2.3 Browser Preferences 33
dods colors[1] Default button color.
dods colors[2] Axis and window background.
dods colors[3] Axis and window foreground.
dods colors[4] Non-interactive window and axis text.
dods colors[5] Edit boxes, where users may type.
dods colors[6] Edit box text and button labels.
dods colors[7] The Get Data! button.
dods colors[8] Text and axis lines that change.
dods colors[9] The “whizzo” color, used for drawing attention tospecial options. The Help is displayed in this color, among others.
dods colors[10] The selection range box color.
fontsize The point size of the displayed type.
figsizes The default size and position of the browser window, expressed in thepixel locations of the upper left and lower right corners.
axes vals The starting axis values for the displayed axes, expressed four pairsof minimum and maximum values for (in this order), longitude, latitude,depth, and time:
axes_vals=[minLon maxLon minLat maxLat minDepth maxDepth minTime maxTime]
ranges Specifies the default selection ranges, in the same manner as theaxes vals preference.
num_rang An eight element vector of ones and zeros, indicating which of theselection ranges have been set by the user. A one means the correspondingitem in the ranges variable has been set by the user. If not all the rangesare set, you can’t ‘get data’ or ‘get details’. If a dataset is selected, and thedepth or geographic ranges have not been set, these are set to those of thedataset.
color limits A two element vector indicating the data values to assign to thetop and bottom colors in the data palette.
palettefile The name of a file containing the data palette. This file must be inthe Matlab path.
check level This is the number of megabytes for the “Get Data” threshold. (Setwith the Preferences,Get Data Threshold button, see page 25 for moreinformation.)
available resolutions This is a vector containing the available resolutionsoffered with the Resolutions menu, expressed as multiples of the dataset’sbasic resolution. The default value is:
34 The DODS GUI Menu Reference
available_resolutions = [32 24 16 12 8 4 3 2 1];
This option is not changable through the browser, but you can edit thepreferences file directly to change it.
manURL The URL of the OPeNDAP Matlab GUI manual. By default, this pointsto http://opendap.org/support/docs.html/user/mgui-html/. If you have alocal copy of the manual served, you can substitute that URL.
guiserver The URL to use for updates to the dataset metadata files.
userlist_file The name and location (on the local file system) of the user’sbookmarks file.

3Adding Your Own Datasets to the
OPeNDAP Matlab GUIThere are a few reasons you may need to add a dataset to the OPeNDAP MatlabGUI.
➼ You may be interested in an OPeNDAP data source that hasn’t been put intothe OPeNDAP Matlab GUI already,
➼ You may want to add to or modify some of the metadata supplied for one ofthe OPeNDAP Matlab GUI datasets, or
➼ You may have some of your own data you want to make available viaOPeNDAP.
It is possible to add datasets to the ones that come with the OPeNDAP MatlabGUI, and to edit or add to the metadata for the datasets that do come with it. Thiswill require some minor programming in Matlab, but much of the time it’s fairlysimple.
The OPeNDAP Matlab GUI is designed for the retrieval and display of data servedby an OPeNDAP server. This means that in order for the OPeNDAP Matlab GUIto read your data, there must be an OPeNDAP server, on a machine connected toyours somehow, with access to that data. The machine serving the data could be Start with getting your
data served by an OPeN-DAP server.
connected to yours on a local network or by the internet, or it could even be onyour own computer. Either way, the data must come from an OPeNDAP server.
Making your data available by an OPeNDAP server is a fairly straightforwardaffair for datasets stored in one of the several supported formats. The server itselfis a typical web server (httpd), adapted with a set of OPeNDAP CGI programs.To set up a server for your data, please refer to OPeNDAP User Guide. You canfind it and all the other OPeNDAP documentation at OPeNDAP Home page.
36 Adding Your Own Datasets to the OPeNDAP Matlab GUI
Once a OPeNDAP server is set up to serve your data, the dataset may be added tothe OPeNDAP Matlab GUI by providing the following pieces of information.Many datasets can use minimally modified versions of one or more of these piecesfrom existing datasets. Each of these are detailed in the sections that follow.
➼ An “archive” M-file, to describe the data in the dataset.
➼ A Get function that accepts a data range and retrieves data from the remotedataset. This is also called the getxxx function. Most often it’s possible touse (or adapt) one of the existing getxxx functions.
3.1 The Archive File
The archive M-file is a Matlab program that sets a number of variables describingvarious aspects of some dataset. In order for the browser to display the geographicand temporal bounds of a dataset, they must be specified in this file.
Many archive M-files exist in the DATASETS directory. If your dataset resembles(in data structure) one of the datasets already in the OPeNDAP Matlab GUIdataset collection, it may be simplest to copy the corresponding archive M-fileThe archive M-file de-
scribes a dataset to theGUI.
and modify it (and its corresponding getxxx function) to suit the new dataset. Forexample, the Reynolds Weekly Sea Surface Temperature data are stored in asingle file, containing a global one-degree grid of temperature for each weekcovered. If your data are stored as a similar grid, it will likely be easier to copy theReynolds M-files and adapt them than to write new ones from scratch.
3.1.1 An example
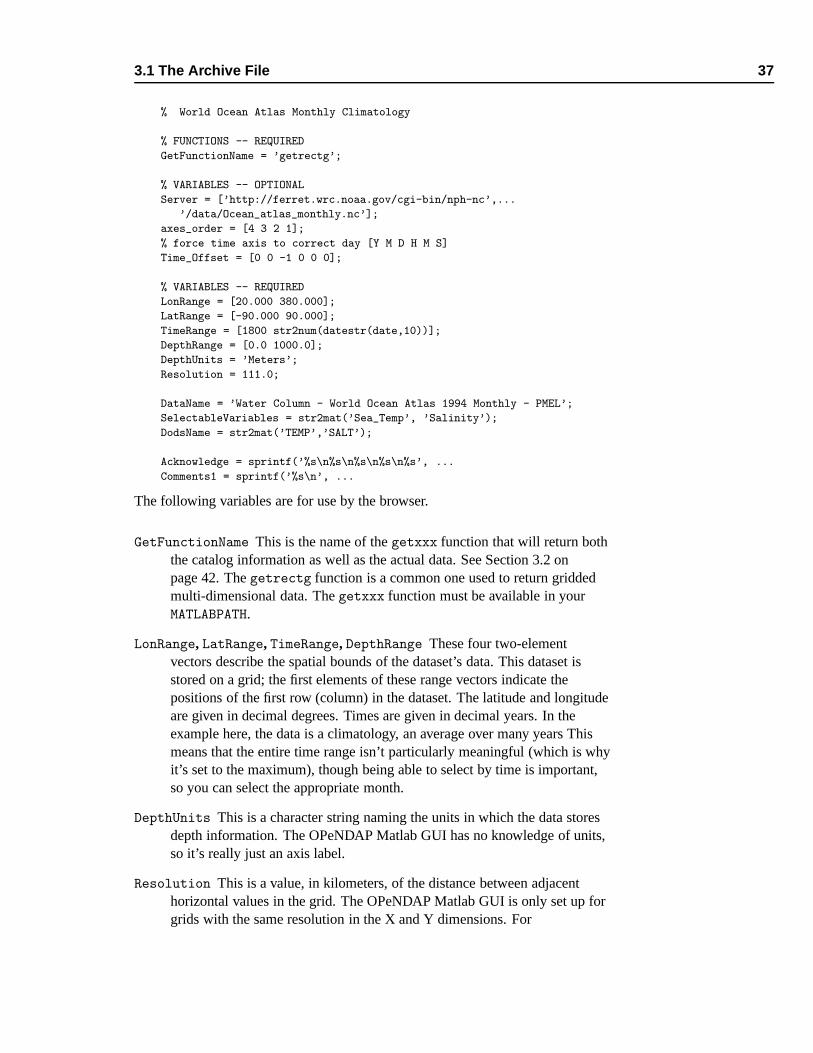
The following archive M-file describes the Levitus ocean atlas dataset. (You canfind it in the DATASETS directory, called woa94mon.m.) Many of the M-filesfollow the same basic structure. Most of the variables set here are necessary forthe operation of the browser. A few of them, however, are set only for theconvenience of the getxxx function (called getrectg here). If you have to writea new getxxx function, you may not need them.
3.1 The Archive File 37
% World Ocean Atlas Monthly Climatology
% FUNCTIONS -- REQUIRED
GetFunctionName = ’getrectg’;
% VARIABLES -- OPTIONAL
Server = [’http://ferret.wrc.noaa.gov/cgi-bin/nph-nc’,...
’/data/Ocean_atlas_monthly.nc’];
axes_order = [4 3 2 1];
% force time axis to correct day [Y M D H M S]
Time_Offset = [0 0 -1 0 0 0];
% VARIABLES -- REQUIRED
LonRange = [20.000 380.000];
LatRange = [-90.000 90.000];
TimeRange = [1800 str2num(datestr(date,10))];
DepthRange = [0.0 1000.0];
DepthUnits = ’Meters’;
Resolution = 111.0;
DataName = ’Water Column - World Ocean Atlas 1994 Monthly - PMEL’;
SelectableVariables = str2mat(’Sea_Temp’, ’Salinity’);
DodsName = str2mat(’TEMP’,’SALT’);
Acknowledge = sprintf(’%s\n%s\n%s\n%s\n%s’, ...
Comments1 = sprintf(’%s\n’, ...
The following variables are for use by the browser.
GetFunctionName This is the name of the getxxx function that will return boththe catalog information as well as the actual data. See Section 3.2 onpage 42. The getrectg function is a common one used to return griddedmulti-dimensional data. The getxxx function must be available in yourMATLABPATH.
LonRange, LatRange, TimeRange, DepthRange These four two-elementvectors describe the spatial bounds of the dataset’s data. This dataset isstored on a grid; the first elements of these range vectors indicate thepositions of the first row (column) in the dataset. The latitude and longitudeare given in decimal degrees. Times are given in decimal years. In theexample here, the data is a climatology, an average over many years Thismeans that the entire time range isn’t particularly meaningful (which is whyit’s set to the maximum), though being able to select by time is important,so you can select the appropriate month.
DepthUnits This is a character string naming the units in which the data storesdepth information. The OPeNDAP Matlab GUI has no knowledge of units,so it’s really just an axis label.
Resolution This is a value, in kilometers, of the distance between adjacenthorizontal values in the grid. The OPeNDAP Matlab GUI is only set up forgrids with the same resolution in the X and Y dimensions. For
38 Adding Your Own Datasets to the OPeNDAP Matlab GUI
georeferenced grids, the resolution refers to the distance between adjacentX values at the equator.
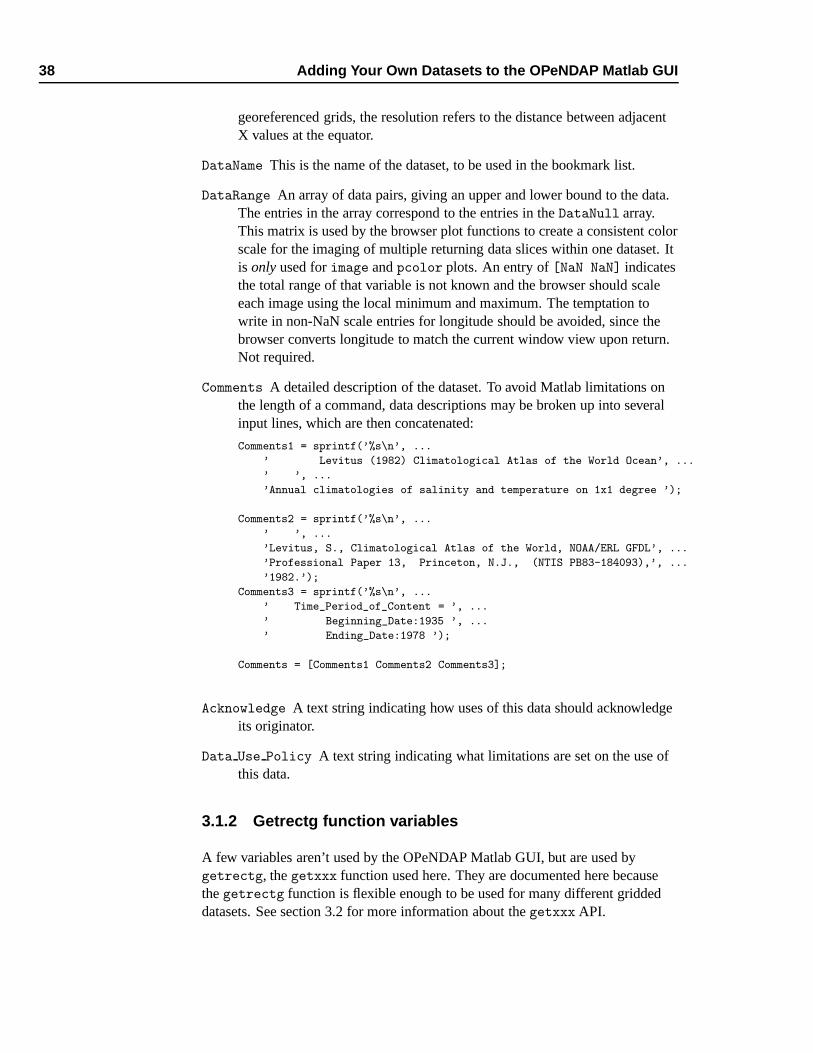
DataName This is the name of the dataset, to be used in the bookmark list.
DataRange An array of data pairs, giving an upper and lower bound to the data.The entries in the array correspond to the entries in the DataNull array.This matrix is used by the browser plot functions to create a consistent colorscale for the imaging of multiple returning data slices within one dataset. Itis only used for image and pcolor plots. An entry of [NaN NaN] indicatesthe total range of that variable is not known and the browser should scaleeach image using the local minimum and maximum. The temptation towrite in non-NaN scale entries for longitude should be avoided, since thebrowser converts longitude to match the current window view upon return.Not required.
Comments A detailed description of the dataset. To avoid Matlab limitations onthe length of a command, data descriptions may be broken up into severalinput lines, which are then concatenated:
Comments1 = sprintf(’%s\n’, ...
’ Levitus (1982) Climatological Atlas of the World Ocean’, ...
’ ’, ...
’Annual climatologies of salinity and temperature on 1x1 degree ’);
Comments2 = sprintf(’%s\n’, ...
’ ’, ...
’Levitus, S., Climatological Atlas of the World, NOAA/ERL GFDL’, ...
’Professional Paper 13, Princeton, N.J., (NTIS PB83-184093),’, ...
’1982.’);
Comments3 = sprintf(’%s\n’, ...
’ Time_Period_of_Content = ’, ...
’ Beginning_Date:1935 ’, ...
’ Ending_Date:1978 ’);
Comments = [Comments1 Comments2 Comments3];
Acknowledge A text string indicating how uses of this data should acknowledgeits originator.
Data Use Policy A text string indicating what limitations are set on the use ofthis data.
3.1.2 Getrectg function variables
A few variables aren’t used by the OPeNDAP Matlab GUI, but are used bygetrectg, the getxxx function used here. They are documented here becausethe getrectg function is flexible enough to be used for many different griddeddatasets. See section 3.2 for more information about the getxxx API.
3.1 The Archive File 39
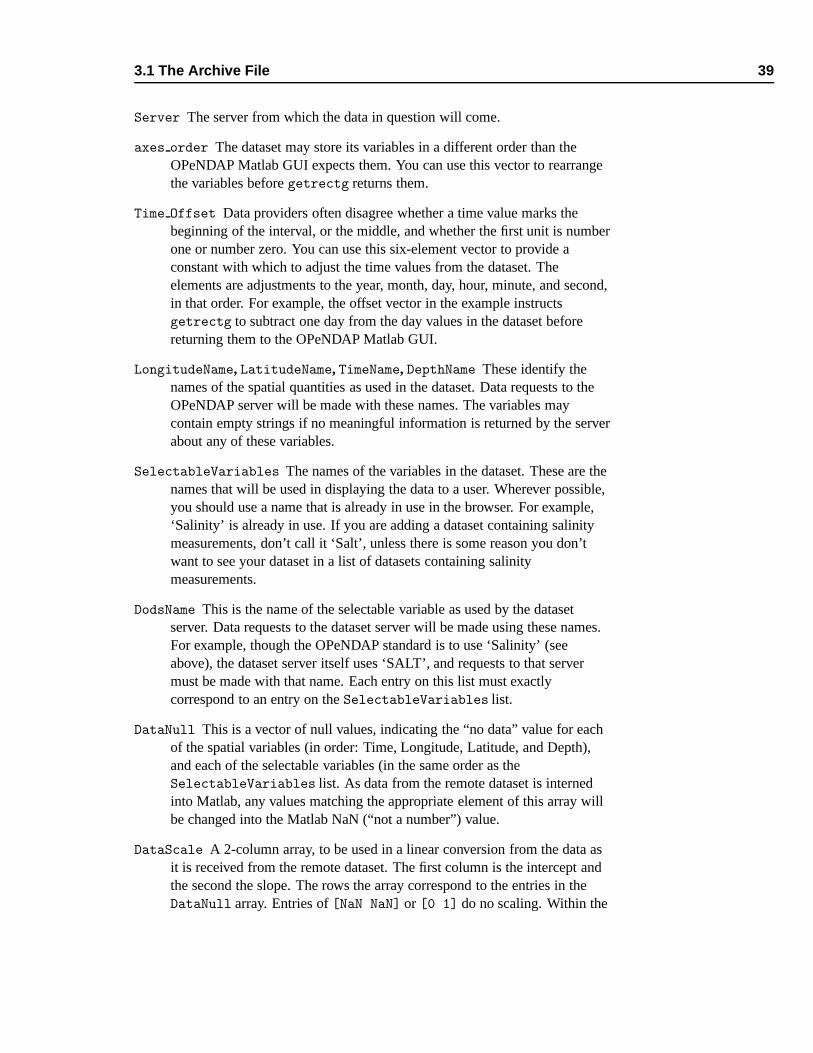
Server The server from which the data in question will come.
axes order The dataset may store its variables in a different order than theOPeNDAP Matlab GUI expects them. You can use this vector to rearrangethe variables before getrectg returns them.
Time Offset Data providers often disagree whether a time value marks thebeginning of the interval, or the middle, and whether the first unit is numberone or number zero. You can use this six-element vector to provide aconstant with which to adjust the time values from the dataset. Theelements are adjustments to the year, month, day, hour, minute, and second,in that order. For example, the offset vector in the example instructsgetrectg to subtract one day from the day values in the dataset beforereturning them to the OPeNDAP Matlab GUI.
LongitudeName, LatitudeName, TimeName, DepthName These identify thenames of the spatial quantities as used in the dataset. Data requests to theOPeNDAP server will be made with these names. The variables maycontain empty strings if no meaningful information is returned by the serverabout any of these variables.
SelectableVariables The names of the variables in the dataset. These are thenames that will be used in displaying the data to a user. Wherever possible,you should use a name that is already in use in the browser. For example,‘Salinity’ is already in use. If you are adding a dataset containing salinitymeasurements, don’t call it ‘Salt’, unless there is some reason you don’twant to see your dataset in a list of datasets containing salinitymeasurements.
DodsName This is the name of the selectable variable as used by the datasetserver. Data requests to the dataset server will be made using these names.For example, though the OPeNDAP standard is to use ‘Salinity’ (seeabove), the dataset server itself uses ‘SALT’, and requests to that servermust be made with that name. Each entry on this list must exactlycorrespond to an entry on the SelectableVariables list.
DataNull This is a vector of null values, indicating the “no data” value for eachof the spatial variables (in order: Time, Longitude, Latitude, and Depth),and each of the selectable variables (in the same order as theSelectableVariables list. As data from the remote dataset is internedinto Matlab, any values matching the appropriate element of this array willbe changed into the Matlab NaN (“not a number”) value.
DataScale A 2-column array, to be used in a linear conversion from the data asit is received from the remote dataset. The first column is the intercept andthe second the slope. The rows the array correspond to the entries in theDataNull array. Entries of [NaN NaN] or [0 1] do no scaling. Within the
40 Adding Your Own Datasets to the OPeNDAP Matlab GUI
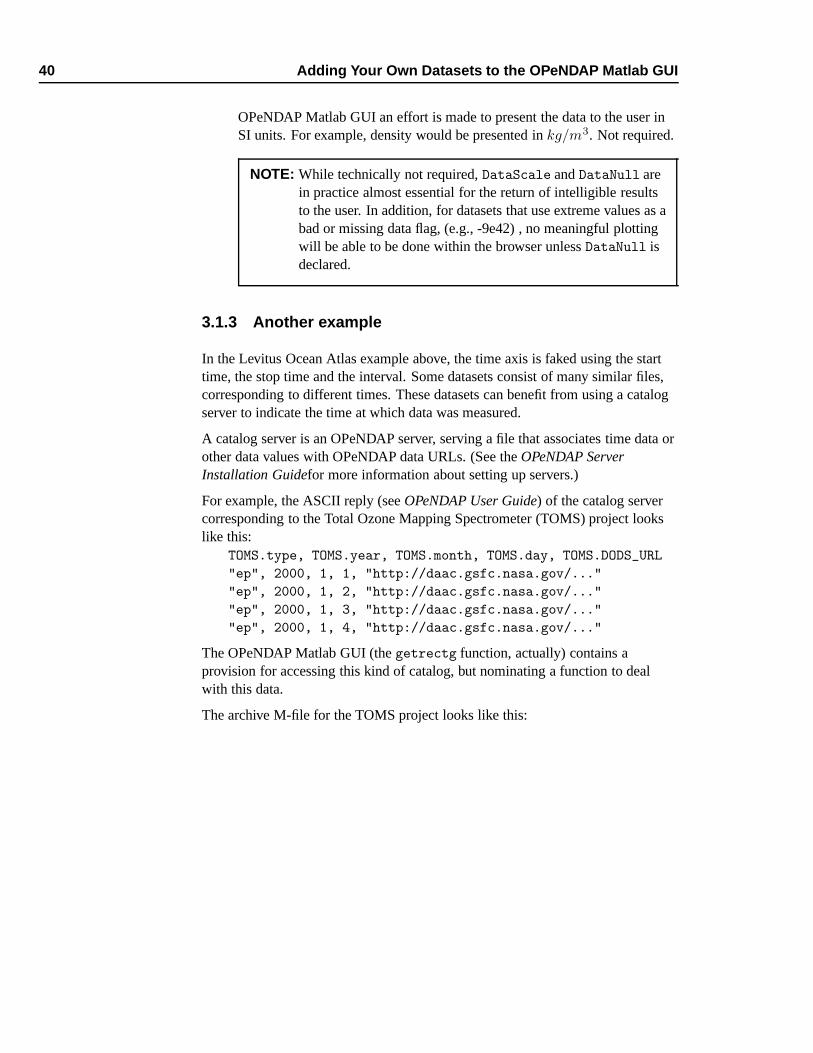
OPeNDAP Matlab GUI an effort is made to present the data to the user inSI units. For example, density would be presented in kg/m3. Not required.
NOTE: While technically not required, DataScale and DataNull arein practice almost essential for the return of intelligible resultsto the user. In addition, for datasets that use extreme values as abad or missing data flag, (e.g., -9e42) , no meaningful plottingwill be able to be done within the browser unless DataNull isdeclared.
3.1.3 Another example
In the Levitus Ocean Atlas example above, the time axis is faked using the starttime, the stop time and the interval. Some datasets consist of many similar files,corresponding to different times. These datasets can benefit from using a catalogserver to indicate the time at which data was measured.
A catalog server is an OPeNDAP server, serving a file that associates time data orother data values with OPeNDAP data URLs. (See the OPeNDAP ServerInstallation Guidefor more information about setting up servers.)
For example, the ASCII reply (see OPeNDAP User Guide) of the catalog servercorresponding to the Total Ozone Mapping Spectrometer (TOMS) project lookslike this:
TOMS.type, TOMS.year, TOMS.month, TOMS.day, TOMS.DODS_URL
"ep", 2000, 1, 1, "http://daac.gsfc.nasa.gov/..."
"ep", 2000, 1, 2, "http://daac.gsfc.nasa.gov/..."
"ep", 2000, 1, 3, "http://daac.gsfc.nasa.gov/..."
"ep", 2000, 1, 4, "http://daac.gsfc.nasa.gov/..."
The OPeNDAP Matlab GUI (the getrectg function, actually) contains aprovision for accessing this kind of catalog, but nominating a function to dealwith this data.
The archive M-file for the TOMS project looks like this:
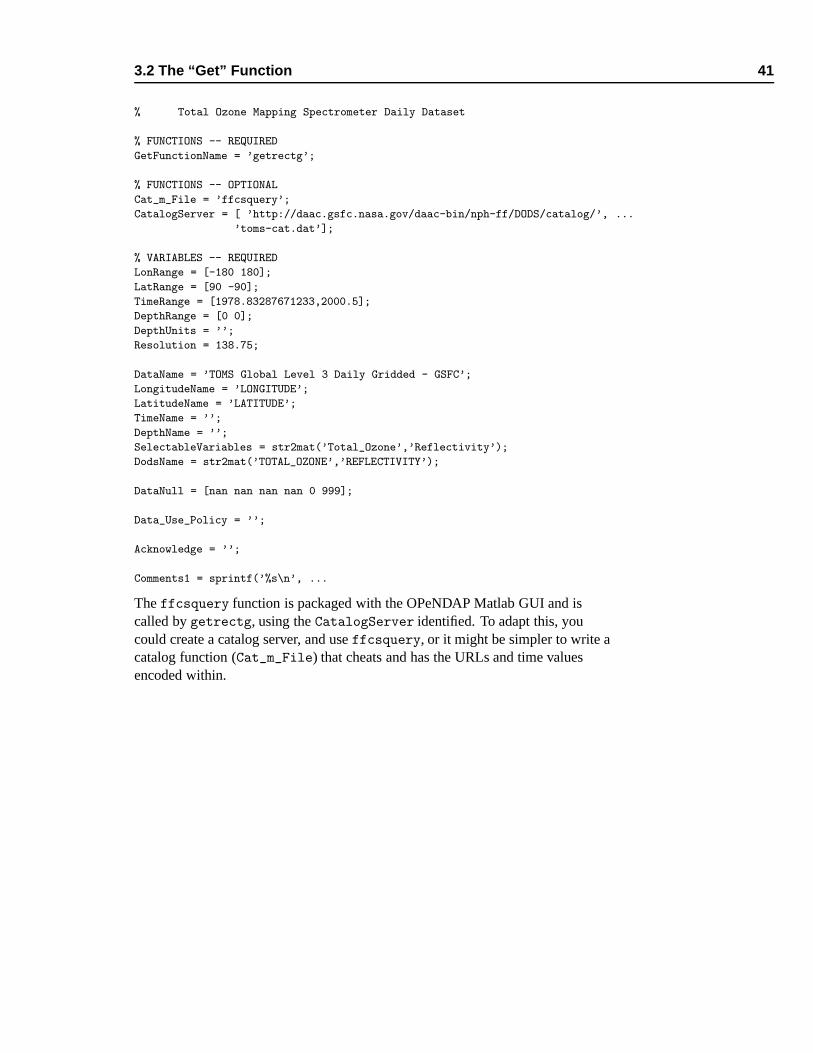
3.2 The “Get” Function 41
% Total Ozone Mapping Spectrometer Daily Dataset
% FUNCTIONS -- REQUIRED
GetFunctionName = ’getrectg’;
% FUNCTIONS -- OPTIONAL
Cat_m_File = ’ffcsquery’;
CatalogServer = [ ’http://daac.gsfc.nasa.gov/daac-bin/nph-ff/DODS/catalog/’, ...
’toms-cat.dat’];
% VARIABLES -- REQUIRED
LonRange = [-180 180];
LatRange = [90 -90];
TimeRange = [1978.83287671233,2000.5];
DepthRange = [0 0];
DepthUnits = ’’;
Resolution = 138.75;
DataName = ’TOMS Global Level 3 Daily Gridded - GSFC’;
LongitudeName = ’LONGITUDE’;
LatitudeName = ’LATITUDE’;
TimeName = ’’;
DepthName = ’’;
SelectableVariables = str2mat(’Total_Ozone’,’Reflectivity’);
DodsName = str2mat(’TOTAL_OZONE’,’REFLECTIVITY’);
DataNull = [nan nan nan nan 0 999];
Data_Use_Policy = ’’;
Acknowledge = ’’;
Comments1 = sprintf(’%s\n’, ...
The ffcsquery function is packaged with the OPeNDAP Matlab GUI and iscalled by getrectg, using the CatalogServer identified. To adapt this, youcould create a catalog server, and use ffcsquery, or it might be simpler to write acatalog function (Cat_m_File) that cheats and has the URLs and time valuesencoded within.
42 Adding Your Own Datasets to the OPeNDAP Matlab GUI
3.2 The “Get” Function
The getxxx function, another Matlab program, serves as the connection betweenthe OPeNDAP browser and individual datasets, hiding their idiosyncracies andproviding a uniform interface between the browser and the data. Some getfunctions may serve for more than one dataset, such as getrectg.m, a functionthat works for a number of gridded datasets. The getxxx function can be namedanything, but convention dictates that the name be of the form getxxx.m, whereThe browser uses the
getxxx function both toget data, and informationabout data.
xxx is some sequence of characters that indicates the dataset (or class of datasets)for which the getxxx function is used. Note that several getxxx functions areprovided with the OPeNDAP Matlab GUI; be careful to avoid those names.
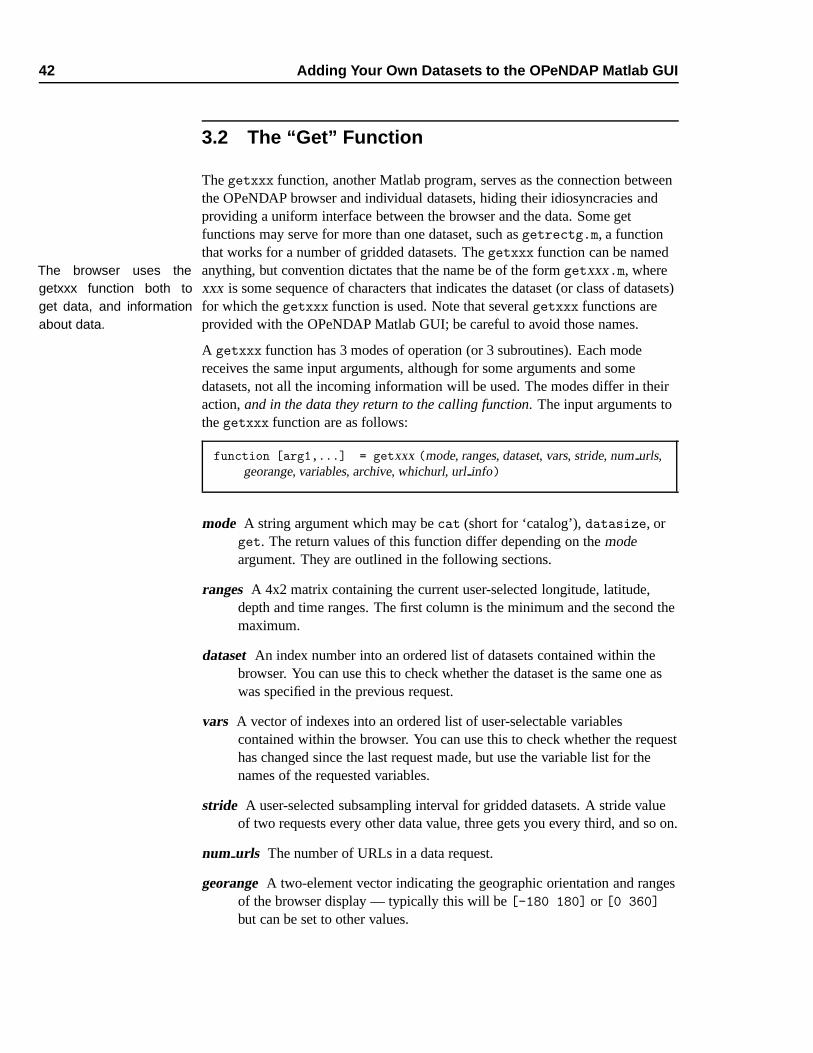
A getxxx function has 3 modes of operation (or 3 subroutines). Each modereceives the same input arguments, although for some arguments and somedatasets, not all the incoming information will be used. The modes differ in theiraction, and in the data they return to the calling function. The input arguments tothe getxxx function are as follows:
function [arg1,...] = getxxx (mode, ranges, dataset, vars, stride, num urls,georange, variables, archive, whichurl, url info)
mode A string argument which may be cat (short for ‘catalog’), datasize, orget. The return values of this function differ depending on the modeargument. They are outlined in the following sections.
ranges A 4x2 matrix containing the current user-selected longitude, latitude,depth and time ranges. The first column is the minimum and the second themaximum.
dataset An index number into an ordered list of datasets contained within thebrowser. You can use this to check whether the dataset is the same one aswas specified in the previous request.
vars A vector of indexes into an ordered list of user-selectable variablescontained within the browser. You can use this to check whether the requesthas changed since the last request made, but use the variable list for thenames of the requested variables.
stride A user-selected subsampling interval for gridded datasets. A stride valueof two requests every other data value, three gets you every third, and so on.
num urls The number of URLs in a data request.
georange A two-element vector indicating the geographic orientation and rangesof the browser display — typically this will be [-180 180] or [0 360]
but can be set to other values.
3.2 The “Get” Function 43
variablelist A character array of the variable names selected by the user.
archive The name of the archive.m file for the selected dataset.
whichurl – For a “catalog” mode request, this is a structure containinginformation about the data to be found at the URL. For a “get” moderequest, this is an index into a list of URLs that comprise a data request. Thelist will have been returned by a cat mode request to the getxxx function.
In some modes, a particular input argument will not contain valid information.For example, the input number of URLs is not valid for a catalog request, sincepart of the function of the catalog mode is to determine the number of URLsneeded to satisfy a request. However, all arguments are passed in each time for thesake of consistency.
3.2.1 getxxx Function Modes
The getxxx function operates in three different modes. One mode returns URLscorresponding to a dataset, another returns estimates of the request size, and thethird actually retrieves data. The following sections describe the three modes.
Catalog mode
In catalog mode (or cat mode) the browser is requesting information aboutlocation in time and space of the indicated dataset. The function takes the location Catalog mode is for de-
termining the location of adataset in space and time.
of an indicated geo-spatial region (using the ranges matrix), and returns a list ofthe points where the queried dataset contains data.
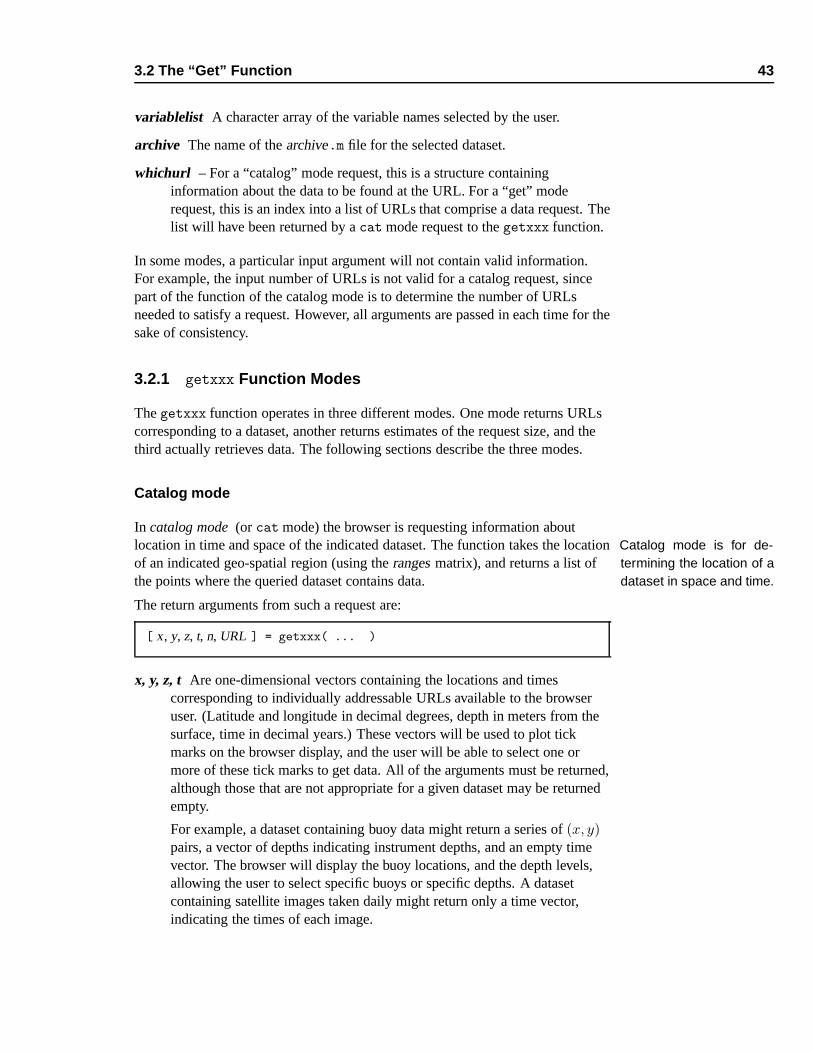
The return arguments from such a request are:
[ x, y, z, t, n, URL ] = getxxx( ... )
x, y, z, t Are one-dimensional vectors containing the locations and timescorresponding to individually addressable URLs available to the browseruser. (Latitude and longitude in decimal degrees, depth in meters from thesurface, time in decimal years.) These vectors will be used to plot tickmarks on the browser display, and the user will be able to select one ormore of these tick marks to get data. All of the arguments must be returned,although those that are not appropriate for a given dataset may be returnedempty.
For example, a dataset containing buoy data might return a series of (x, y)pairs, a vector of depths indicating instrument depths, and an empty timevector. The browser will display the buoy locations, and the depth levels,allowing the user to select specific buoys or specific depths. A datasetcontaining satellite images taken daily might return only a time vector,indicating the times of each image.
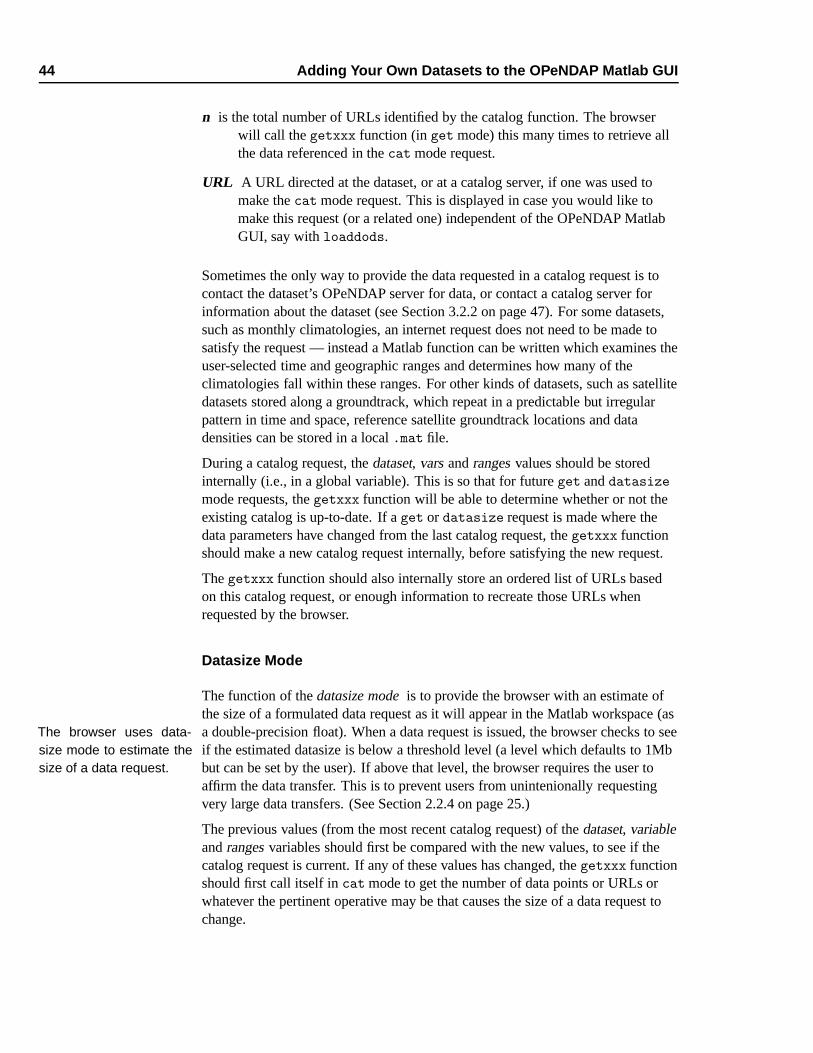
44 Adding Your Own Datasets to the OPeNDAP Matlab GUI
n is the total number of URLs identified by the catalog function. The browserwill call the getxxx function (in get mode) this many times to retrieve allthe data referenced in the cat mode request.
URL A URL directed at the dataset, or at a catalog server, if one was used tomake the cat mode request. This is displayed in case you would like tomake this request (or a related one) independent of the OPeNDAP MatlabGUI, say with loaddods.
Sometimes the only way to provide the data requested in a catalog request is tocontact the dataset’s OPeNDAP server for data, or contact a catalog server forinformation about the dataset (see Section 3.2.2 on page 47). For some datasets,such as monthly climatologies, an internet request does not need to be made tosatisfy the request — instead a Matlab function can be written which examines theuser-selected time and geographic ranges and determines how many of theclimatologies fall within these ranges. For other kinds of datasets, such as satellitedatasets stored along a groundtrack, which repeat in a predictable but irregularpattern in time and space, reference satellite groundtrack locations and datadensities can be stored in a local .mat file.
During a catalog request, the dataset, vars and ranges values should be storedinternally (i.e., in a global variable). This is so that for future get and datasize
mode requests, the getxxx function will be able to determine whether or not theexisting catalog is up-to-date. If a get or datasize request is made where thedata parameters have changed from the last catalog request, the getxxx functionshould make a new catalog request internally, before satisfying the new request.
The getxxx function should also internally store an ordered list of URLs basedon this catalog request, or enough information to recreate those URLs whenrequested by the browser.
Datasize Mode
The function of the datasize mode is to provide the browser with an estimate ofthe size of a formulated data request as it will appear in the Matlab workspace (asa double-precision float). When a data request is issued, the browser checks to seeThe browser uses data-
size mode to estimate thesize of a data request.
if the estimated datasize is below a threshold level (a level which defaults to 1Mbbut can be set by the user). If above that level, the browser requires the user toaffirm the data transfer. This is to prevent users from unintenionally requestingvery large data transfers. (See Section 2.2.4 on page 25.)
The previous values (from the most recent catalog request) of the dataset, variableand ranges variables should first be compared with the new values, to see if thecatalog request is current. If any of these values has changed, the getxxx functionshould first call itself in cat mode to get the number of data points or URLs orwhatever the pertinent operative may be that causes the size of a data request tochange.
3.2 The “Get” Function 45
The return arguments from a datasize request are:
[ datasize, num urls ] = getxxx [ ... ]
datasize The approximate size (in megabytes) of the data that will be returned bythe specified data request.
num urls The number of URLs in the request. (This is in case a new catalogrequest was required during the datasize request. If no new catalogrequest was required, the input num urls argument can simply be returned.)
Get Mode
The get mode request (also “data request”) queries the remote dataset for data.The browser makes a datasize request before each data request, and a cat And the get mode is for
getting data.request before each datasize request. This series is to be repeated if the userchanges any of the search parameters, like the geographic ranges or times.
The data request therefore need only operate on the ordered list of URLsgenerated by the most recent cat request — the browser simply increments theurl index number from one to the total number of URLs and waits for each result.However because the input information from the browser (such as the text list ofselected variables) is passed in each time, the getxxx function does not actuallyhave to construct a URL until this point1.
Sometimes it is appropriate to return a count of one URL to the browser whileactually using more than one, internally. This can occur when, for example, theuser requests all data from longitudes 40W to 40E from a gridded dataset withglobal coverage but the grids are stored with a split at 20E (that is, the longitude inthe dataset ranges from 20E to 380E). The getxxx function in this case musteither transfer the whole dataset, then subset and reformat it, or dereference twoURLs, one from 40W to 20E and one from 20E to 40E, and combine the result. Inother words, the number of derefernced URLs returned by the getxxx functionshould match what the browser expects based on the result of the catalog moderequest.2
The data should be scaled according to the DataScale information in thearchive.m file before being returned.
The return arguments from the get mode are as follows:
[ data, sizes, names, index, URL ] = getxxx[ ... ]
1This is a time-saver. It is not necessary to construct URLs that won’t be used.2If, on the other hand, the catalog function returned a count of two URLs for this particular
request, those URLs should be dereferenced and the results returned to the browser separately.

46 Adding Your Own Datasets to the OPeNDAP Matlab GUI
data is a M × 1 vector of data, where M is the total number of datameasurements returned. That is, all the data are reshaped to a singlecolumn, with their original sizes recorded in the ’sizes’ argument.
sizes is an N × 2 array of array dimensions, indicating the sizes of the returnedarrays. This requirement must be met: sum(sizes(:,1).*sizes(:,2))= M.
names is a list of character strings with the same number of rows as sizes —each variable as it is unpacked will be given the corresponding name. Thecurrent convention is to rename returning variables with the common namesused in the browser. If ‘Longitude’ and ‘Latitude’ (exactly so) are notpresent, the browser will not allow plotting on the browse window. Some ofthe getxxx functions now written wll create longitude and latitude vectorsfor gridded datasets using the information in the archive M-files. This is anoccasionally useful tactic for troublesome datasets.
NOTE: For the benefit of Matlab Version 4 users, variable namesshould be no longer than 19 characters.
index The index number is the index into this list:
Time
Longitude
Latitude
Depth
SelectableVariables[1]
.
.
.
SelectableVariables[n]
The browser uses this index into the DataRange array in the archive.m filefor mapping multiple images within the same dataset to a unified colorscale, and into the DataScale array for scaling the returned data.
URL This variable should contain the URL dereferenced to retrieve the dataprovided as a result of the get request.
This variable is to be a single string — if several URLs have actually beendereferenced to satisfy what the browser has treated as a single URL, theyshould all be included, concatenated end-to-end, each separated by a space,i.e.:
If TimeName in the archive.m file is empty because the server doesn’t actuallyreturn a time, you can insert a time made up from the catalog request. However
3.2 The “Get” Function 47
this is not required; every getxxx function should be able to handle emptyvariables correctly.
If any of the variable names resulting from dereferencing a URL is longer than 19characters, the data contained in that variable must be requested separately forMatlab 4 users and the result mapped to the first 19 characters of that variable.That is, you must first do:
loaddods(URL)
then
[longname(1:19)] = loaddods(URL);
This is a workaround for a bug concerning long variable names interned intoMatlab v4.
3.2.2 getxxx Function Tools
OPeNDAP provides several tools with which to construct your getxxx function.The tools fall into two broad classes:
➼ loaddods, the function used to dereference an OPeNDAP URL, and
➼ a set of Matlab utility functions, useful for the sorts of operations likely tobe needed by a getxxx function.
The loaddods Function
The loaddods3 function is the OPeNDAP client for the Matlab browser. The loaddods is at the heart ofevery getxxx function.function accepts a URL from the user, sends it out over the internet, and creates
Matlab scalars, vectors, and matrices to hold the data that is returned from thatrequest. The loaddods.m help file contains several examples of its use. (Typehelp loaddods at the Matlab command prompt.)
The function is called like this:
function values = loaddods([switches,] URL [per-url switches] [,
URL [per-url switches]])
switches These options are all off by default except for -v which is on by default.
-v: Verbose output. (This option is on by default; use +v to disable it).
3loaddods is a Matlab MEX-file, and appears in your directories as loaddods.mexxxx,where xxx is a suffix defined by Matlab for a particular machine architecture. For example,loaddods.mexglx would be for a GNU/Linux machine. There is also a loaddods.m function,which contains a help message for loaddods.
48 Adding Your Own Datasets to the OPeNDAP Matlab GUI
-g: Use the Tcl/Tk progress and error reporting GUI. (This displays a bargraph showing transmission activity, and is not to be confused withthe OPeNDAP Matlab GUI. See OPeNDAP User Guide for moreinformation about this feature.).
-k: This switch causes loaddods to concatenate two or more variableswith same name. When reading from multi-file datasets, use thisoption to concatenate the values read from several accesses into asingle Matlab variable. This is intended for getxxx functions whichbuild up lists of URLs and pass them to loaddods for evaluation.
You must supply the URLs whose variables are to be concatenated ina single invocation of loaddods. The -k switch will not work acrosstwo or more calls to loaddods. That is,
loaddods(’-k’, ’<URL1> <URL2’)
will work, while calling loaddods twice with -k (once for URL1 andonce for URL2) won’t work.
-n: This command switch causes Matlab variable names to be built usingthe complete name of the variable, including all the constructor typeswhich contain it. Without -n, variables are named using the name ofthe leaf variable. This means, for example, that two separateStructures who each happen to have a member with the same namewill create a name conflict.
-s: Return a vector of variable names along with the variables themselves.The -s option can only be used when assigning the values accessed byloaddods to a vector. If -s is used in this situation, then the firstvariable in the vector will be set to a vector of strings which name thesuccessive variables.
-V: Print version information for loaddods and any programs it uses.
-t[abclmpstu]: Enable HTTP tracing (only for the hardcore...).
-F: Force all string variables to be translated to float. The -F option isneeded when reading from datasets that return as string values thatshould be interned as numbers.
CAUTION: This is a change from previous versions of loaddodsand introduces potential incompatibilities withversion 1.5 and prior. In other words you’ll need tochange your software if it used version 1.5 or earlier.
-p: Recognize the DDMMSS strings and convert them (takes precedenceover -F).
-A: The -A option provides a way to access the DAS object of a dataset.Given with a URL, -A will cause all attributes to be interned in theMatlab workspace. Given with -c only the contents of named
3.2 The “Get” Function 49
attribute container4 in a dataset will be interned. The latter is muchsafer since many DAS objects contain long names and names thatrepeat in several containers. Choosing an attribute container known tohave ‘Matlab safe’ identifiers is a good idea. (See OPeNDAP UserGuide for more information about the DAS structure, and attributes ingeneral.) Note that the attributes are interned into the Matlabworkspace under their own names, not the name of the container5 .
NOTE: While DAS objects are separate from the DDS (data)objects in OPeNDAP, once loaddods reads theinformation from the writeval client program they aretreated no differently than data objects. Each attributecontainer is interned as if it was a Structure variable in theDDS object.
per-url switches These options are all off by default.
-r var:new name .: Rename a variable. The -r option provides a way torename variables so that variables read will not overwrite ones alreadypresent in a Matlab session.
-c expr : Supply a constraint without using the ? notation.
URL The loaddods function should be called with a OPeNDAP URL whichreferences data, in which case the command will access the dataset andcreate Matlab data structures to hold those data. If the URL argument is a *or ?, loaddods will cause Netscape to start up and open the defaultOPeNDAP URL-builder. If the * or ? is followed by a URL, then that URLwill be used instead of the URL builder. Finally, when called without anargument, the command will wait for a URL to be passed to it by Netscapeor another program6.
loaddap
The loaddods function is at the core of the OPeNDAP Matlab GUI. However, forbackwards compatibility, it was originally written not to take advantage of theadvanced data structures now available in Matlab. The loaddap function is anewer version, that makes use of Matlab data structures in an attempt to preservethe structure of datasets.
For example, if the target dataset contains three arrays in a structure, theloaddods function will bring them in as three arrays. The loaddap function will
4Note the distinction between attributes and attribute containers. A variable called “v” in somedataset will correspond to an attribute container called “v” in the dataset’s DAS. That container maycontain attributes such as “precision” or “scale factor” or “units.”
5This is due to the variable name length limitations of Matlab.6See the OPeNDAP urlqueue program for information about this feature.
50 Adding Your Own Datasets to the OPeNDAP Matlab GUI
import the data as three arrays in a structure, corresponding to the originalarrangement.
The use of loaddap is identical in all other respects to loaddods.
If you find that the OPeNDAP Matlab GUI is more work than is necessary foryour application, and you use the command-line client, you might consider usingloaddap.
Utility Functions
Several functions used in the OPeNDAP Matlab GUI are general enough to be ofuse to people who have to write new getxxx functions7 . This section contains ashort list of some of the functions likely to be useful. The list is not complete,since the whole collection is fairly fluid, as new datasets are constantly beingThese functions have
been useful in writing thegetxxx functions providedwith the GUI. They maybe useful to you, too.
added to the archive. We encourage function writers to browse the OPeNDAPMatlab GUI directories before starting in on what may seem like a commonproblem.
Many of the utility functions are listed below. Use the Matlab help command fordetails of their invocation.
day2year Converts an integer day into a decimal year.
dods dbk Removes trailing blanks from a string, and translates http escapesequences (e.g. %20) into underscores, so that Surface%20Temperaturegets translated into Surface Temperature.
dods ddt (“de-dot”) Removes the parent structure name from compound names.For example, Cast.Temperature is changed to Temperature. Actually, itremoves all of a string up to and including the right-most period.
findnew This function returns the position of non-duplicate data in a vector. It isuseful for pruning duplicate information from a string or vector.
isleap Accepts an integer year AD, and returns 1 if it is a leap year according toPope Gregory’s newfangled calendar.
mminmax Finds the minimum and maximum of a vector or a matrix, and returnsthem in a two-element vector. The function is robust with respect to NaN.
strntok Given a string and a token separator, quickly extracts tokens from shortinput strings.
7The OPeNDAP Matlab GUI is divided into two directories: the main directory, typically calledsomething like ml-toolbox, and the DATASETS subdirectory contained in it. Roughly speaking,the operational division between these two directories is between the generally useful functions anddataset-specific functions. If a function written for a specific dataset appears to be useful for otherdatasets, it will be “elevated” to the main directory.
3.3 Adding a New Dataset 51
year2day Converts a decimal year into an integer day. (Note that 1985.0 willreturn day 0. To convert to the more common calendrical representation,where days are numbered from one, you must add one to the returned dayinteger.)
3.3 Adding a New Dataset
Here’s an example of how to add a gridded dataset to the OPeNDAP Matlab GUI.
We start with just a URL:http://ferret.pmel.noaa.gov/cgi-bin/dods/nph-dods/data/
PMEL/large_trenberth_moncl.nc’;
We will do this iteratively, improving our archive M-file as we go. For the firststep, we’ll use the following. (We’ve shortened the URL here for formattingreasons. Use the whole URL shown above.)
GetFunctionName = ’getrectg’;
Server = ’http://ferret.pmel.noaa.gov/...
LonRange = [-180 180];
LatRange = [-90 90];
TimeRange = [1800.0 2000.0];
DepthRange = [0.0 0.0];
Resolution = NaN;
DataName = ’Trenberth Wind Stress - PMEL’;
SelectableVariables = str2mat(’Wind Stress U’, ’Wind Stress V’);
It’s missing the DodsName variable, but we can find that information usingloaddods. At the Matlab command line, type:
DAS =loaddods(’-A’,’http://ferret.pmel.noaa.gov/... ’)
You can look at the DAS variable now, and you’ll see a TAUX and a TAUY, so thosemust be the names for the stresses.
So we’ll add the following to the bottom of our tentative archive M-file:
DodsName = str2mat(’TAUX’, ’TAUY’);
Now open the bookmarks editor (control-B is a shortcut), select a wind datasetand copy and paste it to get a copy. Open the properties editor for the new entry,and erase the name and archive. Pick a new color, too. Click Apply to make the
changes in the bookmarks, and Reload to force the old archive files to be cleared,and to be reread, along with this new archive. The dataset name should be filled inautomatically with the information from the new (but still tentative) archiveM-file.
52 Adding Your Own Datasets to the OPeNDAP Matlab GUI
Now click OK to dismiss the properties dialog. Once back in the bookmarkeditor window, Save (and apply to the GUI) and Close.
Once back in the browser window, select the new dataset. Select the entire timerange and click Get Details . You can examine the URLlist returned, and you’llsee that the URL returned has only twelve data points in the time dimension. Thiswould imply that this is a climatology, containing monthly averages.
http://ferret.pmel.noaa.gov/...?TAUX[0:1:11][0:1:72][0:1:143]...
We still don’t know the resolution or actual geographic extent, but we can correctthe original guess for TimeRange. Substitute the following line for the originaltime range guess:
TimeRange = [1800 str2num(datestr(date,10))];
To update the bookmarks, you can press Ctrl-B to bring up the bookmarks editor,select the new dataset, Ctrl-I to get the properties editor, Press Reload/Clear , thenOK to dismiss this window, Ctrl-S to save the bookmarks and apply them to the
GUI again.
Now select June 1947 and Wind Stress U and V and click Get Details . You willprobbaly need to identify the axes again because reloading the archive clears thecached metadata. Check the URL again, and you’ll see the time slice which isselected in the URL:
http://ferret.pmel.noaa.gov/...?TAUX[5:1:5][0:1:72][0:1:143]...
Month 5 (starting at zero) is June, so the time axis is set correctly. Had it not been,we could use the Time-Offset feature of getrectg to correct it.
Now we can click Get Data . Go with the default plot option, and you’ll see thatthe extent of the dataset is indeed global.
To figure out the resolution, type this at the Matlab command prompt:
>> diff(R1_Latitude)
This gives a value of 2.5 (so does the same test with Longitude), so we’ll replacethe Resolution line in the archive file with this one (111 km is the distance of onedegree of longitude at the equator):
Resolution = 2.5*111;
To reload the new file, hit Ctrl-B to get the bookmarks editor, Ctrl-I get theproperties, ’Reload/Clear’ one more time, dismiss the properties, Ctrl-S, save andclose. Select the new dataset, reselect June 1947, and this time, a Resolution of555.0 km. Click Get Data , re-identify the axes one last time when prompted, andchange the quiver plot color to ’r’ (red). Select “overplot” to plot on top of theprevious ploy, and you’ll see that the scaling is now different. But you also seethat you have every other data point and they are also clearly one per 5 degrees, sothe addition has been a success.
AGetting Started with the OPeNDAP
Matlab GUI SoftwareThis appendix contains instructions for acquiring the OPeNDAP Matlab GUIsoftware. It also contains instructions for a quick start, in case you feel like divingin without reading the rest of this document. If you are very familiar with Matlab,this may be just fine.
The OPeNDAP Matlab GUI consists of the following pieces:
Program Files These are the M-files and data for the browser itself. These areusually stored in a single directory (the “Matlab directory”) that must beaccessible on the Matlab path. These files are the same on all platforms.
Archive Files M-files describing the data archives accessible to the browser.These are found in the DATASETS subdirectory of the Matlab directory. Youcan add your own files to the browser by adding M-files to this directory.(See page 51) These files are the same on all platforms.
Helper Programs Three helper programs: loaddods, writeval, and geturl.These programs are part of the DODS “Matlab Client” distribution. Thedirectory with loaddods in it must be on the Matlab path, and the directorywith writeval and geturl in it must be on the shell’s $PATH. These programsdiffer among platforms. You must either retrieve and compile the sourcedistribution, or make sure to secure the binary distribution appropriate forthe computer you are using.
In addition to these programs, you will need a copy of the GNU gzip utility touncompress the archives. The OPeNDAP Home page contains links to anup-to-date version of that utility.
The OPeNDAP Matlab GUI does not come with Matlab itself. You will have tosecure a copy of Matlab in order to run any of this.
54 Getting Started with the OPeNDAP Matlab GUI Software
A.1 Getting the OPeNDAP Matlab GUI Software
All the OPeNDAP software can be downloaded from OPeNDAP Home page,which has a link at the top reading Download . Click there and follow thedirections.
A.2 Unpacking the OPeNDAP Matlab GUI Software
Once you have the files downloaded they must be uncompressed with the gzipprogram, and un-tarred with the tar program. The following command executesboth at the same time:
gzip -d -c GUI-stuff.tar.gz | tar -xvf -
or, if you use GNU tar:
tar -xvzf GUI-stuff.tar.gz
Move to the directory where you wish to store the OPeNDAP Matlab GUI, repeatthis for each tar file you need to install.
If you are installing this software from a binary distribution, you may move on tothe next section, Section A.3 on page 55.
After the tar files have been unpacked, set the $DODS ROOT environmentvariable. The way to do this will differ depending on the shell you use1. For cshand tcsh, use:
setenv DODS_ROOT /usr/local/OPD-2.8
(Make sure to use the correct version number.) For ksh and bash, use:
export DODS_ROOT=/usr/local/OPD-2.8
After you have set the environment variable (this might be a good time to add thevariable definition to your .login, .cshrc or .profile initialization file), finishthe configuration with the following shell commands:
cd $DODS_ROOT
./configure
make
make install
If you already have some OPeNDAP software installed on your system, and aresimply adding the Matlab functions, you need not execute configure and make
1Type echo $SHELL to find out which shell is active on your system.
A.3 Installing the OPeNDAP Matlab GUI Software 55
in the $DODS ROOT directory, but can change your directory to the$DODS_ROOT/src/matlab-GUI directory, and run configure and make
install there.
A.3 Installing the OPeNDAP Matlab GUI Software
To run the OPeNDAP Matlab GUI, change your working directory to thedirectory where the OPeNDAP Matlab GUI files are kept($DODS ROOT/bin/matlab-gui), and start Matlab. Then issue the browsecommand. In order to run the OPeNDAP Matlab GUI from other directories, youonly need to set three environment variables:
➼ Be sure that the $DODS ROOT environment variable is set, as described inSection A.2 on page 54.
➼ The $PATH environment variable must include an entry for the$DODS ROOT/bin directory containing the writeval and geturl
programs.
➼ The $MATLABPATH environment variable must include entries for thedirectories containing the Matlab client program (loaddods), the browserprograms and data, as well as the directory containing the data archive files.These are usually $DODS ROOT/bin, $DODS ROOT/matlab-GUI and$DODS ROOT/matlab-GUI/DATASETS2
If you didn’t do it before, put these variable definitions into your shell’sinitialization file (.login, .profile, bashrc or whatever), so you won’t have toset them by hand.
You are now ready to run the OPeNDAP Matlab GUI. Simply start Matlab, andtype ’browse’ at the prompt to see the browser window appear:
>> browse
2If you prefer, you can set the Matlab search path from within Matlab with the path() oraddpath commands. You can put this command into a startup.m file to set the path automati-cally.
56 Getting Started with the OPeNDAP Matlab GUI Software
A.4 The Archive Files
The OPeNDAP Matlab GUI software is not updated as frequently as are thearchive M-files in the central DODS directory. This means that it is generally agood idea to issue an “update all” command ( Get All on the Update menu) soonafter you complete the installation. This is also a good test of the installation.
Index
AAcknowledgements
button, 20Add New Plot
button, 30Apply and Close
button, 31Apply to All
menu, 30Apply to GUI
button, 31archive M-files, 15avhrr.pal
changing, 28
Bbookmark list
updating, 23updating local, 23
Bookmarksmenu, 30
bookmarks, 15editing, 16
buttonAcknowledgements, 20Add New Plot, 30Apply and Close, 31Apply to GUI, 31Cancel, 31Clear Display, 25Clear Selection, 21
Color, 26Copy, 32Cut, 32Delete All Plots, 30Delete Plot, 30Fontsize, 26Get Data, 20Get Data Threshold, 25Get Details, 20Insert New, 32Load Palette, 26Load Prefs File, 29Messages, 25Next Plot, 20Open Bookmarks File, 30Paste, 32Properties, 32Quit, 21Reset Display, 25Reset to Master List, 31Save, 26Save As, 29, 31Select All, 32Set Data Range, 19Set GUI Server, 28Start Longitude, 25Time, 25Undo, 31Use Defaults, 29View Plot, 20View Text, 20Zoom, 19
58 INDEX
Zoom Out, 25
CCancel
button, 31catalog mode, 43Clear Display
button, 25Clear Rxx˙ from workspace
menu, 22Clear Selection
button, 21Color
button, 26colormap
changing default, 28Copy
button, 32Cut
button, 32
DData
menu, 21data
saving, 14data structure
preserving, 49dataset list
updating, 15, 23updating local, 23, 51
datasize mode, 44Delete All Plots
button, 30Delete Plot
button, 30dialog
Data Display, 22Display
menu, 24Display Data
menu, 30DODS Help
menu, 29
EEdit
menu, 31Edit Bookmarks
menu, 22editing
bookmarks, 16
FFile
menu, 30Find
menu, 23Fontsize
button, 26
GGet Data
button, 20Get Data Threshold
button, 25Get Details
button, 20
IInsert New
button, 32
LLoad Palette
button, 26Load Prefs File
button, 29loaddap, 49loaddods
pitfalls, 14loaddods, 11local bookmark list
updating, 23local dataset list
updating, 23, 51
INDEX 59
MMANIFEST, 23menu
Apply to All, 30Bookmarks, 30Clear Rxx˙ from workspace, 22Data, 21Display, 24Display Data, 30DODS Help, 29Edit, 31Edit Bookmarks, 22File, 30Find, 23Open Bookmarks File, 22Plot Acquired Rxx, 22Preferences, 25Resolution, 23Show Data Bookmarks, 21Update Bookmarks, 23View, 32
Messagesbutton, 25
metadata, 15
NNext Plot
button, 20
OOpen Bookmarks File
button, 30menu, 22
PPaste
button, 32Plot Acquired Rxx
menu, 22Preferences
menu, 25Properties
button, 32
QQuit
button, 21
RReset Display
button, 25Reset to Master List
button, 31Resolution
menu, 23
SSave
button, 26Save As
button, 29, 31saving your data, 14search
text, 23Select All
button, 32Set Data Range
button, 19Set GUI Server
button, 28Show Data Bookmarks
menu, 21Start Longitude
button, 25structure
preserving, 49
Ttext
search, 23Time
button, 25typographic conventions, v
UUndo
button, 31
60 INDEX
Update Bookmarksmenu, 23
updatingbookmark list, 23dataset list, 15, 23local bookmark list, 23local dataset list, 23, 51
Use Defaultsbutton, 29
VView
menu, 32View Plot
button, 20View Text
button, 20
Wwindow
Data Display, 22
ZZoom
button, 19zoom
usage, 9, 19Zoom Out
button, 25


