108
Annual Report 2016 Steadfast Group Limited 343 insurance brokerages 1,146 offices 22 underwriting agencies 6 complementary businesses
Annual Report2016
Steadfast Group Limited
343 insurance brokerages1,146 o�ces22 underwriting agencies6 complementary businesses

2
One Vision
Steadfast Group Annual Report 2016
Scale & Diversity 02
Our 20 Year Journey 04
Financial Highlights 06
Message from the Chairman 07
Message from the Managing Director & CEO 08
Steadfast Network 10
Steadfast Underwriting Agencies 12
Steadfast Technologies 14
Social Awareness 16
Board of Directors 17
Senior Management Team 18
Chief Financial Officer Report 20
2016 Financial Report 22
Scale & DiversitySteadfast benefits from having scale and a diversified business model. What unites the Group is one common vision revolving around being stronger together.
Steadfast Group Annual Report 2016
5
by GWP
2012 2013 2014 2015 2016
by number of brokers
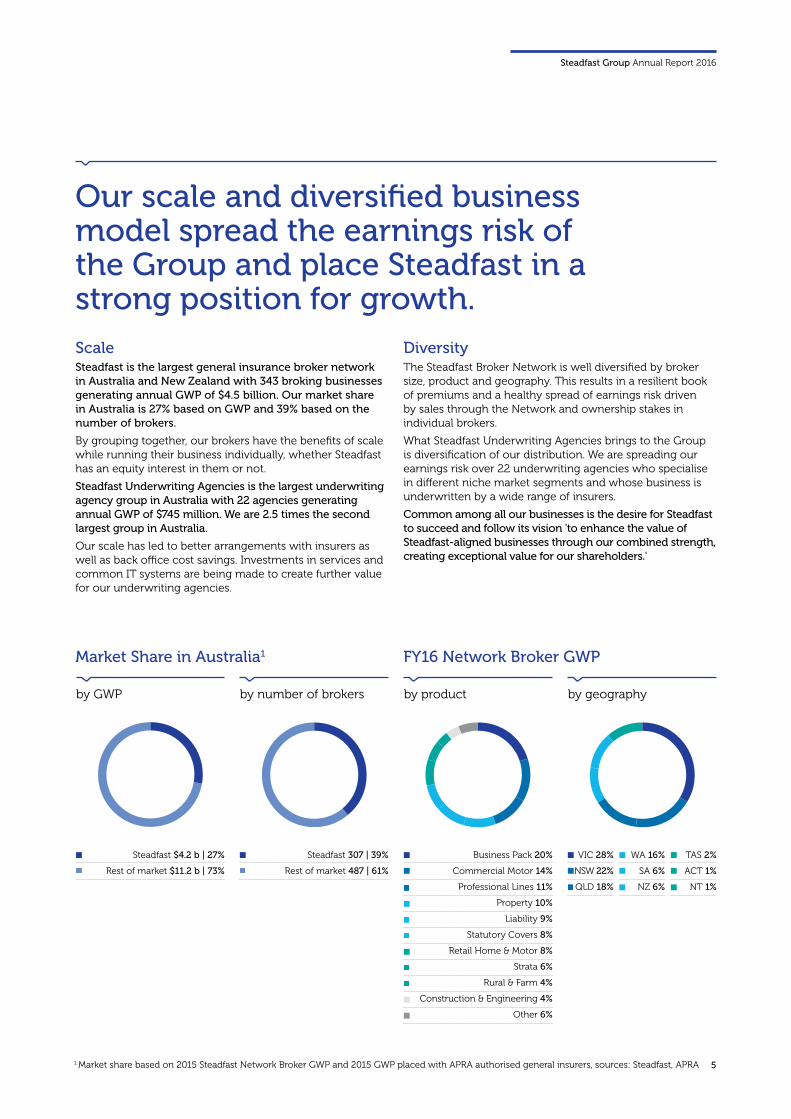
Steadfast $4.2 b | 27%
Rest of market $11.2 b | 73%
Steadfast 307 | 39%
Rest of market 487 | 61%
by product by geography
Business Pack 20%
Commercial Motor 14%
Professional Lines 11%
Property 10%
Liability 9%
Statutory Covers 8%
Retail Home & Motor 8%
Strata 6%
Rural & Farm 4%
Construction & Engineering 4%
Other 6%
VIC 28%
NSW 22%
QLD 18%
WA 16%
SA 6%
NZ 6%
TAS 2%
ACT 1%
NT 1%
2012
$46m2013
$114m2014
$145m2015
$385m2016
$745m
ScaleSteadfast is the largest general insurance broker network in Australia and New Zealand with 343 broking businesses generating annual GWP of $4.5 billion. Our market share in Australia is 27% based on GWP and 39% based on the number of brokers.
By grouping together, our brokers have the benefits of scale while running their business individually, whether Steadfast has an equity interest in them or not.
Steadfast Underwriting Agencies is the largest underwriting agency group in Australia with 22 agencies generating annual GWP of $745 million. We are 2.5 times the second largest group in Australia.
Our scale has led to better arrangements with insurers as well as back office cost savings. Investments in services and common IT systems are being made to create further value for our underwriting agencies.
Our scale and diversified business model spread the earnings risk of the Group and place Steadfast in a strong position for growth.
DiversityThe Steadfast Broker Network is well diversified by broker size, product and geography. This results in a resilient book of premiums and a healthy spread of earnings risk driven by sales through the Network and ownership stakes in individual brokers.
What Steadfast Underwriting Agencies brings to the Group is diversification of our distribution. We are spreading our earnings risk over 22 underwriting agencies who specialise in different niche market segments and whose business is underwritten by a wide range of insurers.
Common among all our businesses is the desire for Steadfast to succeed and follow its vision 'to enhance the value of Steadfast-aligned businesses through our combined strength, creating exceptional value for our shareholders.'
1 Market share based on 2015 Steadfast Network Broker GWP and 2015 GWP placed with APRA authorised general insurers, sources: Steadfast, APRA
Market Share in Australia1 FY16 Network Broker GWP
6
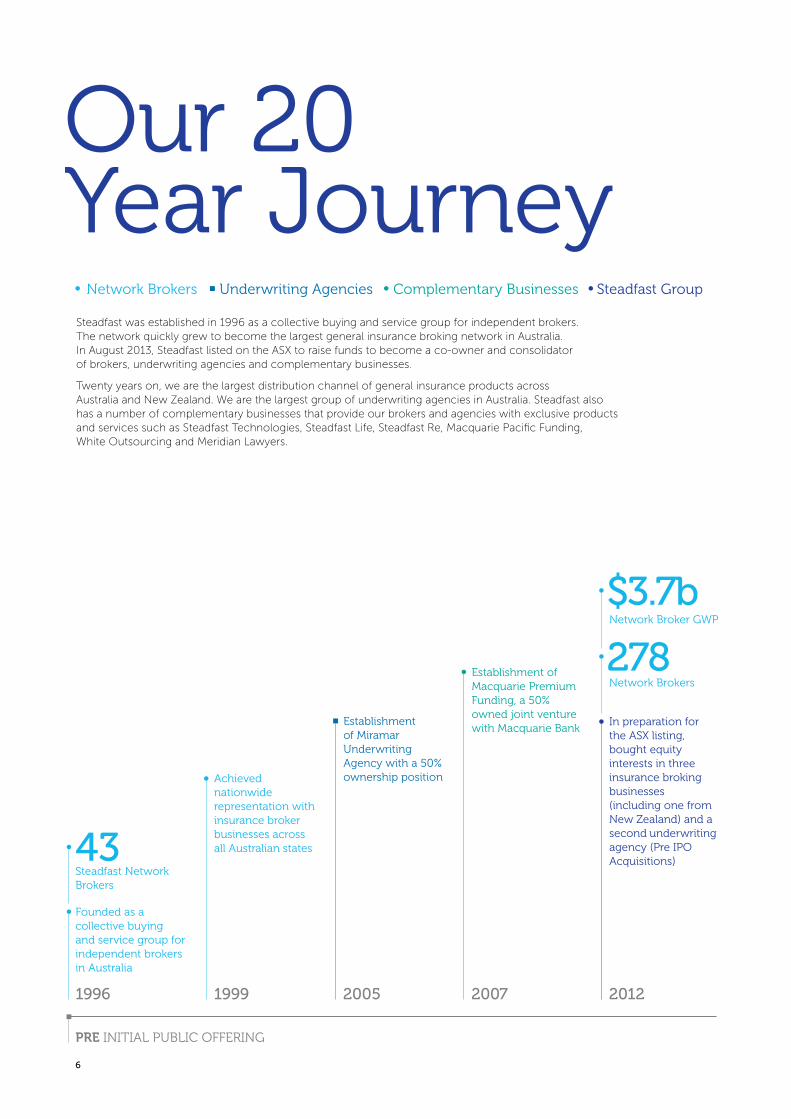
Founded as a collective buying and service group for independent brokers in Australia
Achieved nationwide representation with insurance broker businesses across all Australian states
Establishment of Miramar Underwriting Agency with a 50% ownership position
Establishment of Macquarie Premium Funding, a 50% owned joint venture with Macquarie Bank
Network Brokers
Our 20 Year Journey
Network Brokers Underwriting Agencies Complementary Businesses Steadfast Group
1996 1999
PRE INITIAL PUBLIC OFFERING
2005 2007 2012
43
$3.7b
278Network Broker GWP
In preparation for the ASX listing, bought equity interests in three insurance broking businesses (including one from New Zealand) and a second underwriting agency (Pre IPO Acquisitions)
Steadfast Network Brokers
Steadfast was established in 1996 as a collective buying and service group for independent brokers. The network quickly grew to become the largest general insurance broking network in Australia. In August 2013, Steadfast listed on the ASX to raise funds to become a co-owner and consolidator of brokers, underwriting agencies and complementary businesses.
Twenty years on, we are the largest distribution channel of general insurance products across Australia and New Zealand. We are the largest group of underwriting agencies in Australia. Steadfast also has a number of complementary businesses that provide our brokers and agencies with exclusive products and services such as Steadfast Technologies, Steadfast Life, Steadfast Re, Macquarie Pacific Funding, White Outsourcing and Meridian Lawyers.
Steadfast Group Annual Report 2016
7
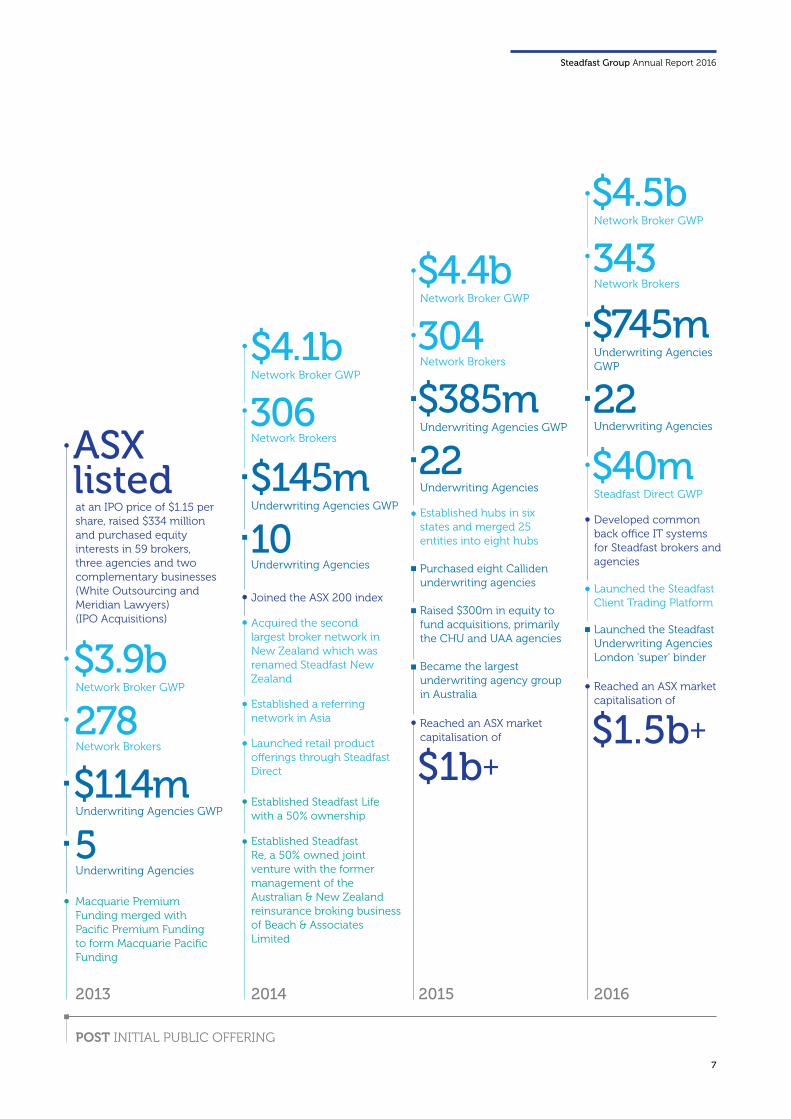
ASX listed
Network Brokers
Underwriting Agencies GWP
Underwriting Agencies GWP
Underwriting Agencies GWP
Underwriting Agencies GWP
Underwriting Agencies
Macquarie Premium Funding merged with Pacific Premium Fundingto form Macquarie Pacific Funding
Underwriting Agencies
Underwriting Agencies
Underwriting AgenciesNetwork Brokers
Network Brokers
Network Brokers
Launched the Steadfast Client Trading Platform
Launched the Steadfast Underwriting Agencies London 'super' binder
POST INITIAL PUBLIC OFFERING
$3.9b
$4.1b
$4.4b
$4.5b
$40m
278
$114m
$145m
$385m
$745m
5
10
22
22306
304
343
Network Broker GWP
Network Broker GWP
Network Broker GWP
Network Broker GWP
Steadfast Direct GWPat an IPO price of $1.15 per share, raised $334 million and purchased equity interests in 59 brokers, three agencies and two complementary businesses (White Outsourcing and Meridian Lawyers) (IPO Acquisitions)
Established hubs in six states and merged 25 entities into eight hubs
Joined the ASX 200 index
Acquired the second largest broker network in New Zealand which was renamed Steadfast New Zealand
Established a referring network in Asia
Launched retail product offerings through Steadfast Direct
Purchased eight Calliden underwriting agencies
Raised $300m in equity to fund acquisitions, primarily the CHU and UAA agencies
Became the largest underwriting agency group in Australia
Established Steadfast Life with a 50% ownership
Established Steadfast Re, a 50% owned joint venture with the former management of the Australian & New Zealand reinsurance broking business of Beach & Associates Limited
Reached an ASX market capitalisation of
Reached an ASX market capitalisation of
Developed common back office IT systems for Steadfast brokers and agencies
2013 2014 2015 2016
$1.5b+
$1b+
8
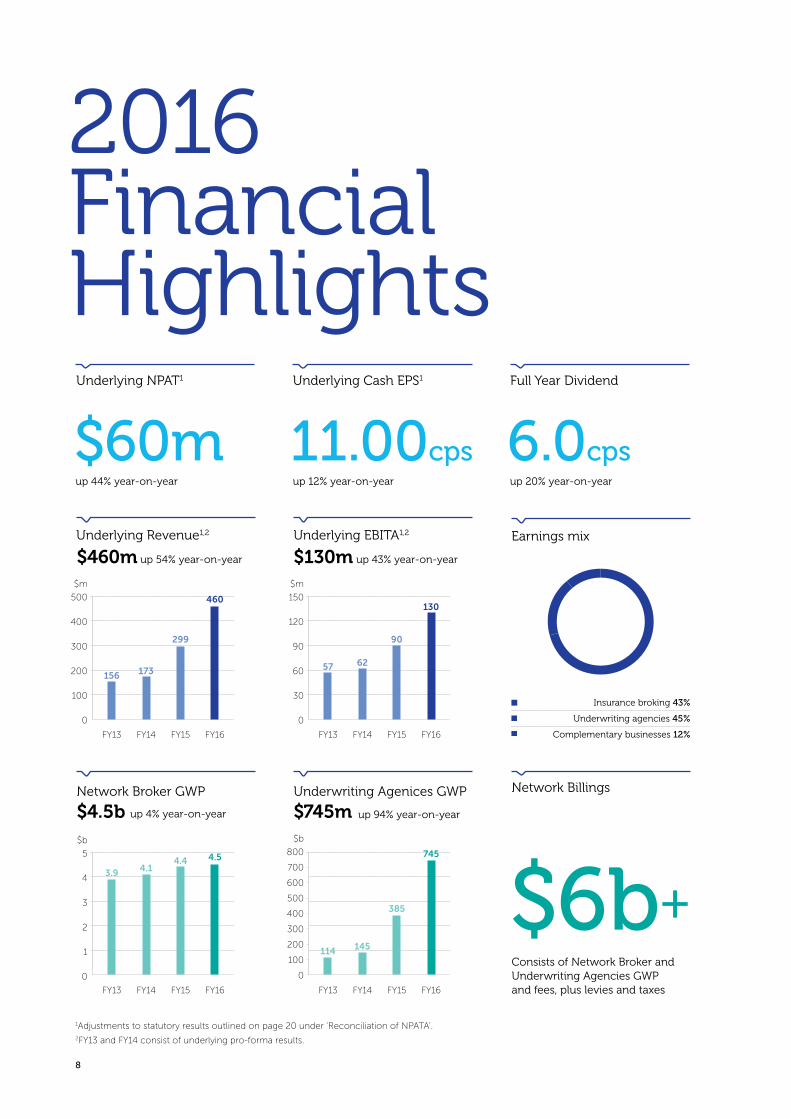
Underlying NPAT1
Underlying Revenue1,2
up 54% year-on-year
up 12% year-on-year up 20% year-on-yearup 44% year-on-year
up 4% year-on-year
up 43% year-on-year
up 94% year-on-year
$460m
Network Broker GWP
$4.5bUnderwriting Agenices GWP
$745m
Underlying EBITA1,2
$130m
Underlying Cash EPS1 Full Year Dividend
$m
500
400
300
200
100
0
$m
150
120
90
60
30
0
FY13 FY14 FY15 FY16 FY13 FY14 FY15 FY16
$b
5
4
3
2
1
0
$b
800
700
600
500
400
300
200
100
0
FY13 FY14 FY15 FY16 FY13 FY14 FY15 FY16
Earnings mix
Insurance broking 43%
Underwriting agencies 45%
Complementary businesses 12%
$60m 11.00cps 6.0cps
Consists of Network Broker and Underwriting Agencies GWP and fees, plus levies and taxes
Network Billings
$6b+
156
3.9
114 145
385
4.14.4 4.5 745
173 57 62
90
130
299
460
2016Financial Highlights
1Adjustments to statutory results outlined on page 20 under ‘Reconciliation of NPATA’.2FY13 and FY14 consist of underlying pro-forma results.
Steadfast Group Annual Report 2016
9
Underlying NPAT1
Underlying Revenue1,2
up 54% year-on-year
up 12% year-on-year up 20% year-on-yearup 44% year-on-year
up 4% year-on-year
up 43% year-on-year
up 94% year-on-year
$460m
Network Broker GWP
$4.5bUnderwriting Agenices GWP
$745m
Underlying EBITA1,2
$130m
Underlying Cash EPS1 Full Year Dividend
$m
500
400
300
200
100
0
$m
150
120
90
60
30
0
FY13 FY14 FY15 FY16 FY13 FY14 FY15 FY16
$b
5
4
3
2
1
0
$b
800
700
600
500
400
300
200
100
0
FY13 FY14 FY15 FY16 FY13 FY14 FY15 FY16
Earnings mix
Insurance broking 43%
Underwriting agencies 45%
Complementary businesses 12%
$60m 11.00cps 6.0cps
Consists of Network Broker and Underwriting Agencies GWP and fees, plus levies and taxes
Network Billings
$6b+
156
3.9
114 145
385
4.14.4 4.5 745
173 57 62
90
130
299
460
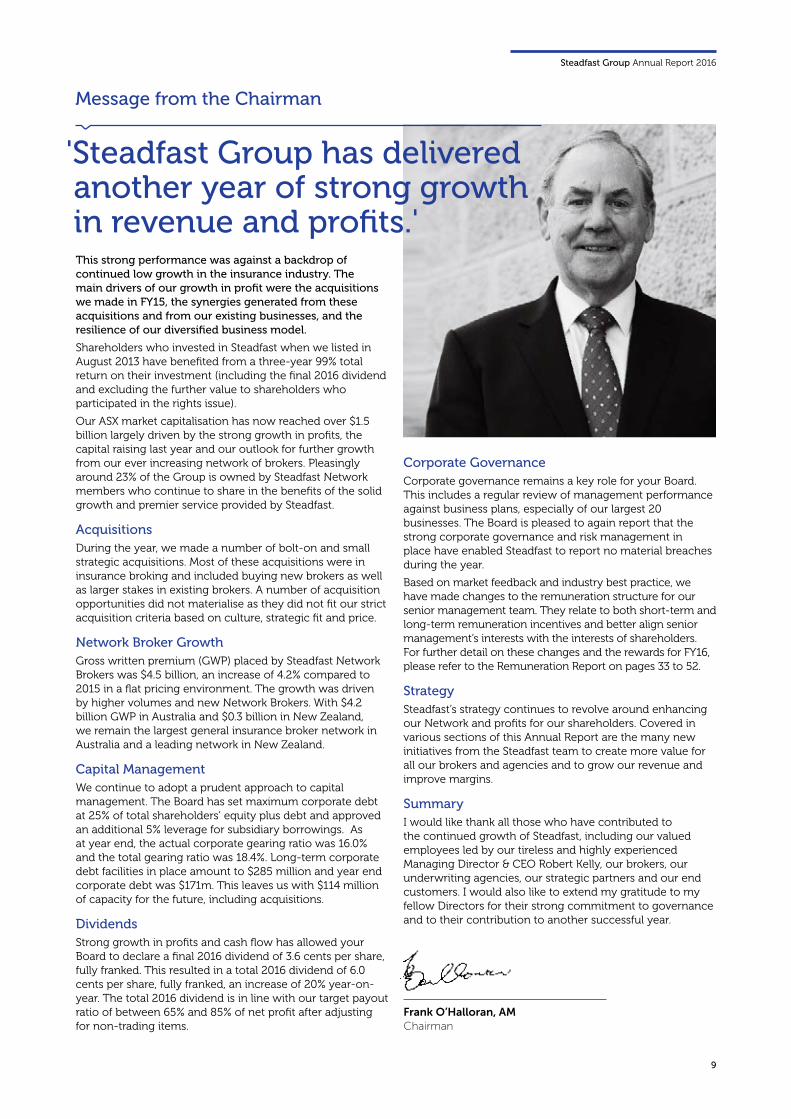
'Steadfast Group has delivered another year of strong growth in revenue and profits.'
Message from the Chairman
This strong performance was against a backdrop of continued low growth in the insurance industry. The main drivers of our growth in profit were the acquisitions we made in FY15, the synergies generated from these acquisitions and from our existing businesses, and the resilience of our diversified business model.
Shareholders who invested in Steadfast when we listed in August 2013 have benefited from a three-year 99% total return on their investment (including the final 2016 dividend and excluding the further value to shareholders who participated in the rights issue).
Our ASX market capitalisation has now reached over $1.5 billion largely driven by the strong growth in profits, the capital raising last year and our outlook for further growth from our ever increasing network of brokers. Pleasingly around 23% of the Group is owned by Steadfast Network members who continue to share in the benefits of the solid growth and premier service provided by Steadfast.
AcquisitionsDuring the year, we made a number of bolt-on and small strategic acquisitions. Most of these acquisitions were in insurance broking and included buying new brokers as well as larger stakes in existing brokers. A number of acquisition opportunities did not materialise as they did not fit our strict acquisition criteria based on culture, strategic fit and price.
Network Broker GrowthGross written premium (GWP) placed by Steadfast Network Brokers was $4.5 billion, an increase of 4.2% compared to 2015 in a flat pricing environment. The growth was driven by higher volumes and new Network Brokers. With $4.2 billion GWP in Australia and $0.3 billion in New Zealand, we remain the largest general insurance broker network in Australia and a leading network in New Zealand.
Capital ManagementWe continue to adopt a prudent approach to capital management. The Board has set maximum corporate debt at 25% of total shareholders’ equity plus debt and approved an additional 5% leverage for subsidiary borrowings. As at year end, the actual corporate gearing ratio was 16.0% and the total gearing ratio was 18.4%. Long-term corporate debt facilities in place amount to $285 million and year end corporate debt was $171m. This leaves us with $114 million of capacity for the future, including acquisitions.
DividendsStrong growth in profits and cash flow has allowed your Board to declare a final 2016 dividend of 3.6 cents per share, fully franked. This resulted in a total 2016 dividend of 6.0 cents per share, fully franked, an increase of 20% year-on-year. The total 2016 dividend is in line with our target payout ratio of between 65% and 85% of net profit after adjusting for non-trading items.
Corporate GovernanceCorporate governance remains a key role for your Board. This includes a regular review of management performance against business plans, especially of our largest 20 businesses. The Board is pleased to again report that the strong corporate governance and risk management in place have enabled Steadfast to report no material breaches during the year.
Based on market feedback and industry best practice, we have made changes to the remuneration structure for our senior management team. They relate to both short-term and long-term remuneration incentives and better align senior management’s interests with the interests of shareholders. For further detail on these changes and the rewards for FY16, please refer to the Remuneration Report on pages 33 to 52.
StrategySteadfast’s strategy continues to revolve around enhancing our Network and profits for our shareholders. Covered in various sections of this Annual Report are the many new initiatives from the Steadfast team to create more value for all our brokers and agencies and to grow our revenue and improve margins.
Summary I would like thank all those who have contributed to the continued growth of Steadfast, including our valued employees led by our tireless and highly experienced Managing Director & CEO Robert Kelly, our brokers, our underwriting agencies, our strategic partners and our end customers. I would also like to extend my gratitude to my fellow Directors for their strong commitment to governance and to their contribution to another successful year.
Frank O’Halloran, AM Chairman
10
'Steadfast is uniquely positioned to continue to outperform as we leverage our history, scale and diversified businesses into 2017 and beyond.'
Message from the Managing Director & CEO
Over the past 20 years, Steadfast has grown to become the largest general insurance intermediary in Australia and New Zealand. What started out as 43 insurance broking businesses joining together to compete against the large international players has evolved into 343 with 1,146 offices across Australia, New Zealand, Singapore and London.
During that time, we have witnessed a number of insurance cycles as well as the global financial crisis in 2007-2009. We have also seen new capital entering the insurance market which has resulted in lower, and in some cases, unsustainable pricing levels and lower profit returns.
Technology has become an important part of our business and our lives as it allows us to perform tasks faster, more efficiently from anywhere and using many different devices. Furthermore, it enables us to collect and analyse data to better service the needs of our insurance brokers and end customers.
Becoming an ASX listed company in August 2013 allowed us to participate in the consolidation of the Australian insurance broking industry and diversify our business further into the underwriting agency space. We now have equity ownership in 52 insurance brokers (including 27 hubbed or merged brokers), 22 underwriting agencies and six complementary businesses.
As we celebrate Steadfast’s 20th anniversary and third year as a listed public company, we are proud to have achieved another year of record performance.
Financial PerformanceIn FY16, Steadfast Group reported underlying net profit after tax and before amortisation (NPATA) was $82 million, up 45% year-on-year and in line with guidance. Growth in underlying cash earnings per share was 12% and factored in a higher share count from our $300 million equity raising in February and March 2015.
The strong growth was driven by acquisitions made during the previous financial year – in particular the Calliden and QBE agency acquisitions. These two acquisitions transformed Steadfast into the largest underwriting agency group in Australia and diversified our earnings mix. Underwriting agencies accounted for 45% of our earnings in FY16 compared to 18% two years ago.
In light of a flat pricing environment and cost inflation, the performance from our existing brokers and agencies was solid and reflected their resilience in challenging markets. Our complementary businesses faced stronger market pricing pressures but continue to enhance the Group through revenue and cost synergies for both our brokers and agencies.
Network Broker GrowthIn FY16, gross written premium (GWP) from our Network Brokers grew by 4.2% to $4.5 billion. The increase was due to growth in volumes and new Network Brokers.
What’s pleasing to see is the continued growth in new members as brokers are looking to prosper in an increasingly competitive market. Being part of the Steadfast Network provides them with access to 160 services, fully funded by the Network, as well as market access to our strategic partners. For more on the key services we provide to our brokers and the Steadfast advantage, refer to pages 10 and 11.
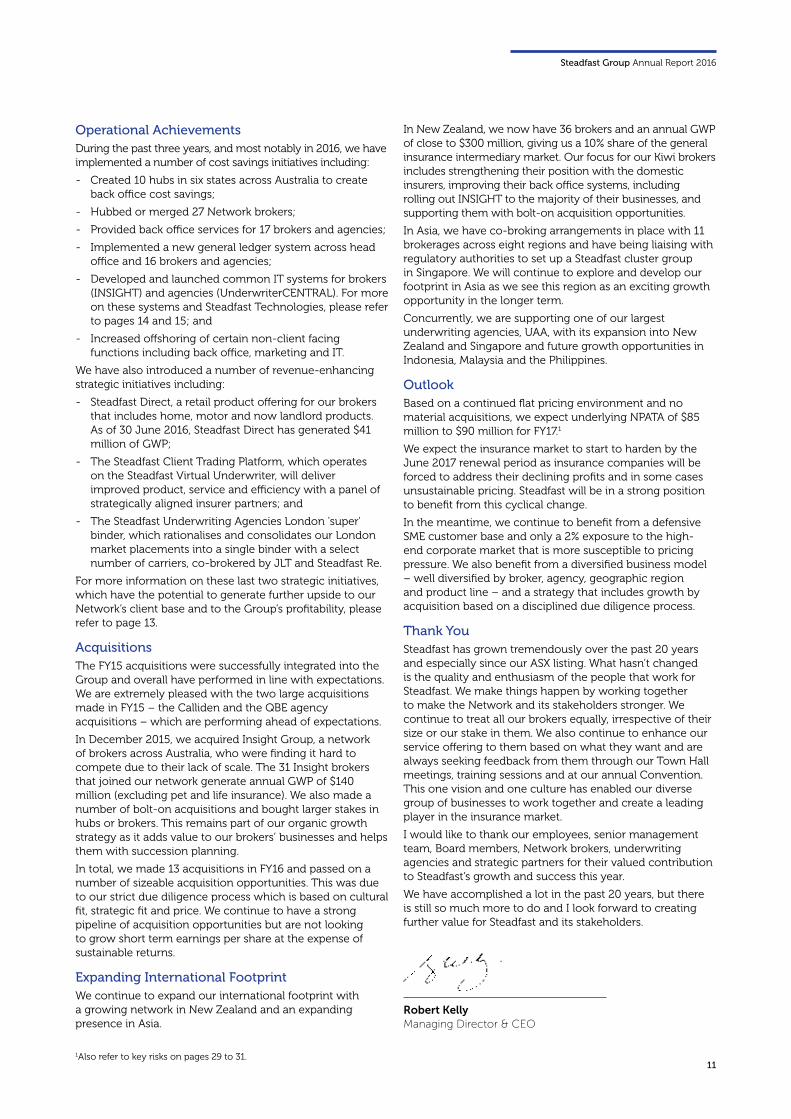
To further highlight the benefits of being part of Steadfast, 99 brokers have joined the Network and only one broker has left since we went public in August 2013. Over the past three years, our Network broker count has increased from 278 to 343. New members and acquisitions have added to the count whilst hubbing has decreased the count but led to larger, stronger broker businesses.
Number of Steadfast Network BrokersAugust 2013 – August 2016
400
375
350
325
300
275
250
225
200
Aug 2013
New Brokers
Allied NZ
Insight Hubbing Sold Leavers Aug 2016
278
37
31
31 27
61 343
Steadfast Group Annual Report 2016
11
Operational AchievementsDuring the past three years, and most notably in 2016, we have implemented a number of cost savings initiatives including:
- Created 10 hubs in six states across Australia to create back office cost savings;
- Hubbed or merged 27 Network brokers;
- Provided back office services for 17 brokers and agencies;
- Implemented a new general ledger system across head office and 16 brokers and agencies;
- Developed and launched common IT systems for brokers (INSIGHT) and agencies (UnderwriterCENTRAL). For more on these systems and Steadfast Technologies, please refer to pages 14 and 15; and
- Increased offshoring of certain non-client facing functions including back office, marketing and IT.
We have also introduced a number of revenue-enhancing strategic initiatives including:
- Steadfast Direct, a retail product offering for our brokers that includes home, motor and now landlord products. As of 30 June 2016, Steadfast Direct has generated $41 million of GWP;
- The Steadfast Client Trading Platform, which operates on the Steadfast Virtual Underwriter, will deliver improved product, service and efficiency with a panel of strategically aligned insurer partners; and
- The Steadfast Underwriting Agencies London 'super' binder, which rationalises and consolidates our London market placements into a single binder with a select number of carriers, co-brokered by JLT and Steadfast Re.
For more information on these last two strategic initiatives, which have the potential to generate further upside to our Network’s client base and to the Group’s profitability, please refer to page 13.
AcquisitionsThe FY15 acquisitions were successfully integrated into the Group and overall have performed in line with expectations. We are extremely pleased with the two large acquisitions made in FY15 – the Calliden and the QBE agency acquisitions – which are performing ahead of expectations.
In December 2015, we acquired Insight Group, a network of brokers across Australia, who were finding it hard to compete due to their lack of scale. The 31 Insight brokers that joined our network generate annual GWP of $140 million (excluding pet and life insurance). We also made a number of bolt-on acquisitions and bought larger stakes in hubs or brokers. This remains part of our organic growth strategy as it adds value to our brokers’ businesses and helps them with succession planning.
In total, we made 13 acquisitions in FY16 and passed on a number of sizeable acquisition opportunities. This was due to our strict due diligence process which is based on cultural fit, strategic fit and price. We continue to have a strong pipeline of acquisition opportunities but are not looking to grow short term earnings per share at the expense of sustainable returns.
Expanding International FootprintWe continue to expand our international footprint with a growing network in New Zealand and an expanding presence in Asia.
In New Zealand, we now have 36 brokers and an annual GWP of close to $300 million, giving us a 10% share of the general insurance intermediary market. Our focus for our Kiwi brokers includes strengthening their position with the domestic insurers, improving their back office systems, including rolling out INSIGHT to the majority of their businesses, and supporting them with bolt-on acquisition opportunities.
In Asia, we have co-broking arrangements in place with 11 brokerages across eight regions and have being liaising with regulatory authorities to set up a Steadfast cluster group in Singapore. We will continue to explore and develop our footprint in Asia as we see this region as an exciting growth opportunity in the longer term.
Concurrently, we are supporting one of our largest underwriting agencies, UAA, with its expansion into New Zealand and Singapore and future growth opportunities in Indonesia, Malaysia and the Philippines.
OutlookBased on a continued flat pricing environment and no material acquisitions, we expect underlying NPATA of $85 million to $90 million for FY17.1
We expect the insurance market to start to harden by the June 2017 renewal period as insurance companies will be forced to address their declining profits and in some cases unsustainable pricing. Steadfast will be in a strong position to benefit from this cyclical change.
In the meantime, we continue to benefit from a defensive SME customer base and only a 2% exposure to the high-end corporate market that is more susceptible to pricing pressure. We also benefit from a diversified business model – well diversified by broker, agency, geographic region and product line – and a strategy that includes growth by acquisition based on a disciplined due diligence process.
Thank YouSteadfast has grown tremendously over the past 20 years and especially since our ASX listing. What hasn’t changed is the quality and enthusiasm of the people that work for Steadfast. We make things happen by working together to make the Network and its stakeholders stronger. We continue to treat all our brokers equally, irrespective of their size or our stake in them. We also continue to enhance our service offering to them based on what they want and are always seeking feedback from them through our Town Hall meetings, training sessions and at our annual Convention. This one vision and one culture has enabled our diverse group of businesses to work together and create a leading player in the insurance market.
I would like to thank our employees, senior management team, Board members, Network brokers, underwriting agencies and strategic partners for their valued contribution to Steadfast’s growth and success this year.
We have accomplished a lot in the past 20 years, but there is still so much more to do and I look forward to creating further value for Steadfast and its stakeholders.
Robert Kelly Managing Director & CEO
1Also refer to key risks on pages 29 to 31.

12
Steadfast NetworkSteadfast strives toward building a network that is stronger together. This involves enhancing the services provided to our Network brokers; building and developing relationships with our Strategic Partners; and meeting the needs of our end customers.
Market Access Steadfast Network Brokers have access to our Strategic Partners (with dedicated Steadfast contacts) and hence an extensive market of product and service providers.
ExclusivityOur innovative, leading edge products and services are only available through the Steadfast Network. This exclusivity plus Steadfast’s market access gives our brokers a real competitive advantage.
Scale & Strength Our 343 brokers located in 1,146 offices across Australia, New Zealand, Singapore and London provide their customers with a local presence backed by the strength of Steadfast.
Network ServicesStrategic Partners Network BrokersComplementary Businesses Customers
Steadfast Group Annual Report 2016
13
Our customers consist mainly of small to medium sized businesses who rely on our brokers for their expert advice on insurance and risk management.
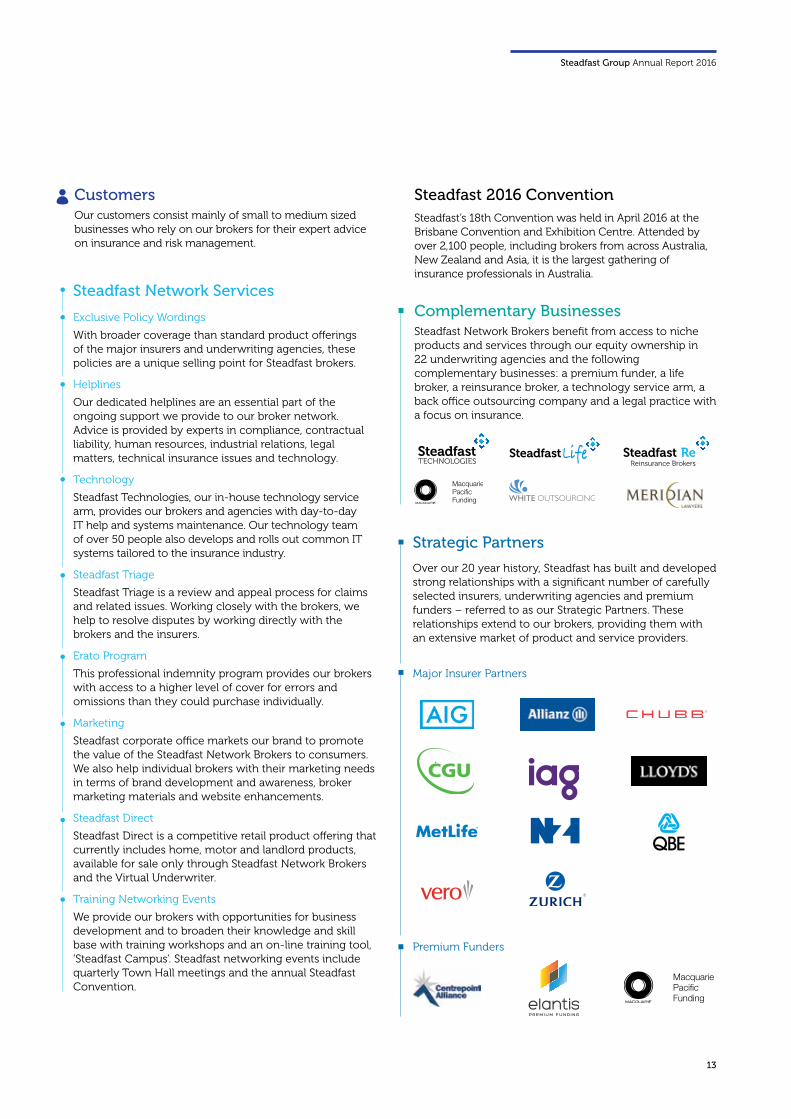
Steadfast Network Brokers benefit from access to niche products and services through our equity ownership in 22 underwriting agencies and the following complementary businesses: a premium funder, a life broker, a reinsurance broker, a technology service arm, a back office outsourcing company and a legal practice with a focus on insurance.
Steadfast’s 18th Convention was held in April 2016 at the Brisbane Convention and Exhibition Centre. Attended by over 2,100 people, including brokers from across Australia, New Zealand and Asia, it is the largest gathering of insurance professionals in Australia.
Customers
Complementary Businesses
Steadfast 2016 Convention
Over our 20 year history, Steadfast has built and developed strong relationships with a significant number of carefully selected insurers, underwriting agencies and premium funders – referred to as our Strategic Partners. These relationships extend to our brokers, providing them with an extensive market of product and service providers.
Premium Funders
Strategic Partners
Exclusive Policy Wordings
With broader coverage than standard product offerings of the major insurers and underwriting agencies, these policies are a unique selling point for Steadfast brokers.
Helplines
Our dedicated helplines are an essential part of the ongoing support we provide to our broker network. Advice is provided by experts in compliance, contractual liability, human resources, industrial relations, legal matters, technical insurance issues and technology.
Technology
Steadfast Technologies, our in-house technology service arm, provides our brokers and agencies with day-to-day IT help and systems maintenance. Our technology team of over 50 people also develops and rolls out common IT systems tailored to the insurance industry.
Steadfast Triage
Steadfast Triage is a review and appeal process for claims and related issues. Working closely with the brokers, we help to resolve disputes by working directly with the brokers and the insurers.
Erato Program
This professional indemnity program provides our brokers with access to a higher level of cover for errors and omissions than they could purchase individually.
Marketing
Steadfast corporate office markets our brand to promote the value of the Steadfast Network Brokers to consumers. We also help individual brokers with their marketing needs in terms of brand development and awareness, broker marketing materials and website enhancements.
Steadfast Direct
Steadfast Direct is a competitive retail product offering that currently includes home, motor and landlord products, available for sale only through Steadfast Network Brokers and the Virtual Underwriter.
Training Networking Events
We provide our brokers with opportunities for business development and to broaden their knowledge and skill base with training workshops and an on-line training tool, ‘Steadfast Campus’. Steadfast networking events include quarterly Town Hall meetings and the annual Steadfast Convention.
Steadfast Network Services
Major Insurer Partners
Life

14
Steadfast Underwriting AgenciesSteadfast Underwriting Agencies expands the Group’s footprint in the distribution of general insurance in Australia and New Zealand, and provides our Network brokers with specialised products in niche market segments.
Personal accident and sickness, and travel
Residential and commercial strata
Business interruption focused on SME
Marine and motorcycle
Builders’ warranty
Mobile plant and equipment
Complete farm package
Specialist/exotic motorcar and motorcycle
High-value homes
Professionals including engineers, architects and doctors
Sports and leisure-related businesses
Hospitality, leisure and entertainment sector
Income protection
Emerging risks
Building and construction industry
Specialised equipment, tradesmen and small business, and marine transit
Hard-to-place risks, exclusive to Steadfast Network Brokers
Home and contents for owner-occupied homes
Community care, entertainment and hospitality, and security
Strong focus on SME insurance programs
Property insurance
Hard-to-place and complex risks, including environmental liability
Steadfast aims to highlight each agency’s specialised service by preserving its brand and unique offering. This is particularly important as around 50% of our agencies’ business is placed with non-Steadfast brokers.
Steadfast Group Annual Report 2016
15
Steadfast Underwriting Agencies (SUA) London 'Super' BinderSUA is revolutionising the way it does business by consolidating the number of its Lloyd's of London syndicates who currently underwrite business for four Steadfast Underwriting Agencies.
With the support of Steadfast Group, SUA is rationalising its London market placement into a single binder with a select number of syndicates and co-brokers, JLT and Steadfast Re. This results in a much simpler solution that provides for SUA to act on behalf of selected Lloyd's syndicates, giving them opportunities to sell more products through Steadfast Underwriting Agencies and the Steadfast Network.
Update on Steadfast’s Two Largest Underwriting Agencies
In April 2015, Steadfast acquired two large underwriting agencies from QBE – CHU Underwriting Agencies (CHU) and Underwriting Agencies of Australia (UAA). Both agencies have 10 year distribution agreements with QBE (for Australia and New Zealand) which give them a great deal of certainty when developing their product offering.
Both agencies transitioned well into the Steadfast fold and benefit from growth in residential/commercial construction and large infrastructure projects.
CHU Underwriting Agencies CHU is a leading residential and commercial strata insurance specialist in Australia with over 100,000 schemes across the country.
Under a new leadership team, CHU has expanded the broker sales channel which now distributes 52% of GWP compared to 39% 16 months ago. GWP distributed through Steadfast brokers has expanded almost twofold to 24% over the same period. CHU is also expanding geographically into far north Queensland and the Northern Territory.
Underwriting Agencies of Australia UAA is a leading insurance specialist in mobile plant and equipment such as cranes, heavy equipment and machinery. Approximately 40% of its GWP is sold through Steadfast Network Brokers. Post the acquisition, 10% of the company was sold to management so they could share in the future growth of UAA.
Since its acquisition, UAA has successfully launched into New Zealand. UAA is looking to expand into Asia with Singapore, Indonesia, Malaysia and the Philippines as the next targeted geographies.
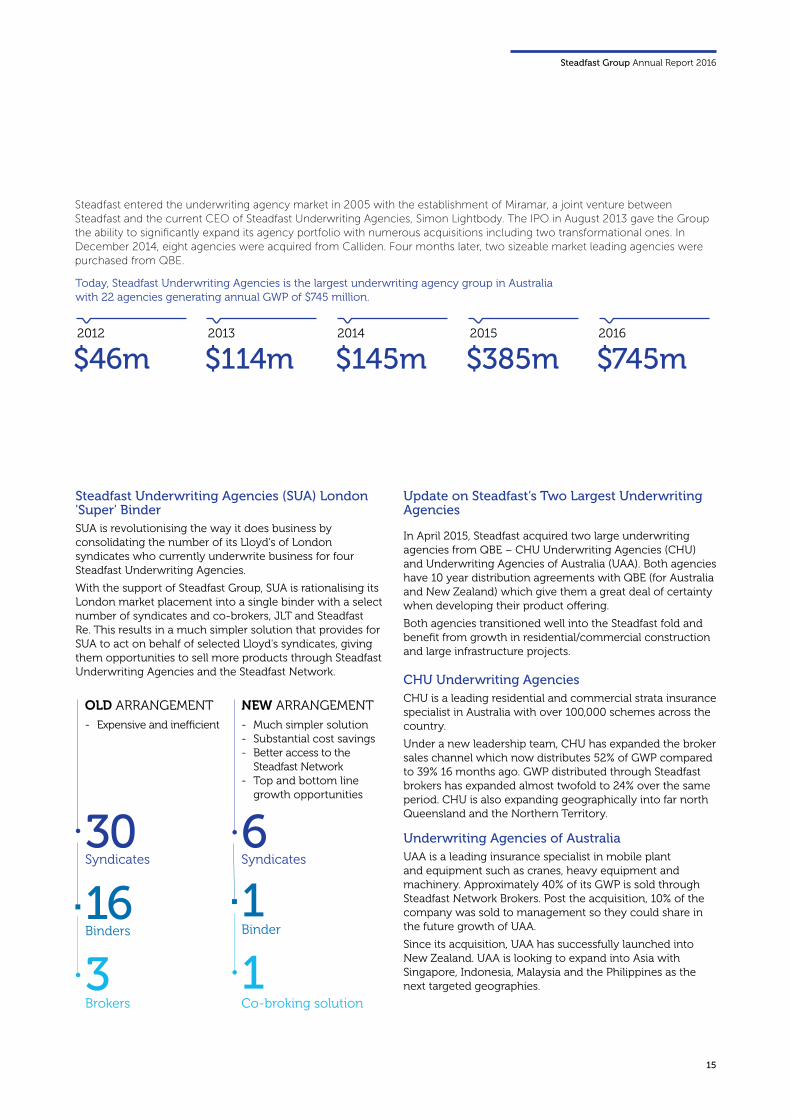
30 6
16 1
3 1
OLD ARRANGEMENT
- Expensive and inefficient - Much simpler solution- Substantial cost savings- Better access to the Steadfast Network- Top and bottom line growth opportunities
NEW ARRANGEMENT
Syndicates Syndicates
Binders Binder
Brokers Co-broking solution
Today, Steadfast Underwriting Agencies is the largest underwriting agency group in Australia with 22 agencies generating annual GWP of $745 million.
Steadfast entered the underwriting agency market in 2005 with the establishment of Miramar, a joint venture between Steadfast and the current CEO of Steadfast Underwriting Agencies, Simon Lightbody. The IPO in August 2013 gave the Group the ability to significantly expand its agency portfolio with numerous acquisitions including two transformational ones. In December 2014, eight agencies were acquired from Calliden. Four months later, two sizeable market leading agencies were purchased from QBE.
by GWP
2012 2013 2014 2015 2016
by number of brokers
Steadfast $4.2 b | 27%
Rest of market $11.2 b | 73%
Steadfast 307 | 39%
Rest of market 487 | 61%
by product by geography
Business Pack 20%
Commercial Motor 14%
Professional Lines 11%
Property 10%
Liability 9%
Statutory Covers 8%
Retail Home & Motor 8%
Strata 6%
Rural & Farm 4%
Construction & Engineering 4%
Other 6%
VIC 28%
NSW 22%
QLD 18%
WA 16%
SA 6%
NZ 6%
TAS 2%
ACT 1%
NT 1%
2012
$46m2013
$114m2014
$145m2015
$385m2016
$745m
16
Agency systems
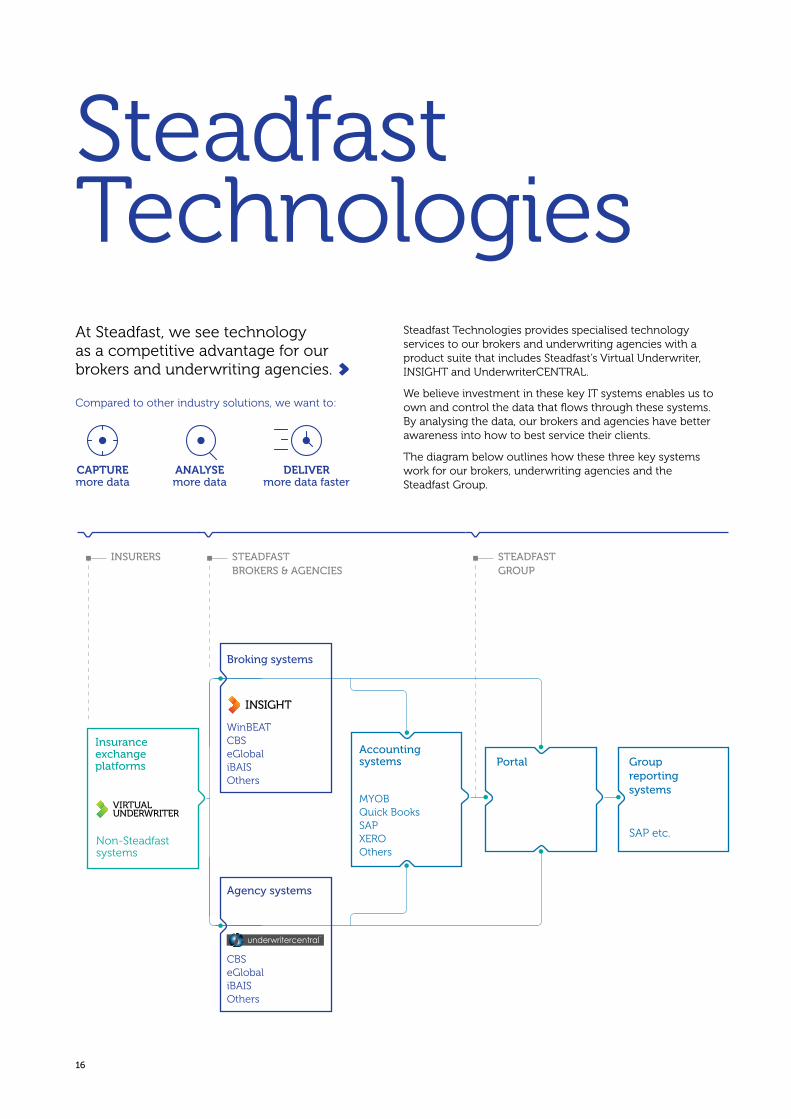
Steadfast TechnologiesAt Steadfast, we see technology as a competitive advantage for our brokers and underwriting agencies.
Non-Steadfast systems
Steadfast Technologies provides specialised technology services to our brokers and underwriting agencies with a product suite that includes Steadfast’s Virtual Underwriter, INSIGHT and UnderwriterCENTRAL.
We believe investment in these key IT systems enables us to own and control the data that flows through these systems. By analysing the data, our brokers and agencies have better awareness into how to best service their clients.
The diagram below outlines how these three key systems work for our brokers, underwriting agencies and the Steadfast Group.
Compared to other industry solutions, we want to:
Group reporting systems
PortalAccounting systems
Broking systems
MYOB Quick Books SAP XERO Others
WinBEAT CBS eGlobal iBAIS Others
SAP etc.
STEADFAST BROKERS & AGENCIES
STEADFAST GROUP
INSURERS
CAPTURE more data
ANALYSE more data
DELIVER more data faster
Insurance exchange platforms
underwritercentralTM
CBS eGlobal iBAIS Others
Steadfast Group Annual Report 2016
17
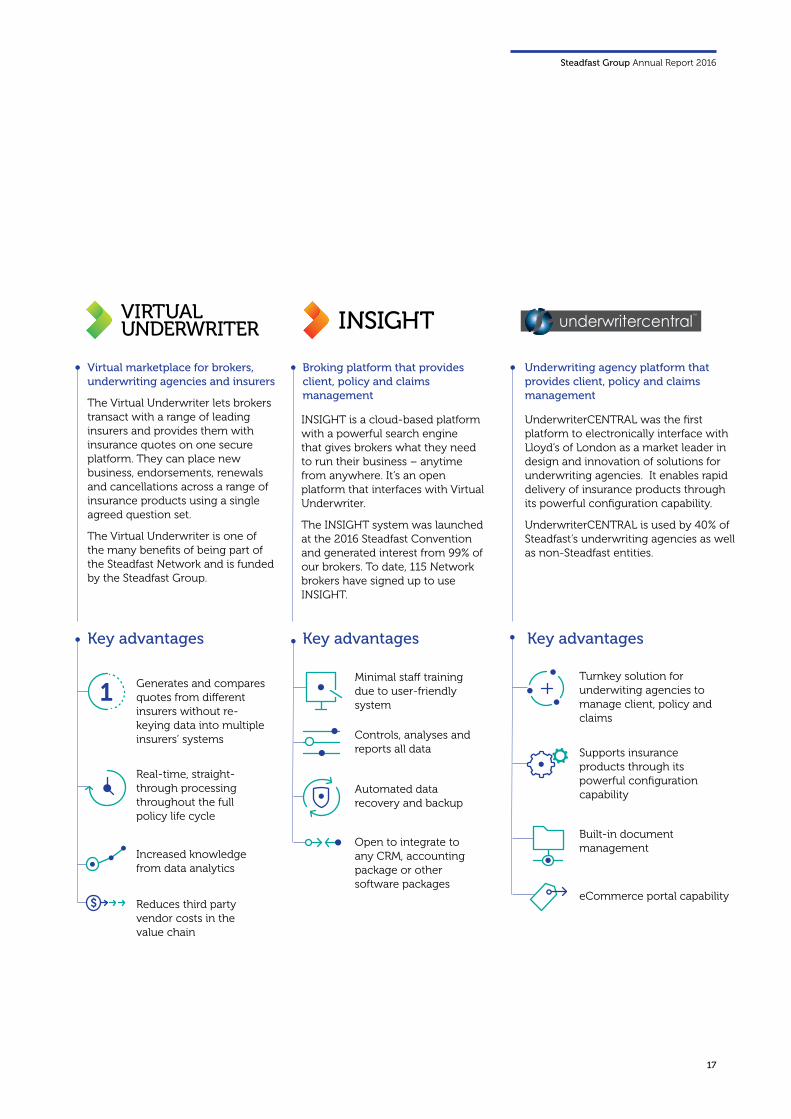
Virtual marketplace for brokers, underwriting agencies and insurers
Broking platform that provides client, policy and claims management
The Virtual Underwriter lets brokers transact with a range of leading insurers and provides them with insurance quotes on one secure platform. They can place new business, endorsements, renewals and cancellations across a range of insurance products using a single agreed question set.
The Virtual Underwriter is one of the many benefits of being part of the Steadfast Network and is funded by the Steadfast Group.
INSIGHT is a cloud-based platform with a powerful search engine that gives brokers what they need to run their business – anytime from anywhere. It’s an open platform that interfaces with Virtual Underwriter.
The INSIGHT system was launched at the 2016 Steadfast Convention and generated interest from 99% of our brokers. To date, 115 Network brokers have signed up to use INSIGHT.
Key advantages
Generates and compares quotes from different insurers without re-keying data into multiple insurers’ systems
Reduces third party vendor costs in the value chain
Real-time, straight-through processing throughout the full policy life cycle
Increased knowledge from data analytics
Key advantages
Minimal staff training due to user-friendly system
Open to integrate to any CRM, accounting package or other software packages
Automated data recovery and backup
Controls, analyses and reports all data Supports insurance
products through its powerful configuration capability
Underwriting agency platform that provides client, policy and claims management
UnderwriterCENTRAL was the first platform to electronically interface with Lloyd’s of London as a market leader in design and innovation of solutions for underwriting agencies. It enables rapid delivery of insurance products through its powerful configuration capability.
UnderwriterCENTRAL is used by 40% of Steadfast’s underwriting agencies as well as non-Steadfast entities.
Key advantages
Turnkey solution for underwiting agencies to manage client, policy and claims
eCommerce portal capability
Built-in document management
1
underwritercentralTM
18
Social Awareness
PhilanthropySteadfast Group and its subsidiaries actively support the communities in which we live and work, typically donating around one percent of net profit after tax to charitable causes each financial year.
The Group created the Steadfast Foundation to facilitate grants and charitable contributions that support charities helping people to overcome adversity, with approximately $1.3 million raised since 2011. Charities are often chosen based on the recommendations of our brokers, and include cancer research and support, mental health, surf lifesaving, children’s causes and charities supporting the homeless and disadvantaged. Robert Kelly, Managing Director & CEO, is a director of the Steadfast Foundation as well as a director of KidsXpress, a charity that provides therapy programs for children affected by emotional trauma.
In addition to the ongoing activities of the Steadfast Foundation, Steadfast Network Brokers help raise funds for charities at the annual Steadfast Convention. In 2016, Convention attendees raised over $185,000 for Parkinson’s Australia. During the past year, Steadfast Group and our subsidiaries have donated close to $640,000 to charities.
White Outsourcing does its part by providing services pro bono to two ASX-listed investment companies that channel some of their profits to Australian children’s charities – the Future Generation Investment Company (ASX:FGX) and the Future Generation Global Investment Company (ASX:FGG).
Workforce DiversityWe have a diverse group of people at Steadfast – both at the corporate office level and throughout the entities that are controlled by our organisation. This is due to the fact that we hire and promote on talent, which supports diversity and equal opportunity.
Overall 22% (46% at the corporate office) were born outside of Australia including Asia, Africa, Europe, North America, South America and New Zealand.
Our diversity statistics continue to show a high percentage of women in the organisation and a healthy percentage of women in leadership positions. Women hold 33% of management positions in Steadfast-controlled entities, and 27% in our corporate office.
Steadfast supports our female employees, and those in the industry generally, by sponsoring the Association for Women in Insurance. Women in Insurance is a not-for-profit organisation whose purpose is to raise the awareness of the contribution made by women in the insurance and financial services industry and to provide them with a networking forum. Furthermore, a number of our female employees in senior leadership roles are supported with part-time or flexible working hours, which assists in their retention and breaking down perceived barriers.
To show our support of women in leadership roles, we are a platinum member of Head Over Heels, a non-profit organisation whose mission is to increase the representation of women entrepreneurs leading high-growth businesses. Heads Over Heels works with senior business and community leaders to provide senior businesswomen with access to strategic networks.
Climate ChangeSteadfast is committed to finding solutions for our brokers on important issues like climate change. With the help of our sustainability ambassador, Tim Jarvis, we are researching pragmatic solutions to major environmental issues related to climate change and biodiversity loss. Tim is an environmental scientist, author, adventurer and public speaker with masters degrees in environmental science and environmental law.
At Steadfast’s 2016 Convention, Tim spoke about his extraordinary journey recreating the expedition of Sir Ernest Shackleton, almost 100 years later. The expedition highlighted the deteriorating effects of climate change. Drawing on Tim’s experience and knowledge, we plan to develop actions that our brokers and agencies can put into practice to reduce their climate footprint.
Steadfast is conscious of how our end activities affect a range of stakeholders, including shareholders, employees, end customers, suppliers and local communities.
Giving back to our community, promoting workforce diversity and addressing climate change are some of the ways we address this.
Steadfast Group Annual Report 2016
19
Board of Directors
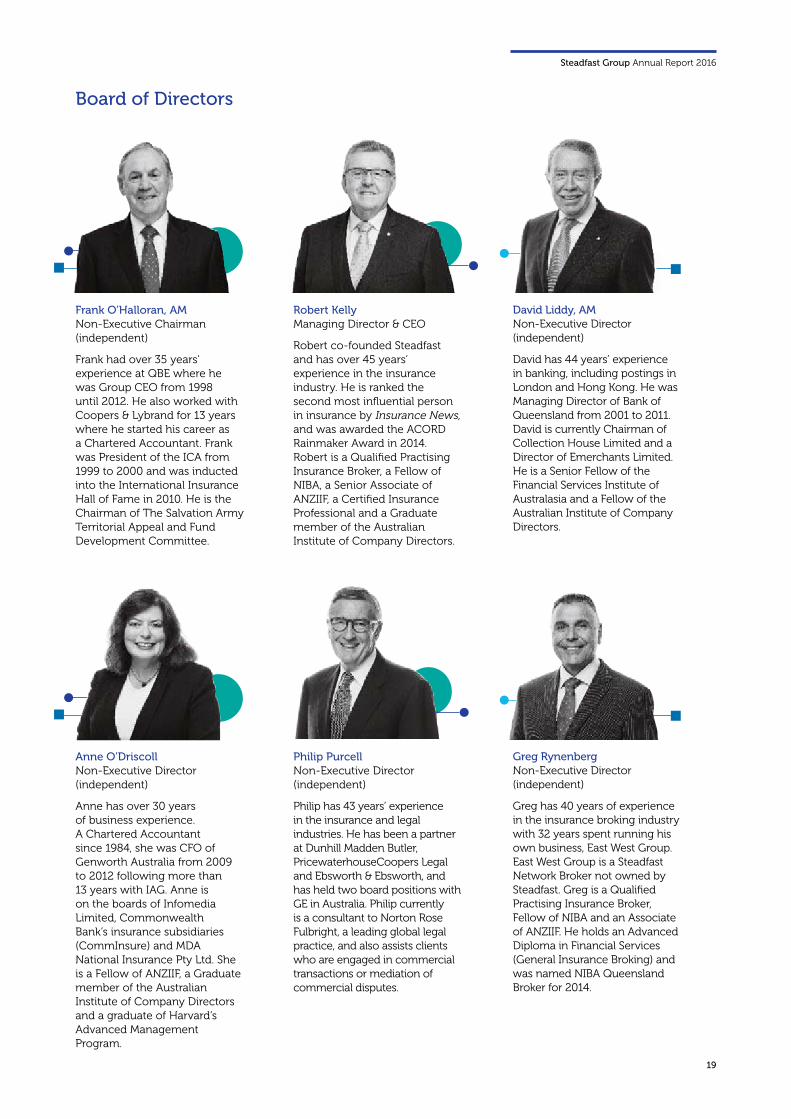
Robert KellyManaging Director & CEO
Robert co-founded Steadfast and has over 45 years’ experience in the insurance industry. He is ranked the second most influential person in insurance by Insurance News, and was awarded the ACORD Rainmaker Award in 2014. Robert is a Qualified Practising Insurance Broker, a Fellow of NIBA, a Senior Associate of ANZIIF, a Certified Insurance Professional and a Graduate member of the Australian Institute of Company Directors.
Philip PurcellNon-Executive Director (independent)
Philip has 43 years’ experience in the insurance and legal industries. He has been a partner at Dunhill Madden Butler, PricewaterhouseCoopers Legal and Ebsworth & Ebsworth, and has held two board positions with GE in Australia. Philip currently is a consultant to Norton Rose Fulbright, a leading global legal practice, and also assists clients who are engaged in commercial transactions or mediation of commercial disputes.
Frank O’Halloran, AM Non-Executive Chairman (independent)
Frank had over 35 years’ experience at QBE where he was Group CEO from 1998 until 2012. He also worked with Coopers & Lybrand for 13 years where he started his career as a Chartered Accountant. Frank was President of the ICA from 1999 to 2000 and was inducted into the International Insurance Hall of Fame in 2010. He is the Chairman of The Salvation Army Territorial Appeal and Fund Development Committee.
Anne O’Driscoll Non-Executive Director (independent)
Anne has over 30 years of business experience. A Chartered Accountant since 1984, she was CFO of Genworth Australia from 2009 to 2012 following more than 13 years with IAG. Anne is on the boards of Infomedia Limited, Commonwealth Bank’s insurance subsidiaries (CommInsure) and MDA National Insurance Pty Ltd. She is a Fellow of ANZIIF, a Graduate member of the Australian Institute of Company Directors and a graduate of Harvard’s Advanced Management Program.
David Liddy, AM Non-Executive Director (independent)
David has 44 years’ experience in banking, including postings in London and Hong Kong. He was Managing Director of Bank of Queensland from 2001 to 2011. David is currently Chairman of Collection House Limited and a Director of Emerchants Limited. He is a Senior Fellow of the Financial Services Institute of Australasia and a Fellow of the Australian Institute of Company Directors.
Greg Rynenberg Non-Executive Director (independent)
Greg has 40 years of experience in the insurance broking industry with 32 years spent running his own business, East West Group. East West Group is a Steadfast Network Broker not owned by Steadfast. Greg is a Qualified Practising Insurance Broker, Fellow of NIBA and an Associate of ANZIIF. He holds an Advanced Diploma in Financial Services (General Insurance Broking) and was named NIBA Queensland Broker for 2014.
20
Senior Management Team
Robert KellyManaging Director & CEO
Robert co-founded Steadfast and has over 45 years’ experience in the insurance industry. He is ranked the second most influential person in insurance by Insurance News, and was awarded the ACORD Rainmaker Award in 2014. Robert is a Qualified Practising Insurance Broker, a Fellow of NIBA, a Senior Associate of ANZIIF, a Certified Insurance Professional and a Graduate member of the Australian Institute of Company Directors.
Adrian Humphreys Executive General Manager Business Development
Adrian joined Steadfast in January 2015 in a new role to help brokers grow their business. He was previously Managing Director of Lloyd’s Australia where he grew the business by 84% to over $2 billion in under five years while increasing the number of agencies. Adrian has over 10 years’ experience in insurance, working for both Lloyd’s of London and Aon. Prior to insurance, he worked at KPMG Financial Services.
Nick Cook Executive General Manager Partner & Broker Services
Nick, who joined Steadfast in February 2015, had over 12 years’ experience at Zurich Financial Services, including three as the Head of Customer & Proposition Development (where he was responsible for the performance of Zurich products & propositions in the marketplace) and nine years as a distribution manager. He is an Associate ANZIIF member and has graduated from both the AGSM Leadership Program and the Prosci Organizational Change Management Program.
Linda Ellis Group Company Secretary & Corporate Counsel
Linda joined Steadfast in 2013. She has over 15 years’ experience as a lawyer in Sydney and London, including at King & Wood Mallesons, Atanaskovic Hartnell and Clifford Chance. Linda has diverse experience in capital markets, corporate and commercial law, and corporate governance. She is a Graduate member of the Australian Institute of Company Directors, holds a BEC and LLB (Hons 1) and is on the board of Mosman Church of England Preparatory School.
Samantha Hollman Executive General Manager Projects, Brand, People
Sam joined Steadfast in 2000 and has more than 20 years’ experience in the insurance industry. She has held key roles in broker services, project management, and marketing and communications. Sam works closely with the Managing Director & CEO and the Board, implementing strategic initiatives for the Group, including marketing trips overseas to review projects on an international level. She also oversees human resources and marketing for the Group.
Our senior management team has proven expertise and experience across the different parts of our business. Together we build on the strength of Steadfast.
Steadfast Group Annual Report 2016
21
Stephen Humphrys Chief Financial Officer
Stephen joined Steadfast in 2013 and has over 25 years’ experience as a Chartered Accountant and extensive experience in acquisitions and integrations. As Managing Director of Moore Stephens Sydney for 10 years and Chairman of Moore Stephens Australasia for three, Stephen played a key role in placing Moore Stephens into the top 10 accounting firms in Australia. Stephen is a Fellow of the Institute of Chartered Accountants.
Simon Lightbody Chief Executive Officer of Steadfast Underwriting Agencies
Simon has worked in the insurance industry for 25 years in both the UK (at Lloyd’s of London) and Australia, including nine years within his own business, Miramar Underwriting Agency (Miramar). Steadfast entered into the underwriting agency market in 2005 as a 50% joint venture partner of Miramar and acquired the remaining balance in August 2013.
Allan Reynolds Executive General Manager Direct & New Zealand
Allan joined Steadfast in 2002, and in April 2015 took on the Direct and New Zealand portfolios. With a background in product development and distribution, corporate strategy and portfolio management, Allan has more than 40 years of industry experience in general insurance broking. He holds a Diploma of Business Studies (Insurance), is a Certified Insurance Professional and is a Fellow, honorary member and board member of ANZIIF.
Peter Roberts Executive General Manager Integration Synergies
Peter joined Steadfast in 2013 and focuses on back office outsourcing opportunities for the Group. He was also Managing Director of White Outsourcing until stepping down on 30 June 2016 to concentrate on his role at Steadfast. Peter has over 25 years’ experience in accounting and back office services to the financial services sector, is a member of the Institute of Chartered Accountants, and commenced his career in accounting with KPMG.
Dana Williams Chief Operating Officer
Dana joined Steadfast in January 2014 and was promoted to COO in June that year. Her focus is on working with Steadfast equity brokers to improve their operations, as well as acquisitions including due diligence and integration. Dana has 25 years’ business experience, including 15 in insurance. She has held senior roles at Hub International and Marsh, holds a Bachelor of Engineering and an MBA, and is a Certified Public Accountant.
Duncan RamsayGeneral Counsel
Duncan began with Steadfast in June 2014 after 20 years at QBE. He was Group General Counsel and Company Secretary at QBE. He was also a director or secretary of a number of QBE-controlled entities in Australia. Duncan's career commenced in 1986 with Freehills in Sydney. He holds degrees in commerce and law and is a Fellow of ANZIIF and the Governance Institute of Australia.
22
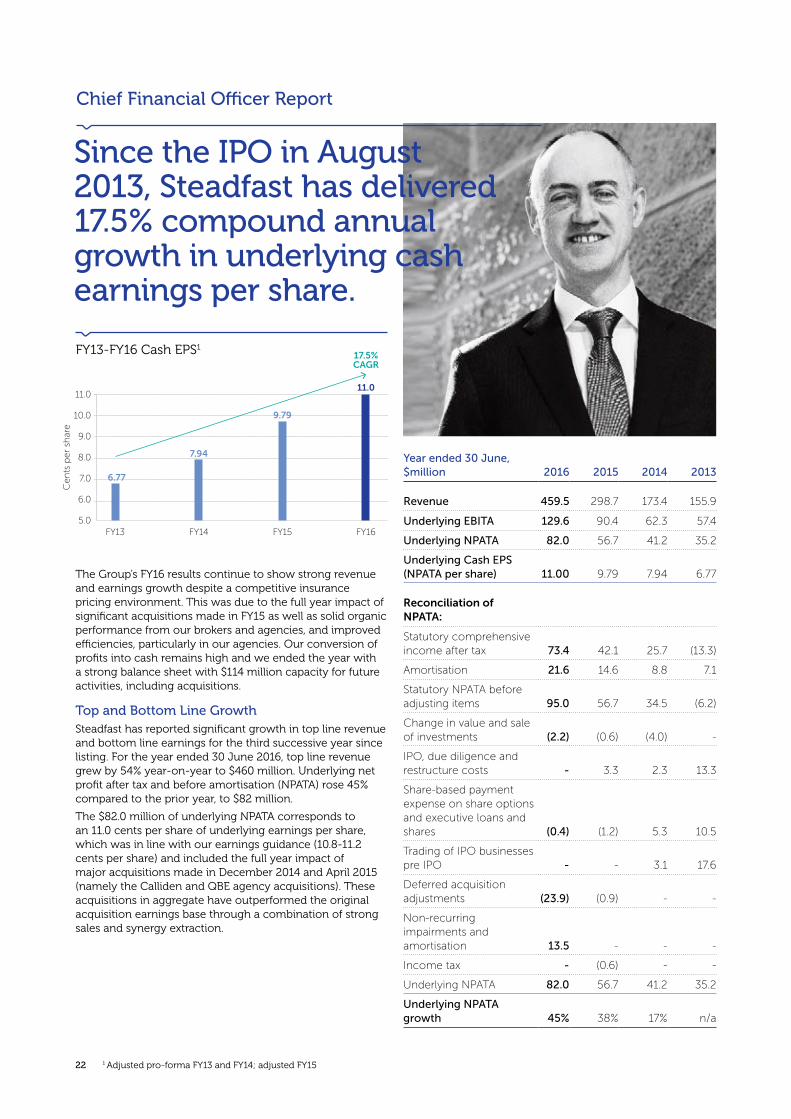
Since the IPO in August 2013, Steadfast has delivered 17.5% compound annual growth in underlying cash earnings per share.
Chief Financial Officer Report
The Group’s FY16 results continue to show strong revenue and earnings growth despite a competitive insurance pricing environment. This was due to the full year impact of significant acquisitions made in FY15 as well as solid organic performance from our brokers and agencies, and improved efficiencies, particularly in our agencies. Our conversion of profits into cash remains high and we ended the year with a strong balance sheet with $114 million capacity for future activities, including acquisitions.
Top and Bottom Line GrowthSteadfast has reported significant growth in top line revenue and bottom line earnings for the third successive year since listing. For the year ended 30 June 2016, top line revenue grew by 54% year-on-year to $460 million. Underlying net profit after tax and before amortisation (NPATA) rose 45% compared to the prior year, to $82 million.
The $82.0 million of underlying NPATA corresponds to an 11.0 cents per share of underlying earnings per share, which was in line with our earnings guidance (10.8-11.2 cents per share) and included the full year impact of major acquisitions made in December 2014 and April 2015 (namely the Calliden and QBE agency acquisitions). These acquisitions in aggregate have outperformed the original acquisition earnings base through a combination of strong sales and synergy extraction.
Year ended 30 June, $million 2016 2015 2014 2013
Revenue 459.5 298.7 173.4 155.9
Underlying EBITA 129.6 90.4 62.3 57.4
Underlying NPATA 82.0 56.7 41.2 35.2
Underlying Cash EPS (NPATA per share) 11.00 9.79 7.94 6.77
Reconciliation of NPATA:
Statutory comprehensive income after tax 73.4 42.1 25.7 (13.3)
Amortisation 21.6 14.6 8.8 7.1
Statutory NPATA before adjusting items 95.0 56.7 34.5 (6.2)
Change in value and sale of investments (2.2) (0.6) (4.0) -
IPO, due diligence and restructure costs - 3.3 2.3 13.3
Share-based payment expense on share options and executive loans and shares (0.4) (1.2) 5.3 10.5
Trading of IPO businesses pre IPO - - 3.1 17.6
Deferred acquisition adjustments (23.9) (0.9) - -
Non-recurring impairments and amortisation 13.5 - - -
Income tax - (0.6) - -
Underlying NPATA 82.0 56.7 41.2 35.2
Underlying NPATA growth 45% 38% 17% n/a
1 Adjusted pro-forma FY13 and FY14; adjusted FY15
FY13-FY16 Cash EPS1
11.0
10.0
9.0
8.0
7.0
6.0
5.0FY13 FY14 FY15 FY16
6.77
7.94
9.79
11.0
17.5% CAGR
Steadfast Group Annual Report 2016
231 Adjusted pro-forma FY11-FY13; adjusted FY15-FY16
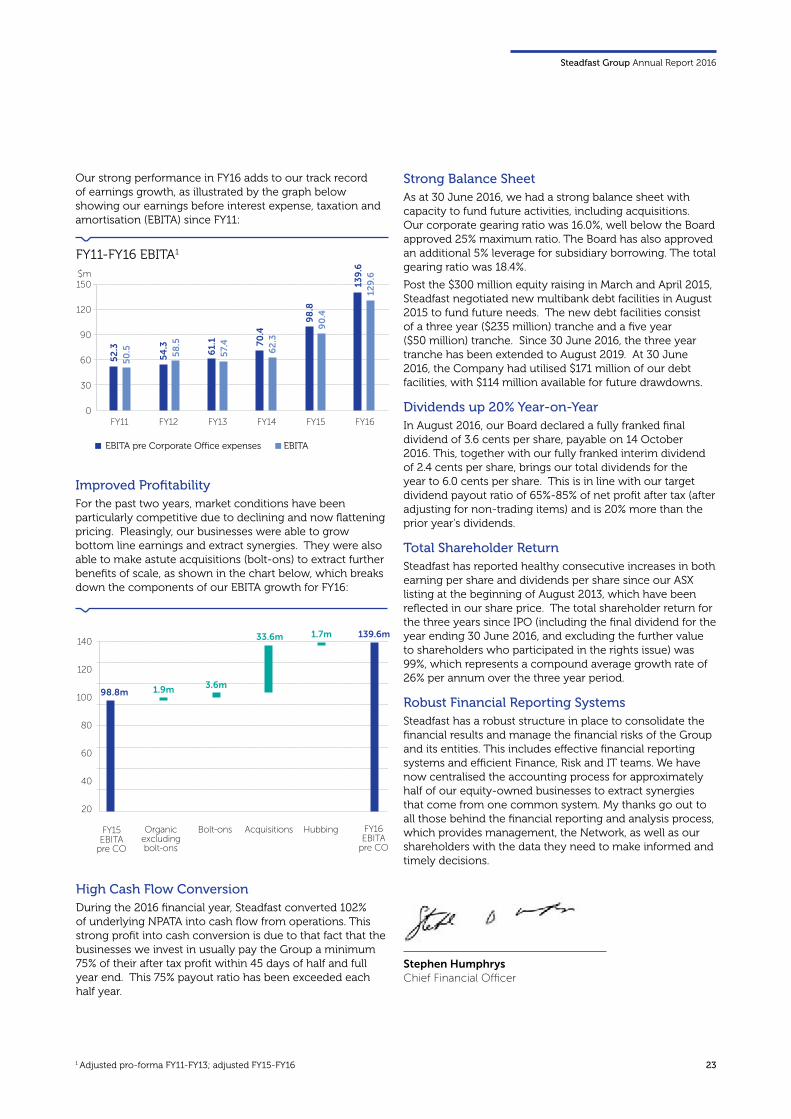
Our strong performance in FY16 adds to our track record of earnings growth, as illustrated by the graph below showing our earnings before interest expense, taxation and amortisation (EBITA) since FY11:
Improved ProfitabilityFor the past two years, market conditions have been particularly competitive due to declining and now flattening pricing. Pleasingly, our businesses were able to grow bottom line earnings and extract synergies. They were also able to make astute acquisitions (bolt-ons) to extract further benefits of scale, as shown in the chart below, which breaks down the components of our EBITA growth for FY16:
High Cash Flow ConversionDuring the 2016 financial year, Steadfast converted 102% of underlying NPATA into cash flow from operations. This strong profit into cash conversion is due to that fact that the businesses we invest in usually pay the Group a minimum 75% of their after tax profit within 45 days of half and full year end. This 75% payout ratio has been exceeded each half year.
EBITA pre Corporate O�ce expenses EBITA
FY11-FY16 EBITA1
$m150
120
90
60
30
0FY11 FY14FY13FY12 FY15 FY16
140
120
100
80
60
40
20
FY15 EBITA
pre CO
Organic excluding bolt-ons
Bolt-ons Acquisitions Hubbing FY16 EBITA
pre CO
139.6m
98.8m 1.9m 3.6m
33.6m 1.7m
Strong Balance SheetAs at 30 June 2016, we had a strong balance sheet with capacity to fund future activities, including acquisitions. Our corporate gearing ratio was 16.0%, well below the Board approved 25% maximum ratio. The Board has also approved an additional 5% leverage for subsidiary borrowing. The total gearing ratio was 18.4%.
Post the $300 million equity raising in March and April 2015, Steadfast negotiated new multibank debt facilities in August 2015 to fund future needs. The new debt facilities consist of a three year ($235 million) tranche and a five year ($50 million) tranche. Since 30 June 2016, the three year tranche has been extended to August 2019. At 30 June 2016, the Company had utilised $171 million of our debt facilities, with $114 million available for future drawdowns.
Dividends up 20% Year-on-YearIn August 2016, our Board declared a fully franked final dividend of 3.6 cents per share, payable on 14 October 2016. This, together with our fully franked interim dividend of 2.4 cents per share, brings our total dividends for the year to 6.0 cents per share. This is in line with our target dividend payout ratio of 65%-85% of net profit after tax (after adjusting for non-trading items) and is 20% more than the prior year's dividends.
Total Shareholder ReturnSteadfast has reported healthy consecutive increases in both earning per share and dividends per share since our ASX listing at the beginning of August 2013, which have been reflected in our share price. The total shareholder return for the three years since IPO (including the final dividend for the year ending 30 June 2016, and excluding the further value to shareholders who participated in the rights issue) was 99%, which represents a compound average growth rate of 26% per annum over the three year period.
Robust Financial Reporting SystemsSteadfast has a robust structure in place to consolidate the financial results and manage the financial risks of the Group and its entities. This includes effective financial reporting systems and efficient Finance, Risk and IT teams. We have now centralised the accounting process for approximately half of our equity-owned businesses to extract synergies that come from one common system. My thanks go out to all those behind the financial reporting and analysis process, which provides management, the Network, as well as our shareholders with the data they need to make informed and timely decisions.
Stephen Humphrys Chief Financial Officer
24
Directors’ report 23
Remuneration report - audited 33
Lead auditor’s independence declaration 53
FINANCIAL STATEMENTS
Consolidated statement of profit or loss and other comprehensive income 54
Consolidated statement of financial position 56
Consolidated statement of changes in equity 58
Consolidated statement of cash flows 60
NOTES TO THE FINANCIAL STATEMENTS
Note 1. General information 61
Note 2. Significant accounting policies 61
Note 3. Critical accounting judgements, estimates and assumptions 65
Note 4. Operating segments 66
Note 5. Earnings per share 68
Note 6. Dividends 69
Note 7. Intangible assets and goodwill 70
Note 8. Borrowings 72
Note 9. Notes to the statement of changes in equity and reserves 73
Note 10. Business combinations 75
Note 11. Subsidiaries 78
Note 12. Investments in associates 81
Note 13. Investment in joint venture 83
Note 14. Financial instruments 84
Note 15. Contingencies 86
Note 16. Commitments 87
Note 17. Events after the reporting period 87
Note 18. Profit and loss information 87
Note 19. Share-based remuneration 88
Note 20. Taxation 90
Note 21. Notes to the statement of cash flows 92
Note 22. Related party transactions 93
Note 23. Parent entity information 95
Note 24. Remuneration of auditors 96
Directors’ declaration 97
Independent auditor’s report 98
2016 Financial Report

25
Steadfast Group Annual Report 2016
Name Date of appointment
CHAIRMAN
Frank O’Halloran, AM 21 October 2012
MANAGING DIRECTOR & CEO
Robert Kelly 18 April 1996
OTHER DIRECTORS
David Liddy, AM 1 January 2013
Anne O’Driscoll 1 July 2013
Philip Purcell 1 February 2013
Greg Rynenberg 10 August 1998
Name Company Period of directorship
Frank O’Halloran, AM SubZero Group Limited December 2013 to June 2016
Robert Kelly None
David Liddy, AM Collection House Limited From March 2012
Emerchants Limited From April 2012
Anne O’Driscoll Infomedia Limited From December 2014
Philip Purcell None
Greg Rynenberg None
Directors’ Report
The Directors present their report together with the consolidated financial statements of Steadfast Group Limited (Steadfast or the Company) and its subsidiaries, and the Group’s interests in associates and a joint venture (Steadfast Group or the Group) for the financial year ended 30 June 2016 (FY16) and the auditor’s report thereon.
DIRECTORS
The Directors of the Company at any time during or since the end of the financial year are as follows. Directors were in office for the entire period unless otherwise stated.
DIRECTORSHIPS OF OTHER LISTED COMPANIES
Directorships of other listed companies held by the Directors in the three years preceding the end of the financial year are as follows:
COMPANY SECRETARIES
LINDA ELLIS, BEC, LLB (HONS 1), GAICD
Linda Ellis joined the Company in June 2013 as Group Company Secretary & Corporate Counsel. Linda is a lawyer with over 15 years’ experience. Further details of Linda’s experience are set out under Senior Management Team on page 19.
PETER ROBERTS, BBUS, CA
Peter Roberts was appointed Company Secretary in May 2013 and has over 25 years’ experience in the fields of chartered accountancy and specialised back-office services to the financial services sector. Peter is also Executive General Manager – Integration Synergies. Further details of Peter’s experience are set out under Senior Management Team on page 19.
Particulars of the Directors’ qualifications and experience are set out under Board of Directors on page 17.
26
Director BoardAudit &
Risk CommitteeNomination Committee
Remuneration & Succession Planning
Committee
Total number of meetings held 6 4 4 4
Eligible to attend as a
member
Attended as a
member
Eligible to attend as
a member
Attended as a
member
Eligible to attend as
a member
Attended as a
member
Eligible to attend as
a member
Attended as a
member
Frank O’Halloran, AM 6 6 4 4 4 4 4 4
Robert Kelly 6 6 - - 4 4 - -
David Liddy, AM 6 6 4 4 4 4 4 4
Anne O’Driscoll 6 6 4 4 4 4 4 4
Philip Purcell 6 6 4 4 4 4 4 4
Greg Rynenberg 6 6 4 4 4 4 4 4
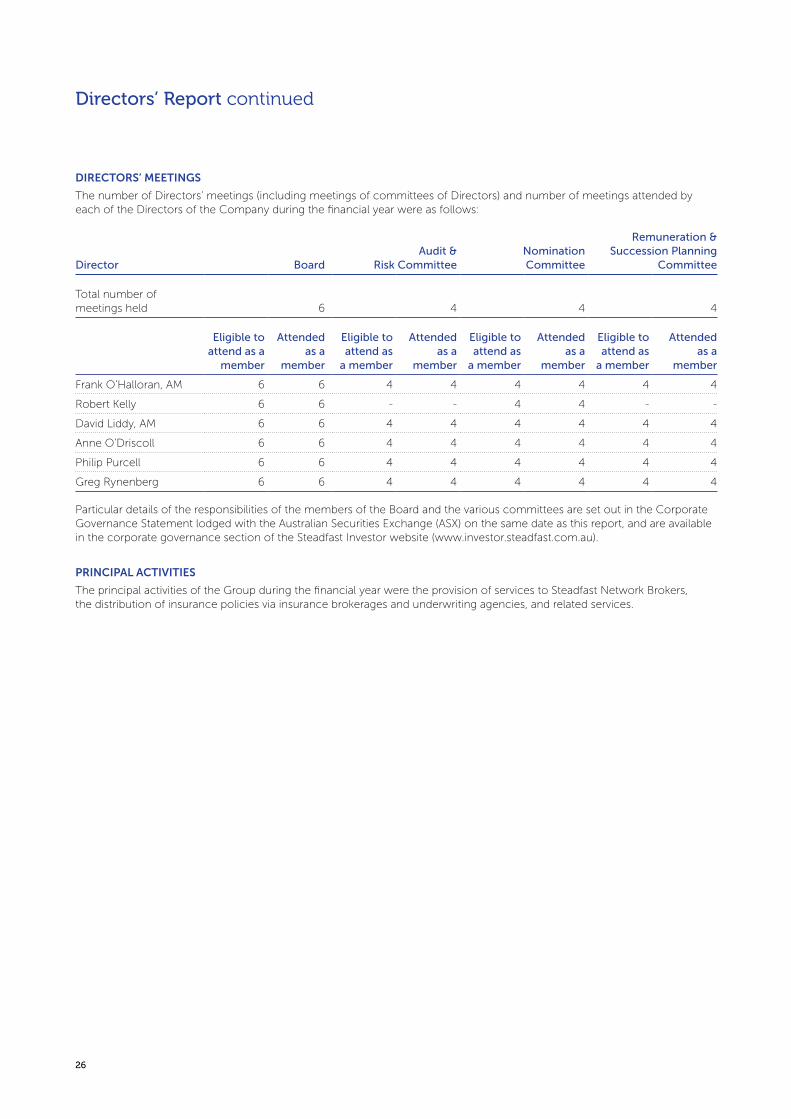
DIRECTORS’ MEETINGS
The number of Directors’ meetings (including meetings of committees of Directors) and number of meetings attended by each of the Directors of the Company during the financial year were as follows:
Particular details of the responsibilities of the members of the Board and the various committees are set out in the Corporate Governance Statement lodged with the Australian Securities Exchange (ASX) on the same date as this report, and are available in the corporate governance section of the Steadfast Investor website (www.investor.steadfast.com.au).
PRINCIPAL ACTIVITIES
The principal activities of the Group during the financial year were the provision of services to Steadfast Network Brokers, the distribution of insurance policies via insurance brokerages and underwriting agencies, and related services.
Directors’ Report continued
Steadfast Group Annual Report 2016
27
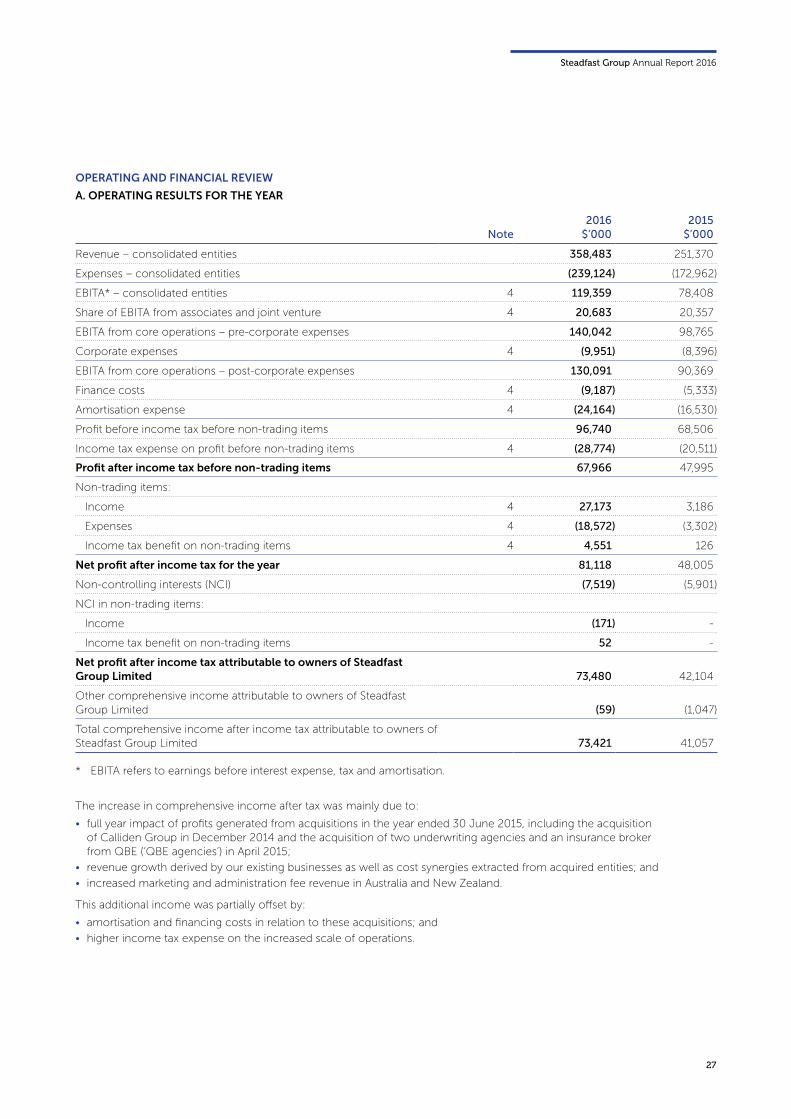
OPERATING AND FINANCIAL REVIEW
A. OPERATING RESULTS FOR THE YEAR
Note2016
$’0002015
$’000
Revenue – consolidated entities 358,483 251,370
Expenses – consolidated entities (239,124) (172,962)
EBITA* – consolidated entities 4 119,359 78,408
Share of EBITA from associates and joint venture 4 20,683 20,357
EBITA from core operations – pre-corporate expenses 140,042 98,765
Corporate expenses 4 (9,951) (8,396)
EBITA from core operations – post-corporate expenses 130,091 90,369
Finance costs 4 (9,187) (5,333)
Amortisation expense 4 (24,164) (16,530)
Profit before income tax before non-trading items 96,740 68,506
Income tax expense on profit before non-trading items 4 (28,774) (20,511)
Profit after income tax before non-trading items 67,966 47,995
Non-trading items:
Income 4 27,173 3,186
Expenses 4 (18,572) (3,302)
Income tax benefit on non-trading items 4 4,551 126
Net profit after income tax for the year 81,118 48,005
Non-controlling interests (NCI) (7,519) (5,901)
NCI in non-trading items:
Income (171) -
Income tax benefit on non-trading items 52 -
Net profit after income tax attributable to owners of Steadfast Group Limited 73,480 42,104
Other comprehensive income attributable to owners of Steadfast Group Limited (59) (1,047)
Total comprehensive income after income tax attributable to owners of Steadfast Group Limited 73,421 41,057
* EBITA refers to earnings before interest expense, tax and amortisation.
The increase in comprehensive income after tax was mainly due to:
• full year impact of profits generated from acquisitions in the year ended 30 June 2015, including the acquisition of Calliden Group in December 2014 and the acquisition of two underwriting agencies and an insurance broker from QBE (‘QBE agencies’) in April 2015;
• revenue growth derived by our existing businesses as well as cost synergies extracted from acquired entities; and
• increased marketing and administration fee revenue in Australia and New Zealand.
This additional income was partially offset by:
• amortisation and financing costs in relation to these acquisitions; and
• higher income tax expense on the increased scale of operations.
28
Directors’ Report continued
B. REVIEW OF FINANCIAL CONDITION
I. Financial position
The total assets of the Group as at 30 June 2016 were $1,712.498 million compared to $1,615.507 million as at 30 June 2015. The increase was mainly attributable to the addition of assets from acquired businesses throughout the year as detailed in Note 10 to the financial statements.
Total liabilities of the Group as at 30 June 2016 were $814.357 million compared to $773.942 million as at 30 June 2015. The increase was mainly attributable to:
• the assumption of liabilities in the books of the newly acquired businesses; and
• the $40.079 million increase in bank loans, principally to fund acquisitions.
The increase in the Group’s equity from $841.565 million at 30 June 2015 to $898.141 million at 30 June 2016 largely reflects:
• $8.911 million of new shares issued in relation to the dividend reinvestment plan (DRP); and
• retention of profits not paid as dividends.
The Group has a multibank syndicated facility that will allow the Group to borrow up to $285.000 million. As at balance date, the Group had the ability to borrow an additional $114.072 million from this facility.
II. Cash from operations
The net inflows of $126.227 million include a net inflow of $42.259 million to broking accounts and net inflows from the balance of operating activities of $83.968 million.
The net operating cash flows, before broking trust account movements, of $83.968 million are higher than those for the prior period, reflecting the continued growth of the Group. This amount represents the derivation of the profits for the period (after removing significant non-cash items), apart from the delayed receipt of dividends from associates, which are contracted to be received half-yearly (typically no later than 45 days post December half year end and June year end).
The net cash inflow from operating activities for the year ended 30 June 2016 was $126.227 million compared to $66.999 million for the year ended 30 June 2015.
III. Capital management
As at 30 June 2016, the Company had a total of 749.752 million ordinary shares on issue. This is an increase of 6.338 million shares since 30 June 2015. The increase is due to DRP participation in October 2015. In April 2016 the DRP was satisfied via an on-market purchase of shares.
The Board leverages the Group’s equity, adopting a maximum 25.0% corporate gearing ratio (defined as corporate debt: corporate debt and equity). As at 30 June 2016, the Company’s corporate gearing ratio was 16.0% (2015: 14.9%). In recognition that subsidiaries may require debt to fund bolt on acquisitions, the Group has limited the extent of subsidiary borrowings to an additional 5% leverage. The Group's total gearing ratio at year end was 18.4% (2015: 16.1%). Refer note 9C.
There were also two major items of a non-trading nature relating to businesses acquired during the year ended 30 June 2015, namely:
• revenue from downwards revised estimates of deferred acquisition payments where earnout arrangements existed; and
• an impairment of certain intangible assets acquired during that year, including businesses where there were downward estimates of deferred acquisition payments.
Refer Note 4 for further details.
Some of the financial data in the table above, namely the EBITA-related and non-trading items, are not disclosed in accordance with current Australian Accounting Standards requirements. However, all financial data is based on the information disclosed in the audited financial statements and notes to the financial statements of the Group and follow the recognition requirements of Australian Accounting Standards.
Steadfast Group Annual Report 2016
29
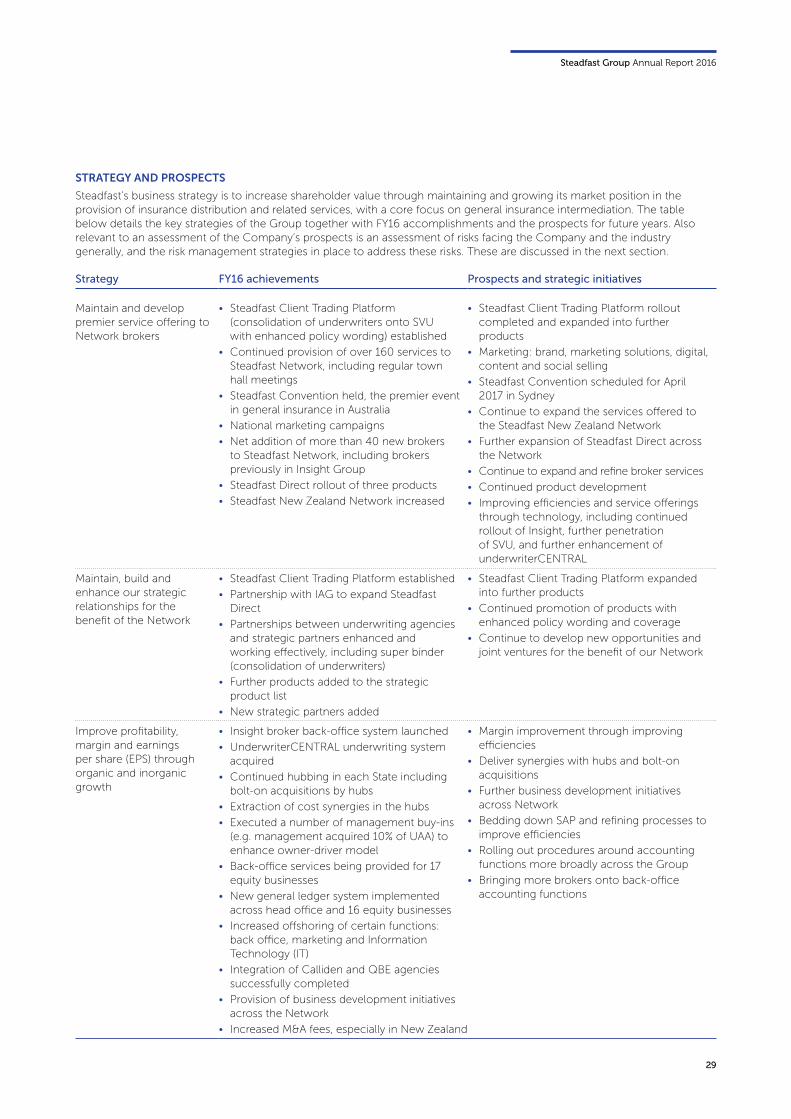
STRATEGY AND PROSPECTS
Steadfast’s business strategy is to increase shareholder value through maintaining and growing its market position in the provision of insurance distribution and related services, with a core focus on general insurance intermediation. The table below details the key strategies of the Group together with FY16 accomplishments and the prospects for future years. Also relevant to an assessment of the Company’s prospects is an assessment of risks facing the Company and the industry generally, and the risk management strategies in place to address these risks. These are discussed in the next section.
Strategy FY16 achievements Prospects and strategic initiatives
Maintain and develop premier service offering to Network brokers
• Steadfast Client Trading Platform (consolidation of underwriters onto SVU with enhanced policy wording) established
• Continued provision of over 160 services to Steadfast Network, including regular town hall meetings
• Steadfast Convention held, the premier event in general insurance in Australia
• National marketing campaigns
• Net addition of more than 40 new brokers to Steadfast Network, including brokers previously in Insight Group
• Steadfast Direct rollout of three products
• Steadfast New Zealand Network increased
• Steadfast Client Trading Platform rollout completed and expanded into further products
• Marketing: brand, marketing solutions, digital, content and social selling
• Steadfast Convention scheduled for April 2017 in Sydney
• Continue to expand the services offered to the Steadfast New Zealand Network
• Further expansion of Steadfast Direct across the Network
• Continue to expand and refine broker services
• Continued product development
• Improving efficiencies and service offerings through technology, including continued rollout of Insight, further penetration of SVU, and further enhancement of underwriterCENTRAL
Maintain, build and enhance our strategic relationships for the benefit of the Network
• Steadfast Client Trading Platform established
• Partnership with IAG to expand Steadfast Direct
• Partnerships between underwriting agencies and strategic partners enhanced and working effectively, including super binder (consolidation of underwriters)
• Further products added to the strategic product list
• New strategic partners added
• Steadfast Client Trading Platform expanded into further products
• Continued promotion of products with enhanced policy wording and coverage
• Continue to develop new opportunities and joint ventures for the benefit of our Network
Improve profitability, margin and earnings per share (EPS) through organic and inorganic growth
• Insight broker back-office system launched
• UnderwriterCENTRAL underwriting system acquired
• Continued hubbing in each State including bolt-on acquisitions by hubs
• Extraction of cost synergies in the hubs
• Executed a number of management buy-ins (e.g. management acquired 10% of UAA) to enhance owner-driver model
• Back-office services being provided for 17 equity businesses
• New general ledger system implemented across head office and 16 equity businesses
• Increased offshoring of certain functions: back office, marketing and Information Technology (IT)
• Integration of Calliden and QBE agencies successfully completed
• Provision of business development initiatives across the Network
• Increased M&A fees, especially in New Zealand
• Margin improvement through improving efficiencies
• Deliver synergies with hubs and bolt-on acquisitions
• Further business development initiatives across Network
• Bedding down SAP and refining processes to improve efficiencies
• Rolling out procedures around accounting functions more broadly across the Group
• Bringing more brokers onto back-office accounting functions
30
Directors’ Report continued
Strategy FY16 achievements Prospects and strategic initiatives
Growth through both acquisitions and new Network brokers
• Acquired a number of businesses, including bolt-on acquisitions by equity-owned businesses
• Continually assessed potential acquisitions in the acquisition pipeline
• Executed $285m syndicated debt facility to provide funding for acquisitions
• Actively engaging Network brokers as potential acquisitions
• Continue to develop an acquisition pipeline and execute acquisitions in accordance with strict cultural and financial acquisition guidelines, including that acquisitions be earnings accretive in first 12 months using a 75% equity and 25% debt funding assumption
• Implement management buy-ins to drive owner-driver model
• Attract new Network brokers as we pursue strategy of providing premier service offering to Network brokers
Complete Steadfast Client Trading Platform (SCTP)
• Participants in business pack signed off • Roll out the SCTP beginning with business pack, followed by professional lines and then public and product liability
Continue to develop our London operation to support our Network including super binder
• Super binder (consolidation of underwriters into one) is operational and writing new and renewal business
• Further expand and develop super binder
• Expand London office capability
• Expand use of Steadfast Re placement services into London
Expand our international connections and footprint
• Steadfast Asia Network (co-broking of risks that are referred from Australia) in place with 11 Asian brokerages across 8 regions
• Extensive liaison with regulatory authorities to set up Steadfast cluster in Singapore
• Licensing in Singapore by UAA
• Explore and develop our international footprint
• Build our Network in Asia
• Continue to consider acquisitions of Asian brokerages
• Underlying business expansion into Asia
Enhance our organisational sustainability
• Continued provision of technology solutions that support strategies, e.g. development of Insight
• Ongoing improvements in risk management and governance policies and procedures
• Formalised succession planning for key roles in equity-owned businesses
• Brand kept reputable and strong
• Brand awareness grown and initiatives executed
• Strong, dynamic, ethical culture continues
• Various initiatives executed to engage workforce to ensure quality people driving business performance and supporting diversity
• Business conducted in accordance with budget
• Continue HR initiatives for a high performance culture
• Continue to provide technology solutions that support key strategies and ongoing sustainability
• Continue to implement good practice corporate governance, including risk management
• Continue to conduct business in accordance with the budget approved by the Board
• Continue to support strong, dynamic, ethical culture
Steadfast Group Annual Report 2016
31
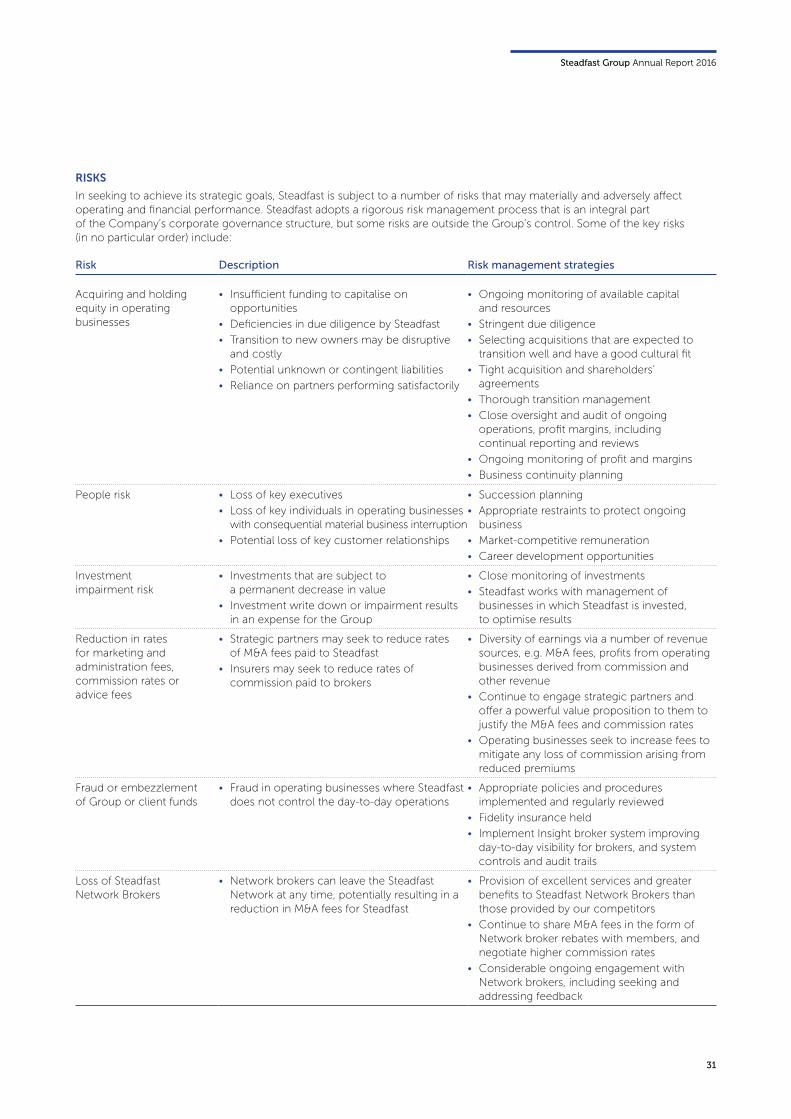
RISKS
In seeking to achieve its strategic goals, Steadfast is subject to a number of risks that may materially and adversely affect operating and financial performance. Steadfast adopts a rigorous risk management process that is an integral part of the Company’s corporate governance structure, but some risks are outside the Group’s control. Some of the key risks (in no particular order) include:
Risk Description Risk management strategies
Acquiring and holding equity in operating businesses
• Insufficient funding to capitalise on opportunities
• Deficiencies in due diligence by Steadfast
• Transition to new owners may be disruptive and costly
• Potential unknown or contingent liabilities
• Reliance on partners performing satisfactorily
• Ongoing monitoring of available capital and resources
• Stringent due diligence
• Selecting acquisitions that are expected to transition well and have a good cultural fit
• Tight acquisition and shareholders’ agreements
• Thorough transition management
• Close oversight and audit of ongoing operations, profit margins, including continual reporting and reviews
• Ongoing monitoring of profit and margins
• Business continuity planning
People risk • Loss of key executives
• Loss of key individuals in operating businesses with consequential material business interruption
• Potential loss of key customer relationships
• Succession planning
• Appropriate restraints to protect ongoing business
• Market-competitive remuneration
• Career development opportunities
Investment impairment risk
• Investments that are subject to a permanent decrease in value
• Investment write down or impairment results in an expense for the Group
• Close monitoring of investments
• Steadfast works with management of businesses in which Steadfast is invested, to optimise results
Reduction in rates for marketing and administration fees, commission rates or advice fees
• Strategic partners may seek to reduce rates of M&A fees paid to Steadfast
• Insurers may seek to reduce rates of commission paid to brokers
• Diversity of earnings via a number of revenue sources, e.g. M&A fees, profits from operating businesses derived from commission and other revenue
• Continue to engage strategic partners and offer a powerful value proposition to them to justify the M&A fees and commission rates
• Operating businesses seek to increase fees to mitigate any loss of commission arising from reduced premiums
Fraud or embezzlement of Group or client funds
• Fraud in operating businesses where Steadfast does not control the day-to-day operations
• Appropriate policies and procedures implemented and regularly reviewed
• Fidelity insurance held
• Implement Insight broker system improving day-to-day visibility for brokers, and system controls and audit trails
Loss of Steadfast Network Brokers
• Network brokers can leave the Steadfast Network at any time, potentially resulting in a reduction in M&A fees for Steadfast
• Provision of excellent services and greater benefits to Steadfast Network Brokers than those provided by our competitors
• Continue to share M&A fees in the form of Network broker rebates with members, and negotiate higher commission rates
• Considerable ongoing engagement with Network brokers, including seeking and addressing feedback
32
Directors’ Report continued
Risk Description Risk management strategies
Loss of underwriter for Insurance Underwriting Agencies
• Risk that the underwriter withdraws capacity for strategic reasons (exit of lines of business or country exit)
• Risk that an underwriter withdraws due to uneconomic underwriting results
• Loss of third party broker support
• Long-standing delivery of attractive results to underwriters
• Long-standing strong relationships with both incumbent underwriters and/or alternative capacity
• Steadfast Underwriting Agencies (SUA) results and classes of business written are not in the volatile classes that underwriters historically enter and exit
• Replacement capacity available for profitable portfolios
• Establishment of London super binder will provide better access to deeper insurance markets
Reliance on strategic partners
• Potential reduction in M&A fees (and commission due to lower gross written premium (GWP)) if strategic partners are lost and not replaced within appropriate timeframe
• Significant effort expended in maintaining and strengthening relationships with strategic partners of which most are longstanding
• Continually adding new strategic partners
Increased competition or market change
• Increased competition from new entrants and existing market participants, including increased commoditisation of business insurance products
• Changes in the remuneration model for insurance brokers or underwriting agencies
• Increased competition or change in market structure for premium funding
• More customers buying direct from insurers through the internet
• Diversity in investments (i.e. portfolio of underwriting agencies, premium funding and complementary services as well as insurance broking)
• Diversity in earnings (e.g. M&A fees, Steadfast Direct as well as profits from investments)
• Geographical spread of the businesses of subsidiaries and associates
Information technology (IT) systems risk
• Risk of data loss/fraud, system breakdown
• Potential material adverse effect on ability to deliver services and profitability
• Implementation risk for the Insight system into our businesses
• Backup, restoration and recovery procedures
• IT security guidelines implemented
• IT risk assessment program and other procedures
• Experienced personnel and controlled rollout with monitoring, management and continual improvement in our rollout process
Reduction in gross written premium (GWP) in the Australian and New Zealand general insurance markets
• Group has a number of revenue sources linked to size and growth of GWP in Australian and New Zealand markets
• GWP is influenced by factors, including pricing decisions by insurers and level of demand for general insurance products (which can be influenced by economic conditions)
• Any softening in local and global economic conditions would be expected to lead to a softening in the level of GWP
• Initiatives to increase the size of the Steadfast Network, make further investments in insurance brokers and underwriting agencies, and other strategic initiatives (including increasing fee income) have the capacity to partially offset pressure on profitability of any softening in GWP
• SME sector, which accounts for 85%+ of Steadfast’s total GWP sold through the Steadfast Network, has historically experienced higher growth in GWP with less volatility compared to the large corporate sector
• Growth in other markets, e.g. Steadfast Direct and Asia
Steadfast Group Annual Report 2016
33
Risk Description Risk management strategies
Regulatory risk • Risk that Steadfast’s subsidiaries and associates may individually not comply with their Australian Financial Services Licence requirements or financial services regulation more generally, and their licence may be in the worst case suspended or withdrawn
• Risk that regulatory changes may affect the Group’s or entities within the Group’s business model through costly and burdensome regulations; or the structure and management of the operations; or through changes to remuneration arrangements
• Initial due diligence on acquisition includes reviews of historical and current compliance. Steadfast also provides a range of services to advise and assist the entities within the Group with regulatory change and compliance
• Continue to monitor the entities within the Group from an operations viewpoint
• An ongoing internal audit program, which includes a review of compliance
• Along with other broker representative organisations, the Group monitors and consults on regulatory changes with the regulators to ensure changes are introduced in the most efficient way for the industry, and to minimise unintended consequences
DIVIDENDS
Details of dividends paid or declared by the Company are set out in Note 6 to the accounts.
During the financial year ended 30 June 2016, a final dividend for 2015 of 3.0 cents per share and an interim dividend for 2016 of 2.4 cents per share were declared and paid, both fully franked.
SIGNIFICANT CHANGES IN THE STATE OF AFFAIRS
There were no significant changes in the state of affairs of the Group. The Group continued to acquire insurance intermediaries during the year.
EVENTS SUBSEQUENT TO REPORTING DATE
Subsequent to 30 June 2016, the Board declared a final dividend of 3.6 cents per share, 100% franked. Further details are set out in Note 17 to the accounts.
ENVIRONMENTAL REGULATION
The Group’s operations are not subject to any particular significant environmental regulations under a law of the Commonwealth or of a State or Territory legislation.
INDEMNIFICATION AND INSURANCE OF OFFICERS
The Company has entered into deeds of access, insurance and indemnity, with each Director and officer, which contain rights of access to certain books and records of the Company for a period of seven years after the Director or officer ceases to hold office. This seven-year period can be extended where certain proceedings or investigations commence before the seven-year period expires.
In respect of the indemnity of the Directors and officers, the Company is required, pursuant to the constitution, to indemnify all Directors and officers, past and present, against all liabilities allowed under law. Under the deed of access, insurance and indemnity, the Company indemnifies parties against all liabilities to another person that may arise from their position as a Director or an officer of the Company or its subsidiaries to the extent permitted by law. The deed stipulates that the Company will meet the full amount of any such liabilities, including reasonable legal costs and expenses.
The Company may arrange and maintain Directors’ and officers’ insurance for its Directors and officers to the extent permitted by law. Under the deeds of access, insurance and indemnity, the Company must obtain such insurance during each Director’s and officer’s period of office and for a period of seven years after a Director or an officer ceases to hold office. This seven-year period can be extended where certain proceedings or investigations commence before the seven-year period expires.
Disclosure of the insurance premiums and the nature of liabilities covered by such insurance are prohibited by the relevant contracts of insurance.

34
Directors’ Report continued
NON-AUDIT SERVICES
During the financial year, KPMG, the Group’s auditor, has performed certain other services in addition to their statutory duties.
The Board has considered the non-audit services provided by the auditor and is satisfied that the provision of those non-audit services is compatible with, and did not compromise, the auditor independence requirements of the Corporations Act 2001 for the following reasons:
• all non-audit services were subject to the corporate governance procedures adopted by the Group, and have been reviewed by the Audit & Risk Committee to ensure they do not affect the integrity and objectivity of the auditor; and
• the non-audit services provided do not undermine the general principles relating to auditor independence as set out in APES 110 Code of Ethics for Professional Accountants, as they did not involve reviewing or auditing the auditor’s own work, acting in a management or decision-making capacity for the Group, acting as an advocate for the Group or jointly sharing risks and rewards.
Details of the amounts paid to the auditor of the Group, KPMG and its network firms, for audit and non-audit services provided during the financial year are provided in Note 24 to the financial statements.
LEAD AUDITOR’S INDEPENDENCE DECLARATION
The lead auditor’s independence declaration is set out on page 53 and forms part of the Directors’ Report for the year ended 30 June 2016.
Steadfast Group Annual Report 2016
35
Remuneration Report
1. INTRODUCTION 34
1.1 Key management personnel 34
2. REMUNERATION OUTCOMES FOR 2016 35
2.1 Link between Steadfast’s performance and remuneration 35
2.2 Maximum potential and actual STI and LTI outcomes 36
2.3 Maximum potential and actual remuneration mix 37
3. 2016 REMUNERATION EXPLAINED 38
3.1 Remuneration framework 39
3.2 Fixed remuneration 41
3.3 Short term incentives 41
3.4 Long term incentives 43
3.5 Keeping executives’ and shareholders’ interest aligned 44
4. REMUNERATION IN DETAIL 44
4.1 Statutory remuneration disclosure 44
4.2 Conditional rights 46
4.3 Executive service agreements 46
5. NON-EXECUTIVE DIRECTOR REMUNERATION 47
5.1 Fee structure and policy 47
5.2 Minimum shareholding requirement 47
5.3 Remuneration details for non-executive directors 48
6. ADDITIONAL INFORMATION 49
6.1 Remuneration governance 49
6.2 Valuation of conditional rights 49
6.3 Shareholdings 50
6.4 Executive loans 50
6.5 Related party transactions 52
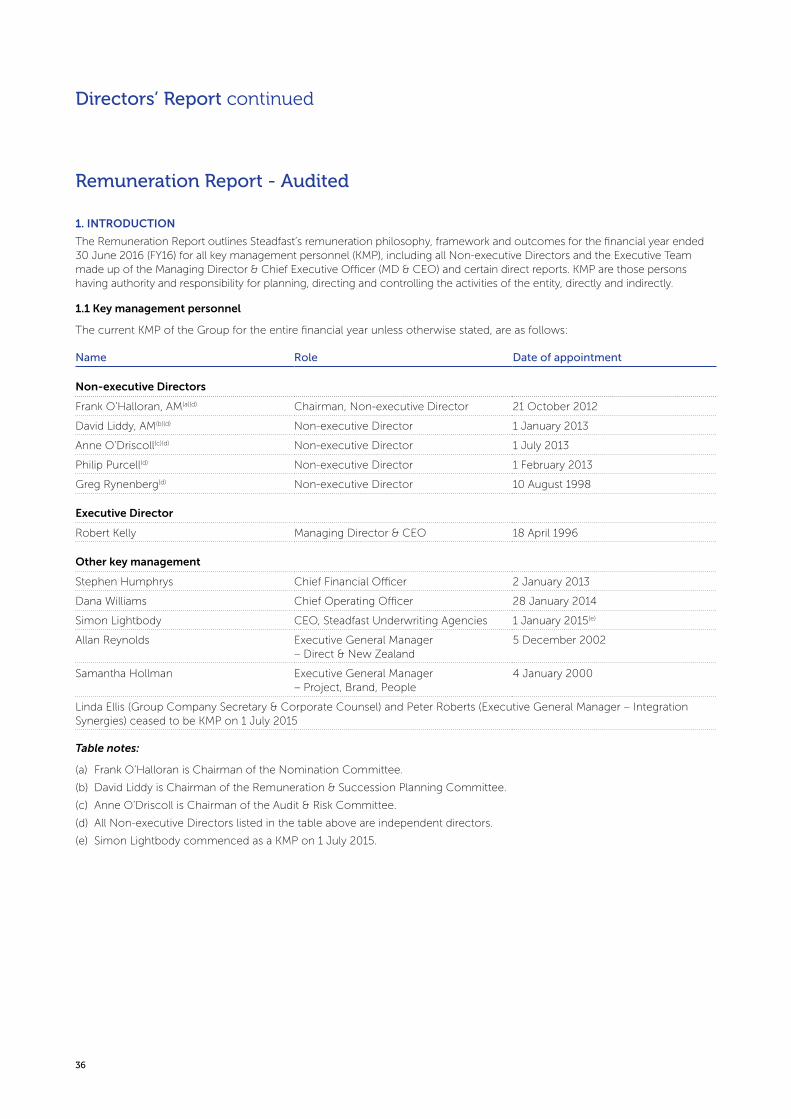
Directors’ Report continued
Remuneration Report - Audited
1. INTRODUCTION
The Remuneration Report outlines Steadfast’s remuneration philosophy, framework and outcomes for the financial year ended 30 June 2016 (FY16) for all key management personnel (KMP), including all Non-executive Directors and the Executive Team made up of the Managing Director & Chief Executive Officer (MD & CEO) and certain direct reports. KMP are those persons having authority and responsibility for planning, directing and controlling the activities of the entity, directly and indirectly.
1.1 Key management personnel
The current KMP of the Group for the entire financial year unless otherwise stated, are as follows:
Name Role Date of appointment
Non-executive Directors
Frank O’Halloran, AM(a)(d) Chairman, Non-executive Director 21 October 2012
David Liddy, AM(b)(d) Non-executive Director 1 January 2013
Anne O’Driscoll(c)(d) Non-executive Director 1 July 2013
Philip Purcell(d) Non-executive Director 1 February 2013
Greg Rynenberg(d) Non-executive Director 10 August 1998
Executive Director
Robert Kelly Managing Director & CEO 18 April 1996
Other key management
Stephen Humphrys Chief Financial Officer 2 January 2013
Dana Williams Chief Operating Officer 28 January 2014
Simon Lightbody CEO, Steadfast Underwriting Agencies 1 January 2015(e)
Allan Reynolds Executive General Manager – Direct & New Zealand
5 December 2002
Samantha Hollman Executive General Manager – Project, Brand, People
4 January 2000
Linda Ellis (Group Company Secretary & Corporate Counsel) and Peter Roberts (Executive General Manager – Integration Synergies) ceased to be KMP on 1 July 2015
Table notes:
(a) Frank O’Halloran is Chairman of the Nomination Committee.
(b) David Liddy is Chairman of the Remuneration & Succession Planning Committee.
(c) Anne O’Driscoll is Chairman of the Audit & Risk Committee.
(d) All Non-executive Directors listed in the table above are independent directors.
(e) Simon Lightbody commenced as a KMP on 1 July 2015.
36
Steadfast Group Annual Report 2016
37
2012 2013 2014 2015 2016
Net profit/(loss) attributable to owners of the Company ($’000) 6,174 (13,437)* 25,087 42,104 72,529
2014(a)
$’000 2015(b)
$’0002016
$’000
Reported net profit attributable to owners of the Company 25,087 42,104 73,480
Less: non-trading income (Note 4 (iv)) (3,996) (3,186) (27,002)
Add: non-trading expenses (Note 4 (v)) 8,562 3,302 18,572
Add: July 2013 trading results, pre-tax 4,507 - -
Less: non-trading tax benefit (1,738) (126) (4,603)
Adjusted pro forma net profit attributable to owners of the Company 32,422 42,094 60,447
Adjusted pro forma diluted EPS (cents per share) 6.22 cents 7.24 cents 8.09 cents
Growth from prior financial year (%) 19.1% 16.4% 11.8%
Growth required for maximum STI (%) 15.0% 15.0% 15.0%
UBS EPS growth for industrial companies (%)(c) 7.4% 5.8% -0.5%
UBS EPS growth for finance sector (%)(c) 8.3% 3.6% -1.3%
2. REMUNERATION OUTCOMES FOR 2016
The following table outlines the returns the Group delivered to its shareholders. The Company experienced significant development and transformation to facilitate its successful listing on the ASX in August 2013. As a result, historical analysis of financial performance for the financial years prior to 2014 does not provide meaningful comparative information to the users of this report.
2.1 Link between Steadfast’s performance and remuneration
EPS is used to determine incentives payable (if any) to the Executive Team. An explanation as to why this measure has been chosen is included in Section 3.1.1. That section also explains changes for FY16 and FY17.
The EPS used for determining short-term incentives (STI) and long-term incentives (LTI) for FY16 excludes non-trading income and expenses approved by the Board. This is consistent with the FY15 underlying EPS used as the base for determining FY15’s STI and LTI awards.
* The adjusted earnings for 2013 were $7.075 million after adjusting for non-trading items.
The reconciliation on the reported EPS to the adjusted EPS used for STI and LTI is as follows:
Notes:
(a) The 2014 adjusted pro forma net profit attributable to owners of the Company reflected the full 12 months’ operations of the Group.
(b) The diluted EPS is adjusted for the bonus element of the rights issue completed in March 2015.
(c) Data sourced from Australian Equity Strategy report published by UBS on 16 June 2016. Figures shown for 2016 are estimates.
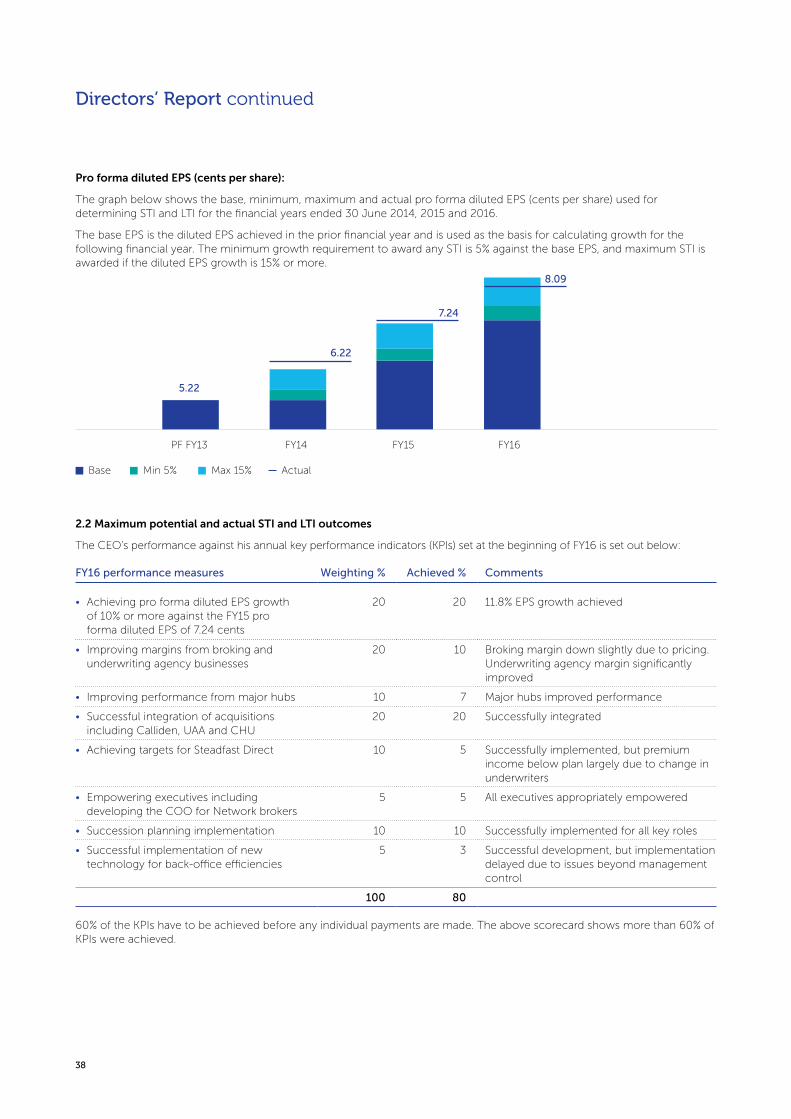
38
Directors’ Report continued
Pro forma diluted EPS (cents per share):
The graph below shows the base, minimum, maximum and actual pro forma diluted EPS (cents per share) used for determining STI and LTI for the financial years ended 30 June 2014, 2015 and 2016.
The base EPS is the diluted EPS achieved in the prior financial year and is used as the basis for calculating growth for the following financial year. The minimum growth requirement to award any STI is 5% against the base EPS, and maximum STI is awarded if the diluted EPS growth is 15% or more.
6.22
5.22
7.24
8.09
Base Min 5% Max 15% Actual
PF FY13 FY14 FY15 FY16
2.2 Maximum potential and actual STI and LTI outcomes
The CEO’s performance against his annual key performance indicators (KPIs) set at the beginning of FY16 is set out below:
FY16 performance measures Weighting % Achieved % Comments
• Achieving pro forma diluted EPS growth of 10% or more against the FY15 pro forma diluted EPS of 7.24 cents
20 20 11.8% EPS growth achieved
• Improving margins from broking and underwriting agency businesses
20 10 Broking margin down slightly due to pricing. Underwriting agency margin significantly improved
• Improving performance from major hubs 10 7 Major hubs improved performance
• Successful integration of acquisitions including Calliden, UAA and CHU
20 20 Successfully integrated
• Achieving targets for Steadfast Direct 10 5 Successfully implemented, but premium income below plan largely due to change in underwriters
• Empowering executives including developing the COO for Network brokers
5 5 All executives appropriately empowered
• Succession planning implementation 10 10 Successfully implemented for all key roles
• Successful implementation of new technology for back-office efficiencies
5 3 Successful development, but implementation delayed due to issues beyond management control
100 80
60% of the KPIs have to be achieved before any individual payments are made. The above scorecard shows more than 60% of KPIs were achieved.
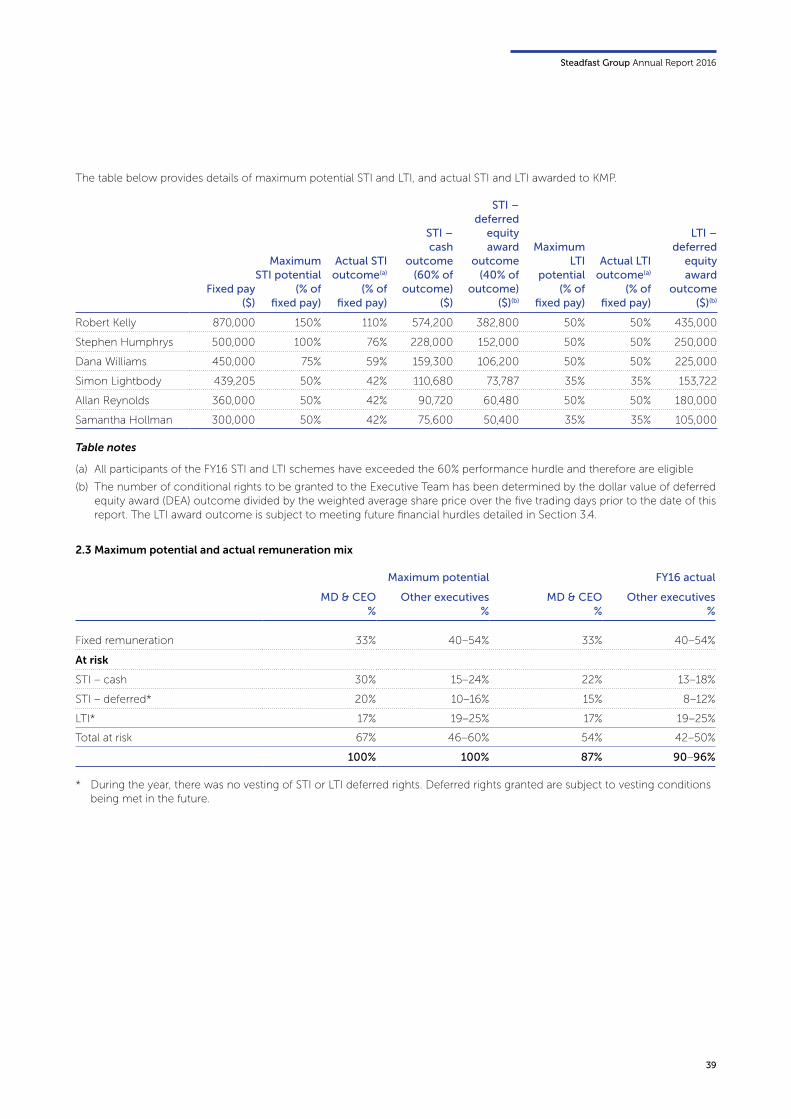
Steadfast Group Annual Report 2016
39
6.22
5.22
7.24
8.09
Base Min 5% Max 15% Actual
PF FY13 FY14 FY15 FY16
The table below provides details of maximum potential STI and LTI, and actual STI and LTI awarded to KMP.
Fixed pay($)
Maximum STI potential
(% of fixed pay)
Actual STI outcome(a)
(% of fixed pay)
STI – cash
outcome(60% of
outcome)($)
STI – deferred
equity award
outcome(40% of
outcome)($)(b)
Maximum LTI
potential(% of
fixed pay)
Actual LTI outcome(a)
(% of fixed pay)
LTI – deferred
equity award
outcome($)(b)
Robert Kelly 870,000 150% 110% 574,200 382,800 50% 50% 435,000
Stephen Humphrys 500,000 100% 76% 228,000 152,000 50% 50% 250,000
Dana Williams 450,000 75% 59% 159,300 106,200 50% 50% 225,000
Simon Lightbody 439,205 50% 42% 110,680 73,787 35% 35% 153,722
Allan Reynolds 360,000 50% 42% 90,720 60,480 50% 50% 180,000
Samantha Hollman 300,000 50% 42% 75,600 50,400 35% 35% 105,000
Maximum potential FY16 actual
MD & CEO%
Other executives%
MD & CEO%
Other executives%
Fixed remuneration 33% 40–54% 33% 40–54%
At risk
STI – cash 30% 15–24% 22% 13–18%
STI – deferred* 20% 10–16% 15% 8–12%
LTI* 17% 19–25% 17% 19–25%
Total at risk 67% 46–60% 54% 42–50%
100% 100% 87% 90–96%
Table notes
(a) All participants of the FY16 STI and LTI schemes have exceeded the 60% performance hurdle and therefore are eligible
(b) The number of conditional rights to be granted to the Executive Team has been determined by the dollar value of deferred equity award (DEA) outcome divided by the weighted average share price over the five trading days prior to the date of this report. The LTI award outcome is subject to meeting future financial hurdles detailed in Section 3.4.
2.3 Maximum potential and actual remuneration mix
* During the year, there was no vesting of STI or LTI deferred rights. Deferred rights granted are subject to vesting conditions being met in the future.
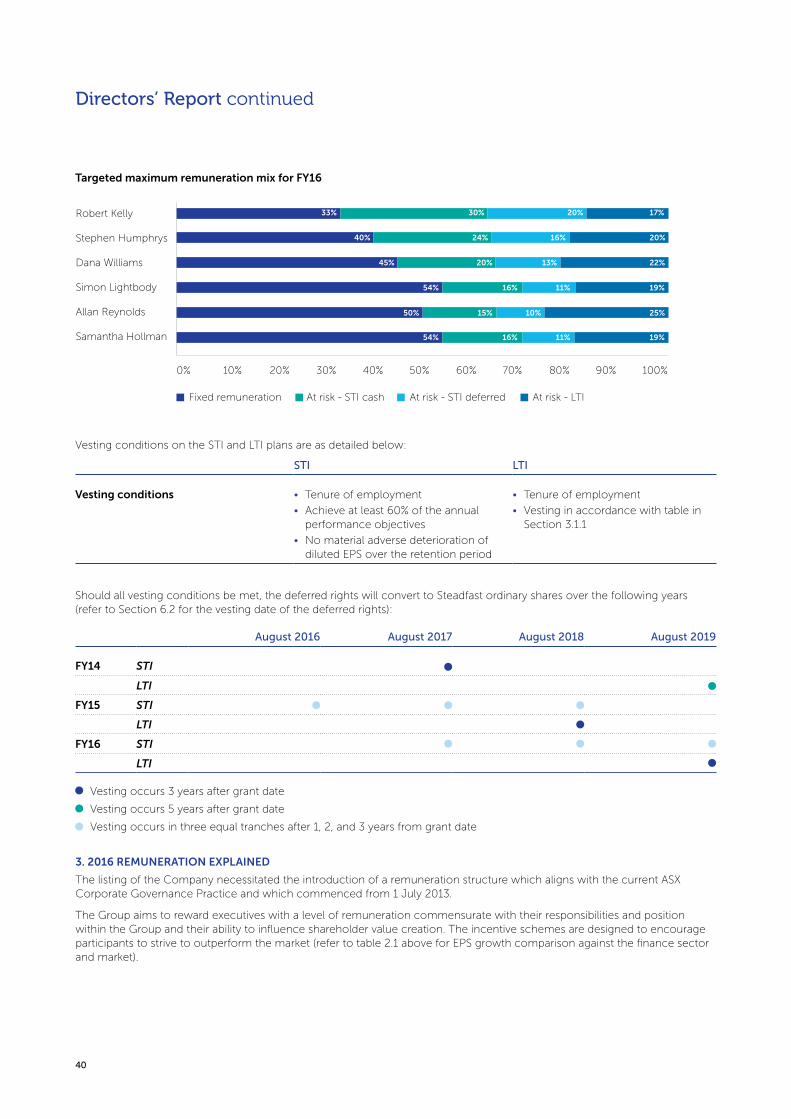
40
Directors’ Report continued
Targeted maximum remuneration mix for FY16
Robert Kelly
Stephen Humphrys
Dana Williams
Simon Lightbody
Allan Reynolds
Samantha Hollman
Fixed remuneration At risk - STI cash At risk - STI deferred At risk - LTI
0% 10% 20% 30% 40% 50% 60% 70% 80% 90% 100%
54%
50% 15% 10% 25%
16% 11% 19%
54% 16% 11% 19%
45% 20% 13% 22%
40% 24% 16% 20%
33% 30% 20% 17%
Vesting conditions on the STI and LTI plans are as detailed below:
STI LTI
Vesting conditions • Tenure of employment
• Achieve at least 60% of the annual performance objectives
• No material adverse deterioration of diluted EPS over the retention period
• Tenure of employment
• Vesting in accordance with table in Section 3.1.1
Should all vesting conditions be met, the deferred rights will convert to Steadfast ordinary shares over the following years (refer to Section 6.2 for the vesting date of the deferred rights):
Vesting occurs 3 years after grant date
Vesting occurs 5 years after grant date
Vesting occurs in three equal tranches after 1, 2, and 3 years from grant date
August 2016 August 2017 August 2018 August 2019
FY14 STI
LTI
FY15 STI
LTI
FY16 STI
LTI
3. 2016 REMUNERATION EXPLAINED
The listing of the Company necessitated the introduction of a remuneration structure which aligns with the current ASX Corporate Governance Practice and which commenced from 1 July 2013.
The Group aims to reward executives with a level of remuneration commensurate with their responsibilities and position within the Group and their ability to influence shareholder value creation. The incentive schemes are designed to encourage participants to strive to outperform the market (refer to table 2.1 above for EPS growth comparison against the finance sector and market).
Steadfast Group Annual Report 2016
41
Robert Kelly
Stephen Humphrys
Dana Williams
Simon Lightbody
Allan Reynolds
Samantha Hollman
Fixed remuneration At risk - STI cash At risk - STI deferred At risk - LTI
0% 10% 20% 30% 40% 50% 60% 70% 80% 90% 100%
54%
50% 15% 10% 25%
16% 11% 19%
54% 16% 11% 19%
45% 20% 13% 22%
40% 24% 16% 20%
33% 30% 20% 17%
3.1 Remuneration framework
The objective of the Group’s executive remuneration framework is to ensure reward for performance is competitive and appropriate for the results delivered. The framework aligns executive reward with achievement of strategic objectives and the creation of value for shareholders and conforms to market practice for delivery of remuneration. Our incentive schemes are designed to incentivise performance that is better than market.
The Board embodies the following principles in its remuneration framework:
• a performance based reward structure;
• competitive and reasonable rewards to attract and retain high calibre executives;
• strong links between executive rewards and shareholder value;
• a significant proportion of executive remuneration is at risk, and is linked to achievement of pre-determined individual KPIs and financial performance targets; and
• transparent reward structures.
The remuneration framework links rewards with the strategic goals and performance of the individual and the Group, and provides a market competitive mix of both fixed and variable rewards. To retain and attract high calibre employees, the Group has adopted an approach to position fixed remuneration and total remuneration at the 75th percentile. Key Performance Indicators (KPIs) together with weightings are established for each individual and are aligned to the Group’s strategic objectives.
The key elements of the executive remuneration are:
• fixed remuneration consisting of cash salary, superannuation and non-monetary benefits (Section 3.2);
• an annual incentive referred to as short-term incentive (STI) plan (Section 3.3); and
• a long-term incentive referred to as long-term incentive (LTI) plan (Section 3.4).
Refer Section 2.3 for targeted maximum remuneration mix.
3.1.1 Target remuneration mix
The Board believes that the fundamental driver for executive remuneration should be long-term financial performance that generates value for Steadfast shareholders. The at risk (or variable) remuneration components of the Executive Team are set by referencing regulation and current market practices. To ensure the Executive Team remain focused on long-term outcomes without encouraging excessive risk taking, the following conditions apply:
• financial performance hurdle – diluted earnings per share (EPS) growth has been chosen to meet and align with shareholders’ objectives. This measure was chosen by the Board, after considering alternatives such as return on capital employed (ROCE), or return on equity (ROE) as the Board considers that EPS is, on balance, the best driver of Executive behaviour that achieves superior performance outcomes for Steadfast and its shareholders. It is also a relatively simple and transparent measure that is easily reconciled to reported net profit (see Section 2.1). The Board has approved a maximum corporate gearing ratio of 25.0%. In recognition that subsidiaries may require debt to fund bolt on acquisitions, the Group has limited the extent of subsidiary borrowings to an additional 5% leverage. The corporate gearing ratio at year end was 16.0%. The total gearing ratio at year end was 18.4%;
• operating performance hurdle – each member of the Executive Team has set annual performance objectives known as KPIs with weightings aligned to the Group’s strategic objectives, and must achieve at least 60% of those objectives to be eligible for any STI and LTI;
• 40% of the STI is granted as deferred equity awards and is intended to be satisfied by the issue or transfer of ordinary shares in the capital of the Company over a three-year period from the grant date – being one-third at the end of years one, two and three;
• subject to meeting the personal and financial objectives, vesting of the LTI occurs after three years from the grant date and is satisfied by the issue or transfer of ordinary shares in the capital of the Company; and
• the Board retains the discretion to adjust any unpaid or unvested performance related remuneration (such as STI – Cash, STI – DEA and LTI) downwards if it is appropriate to do so. This discretion applies to all the STI and LTI awards on applicable dates for vesting of share-based payment awards.
The Board has set the remuneration of the Managing Director & CEO at a level to correspond to the 75th percentile of CEO remuneration of a comparator group of companies. The 75th percentile was chosen in light of the considerable experience of the Managing Director & CEO and his very strong performance in the role, including the very strong financial performance of Steadfast since its initial public offering in August 2013, and driving the Company to achieve an underlying 11.8% diluted EPS growth in FY16. Refer Section 2.1.
As part of the ongoing review of remuneration, the STI and LTI plans were refined to ensure incentives aligned with our remuneration philosophy, market competitiveness and market feedback on our incentive schemes. The Board approved the remuneration changes as set out below for the financial years ending 30 June 2016 (FY16) and 30 June 2017 (FY17).
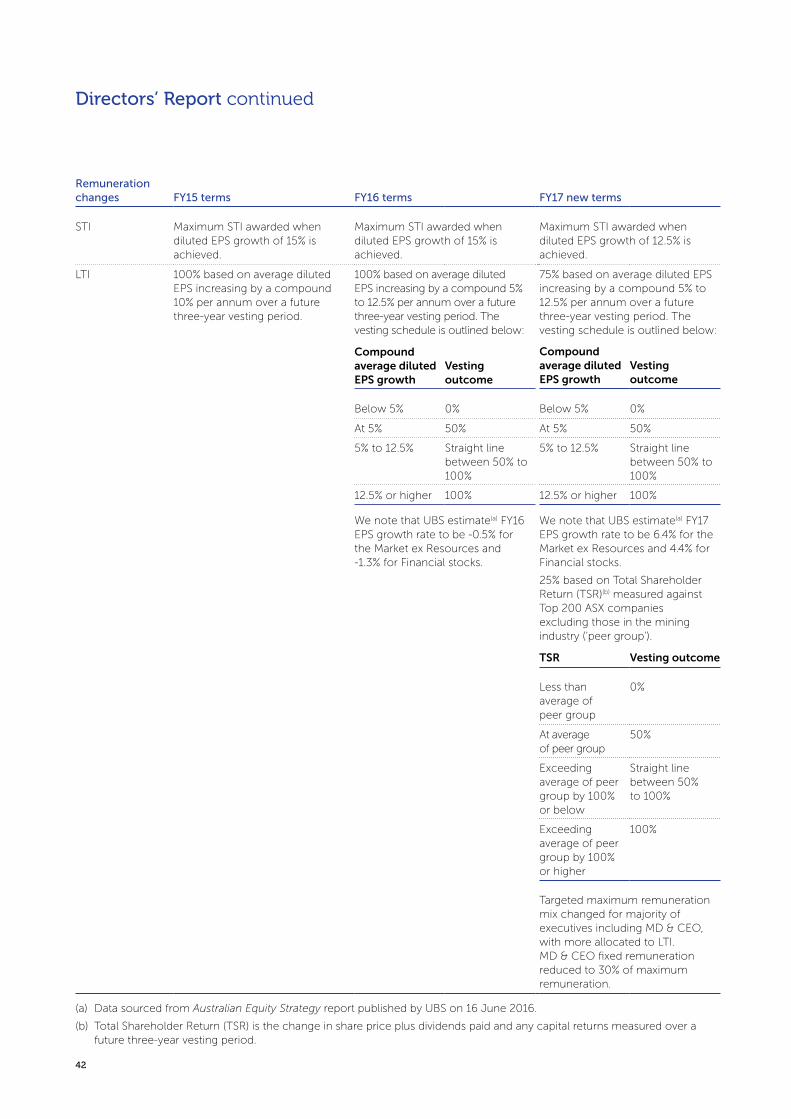
42
Directors’ Report continued
Remuneration changes FY15 terms FY16 terms FY17 new terms
STI Maximum STI awarded when diluted EPS growth of 15% is achieved.
Maximum STI awarded when diluted EPS growth of 15% is achieved.
Maximum STI awarded when diluted EPS growth of 12.5% is achieved.
LTI 100% based on average diluted EPS increasing by a compound 10% per annum over a future three-year vesting period.
100% based on average diluted EPS increasing by a compound 5% to 12.5% per annum over a future three-year vesting period. The vesting schedule is outlined below:
75% based on average diluted EPS increasing by a compound 5% to 12.5% per annum over a future three-year vesting period. The vesting schedule is outlined below:
Compound average diluted EPS growth
Vesting outcome
Compound average diluted EPS growth
Vesting outcome
Below 5% 0% Below 5% 0%
At 5% 50% At 5% 50%
5% to 12.5% Straight line between 50% to 100%
5% to 12.5% Straight line between 50% to 100%
12.5% or higher 100% 12.5% or higher 100%
We note that UBS estimate(a) FY16 EPS growth rate to be -0.5% for the Market ex Resources and -1.3% for Financial stocks.
We note that UBS estimate(a) FY17 EPS growth rate to be 6.4% for the Market ex Resources and 4.4% for Financial stocks.
25% based on Total Shareholder Return (TSR)(b) measured against Top 200 ASX companies excluding those in the mining industry (‘peer group’).
TSR Vesting outcome
Less than average of peer group
0%
At average of peer group
50%
Exceeding average of peer group by 100% or below
Straight line between 50% to 100%
Exceeding average of peer group by 100% or higher
100%
Targeted maximum remuneration mix changed for majority of executives including MD & CEO, with more allocated to LTI. MD & CEO fixed remuneration reduced to 30% of maximum remuneration.
(a) Data sourced from Australian Equity Strategy report published by UBS on 16 June 2016.
(b) Total Shareholder Return (TSR) is the change in share price plus dividends paid and any capital returns measured over a future three-year vesting period.
0% 10% 20% 30% 40% 50% 60% 70% 80% 90% 100%
Fixed remuneration At risk - STI cash At risk - STI deferred At risk - LTI
Robert Kelly
Stephen Humphrys
Dana Williams
Simon Lightbody
Allan Reynolds
Samantha Hollman 50%
50% 15% 10% 25%
15% 10% 25%
50% 15% 10% 25%
45% 20% 13% 22%
36% 22% 15% 27%
30% 28% 19% 23%

Steadfast Group Annual Report 2016
43
Targeted maximum remuneration mix for FY17
0% 10% 20% 30% 40% 50% 60% 70% 80% 90% 100%
Fixed remuneration At risk - STI cash At risk - STI deferred At risk - LTI
Robert Kelly
Stephen Humphrys
Dana Williams
Simon Lightbody
Allan Reynolds
Samantha Hollman 50%
50% 15% 10% 25%
15% 10% 25%
50% 15% 10% 25%
45% 20% 13% 22%
36% 22% 15% 27%
30% 28% 19% 23%
3.2 Fixed remuneration for FY16
The table below outlines the key details of executives’ fixed remuneration.
Component Details
Description Cash salary, superannuation, and non-monetary benefits
Purpose and link to strategy
Helps to attract and retain high calibre executives
Reflects individual role, experience and performance
Operation Reviewed annually by the Remuneration & Succession Planning Committee and fixed for 12 months, with any changes effected from 1 July each financial year. Decision influenced by:
• role, experience and performance;
• reference to comparative remuneration in the market; and
• total organisational salary budgets.
Executive Team is provided with cash salary, superannuation, car parking ($7,310 per annum), income protection and life insurance ($10,000 per annum).
Opportunity Target at 33%–54% of total remuneration.
3.3 Short-term incentives for FY16
The table below outlines the key details of the STI plan. STI awards in FY16 are summarised in Section 2.2 of the Remuneration Report.
Component Details
Purpose and link to strategy
Recognises the contributions and achievements of the Executive Team and helps to attract and retain talent
Operation STI Plan consisting of cash and deferred equity award
Opportunity STI awards are discretionary, performance based, at risk reward arrangements
The combined total of at risk remuneration (STI and LTI combined) is targeted at 46%–67% of total remuneration
Performance metrics STI – Cash award (60% of total STI); Deferred equity award (40% of total STI)
• achievement of 60% of personal objectives
• diluted EPS minimum growth hurdle of 5% to be met
• for deferred equity award, continuous employment for the vesting period split one-third over one, two and three years
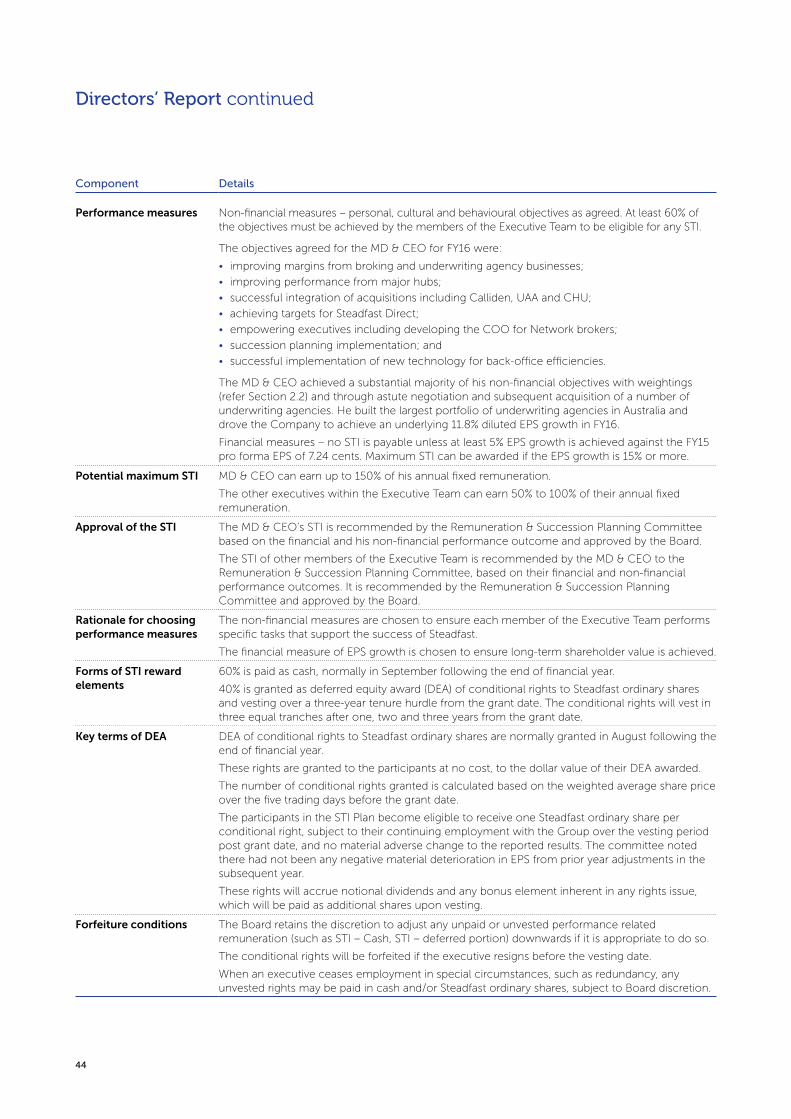
44
Directors’ Report continued
Component Details
Performance measures Non-financial measures – personal, cultural and behavioural objectives as agreed. At least 60% of the objectives must be achieved by the members of the Executive Team to be eligible for any STI.
The objectives agreed for the MD & CEO for FY16 were:
• improving margins from broking and underwriting agency businesses;
• improving performance from major hubs;
• successful integration of acquisitions including Calliden, UAA and CHU;
• achieving targets for Steadfast Direct;
• empowering executives including developing the COO for Network brokers;
• succession planning implementation; and
• successful implementation of new technology for back-office efficiencies.
The MD & CEO achieved a substantial majority of his non-financial objectives with weightings (refer Section 2.2) and through astute negotiation and subsequent acquisition of a number of underwriting agencies. He built the largest portfolio of underwriting agencies in Australia and drove the Company to achieve an underlying 11.8% diluted EPS growth in FY16.
Financial measures – no STI is payable unless at least 5% EPS growth is achieved against the FY15 pro forma EPS of 7.24 cents. Maximum STI can be awarded if the EPS growth is 15% or more.
Potential maximum STI MD & CEO can earn up to 150% of his annual fixed remuneration.
The other executives within the Executive Team can earn 50% to 100% of their annual fixed remuneration.
Approval of the STI The MD & CEO’s STI is recommended by the Remuneration & Succession Planning Committee based on the financial and his non-financial performance outcome and approved by the Board.
The STI of other members of the Executive Team is recommended by the MD & CEO to the Remuneration & Succession Planning Committee, based on their financial and non-financial performance outcomes. It is recommended by the Remuneration & Succession Planning Committee and approved by the Board.
Rationale for choosing performance measures
The non-financial measures are chosen to ensure each member of the Executive Team performs specific tasks that support the success of Steadfast.
The financial measure of EPS growth is chosen to ensure long-term shareholder value is achieved.
Forms of STI reward elements
60% is paid as cash, normally in September following the end of financial year.
40% is granted as deferred equity award (DEA) of conditional rights to Steadfast ordinary shares and vesting over a three-year tenure hurdle from the grant date. The conditional rights will vest in three equal tranches after one, two and three years from the grant date.
Key terms of DEA DEA of conditional rights to Steadfast ordinary shares are normally granted in August following the end of financial year.
These rights are granted to the participants at no cost, to the dollar value of their DEA awarded.
The number of conditional rights granted is calculated based on the weighted average share price over the five trading days before the grant date.
The participants in the STI Plan become eligible to receive one Steadfast ordinary share per conditional right, subject to their continuing employment with the Group over the vesting period post grant date, and no material adverse change to the reported results. The committee noted there had not been any negative material deterioration in EPS from prior year adjustments in the subsequent year.
These rights will accrue notional dividends and any bonus element inherent in any rights issue, which will be paid as additional shares upon vesting.
Forfeiture conditions The Board retains the discretion to adjust any unpaid or unvested performance related remuneration (such as STI – Cash, STI – deferred portion) downwards if it is appropriate to do so.
The conditional rights will be forfeited if the executive resigns before the vesting date.
When an executive ceases employment in special circumstances, such as redundancy, any unvested rights may be paid in cash and/or Steadfast ordinary shares, subject to Board discretion.
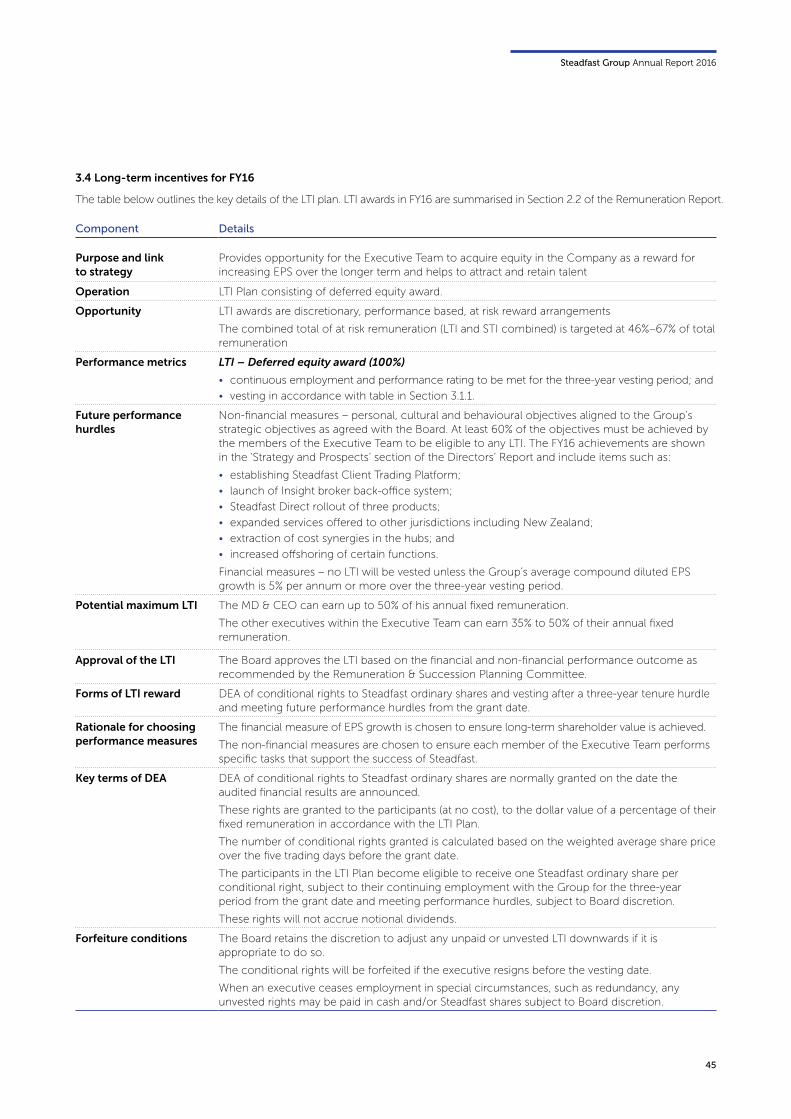
Steadfast Group Annual Report 2016
45
Component Details
Purpose and link to strategy
Provides opportunity for the Executive Team to acquire equity in the Company as a reward for increasing EPS over the longer term and helps to attract and retain talent
Operation LTI Plan consisting of deferred equity award.
Opportunity LTI awards are discretionary, performance based, at risk reward arrangements
The combined total of at risk remuneration (LTI and STI combined) is targeted at 46%–67% of total remuneration
Performance metrics LTI – Deferred equity award (100%)
• continuous employment and performance rating to be met for the three-year vesting period; and
• vesting in accordance with table in Section 3.1.1.
Future performance hurdles
Non-financial measures – personal, cultural and behavioural objectives aligned to the Group’s strategic objectives as agreed with the Board. At least 60% of the objectives must be achieved by the members of the Executive Team to be eligible to any LTI. The FY16 achievements are shown in the ‘Strategy and Prospects’ section of the Directors’ Report and include items such as:
• establishing Steadfast Client Trading Platform;
• launch of Insight broker back-office system;
• Steadfast Direct rollout of three products;
• expanded services offered to other jurisdictions including New Zealand;
• extraction of cost synergies in the hubs; and
• increased offshoring of certain functions.
Financial measures – no LTI will be vested unless the Group’s average compound diluted EPS growth is 5% per annum or more over the three-year vesting period.
Potential maximum LTI The MD & CEO can earn up to 50% of his annual fixed remuneration.
The other executives within the Executive Team can earn 35% to 50% of their annual fixed remuneration.
Approval of the LTI The Board approves the LTI based on the financial and non-financial performance outcome as recommended by the Remuneration & Succession Planning Committee.
Forms of LTI reward DEA of conditional rights to Steadfast ordinary shares and vesting after a three-year tenure hurdle and meeting future performance hurdles from the grant date.
Rationale for choosing performance measures
The financial measure of EPS growth is chosen to ensure long-term shareholder value is achieved.
The non-financial measures are chosen to ensure each member of the Executive Team performs specific tasks that support the success of Steadfast.
Key terms of DEA DEA of conditional rights to Steadfast ordinary shares are normally granted on the date the audited financial results are announced.
These rights are granted to the participants (at no cost), to the dollar value of a percentage of their fixed remuneration in accordance with the LTI Plan.
The number of conditional rights granted is calculated based on the weighted average share price over the five trading days before the grant date.
The participants in the LTI Plan become eligible to receive one Steadfast ordinary share per conditional right, subject to their continuing employment with the Group for the three-year period from the grant date and meeting performance hurdles, subject to Board discretion.
These rights will not accrue notional dividends.
Forfeiture conditions The Board retains the discretion to adjust any unpaid or unvested LTI downwards if it is appropriate to do so.
The conditional rights will be forfeited if the executive resigns before the vesting date.
When an executive ceases employment in special circumstances, such as redundancy, any unvested rights may be paid in cash and/or Steadfast shares subject to Board discretion.
3.4 Long-term incentives for FY16
The table below outlines the key details of the LTI plan. LTI awards in FY16 are summarised in Section 2.2 of the Remuneration Report.
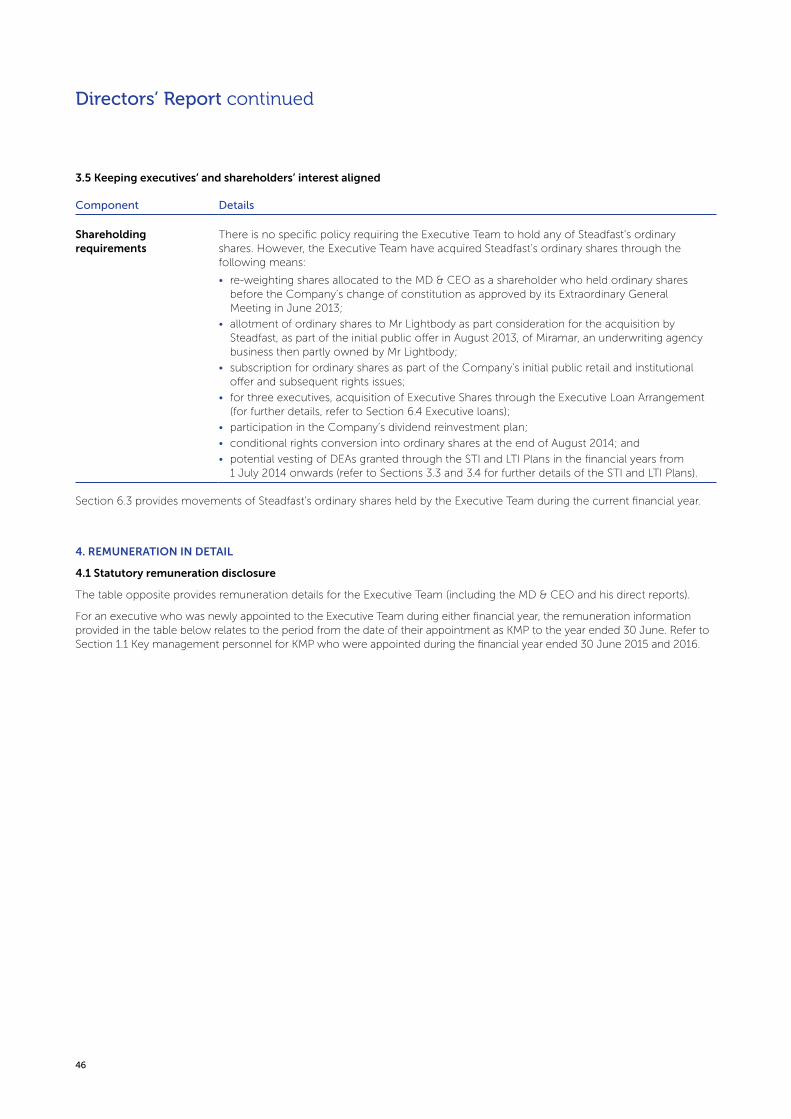
46
Directors’ Report continued
Component Details
Shareholding requirements
There is no specific policy requiring the Executive Team to hold any of Steadfast’s ordinary shares. However, the Executive Team have acquired Steadfast’s ordinary shares through the following means:
• re-weighting shares allocated to the MD & CEO as a shareholder who held ordinary shares before the Company’s change of constitution as approved by its Extraordinary General Meeting in June 2013;
• allotment of ordinary shares to Mr Lightbody as part consideration for the acquisition by Steadfast, as part of the initial public offer in August 2013, of Miramar, an underwriting agency business then partly owned by Mr Lightbody;
• subscription for ordinary shares as part of the Company’s initial public retail and institutional offer and subsequent rights issues;
• for three executives, acquisition of Executive Shares through the Executive Loan Arrangement (for further details, refer to Section 6.4 Executive loans);
• participation in the Company’s dividend reinvestment plan;
• conditional rights conversion into ordinary shares at the end of August 2014; and
• potential vesting of DEAs granted through the STI and LTI Plans in the financial years from 1 July 2014 onwards (refer to Sections 3.3 and 3.4 for further details of the STI and LTI Plans).
3.5 Keeping executives’ and shareholders’ interest aligned
Section 6.3 provides movements of Steadfast’s ordinary shares held by the Executive Team during the current financial year.
4. REMUNERATION IN DETAIL
4.1 Statutory remuneration disclosure
The table opposite provides remuneration details for the Executive Team (including the MD & CEO and his direct reports).
For an executive who was newly appointed to the Executive Team during either financial year, the remuneration information provided in the table below relates to the period from the date of their appointment as KMP to the year ended 30 June. Refer to Section 1.1 Key management personnel for KMP who were appointed during the financial year ended 30 June 2015 and 2016.
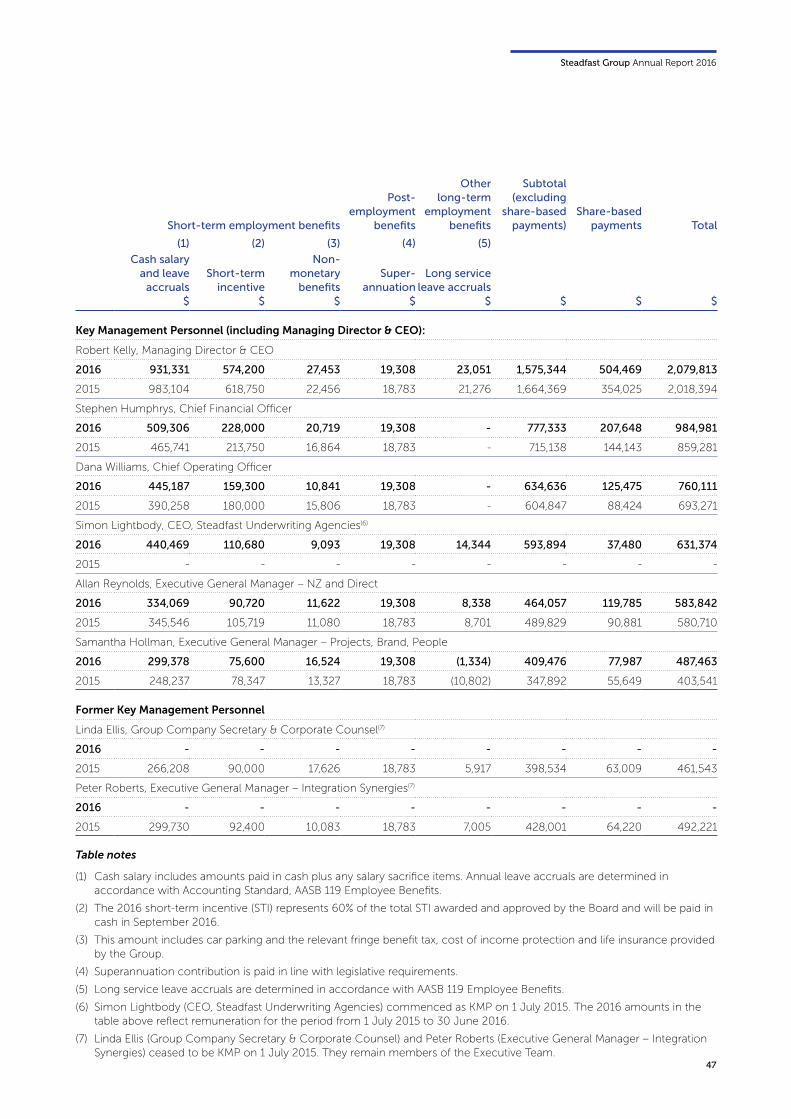
Steadfast Group Annual Report 2016
47
Short-term employment benefits
Post- employment
benefits
Other long-term
employment benefits
Subtotal (excluding
share-based payments)
Share-based payments Total
(1) (2) (3) (4) (5)
Cash salary and leave
accruals$
Short-term incentive
$
Non-monetary
benefits$
Super- annuation
$
Long service leave accruals
$ $ $ $
Key Management Personnel (including Managing Director & CEO):
Robert Kelly, Managing Director & CEO
2016 931,331 574,200 27,453 19,308 23,051 1,575,344 504,469 2,079,813
2015 983,104 618,750 22,456 18,783 21,276 1,664,369 354,025 2,018,394
Stephen Humphrys, Chief Financial Officer
2016 509,306 228,000 20,719 19,308 - 777,333 207,648 984,981
2015 465,741 213,750 16,864 18,783 - 715,138 144,143 859,281
Dana Williams, Chief Operating Officer
2016 445,187 159,300 10,841 19,308 - 634,636 125,475 760,111
2015 390,258 180,000 15,806 18,783 - 604,847 88,424 693,271
Simon Lightbody, CEO, Steadfast Underwriting Agencies(6)
2016 440,469 110,680 9,093 19,308 14,344 593,894 37,480 631,374
2015 - - - - - - - -
Allan Reynolds, Executive General Manager – NZ and Direct
2016 334,069 90,720 11,622 19,308 8,338 464,057 119,785 583,842
2015 345,546 105,719 11,080 18,783 8,701 489,829 90,881 580,710
Samantha Hollman, Executive General Manager – Projects, Brand, People
2016 299,378 75,600 16,524 19,308 (1,334) 409,476 77,987 487,463
2015 248,237 78,347 13,327 18,783 (10,802) 347,892 55,649 403,541
Former Key Management Personnel
Linda Ellis, Group Company Secretary & Corporate Counsel(7)
2016 - - - - - - - -
2015 266,208 90,000 17,626 18,783 5,917 398,534 63,009 461,543
Peter Roberts, Executive General Manager – Integration Synergies(7)
2016 - - - - - - - -
2015 299,730 92,400 10,083 18,783 7,005 428,001 64,220 492,221
Table notes
(1) Cash salary includes amounts paid in cash plus any salary sacrifice items. Annual leave accruals are determined in accordance with Accounting Standard, AASB 119 Employee Benefits.
(2) The 2016 short-term incentive (STI) represents 60% of the total STI awarded and approved by the Board and will be paid in cash in September 2016.
(3) This amount includes car parking and the relevant fringe benefit tax, cost of income protection and life insurance provided by the Group.
(4) Superannuation contribution is paid in line with legislative requirements.
(5) Long service leave accruals are determined in accordance with AASB 119 Employee Benefits.
(6) Simon Lightbody (CEO, Steadfast Underwriting Agencies) commenced as KMP on 1 July 2015. The 2016 amounts in the table above reflect remuneration for the period from 1 July 2015 to 30 June 2016.
(7) Linda Ellis (Group Company Secretary & Corporate Counsel) and Peter Roberts (Executive General Manager – Integration Synergies) ceased to be KMP on 1 July 2015. They remain members of the Executive Team.
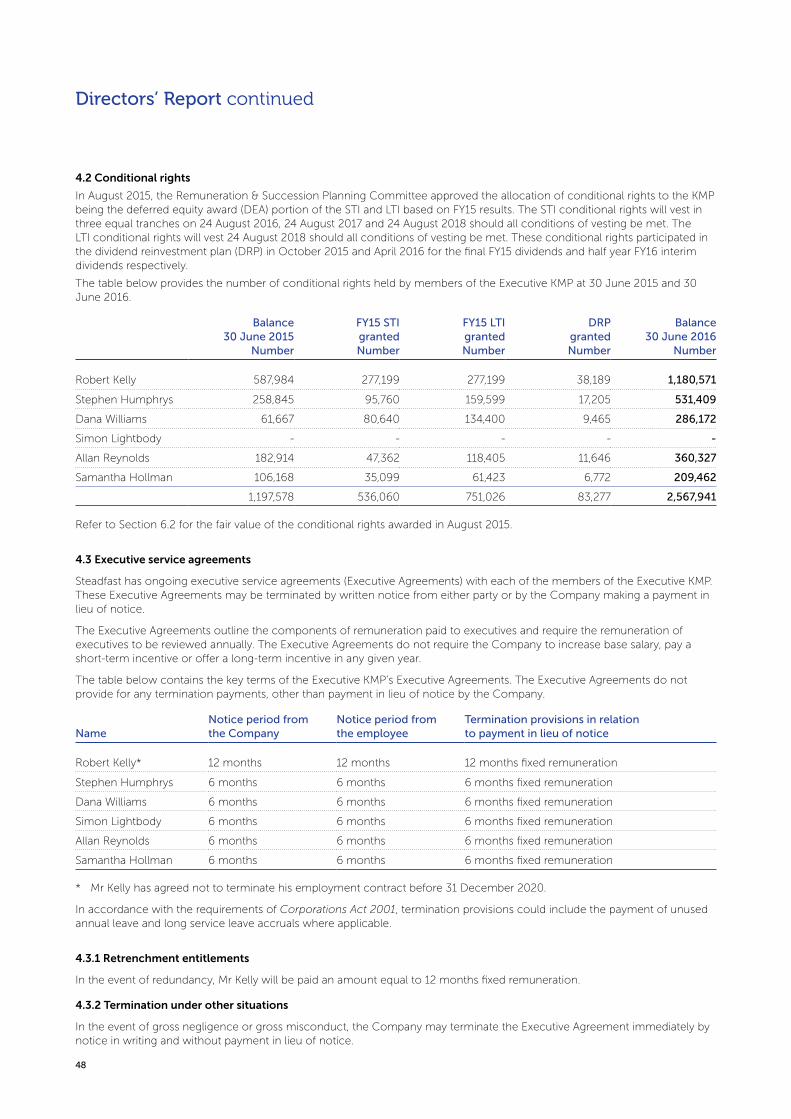
48
4.2 Conditional rights
In August 2015, the Remuneration & Succession Planning Committee approved the allocation of conditional rights to the KMP being the deferred equity award (DEA) portion of the STI and LTI based on FY15 results. The STI conditional rights will vest in three equal tranches on 24 August 2016, 24 August 2017 and 24 August 2018 should all conditions of vesting be met. The LTI conditional rights will vest 24 August 2018 should all conditions of vesting be met. These conditional rights participated in the dividend reinvestment plan (DRP) in October 2015 and April 2016 for the final FY15 dividends and half year FY16 interim dividends respectively.
The table below provides the number of conditional rights held by members of the Executive KMP at 30 June 2015 and 30 June 2016.
Directors’ Report continued
Balance 30 June 2015
Number
FY15 STI granted Number
FY15 LTI granted Number
DRP granted Number
Balance 30 June 2016
Number
Robert Kelly 587,984 277,199 277,199 38,189 1,180,571
Stephen Humphrys 258,845 95,760 159,599 17,205 531,409
Dana Williams 61,667 80,640 134,400 9,465 286,172
Simon Lightbody - - - - -
Allan Reynolds 182,914 47,362 118,405 11,646 360,327
Samantha Hollman 106,168 35,099 61,423 6,772 209,462
1,197,578 536,060 751,026 83,277 2,567,941
NameNotice period from the Company
Notice period from the employee
Termination provisions in relation to payment in lieu of notice
Robert Kelly* 12 months 12 months 12 months fixed remuneration
Stephen Humphrys 6 months 6 months 6 months fixed remuneration
Dana Williams 6 months 6 months 6 months fixed remuneration
Simon Lightbody 6 months 6 months 6 months fixed remuneration
Allan Reynolds 6 months 6 months 6 months fixed remuneration
Samantha Hollman 6 months 6 months 6 months fixed remuneration
Refer to Section 6.2 for the fair value of the conditional rights awarded in August 2015.
4.3 Executive service agreements
Steadfast has ongoing executive service agreements (Executive Agreements) with each of the members of the Executive KMP. These Executive Agreements may be terminated by written notice from either party or by the Company making a payment in lieu of notice.
The Executive Agreements outline the components of remuneration paid to executives and require the remuneration of executives to be reviewed annually. The Executive Agreements do not require the Company to increase base salary, pay a short-term incentive or offer a long-term incentive in any given year.
The table below contains the key terms of the Executive KMP’s Executive Agreements. The Executive Agreements do not provide for any termination payments, other than payment in lieu of notice by the Company.
* Mr Kelly has agreed not to terminate his employment contract before 31 December 2020.
In accordance with the requirements of Corporations Act 2001, termination provisions could include the payment of unused annual leave and long service leave accruals where applicable.
4.3.1 Retrenchment entitlements
In the event of redundancy, Mr Kelly will be paid an amount equal to 12 months fixed remuneration.
4.3.2 Termination under other situations
In the event of gross negligence or gross misconduct, the Company may terminate the Executive Agreement immediately by notice in writing and without payment in lieu of notice.
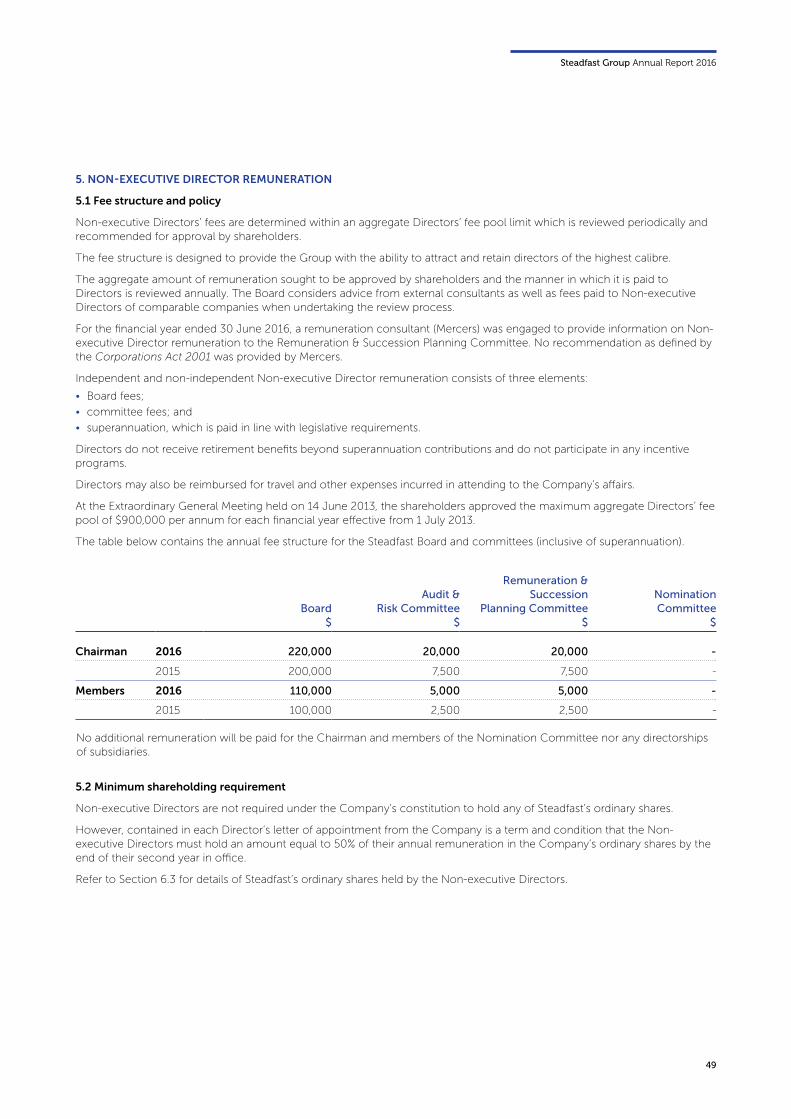
Steadfast Group Annual Report 2016
49
Board $
Audit & Risk Committee
$
Remuneration & Succession
Planning Committee $
Nomination Committee
$
Chairman 2016 220,000 20,000 20,000 -
2015 200,000 7,500 7,500 -
Members 2016 110,000 5,000 5,000 -
2015 100,000 2,500 2,500 -
5. NON-EXECUTIVE DIRECTOR REMUNERATION
5.1 Fee structure and policy
Non-executive Directors’ fees are determined within an aggregate Directors’ fee pool limit which is reviewed periodically and recommended for approval by shareholders.
The fee structure is designed to provide the Group with the ability to attract and retain directors of the highest calibre.
The aggregate amount of remuneration sought to be approved by shareholders and the manner in which it is paid to Directors is reviewed annually. The Board considers advice from external consultants as well as fees paid to Non-executive Directors of comparable companies when undertaking the review process.
For the financial year ended 30 June 2016, a remuneration consultant (Mercers) was engaged to provide information on Non-executive Director remuneration to the Remuneration & Succession Planning Committee. No recommendation as defined by the Corporations Act 2001 was provided by Mercers.
Independent and non-independent Non-executive Director remuneration consists of three elements:
• Board fees;
• committee fees; and
• superannuation, which is paid in line with legislative requirements.
Directors do not receive retirement benefits beyond superannuation contributions and do not participate in any incentive programs.
Directors may also be reimbursed for travel and other expenses incurred in attending to the Company’s affairs.
At the Extraordinary General Meeting held on 14 June 2013, the shareholders approved the maximum aggregate Directors’ fee pool of $900,000 per annum for each financial year effective from 1 July 2013.
The table below contains the annual fee structure for the Steadfast Board and committees (inclusive of superannuation).
No additional remuneration will be paid for the Chairman and members of the Nomination Committee nor any directorships of subsidiaries.
5.2 Minimum shareholding requirement
Non-executive Directors are not required under the Company’s constitution to hold any of Steadfast’s ordinary shares.
However, contained in each Director’s letter of appointment from the Company is a term and condition that the Non-executive Directors must hold an amount equal to 50% of their annual remuneration in the Company’s ordinary shares by the end of their second year in office.
Refer to Section 6.3 for details of Steadfast’s ordinary shares held by the Non-executive Directors.

50
Directors’ Report continued
5.3 Remuneration details for Non-executive Directors
The table below provides remuneration details of the Non-executive Directors on the Company’s Board.
Short-term employment benefitsPost-
employment benefits Total
Board fees $
Committee fees $
Superannuation $
$
Current Directors
Frank O’Halloran, AM
2016 200,913 9,779 19,308 230,000
2015 182,648 4,567 17,785 205,000
David Liddy, AM
2016 100,457 22,831 11,712 135,000
2015 91,324 11,416 9,760 112,500
Anne O’Driscoll
2016 100,457 22,831 11,712 135,000
2015 91,324 11,416 9,760 112,500
Philip Purcell
2016 100,457 9,132 10,411 120,000
2015 91,324 4,566 9,110 105,000
Greg Rynenberg
2016 100,457 9,132 10,411 120,000
2015 91,324 4,566 9,110 105,000

Steadfast Group Annual Report 2016
51
Description Recipient Grant date Vesting date
Fair value at grant date
($)
FY15 STI conditional rights* MD & CEO 30 October 2015 24 August 2016 1.4992
FY15 STI conditional rights* MD & CEO 30 October 2015 24 August 2017 1.4939
FY15 STI conditional rights* MD & CEO 30 October 2015 24 August 2018 1.4841
FY15 STI conditional rights* Other executives 24 August 2015 24 August 2016 1.4519
FY15 STI conditional rights* Other executives 24 August 2015 24 August 2017 1.4442
FY15 STI conditional rights* Other executives 24 August 2015 24 August 2018 1.4323
FY15 LTI conditional rights MD & CEO 30 October 2015 24 August 2018 1.4841
FY15 LTI conditional rights Other executives 24 August 2015 24 August 2018 1.4323
FY14 STI conditional rights MD & CEO 29 October 2014 25 August 2017 1.4312
FY14 STI conditional rights Other executives 25 August 2014 25 August 2017 1.3253
FY14 LTI conditional rights MD & CEO 29 October 2014 25 August 2019 1.4001
FY14 LTI conditional rights Other executives 25 August 2014 25 August 2019 1.2908
6. ADDITIONAL INFORMATION
6.1 Remuneration governance
This report meets the remuneration reporting requirements of the Corporations Act 2001 and Accounting Standard AASB 124 Related Party Disclosures. The term remuneration used in this report has the same meaning as compensation as prescribed in AASB 124.
6.1.1 Role of the Remuneration & Succession Planning Committee
The Remuneration & Succession Planning Committee of the Board is responsible for reviewing and determining remuneration arrangements for the Non-executive Directors and the Executive Team made up of the Managing Director & CEO and his direct reports listed in the KMP table in Section 1.1.
6.1.2 Use of remuneration consultant
The Remuneration & Succession Planning Committee directly engages and considers market remuneration data from remuneration consultants as required. The data provided by remuneration consultants is used as a guide for remuneration decisions with respect to the Executive Team. Remuneration consultants are engaged every three years to provide information on fixed remuneration packages and incentives to the Remuneration & Succession Planning Committee.
No remuneration recommendations as defined by the Corporations Act 2001 were provided.
6.2 Valuation of conditional rights
The table below details the fair value of conditional rights issued affecting remuneration of KMP in the previous, current or future reporting periods:
* The FY15 STI conditional rights will vest in three equal tranches after one, two and three years from the grant date.
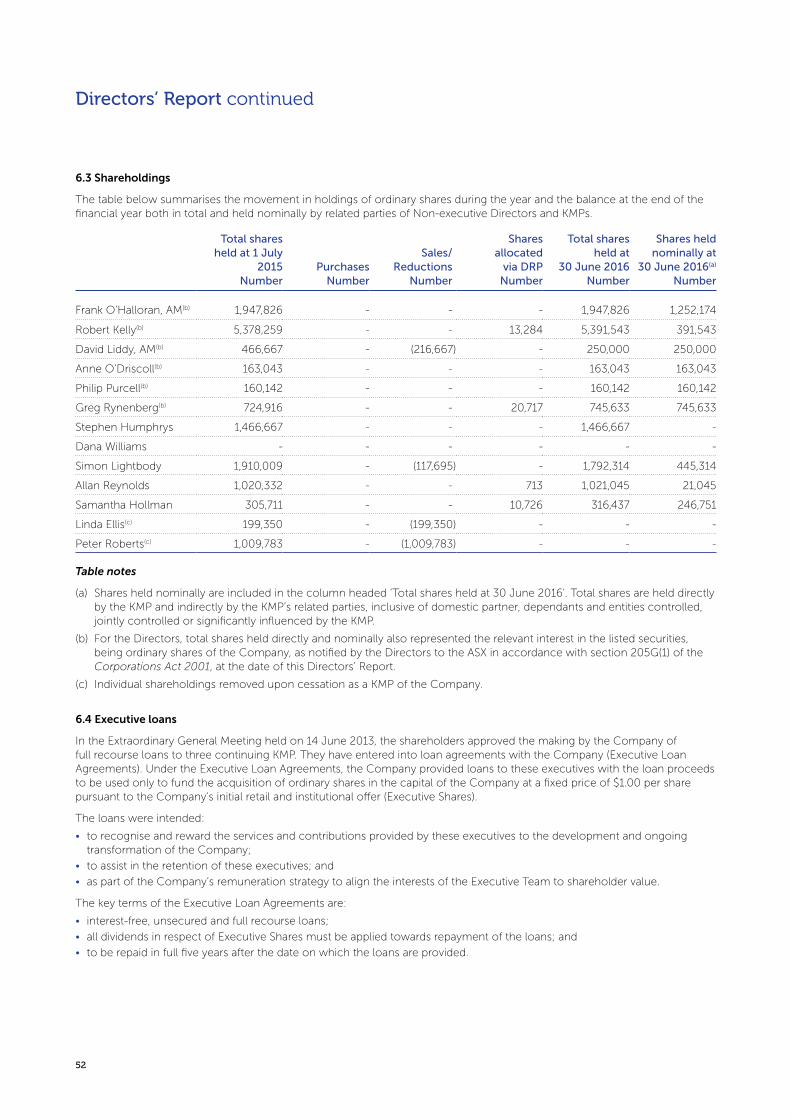
52
Directors’ Report continued
6.3 Shareholdings
The table below summarises the movement in holdings of ordinary shares during the year and the balance at the end of the financial year both in total and held nominally by related parties of Non-executive Directors and KMPs.
Total shares held at 1 July
2015 Number
Purchases Number
Sales/ Reductions
Number
Shares allocated
via DRP Number
Total shares held at
30 June 2016 Number
Shares held nominally at
30 June 2016(a) Number
Frank O’Halloran, AM(b) 1,947,826 - - - 1,947,826 1,252,174
Robert Kelly(b) 5,378,259 - - 13,284 5,391,543 391,543
David Liddy, AM(b) 466,667 - (216,667) - 250,000 250,000
Anne O’Driscoll(b) 163,043 - - - 163,043 163,043
Philip Purcell(b) 160,142 - - - 160,142 160,142
Greg Rynenberg(b) 724,916 - - 20,717 745,633 745,633
Stephen Humphrys 1,466,667 - - - 1,466,667 -
Dana Williams - - - - - -
Simon Lightbody 1,910,009 - (117,695) - 1,792,314 445,314
Allan Reynolds 1,020,332 - - 713 1,021,045 21,045
Samantha Hollman 305,711 - - 10,726 316,437 246,751
Linda Ellis(c) 199,350 - (199,350) - - -
Peter Roberts(c) 1,009,783 - (1,009,783) - - -
Table notes
(a) Shares held nominally are included in the column headed ‘Total shares held at 30 June 2016'. Total shares are held directly by the KMP and indirectly by the KMP’s related parties, inclusive of domestic partner, dependants and entities controlled, jointly controlled or significantly influenced by the KMP.
(b) For the Directors, total shares held directly and nominally also represented the relevant interest in the listed securities, being ordinary shares of the Company, as notified by the Directors to the ASX in accordance with section 205G(1) of the Corporations Act 2001, at the date of this Directors’ Report.
(c) Individual shareholdings removed upon cessation as a KMP of the Company.
6.4 Executive loans
In the Extraordinary General Meeting held on 14 June 2013, the shareholders approved the making by the Company of full recourse loans to three continuing KMP. They have entered into loan agreements with the Company (Executive Loan Agreements). Under the Executive Loan Agreements, the Company provided loans to these executives with the loan proceeds to be used only to fund the acquisition of ordinary shares in the capital of the Company at a fixed price of $1.00 per share pursuant to the Company’s initial retail and institutional offer (Executive Shares).
The loans were intended:
• to recognise and reward the services and contributions provided by these executives to the development and ongoing transformation of the Company;
• to assist in the retention of these executives; and
• as part of the Company’s remuneration strategy to align the interests of the Executive Team to shareholder value.
The key terms of the Executive Loan Agreements are:
• interest-free, unsecured and full recourse loans;
• all dividends in respect of Executive Shares must be applied towards repayment of the loans; and
• to be repaid in full five years after the date on which the loans are provided.
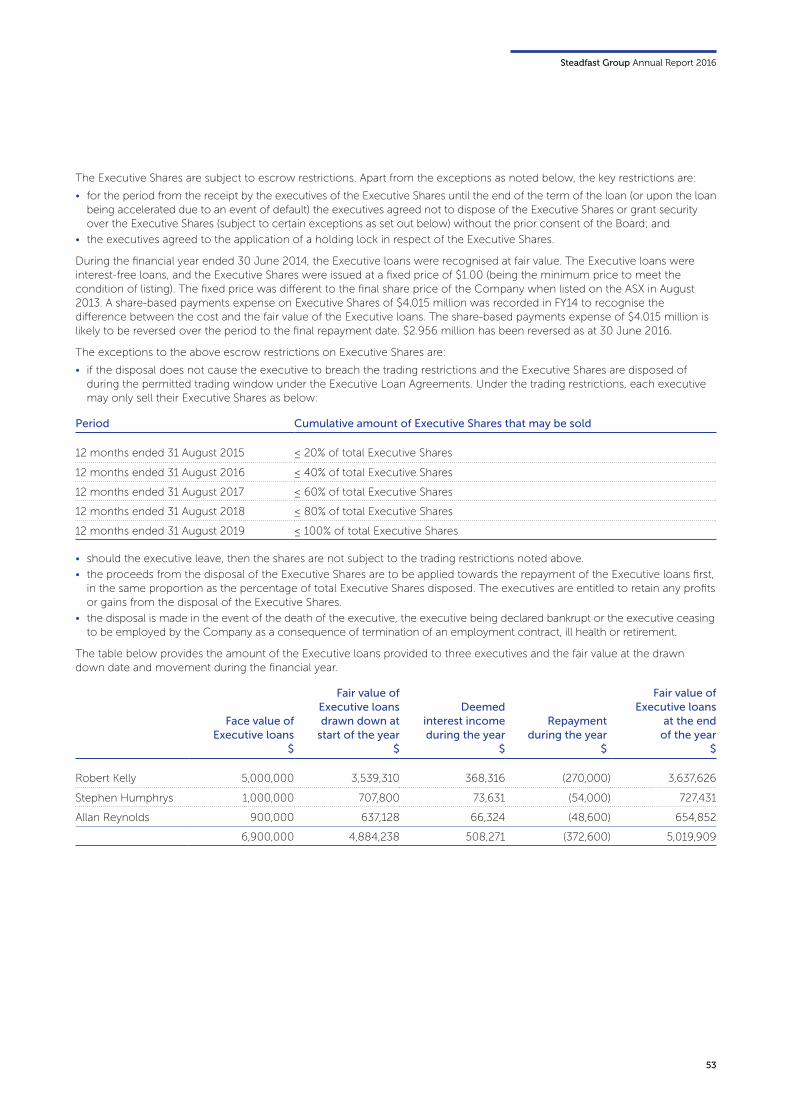
Steadfast Group Annual Report 2016
53
Face value of Executive loans
$
Fair value of Executive loans drawn down at
start of the year $
Deemed interest income during the year
$
Repayment during the year
$
Fair value of Executive loans
at the end of the year
$
Robert Kelly 5,000,000 3,539,310 368,316 (270,000) 3,637,626
Stephen Humphrys 1,000,000 707,800 73,631 (54,000) 727,431
Allan Reynolds 900,000 637,128 66,324 (48,600) 654,852
6,900,000 4,884,238 508,271 (372,600) 5,019,909
Period Cumulative amount of Executive Shares that may be sold
12 months ended 31 August 2015 ≤ 20% of total Executive Shares
12 months ended 31 August 2016 ≤ 40% of total Executive Shares
12 months ended 31 August 2017 ≤ 60% of total Executive Shares
12 months ended 31 August 2018 ≤ 80% of total Executive Shares
12 months ended 31 August 2019 ≤ 100% of total Executive Shares
• should the executive leave, then the shares are not subject to the trading restrictions noted above.
• the proceeds from the disposal of the Executive Shares are to be applied towards the repayment of the Executive loans first, in the same proportion as the percentage of total Executive Shares disposed. The executives are entitled to retain any profits or gains from the disposal of the Executive Shares.
• the disposal is made in the event of the death of the executive, the executive being declared bankrupt or the executive ceasing to be employed by the Company as a consequence of termination of an employment contract, ill health or retirement.
The table below provides the amount of the Executive loans provided to three executives and the fair value at the drawn down date and movement during the financial year.
The Executive Shares are subject to escrow restrictions. Apart from the exceptions as noted below, the key restrictions are:
• for the period from the receipt by the executives of the Executive Shares until the end of the term of the loan (or upon the loan being accelerated due to an event of default) the executives agreed not to dispose of the Executive Shares or grant security over the Executive Shares (subject to certain exceptions as set out below) without the prior consent of the Board; and
• the executives agreed to the application of a holding lock in respect of the Executive Shares.
During the financial year ended 30 June 2014, the Executive loans were recognised at fair value. The Executive loans were interest-free loans, and the Executive Shares were issued at a fixed price of $1.00 (being the minimum price to meet the condition of listing). The fixed price was different to the final share price of the Company when listed on the ASX in August 2013. A share-based payments expense on Executive Shares of $4.015 million was recorded in FY14 to recognise the difference between the cost and the fair value of the Executive loans. The share-based payments expense of $4.015 million is likely to be reversed over the period to the final repayment date. $2.956 million has been reversed as at 30 June 2016.
The exceptions to the above escrow restrictions on Executive Shares are:
• if the disposal does not cause the executive to breach the trading restrictions and the Executive Shares are disposed of during the permitted trading window under the Executive Loan Agreements. Under the trading restrictions, each executive may only sell their Executive Shares as below:
54
Directors’ Report continued
6.5 Related party transactions
6.5.1 KMP related party transactions
The following transactions occurred with Directors’ (Robert Kelly and Greg Rynenberg) related parties which are part of Steadfast Network but are not part of Steadfast Group:
2016$
2015$
i. Sale of goods and services
Marketing and administration fees received from Directors’ related entities on normal commercial terms 27,683 26,143
ii. Payment for goods and services
Estimated Steadfast Network Broker rebate expense to Directors’ related entities on the basis as determined by the Board 40,648 49,272
The following balances are outstanding at the reporting date in relation to transactions with related parties:
iii. Current receivable from related parties
Trade receivables from Directors’ related entities - 52,917
ROUNDING
The Group is of the kind referred to in the Instrument 2016/191 dated 24 March 2016 issued by the Australian Securities and Investments Commission. In accordance with that Instrument, amounts in the Directors’ Report and financial report have been rounded to the nearest thousand dollars, unless otherwise stated.
Signed at Sydney on 24 August 2016 in accordance with a resolution of the Directors.
Robert Kelly Managing Director & CEO
Frank O’Halloran, AM Chairman

Steadfast Group Annual Report 2016
55
Lead Auditor’s Independence DeclarationUNDER SECTION 307C OF CORPORATIONS ACT 2001
TO THE DIRECTORS OF STEADFAST GROUP LIMITED
I declare that, to the best of my knowledge and belief, in relation to the audit for the year ended 30 June 2016, there have been:
• no contraventions of the auditor independence requirements as set out in the Corporations Act 2001 in relation to the audit; and
• no contraventions of any applicable code of professional conduct in relation to the audit.
Sydney 24 August 2016
Andrew Dickinson Partner
KPMG
KPMG, an Australian partnership and a member firm of the KPMG network of independent member firms affiliated with KPMG International Cooperative (“KPMG International”), a Swiss entity. Liability limited by a scheme approved under Professional Standards Legislation.
56
Steadfast Group Limited
Consolidated Statement of Profit or Loss and Other Comprehensive IncomeFOR THE YEAR ENDED 30 JUNE 2016
Note2016
$’0002015
$’000
REVENUE
Fee and commission income 404,828 246,413
Less: brokerage commission paid (124,830) (64,314)
Net fee and commission income 279,998 182,099
Marketing and administration fees 32,404 29,619
Interest income 7,222 6,358
Other revenue 37,159 32,452
356,783 250,528
Share of profits of associates accounted for using the equity method 12 9,071 8,293
Share of profits of joint venture accounted for using the equity method 13 2,095 2,138
Profit on fair value of investments 18 1,600 565
Gain from adjustments to deferred consideration estimates 10 23,874 939
Other income 3,399 2,524
396,822 264,987
EXPENSES
Employment expense (159,046) (110,555)
Selling expense (15,255) (11,804)
Administration, brokers’ support service and other expenses (48,781) (37,740)
Steadfast Network Broker rebates expense (10,158) (9,270)
Occupancy expense (13,071) (9,287)
Amortisation expense (20,888) (12,881)
Depreciation expense (3,119) (2,702)
Impairment expense 4, 7 (18,090) -
Finance costs (8,432) (4,417)
Stamp duty, due diligence and restructure costs 18 (127) (3,302)
Profit before income tax expense 99,855 63,029
Income tax expense 20 (18,737) (15,024)
Profit after income tax expense for the year 81,118 48,005
OTHER COMPREHENSIVE INCOME
ITEMS THAT MAY BE RECLASSIFIED SUBSEQUENTLY TO PROFIT OR LOSS
Net movement in foreign currency translation reserve 379 (1,486)
Cash flow hedge effective portion of change in fair value (463) -
Income tax expense on other comprehensive income 25 445
Other comprehensive income for the period, net of tax (59) (1,041)
Total comprehensive income for the year, net of tax 81,059 46,964
Steadfast Group Annual Report 2016
57
Note2016
$’0002015
$’000
PROFIT FOR THE YEAR IS ATTRIBUTABLE TO:
Non-controlling interests 7,638 5,901
Owners of Steadfast Group Limited 73,480 42,104
81,118 48,005
TOTAL COMPREHENSIVE INCOME FOR THE YEAR IS ATTRIBUTABLE TO:
Non-controlling interests 7,638 5,907
Owners of Steadfast Group Limited 73,421 41,057
81,059 46,964
EARNINGS PER SHARE
Basic earnings per share (cents per share) 5 9.86 7.26
Diluted earnings per share (cents per share) 5 9.84 7.24
The above Consolidated Statement of Profit or Loss and Other Comprehensive Income should be read in conjunction with the notes to the financial statements.

58
Steadfast Group Limited
Consolidated Statement of Financial PositionAS AT 30 JUNE 2016
Note2016
$’0002015
$’000
ASSETS
CURRENT ASSETS
Cash and cash equivalents 21 67,457 67,648
Cash held on trust 21 224,752 172,155
Receivables from broking/underwriting agency operations 301,011 311,521
Other receivables 35,466 27,507
Related party loans receivable 22 976 927
Other 4,455 3,386
Total current assets 634,117 583,144
NON-CURRENT ASSETS
Related party loans receivable 22 7,197 7,500
Property, plant and equipment 27,908 25,777
Deferred tax assets 20 8,284 10,357
Investments in associates 12 121,783 122,351
Interest in joint venture 13 2,211 3,446
Intangible assets 7 165,280 180,952
Goodwill 7 712,329 669,321
Other 14 33,389 12,659
Total non-current assets 1,078,381 1,032,363
Total assets 1,712,498 1,615,507
LIABILITIES
CURRENT LIABILITIES
Bank overdrafts 8, 21 464 632
Payables on broking/underwriting agency operations 453,322 429,012
Other payables 48,002 43,380
Borrowings 8 1,116 453
Income tax payable 17,583 4,168
Provisions 15,363 11,851
Deferred consideration 11,821 27,506
Total current liabilities 547,671 517,002
NON-CURRENT LIABILITIES
Borrowings 8 200,326 160,910
Other payables 3,005 1,284
Deferred tax liabilities 20 55,342 59,810
Deferred consideration 1,848 27,821
Provisions 6,165 7,115
Total non-current liabilities 266,686 256,940
Total liabilities 814,357 773,942
Net assets 898,141 841,565
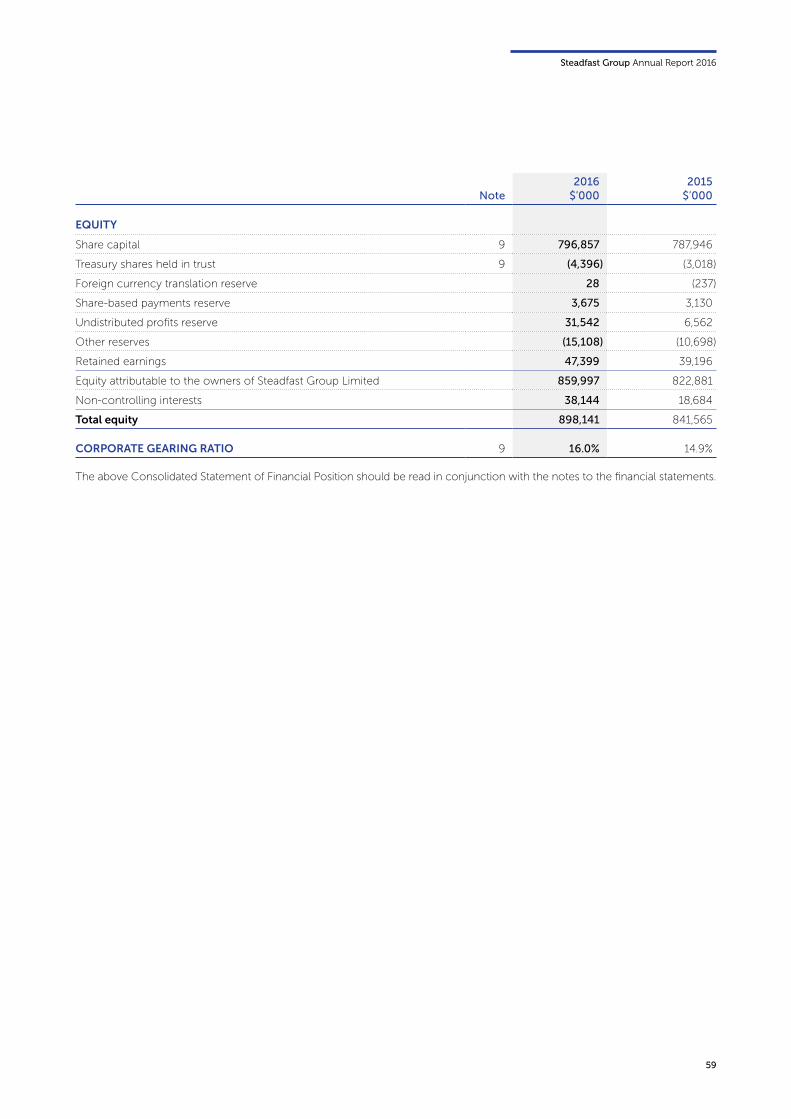
Steadfast Group Annual Report 2016
59
Note2016
$’0002015
$’000
EQUITY
Share capital 9 796,857 787,946
Treasury shares held in trust 9 (4,396) (3,018)
Foreign currency translation reserve 28 (237)
Share-based payments reserve 3,675 3,130
Undistributed profits reserve 31,542 6,562
Other reserves (15,108) (10,698)
Retained earnings 47,399 39,196
Equity attributable to the owners of Steadfast Group Limited 859,997 822,881
Non-controlling interests 38,144 18,684
Total equity 898,141 841,565
CORPORATE GEARING RATIO 9 16.0% 14.9%
The above Consolidated Statement of Financial Position should be read in conjunction with the notes to the financial statements.

60
Steadfast Group Limited
Consolidated Statement of Changes in EquityFOR THE YEAR ENDED 30 JUNE 2016
Equity attributable to owners of Steadfast Group Limited
Non-controlling
interestsTotal
equity
2016
Share capital $’000
Treasury shares held in
trust $’000
Foreign currency
translation reserve
$’000
Share-based
payments reserve
$’000
Un- distributed
profits reserve
$’000
Other reserves
$’000
Retained earnings
$’000 $’000 $’000
Balance at 1 July 2015 787,946 (3,018) (237) 3,130 6,562 (10,698) 39,196 18,684 841,565
Profit after income tax expense for the year - - - - - - 73,480 7,638 81,118
Other comprehensive income for the year, net of tax - - 265 - - (324) - - (59)
Total comprehensive income for the year - - 265 - - (324) 73,480 7,638 81,059
TRANSACTIONS WITH OWNERS IN THEIR CAPACITY AS OWNERS:
Shares issued for Dividend Reinvestment Plan (Note 9) 8,911 - - - - - - - 8,911
Shares acquired and held in trust (Note 9) - (1,388) - - - - - - (1,388)
Share-based payments on Executive Shares and employee share plans - - - 710 - - - - 710
Shares allotted through Dividend Reinvestment Plan (Note 9) - (155) - - - - - - (155)
Shares allotted to employees under Employee Conditional Rights Scheme - 165 - (165) - - - - -
Transfer of retained earnings to profit reserve - - - - 47,282 - (47,282) - -
Put option liability on acquisition of subsidiaries - - - - - - - - -
Acquisition of non-controlling interests - - - - - - - (279) (279)
Changes in part equity interests in subsidiaries without loss of control - - - - - (4,086) - 19,247 15,161
Dividends declared and paid - - - - (22,302) - (17,995) (7,146) (47,443)
Balance at 30 June 2016 796,857 (4,396) 28 3,675 31,542 (15,108) 47,399 38,144 898,141
The above Consolidated Statement of Changes in Equity should be read in conjunction with the notes to the financial statements.
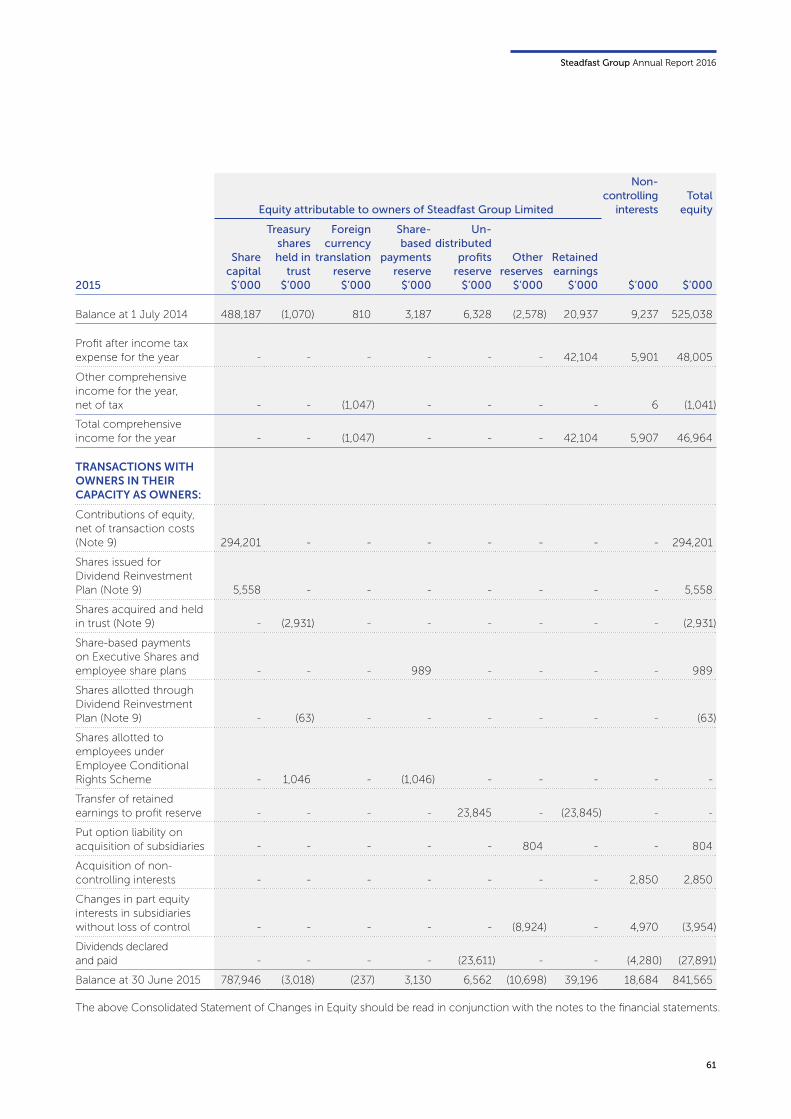
Steadfast Group Annual Report 2016
61
Equity attributable to owners of Steadfast Group Limited
Non-controlling
interestsTotal
equity
2015
Share capital $’000
Treasury shares held in
trust $’000
Foreign currency
translation reserve
$’000
Share-based
payments reserve
$’000
Un- distributed
profits reserve
$’000
Other reserves
$’000
Retained earnings
$’000 $’000 $’000
Balance at 1 July 2014 488,187 (1,070) 810 3,187 6,328 (2,578) 20,937 9,237 525,038
Profit after income tax expense for the year - - - - - - 42,104 5,901 48,005
Other comprehensive income for the year, net of tax - - (1,047) - - - - 6 (1,041)
Total comprehensive income for the year - - (1,047) - - - 42,104 5,907 46,964
TRANSACTIONS WITH OWNERS IN THEIR CAPACITY AS OWNERS:
Contributions of equity, net of transaction costs (Note 9) 294,201 - - - - - - - 294,201
Shares issued for Dividend Reinvestment Plan (Note 9) 5,558 - - - - - - - 5,558
Shares acquired and held in trust (Note 9) - (2,931) - - - - - - (2,931)
Share-based payments on Executive Shares and employee share plans - - - 989 - - - - 989
Shares allotted through Dividend Reinvestment Plan (Note 9) - (63) - - - - - - (63)
Shares allotted to employees under Employee Conditional Rights Scheme - 1,046 - (1,046) - - - - -
Transfer of retained earnings to profit reserve - - - - 23,845 - (23,845) - -
Put option liability on acquisition of subsidiaries - - - - - 804 - - 804
Acquisition of non-controlling interests - - - - - - - 2,850 2,850
Changes in part equity interests in subsidiaries without loss of control - - - - - (8,924) - 4,970 (3,954)
Dividends declared and paid - - - - (23,611) - - (4,280) (27,891)
Balance at 30 June 2015 787,946 (3,018) (237) 3,130 6,562 (10,698) 39,196 18,684 841,565
The above Consolidated Statement of Changes in Equity should be read in conjunction with the notes to the financial statements.
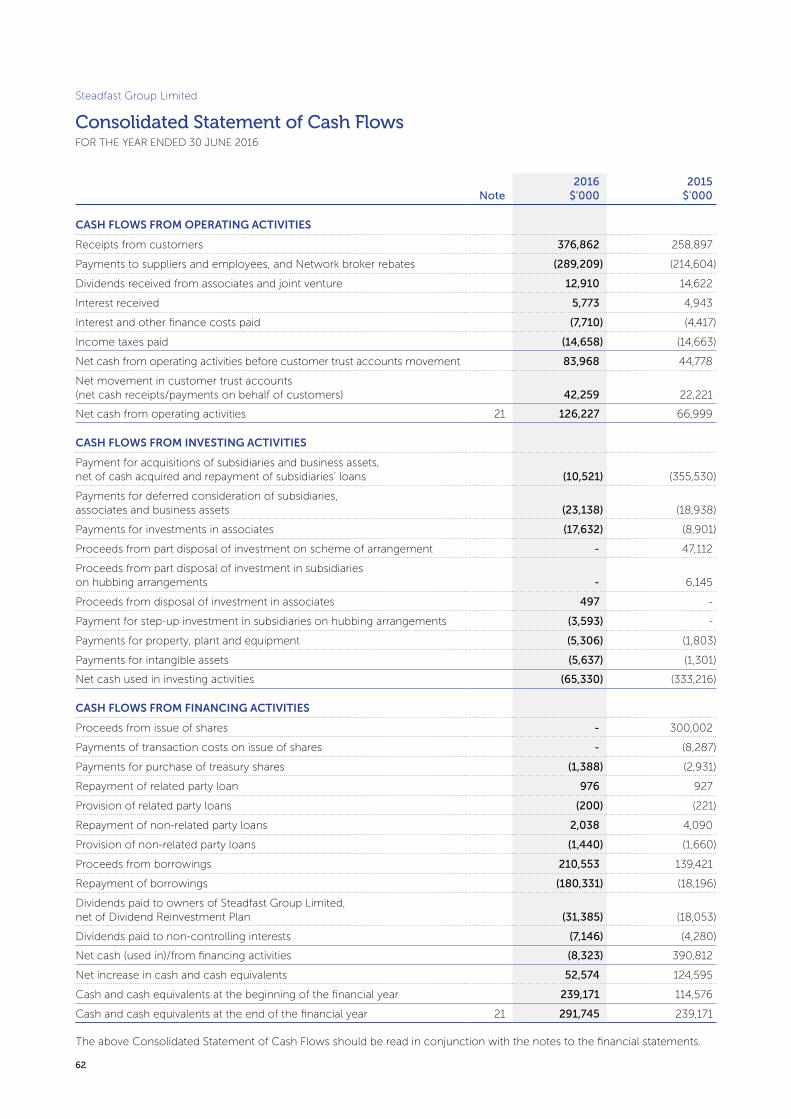
62
Steadfast Group Limited
Consolidated Statement of Cash FlowsFOR THE YEAR ENDED 30 JUNE 2016
Note2016
$’0002015
$’000
CASH FLOWS FROM OPERATING ACTIVITIES
Receipts from customers 376,862 258,897
Payments to suppliers and employees, and Network broker rebates (289,209) (214,604)
Dividends received from associates and joint venture 12,910 14,622
Interest received 5,773 4,943
Interest and other finance costs paid (7,710) (4,417)
Income taxes paid (14,658) (14,663)
Net cash from operating activities before customer trust accounts movement 83,968 44,778
Net movement in customer trust accounts (net cash receipts/payments on behalf of customers) 42,259 22,221
Net cash from operating activities 21 126,227 66,999
CASH FLOWS FROM INVESTING ACTIVITIES
Payment for acquisitions of subsidiaries and business assets, net of cash acquired and repayment of subsidiaries’ loans (10,521) (355,530)
Payments for deferred consideration of subsidiaries, associates and business assets (23,138) (18,938)
Payments for investments in associates (17,632) (8,901)
Proceeds from part disposal of investment on scheme of arrangement - 47,112
Proceeds from part disposal of investment in subsidiaries on hubbing arrangements - 6,145
Proceeds from disposal of investment in associates 497 -
Payment for step-up investment in subsidiaries on hubbing arrangements (3,593) -
Payments for property, plant and equipment (5,306) (1,803)
Payments for intangible assets (5,637) (1,301)
Net cash used in investing activities (65,330) (333,216)
CASH FLOWS FROM FINANCING ACTIVITIES
Proceeds from issue of shares - 300,002
Payments of transaction costs on issue of shares - (8,287)
Payments for purchase of treasury shares (1,388) (2,931)
Repayment of related party loan 976 927
Provision of related party loans (200) (221)
Repayment of non-related party loans 2,038 4,090
Provision of non-related party loans (1,440) (1,660)
Proceeds from borrowings 210,553 139,421
Repayment of borrowings (180,331) (18,196)
Dividends paid to owners of Steadfast Group Limited, net of Dividend Reinvestment Plan (31,385) (18,053)
Dividends paid to non-controlling interests (7,146) (4,280)
Net cash (used in)/from financing activities (8,323) 390,812
Net increase in cash and cash equivalents 52,574 124,595
Cash and cash equivalents at the beginning of the financial year 239,171 114,576
Cash and cash equivalents at the end of the financial year 21 291,745 239,171
The above Consolidated Statement of Cash Flows should be read in conjunction with the notes to the financial statements.
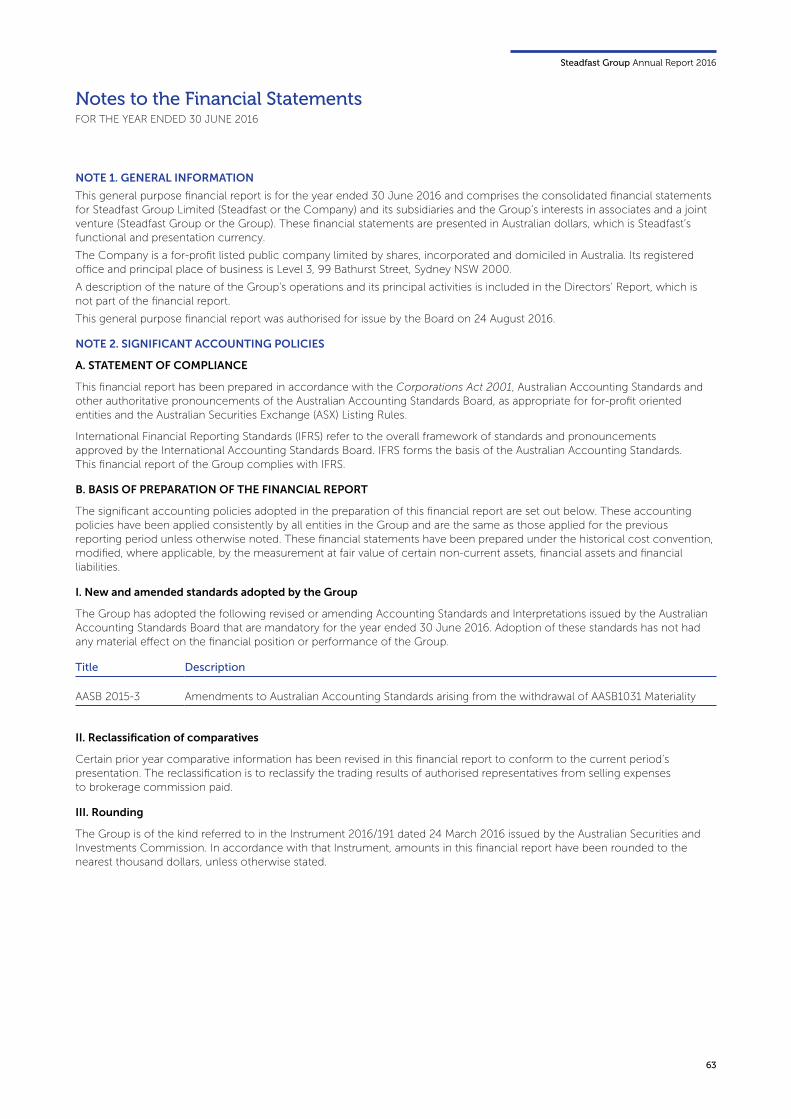
Steadfast Group Annual Report 2016
63
Notes to the Financial StatementsFOR THE YEAR ENDED 30 JUNE 2016
NOTE 1. GENERAL INFORMATION
This general purpose financial report is for the year ended 30 June 2016 and comprises the consolidated financial statements for Steadfast Group Limited (Steadfast or the Company) and its subsidiaries and the Group’s interests in associates and a joint venture (Steadfast Group or the Group). These financial statements are presented in Australian dollars, which is Steadfast’s functional and presentation currency.
The Company is a for-profit listed public company limited by shares, incorporated and domiciled in Australia. Its registered office and principal place of business is Level 3, 99 Bathurst Street, Sydney NSW 2000.
A description of the nature of the Group's operations and its principal activities is included in the Directors' Report, which is not part of the financial report.
This general purpose financial report was authorised for issue by the Board on 24 August 2016.
NOTE 2. SIGNIFICANT ACCOUNTING POLICIES
A. STATEMENT OF COMPLIANCE
This financial report has been prepared in accordance with the Corporations Act 2001, Australian Accounting Standards and other authoritative pronouncements of the Australian Accounting Standards Board, as appropriate for for-profit oriented entities and the Australian Securities Exchange (ASX) Listing Rules.
International Financial Reporting Standards (IFRS) refer to the overall framework of standards and pronouncements approved by the International Accounting Standards Board. IFRS forms the basis of the Australian Accounting Standards. This financial report of the Group complies with IFRS.
B. BASIS OF PREPARATION OF THE FINANCIAL REPORT
The significant accounting policies adopted in the preparation of this financial report are set out below. These accounting policies have been applied consistently by all entities in the Group and are the same as those applied for the previous reporting period unless otherwise noted. These financial statements have been prepared under the historical cost convention, modified, where applicable, by the measurement at fair value of certain non-current assets, financial assets and financial liabilities.
I. New and amended standards adopted by the Group
The Group has adopted the following revised or amending Accounting Standards and Interpretations issued by the Australian Accounting Standards Board that are mandatory for the year ended 30 June 2016. Adoption of these standards has not had any material effect on the financial position or performance of the Group.
Title Description
AASB 2015-3 Amendments to Australian Accounting Standards arising from the withdrawal of AASB1031 Materiality
II. Reclassification of comparatives
Certain prior year comparative information has been revised in this financial report to conform to the current period’s presentation. The reclassification is to reclassify the trading results of authorised representatives from selling expenses to brokerage commission paid.
III. Rounding
The Group is of the kind referred to in the Instrument 2016/191 dated 24 March 2016 issued by the Australian Securities and Investments Commission. In accordance with that Instrument, amounts in this financial report have been rounded to the nearest thousand dollars, unless otherwise stated.
64
NOTE 2. SIGNIFICANT ACCOUNTING POLICIES continued
C. PRINCIPLES OF CONSOLIDATION
I. Business combinations
The Group accounts for business combinations using the acquisition method when control is transferred to the Group. The consideration transferred in the acquisition is measured at fair value, as are the identifiable net assets acquired. The excess of the consideration transferred over the fair value of identifiable net assets acquired and non-controlling interests is recorded as goodwill. If the consideration transferred is less than the fair value of identifiable net assets acquired and non-controlling interests, the difference is recognised directly in profit or loss. Costs of acquisition are expensed as incurred, except if it related to the issue of debt or equity securities.
II. Subsidiaries
Subsidiaries are entities controlled by the Group. The Group controls an entity when it is exposed to, or has rights to, variable returns from its involvement with the entity and has the ability to affect those returns through its power over the entity. The financial statements of subsidiaries are included in the consolidated financial statements of the Group from the date on which control commences until the date on which control ceases.
III. Non-controlling interests
Non-controlling interests (NCI) are measured at their proportionate share of the acquired subsidiaries’ identifiable net assets at the date of acquisition. For the operations and business being put into a business hub, NCI represent the fair value at the hubbing date. Changes in the Group’s interest in a subsidiary that do not result in a loss of control are accounted for as equity transactions.
IV. Loss of control
When the Group loses control over a subsidiary, it derecognises the assets and liabilities of the subsidiary, and any related NCI and other components of equity. Any resulting gain or loss is recognised in profit or loss. Any interest retained in the former subsidiary is measured at fair value when control is lost.
V. Interests in equity-accounted investees
The Group’s interests in equity-accounted investees comprise interests in associates and a joint venture. Associates are those entities in which the Group has significant influence, but not control or joint control, over the financial and operating policies. A joint venture is an arrangement in which the Group has joint control, whereby the Group has rights to the net assets of the arrangement, rather than rights to its assets and obligations for its liabilities.
Interests in associates and the joint venture are accounted for using the equity method. They are initially recognised at cost, which includes transaction costs. Subsequent to initial recognition, the Group’s share of the profit or loss of associates and the joint venture is included in the Group’s profit or loss.
VI. Transactions eliminated on consolidation
Intra-group balances and transactions, and any unrealised income and expenses arising from intra-group transactions, are eliminated in full.
Notes to the Financial Statements continued

Steadfast Group Annual Report 2016
65
NOTE 2. SIGNIFICANT ACCOUNTING POLICIES continued
D. REVENUE RECOGNITION
Revenue is recognised when it is probable that the economic benefit will flow to the Group and the revenue can be reliably measured. Revenue is recognised to the extent that there is no future obligation. Where there is a future obligation, a portion is deferred over the expected service period.
Revenue is measured at the fair value of the consideration received or receivable.
I. Fees and commission income
Commission, brokerage and fees are recognised when the related service has been provided and it is probable that the Group will be compensated for services rendered and the amount of consideration for such services can be reliably measured. This is deemed to be the invoice date. An allowance is made for anticipated lapses and cancellations. Where there is a future obligation to provide claims handling services, a portion of the commission income is deferred over the expected service period.
II. Marketing and administration fees
The Company has negotiated with strategic partners, such as insurers, premium funders and underwriting agencies, to receive marketing and administration fees based on the amount of business placed with those entities for the Group’s preferred products. These amounts are recognised as revenue when base premium is placed (in the case of insurers and underwriting agencies) or premiums funded (in the case of premium funders).
III. Claims experience benefit
The Group may receive a claims experience benefit payment or payments in respect of certain types of insurance products placed with insurance companies. Revenue is recognised for a claims experience benefit for a particular policy year when it is likely that a claims experience benefit is receivable and the amount can be measured reliably.
Factors taken into account in recognising a claims experience benefit include the number of years that have passed since the end of a policy year and whether various claims have been closed or can be reliably measured.
IV. Other revenue
Other revenue is recognised when the right to receive payment is established.
E. TAXATION
Tax consolidation
The Company (the head entity) and its wholly owned Australian subsidiaries have formed an income tax consolidated group under the tax consolidation regime. Consequently, these entities are taxed as a single entity and the deferred tax assets and liabilities of these entities are offset in the consolidated financial statements.
In addition, certain controlled subsidiaries and their wholly owned Australian subsidiaries have formed income tax consolidated groups under the tax consolidation regime. These entities are also taxed as a single entity and the deferred tax assets and liabilities of these tax consolidated groups are offset in the consolidated financial statements.
F. CASH AND CASH EQUIVALENTS
Cash and cash equivalents includes cash at bank, deposits held at call with financial institutions, and other short-term, highly liquid investments with original maturities of three months or less that are readily convertible to known amounts of cash. This includes cash held by the subsidiaries for business operations/operating expenses purposes.
Cash held on trust relates to cash held for insurance premiums received from policyholders which will ultimately be paid to underwriters. Cash held on trust cannot be used to meet business operations/operating expenses other than payments to underwriters and/or refunds to policyholders.
66
NOTE 2. SIGNIFICANT ACCOUNTING POLICIES continued
G. RECEIVABLES FROM BROKING/UNDERWRITING AGENCY OPERATIONS
Receivables from broking/underwriting agency operations are initially recognised based on the invoiced amount to customers. After initial recognition, provision is made for lapses or cancellations of insurance policies or other matters that may lead to non-collection.
These receivables are generally due for settlement within 30 to 60 days. Collectability of trade receivables is reviewed on an ongoing basis.
H. INTANGIBLE ASSETS
Identifiable intangible assets acquired separately or in a business combination (mainly customer relationships and capitalised software) are initially measured at cost.
The cost of an intangible asset acquired in a business combination is its fair value as at the date of acquisition. The useful lives of these intangible assets are assessed on acquisition. Internally developed software costs are capitalised once the project is assessed to be feasible. The costs capitalised include licensing and direct labour costs. The useful lives of capitalised software are assessed when the project is completed and available for use.
Following initial recognition, intangible assets are carried at cost less any accumulated amortisation and provision for impairment.
Intangible assets with finite lives are amortised over their useful lives, currently estimated to be up to 10 years, and their useful lives are reviewed annually.
I. PAYABLES ON BROKING/UNDERWRITING AGENCY OPERATIONS
These amounts represent insurance premiums payable to insurance companies for broking/underwriting agency operations on amounts invoiced to customers and liabilities for goods and services provided to the Group prior to the end of the financial period and which are unpaid. The amounts are unsecured and are usually paid within 30 to 90 days of recognition.
J. HEDGE ACCOUNTING
Hedge accounting is applied when the Group designates certain derivatives to be part of a hedging relationship, and they meet the criteria for hedge accounting.
The Group uses cash flow hedges to mitigate the risk of variability of future cash flows attributable to interest rate fluctuations associated with the corporate debt facility. For cash flow hedges, the portion of the gain or loss on the hedge instrument that is effective is recognised directly in equity, while the ineffective portion is recognised in profit or loss. Amounts deferred in equity are transferred to profit or loss in the same periods the hedged item is recognised in the profit or loss.
K. AUSTRALIAN ACCOUNTING STANDARDS ISSUED AND NOT YET EFFECTIVE
The Company has not early adopted and applied any new, revised or amending Accounting Standards and Interpretations that are not yet mandatory for the year ended 30 June 2016.
The Company intends to adopt new, revised or amending Accounting Standards and Interpretations in the operating year commencing 1 July after the effective date of these standards and interpretations as set out in the table below.
Notes to the Financial Statements continued
Title Description Effective date Operating year Note
AASB 9 Financial Instruments and the relevant amending standards 1 January 2018 30 June 2019 (i)
AASB 15 Revenue from Contracts with Customers and the relevant amending standards
1 January 2018 30 June 2019 (i)
AASB 16 Leases 1 January 2019 30 June 2020 (i)
AASB 1057 Application of Australian Accounting Standards 1 January 2016 30 June 2017 (i)
AASB 2016-2 Amendments to Australian Accounting Standards – Disclosure Initiative: Amendments to AASB 107
1 January 2017 30 June 2018 (i)
Table note
(i) These changes are not expected to have a significant financial impact.
Steadfast Group Annual Report 2016
67
NOTE 3. CRITICAL ACCOUNTING JUDGEMENTS, ESTIMATES AND ASSUMPTIONS
The preparation of the financial statements requires management to make judgements, estimates and assumptions that affect the reported amounts in the financial statements. Management continually evaluates its judgements and estimates in relation to assets, liabilities, contingent liabilities, revenue and expenses. Management bases its judgements, estimates and assumptions on historical experience and on other various factors, including expectations of future events management believes to be reasonable under the circumstances. The resulting accounting judgements and estimates may differ from the related actual results. The judgements, estimates and assumptions that have a significant risk of causing a material adjustment to the carrying amounts of assets and liabilities (refer to the respective notes) during the year ended 30 June 2016 are discussed below.
A. FAIR VALUE OF ASSETS ACQUIRED
The Group measures the net assets acquired in a business combination at their fair value at the date of acquisition. If new information obtained within one year from the acquisition date about facts and circumstances that existed at the acquisition date identifies adjustments to the fair value, then the amounts recognised as at the acquisition date will be retrospectively revised.
Fair value is estimated with reference to the market transactions for similar assets or discounted cash flow analysis.
B. DEFERRED CONSIDERATION
The Group has made a best estimate of the fair value of consideration payable for the acquisitions where there is a variable purchase price (generally, a multiple of revenue or future period earnings before interest expense, tax and amortisation (EBITA)) after performing due diligence on the acquisition. Should the fair value of the final consideration payable vary from these estimates, the Group will be required to recognise the difference as expense or income.
C. GOODWILL
Goodwill is not amortised but assessed for impairment annually or when there is an evidence of impairment.
The recoverable amount of goodwill is estimated using the higher of fair value or the value in use analysis of the relevant cash generating unit (CGU) deducting the carrying amount of the identifiable net assets of the CGU. Key assumptions used in the calculation of recoverable amounts are the discount rates, terminal value growth rates and EBITA growth rates.
D. INTANGIBLE ASSETS
The carrying amounts of intangible assets with finite lives are reviewed at each reporting date to determine whether there is any indication of impairment. If any such indication exists, then the asset’s recoverable amount is estimated on the same basis as goodwill above.
An impairment loss is recognised if the carrying amount of the intangible asset exceeds its recoverable amount.
E. EQUITY-ACCOUNTED INVESTMENTS
Equity-accounted investments are carried at the lower of the equity-accounted amount and the recoverable amount.
The carrying amounts of equity-accounted investments (which include embedded amounts of intangible assets) are reviewed at each reporting date to determine whether there is any indication of impairment. If any such indication exists, then the asset’s recoverable amount is estimated on the same basis as goodwill above.
An impairment loss is recognised if the carrying amount of the equity-accounted investment exceeds its recoverable amount.
F. ESTIMATION OF USEFUL LIVES OF ASSETS
The Group determines the estimated useful lives and related depreciation and amortisation charges for its property, plant and equipment and finite life intangible assets. The useful lives could change significantly as a result of technical innovations or some other event. The depreciation and amortisation charge will increase where the useful lives are less than previously estimated, or technically obsolete or non-strategic assets that have been abandoned or sold will be written off or written down.
F. RECOVERY OF DEFERRED TAX ASSETS
Deferred tax assets are recognised for deductible temporary differences and operating tax losses only if the Group considers it is probable that future taxable amounts will be available to utilise those temporary differences and losses.

68
Notes to the Financial Statements continued
NOTE 4. OPERATING SEGMENTS
The Company’s corporate structure includes equity investments in insurance intermediary entities (insurance broking, underwriting agencies and premium funders) and complementary businesses. Discrete financial information about each of these entities is reported to management on a regular basis and, accordingly, management considers each entity to be a discrete business operation. The Company believes that all of the Group’s equity investments in insurance intermediary entities exhibit similar economic characteristics and have therefore been aggregated into a single reporting segment, being the general insurance intermediary sector. This assessment is based on each of the business operations having similar products and services, similar types of customer, employing similar operating processes and procedures, and operating within similar regulatory environments. The Group is in the business of distributing and advising on insurance products in Australia, New Zealand, London and Singapore.
In addition to reviewing performance based on statutory profit after tax, the Chief Operating Decision Maker (being the Managing Director & CEO) also reviews a key additional performance measure being earnings before interest expense, tax and amortisation (EBITA) broken down by consolidated entities, associates and joint venture.
The additional performance measures, EBITA and other related information (broken down by consolidated entities, and associates and joint venture) provided on a regular basis to the Chief Operating Decision Maker are outlined in the table below.
2016 2015
Table note
Insurance intermediary
$’000Other $’000
Total $’000
Insurance intermediary
$’000Other $’000
Total $’000
Revenue – consolidated entities 345,477 13,006 358,483 242,335 9,035 251,370
Expenses – consolidated entities (228,244) (10,880) (239,124) (165,307) (7,655) (172,962)
EBITA – consolidated entities 117,233 2,126 119,359 77,028 1,380 78,408
Share of EBITA from associates and joint venture (Note 12,13) 20,341 342 20,683 20,048 309 20,357
EBITA from core operations – pre-corporate expenses 137,574 2,468 140,042 97,076 1,689 98,765
Corporate expenses (9,951) - (9,951) (8,396) - (8,396)
EBITA from core operations – post-corporate expenses 127,623 2,468 130,091 88,680 1,689 90,369
Finance costs (net of interest received on surplus cash held) (i) (9,169) (18) (9,187) (5,321) (12) (5,333)
Amortisation expense (ii) (23,420) (744) (24,164) (16,006) (524) (16,530)
Profit before income tax from core operations before non-trading items 95,034 1,706 96,740 67,353 1,153 68,506
Income tax expense on profit before non-trading items (iii) (28,268) (506) (28,774) (19,916) (595) (20,511)
Profit after income tax before non-trading items 66,766 1,200 67,966 47,437 558 47,995
Non-trading items:
Income (iv) 27,173 - 27,173 3,186 - 3,186
Expenses (v) (18,572) - (18,572) (3,302) - (3,302)
Income tax benefit on non-trading items 4,551 - 4,551 126 - 126
Net profit after income tax for the year 79,918 1,200 81,118 47,447 558 48,005
Non-controlling interests (NCI) (7,519) - (7,519) (5,901) - (5,901)
NCI in non-trading items:
Income (171) - (171) - - -
Income tax benefit on non-trading items 52 - 52 - - -
Net profit after income tax attributable to owners of Steadfast Group Limited 72,280 1,200 73,480 41,546 558 42,104
Other comprehensive income attributable to owners of Steadfast Group Limited (59) - (59) (1,047) - (1,047)
Total comprehensive income after income tax attributable to owners of Steadfast Group Limited 72,221 1,200
73,421 40,499 558 41,057
Steadfast Group Annual Report 2016
69
NOTE 4. OPERATING SEGMENTS continued
Table notes
2016 2015Insurance
intermediary $’000
Other $’000
Total $’000
Insurance intermediary
$’000Other $’000
Total $’000
(i) Breakdown of finance costs:
Finance costs – consolidated entities (8,432) - (8,432) (4,417) - (4,417)
Finance costs – associates and joint venture (Note 12, 13) (737) (18) (755) (904) (12) (916)
(9,169) (18) (9,187) (5,321) (12) (5,333)
(ii) Breakdown of amortisation expenses:
Amortisation expense – consolidated entities (20,216) (672) (20,888) (12,429) (452) (12,881)
Amortisation expense – associates and joint venture (Note 12, 13) (3,204) (72) (3,276) (3,577) (72) (3,649)
(23,420) (744) (24,164) (16,006) (524) (16,530)
(iii) Breakdown of income tax expense on profit before non-trading items:
Income tax expense – consolidated entities (22,856) (432) (23,288) (14,625) (525) (15,150)
Income tax expense – associates and joint venture (Note 12, 13) (5,412) (74) (5,486) (5,291) (70) (5,361)
(28,268) (506) (28,774) (19,916) (595) (20,511)
(iv) Breakdown of non-trading income:
Net profit on change in value of investments 1,600 - 1,600 565 - 565
Executive loans fair value adjustment on part repayment of loan - - - 971 - 971
Reversal of deemed interest costs on interest free executive loans 530 - 530 711 - 711
Net gain on disposal of customer list 1,169 - 1,169 - - -
Net gain on re-estimation and settlement of deferred consideration(a) 23,874 - 23,874 939 - 939
27,173 - 27,173 3,186 - 3,186
(v) Breakdown of non-trading expenses:
Impairment loss(a) (18,090) - (18,090) - - -
Non-recurring amortisation expense (482) - (482) - - -
Stamp duty, due diligence and restructure costs(b) - - - (3,302) - (3,302)
(18,572) - (18,572) (3,302) - (3,302)
(a) The Group often defers a portion of the purchase price of a business and makes the final payment referable to future financial performance. At the time of acquisition an estimate is made as to the fair value of the final payment. This is reviewed each half-year based on information available and at settlement, and the estimate is adjusted if appropriate. Any adjustment is taken to profit (downwards estimate) or loss (upwards estimate). Where an estimate is reduced, the Group will consider whether the factors leading to the estimate of deferred consideration represent an indicator of impairment, and if so, the need for impairment is considered. The deferred consideration adjustments and impairments do not affect cash flows from operating activities.
(b) For the year ended 30 June 2016, the Group has incurred $0.127 million of stamp duty, due diligence and restructure costs (30 June 2015: $3.302 million). These costs are not considered to be non-trading for the current year as they are largely incurred for internal restructure which is part of the Group’s normal operation. In prior year, the Group incurred large one-off costs for the capital raising and the acquisitions of a number of underwriting agencies (including Calliden Group, CHU and UAA) to become the largest underwriting agency group in Australia and New Zealand. These events are considered to be significant changes in the state of affairs for the Group; as such the associated expenses are presented as non-trading expenses.
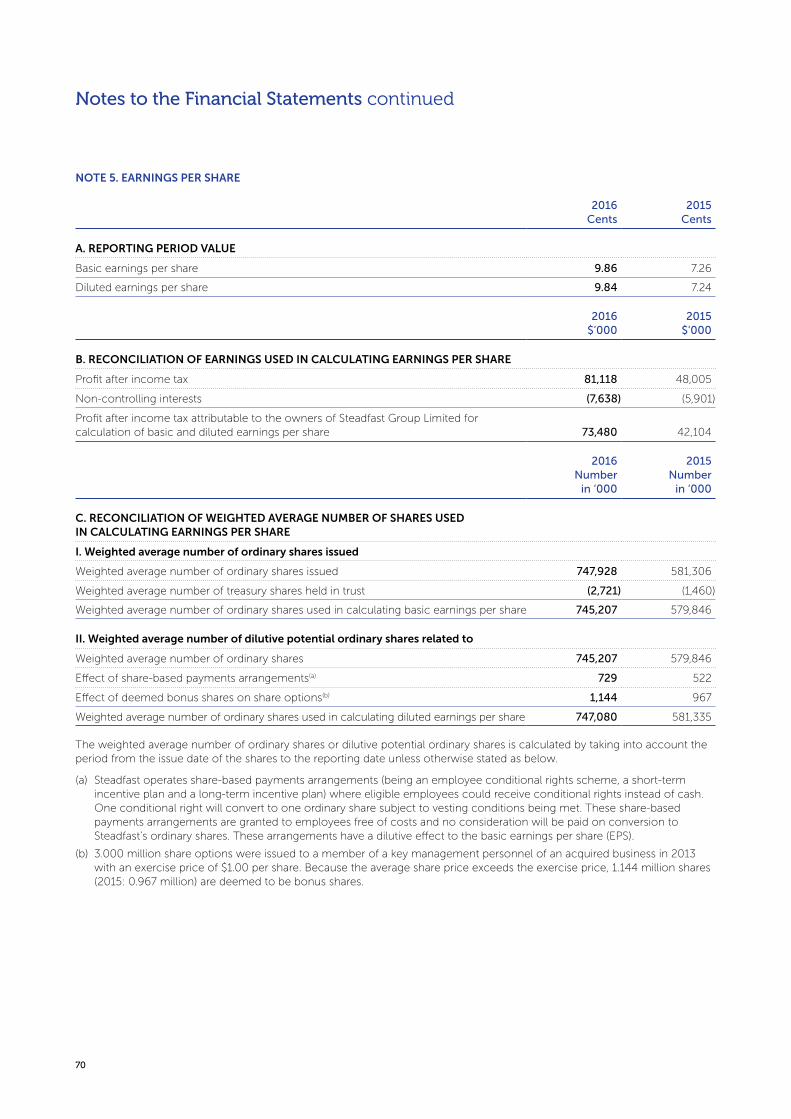
70
Notes to the Financial Statements continued
NOTE 5. EARNINGS PER SHARE
2016 Cents
2015 Cents
A. REPORTING PERIOD VALUE
Basic earnings per share 9.86 7.26
Diluted earnings per share 9.84 7.24
2016 $’000
2015 $’000
B. RECONCILIATION OF EARNINGS USED IN CALCULATING EARNINGS PER SHARE
Profit after income tax 81,118 48,005
Non-controlling interests (7,638) (5,901)
Profit after income tax attributable to the owners of Steadfast Group Limited for calculation of basic and diluted earnings per share 73,480 42,104
2016 Number
in ‘000
2015 Number
in ‘000
C. RECONCILIATION OF WEIGHTED AVERAGE NUMBER OF SHARES USED IN CALCULATING EARNINGS PER SHARE
I. Weighted average number of ordinary shares issued
Weighted average number of ordinary shares issued 747,928 581,306
Weighted average number of treasury shares held in trust (2,721) (1,460)
Weighted average number of ordinary shares used in calculating basic earnings per share 745,207 579,846
II. Weighted average number of dilutive potential ordinary shares related to
Weighted average number of ordinary shares 745,207 579,846
Effect of share-based payments arrangements(a) 729 522
Effect of deemed bonus shares on share options(b) 1,144 967
Weighted average number of ordinary shares used in calculating diluted earnings per share 747,080 581,335
The weighted average number of ordinary shares or dilutive potential ordinary shares is calculated by taking into account the period from the issue date of the shares to the reporting date unless otherwise stated as below.
(a) Steadfast operates share-based payments arrangements (being an employee conditional rights scheme, a short-term incentive plan and a long-term incentive plan) where eligible employees could receive conditional rights instead of cash. One conditional right will convert to one ordinary share subject to vesting conditions being met. These share-based payments arrangements are granted to employees free of costs and no consideration will be paid on conversion to Steadfast’s ordinary shares. These arrangements have a dilutive effect to the basic earnings per share (EPS).
(b) 3.000 million share options were issued to a member of a key management personnel of an acquired business in 2013 with an exercise price of $1.00 per share. Because the average share price exceeds the exercise price, 1.144 million shares (2015: 0.967 million) are deemed to be bonus shares.

Steadfast Group Annual Report 2016
71
NOTE 6. DIVIDENDS
A. DIVIDENDS ON ORDINARY SHARES
Cents per share
Total amount $’000 Payment date
Tax rate for franking credit
Percentage franked
2016
2016 interim dividend 2.4 17,994 14 April 2016 30% 100%
2015 final dividend 3.0 22,302 14 October 2015 30% 100%
2015
2015 interim dividend 2.0 10,067 14 April 2015 30% 100%
2014 final dividend 2.7 13,544 8 October 2014 30% 100%
Cents per share
Total amount $’000
Expected payment date
Tax rate for franking credit
Percentage franked
2016 final dividend 3.6 26,991 14 Oct 2016 30% 100%
It is standard practice that the Board declares the dividend for a period after the relevant reporting date. A dividend is not accrued for until it is declared and so the dividends for a period are generally recognised and measured in the financial reporting period following the period to which the dividends relate.
The dividends recognised in the current reporting period include $0.155 million (2015: $0.063 million) paid in relation to treasury shares held in a trust controlled by the Group. All the treasury shares participate in the dividend reinvestment plan (DRP).
B. DIVIDEND POLICY
The Company targets a dividend payout ratio in the range of 65% to 85% of net profit after tax attributable to shareholders of the Company with a minimum dividend payout ratio of 50% of net profit after tax and before amortisation expense.
C. DIVIDEND REINVESTMENT
A DRP operates which allows equity holders to elect to receive their dividend entitlement in the form of the Company’s ordinary shares. The price of DRP shares is the average share market price calculated over the pricing period (which is at least five trading days) as determined by the Board for each dividend payment date.
D. DIVIDEND NOT RECOGNISED AT REPORTING DATE
On 24 August 2016, the Board resolved to pay the following dividend. As this occurred after the reporting date, the dividends declared have not been recognised in this financial report.
The Company’s DRP will operate by purchasing ordinary shares on market. No discount will be applied. The last election notice for participation in the DRP in relation to this final dividend is 14 September 2016.
2016 $’000
2015 $’000
Franking account balance at reporting date at 30% 27,942 31,795
Franking credits/(debits) to arise from payment/(refund) of income tax payable 8,824 (2,614)
Franking credits available for future reporting periods 36,766 29,181
Franking account impact of dividends declared before issuance of financial report but not recognised at reporting date (11,568) (9,558)
Franking credits available for subsequent financial periods based on a tax rate of 30% 25,198 19,623
The above amounts represent the balance of the franking account as at the end of the financial year, adjusted for:
• franking credits/(debits) that will arise from the payment/(refund) of the amount of the provision for income tax relating to the parent entity at the reporting date;
• franking debits that will arise from the payment of dividends not recognised as a liability at the reporting date; and
• franking credits that will arise from the receipt of dividends recognised as receivables at the reporting date.
E. FRANKING CREDITS
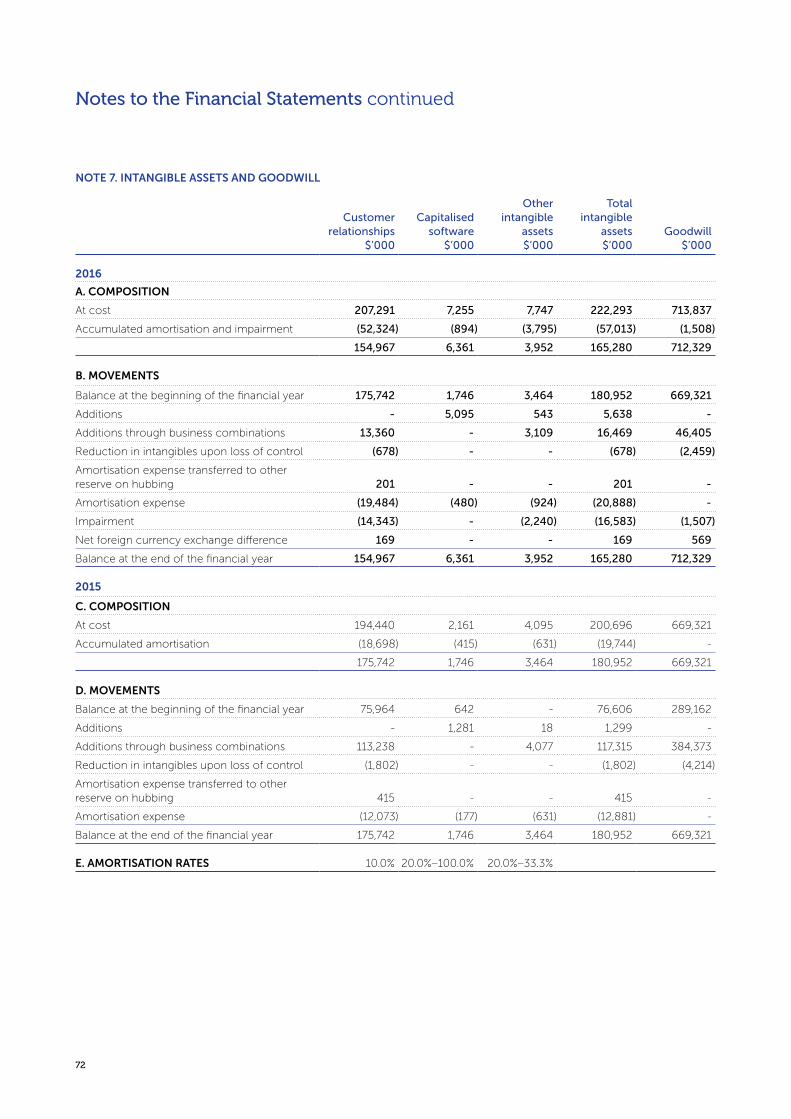
72
Notes to the Financial Statements continued
NOTE 7. INTANGIBLE ASSETS AND GOODWILL
Customer relationships
$’000
Capitalised software
$’000
Other intangible
assets $’000
Total intangible
assets $’000
Goodwill $’000
2016
A. COMPOSITION
At cost 207,291 7,255 7,747 222,293 713,837
Accumulated amortisation and impairment (52,324) (894) (3,795) (57,013) (1,508)
154,967 6,361 3,952 165,280 712,329
B. MOVEMENTS
Balance at the beginning of the financial year 175,742 1,746 3,464 180,952 669,321
Additions - 5,095 543 5,638 -
Additions through business combinations 13,360 - 3,109 16,469 46,405
Reduction in intangibles upon loss of control (678) - - (678) (2,459)
Amortisation expense transferred to other reserve on hubbing 201 - - 201 -
Amortisation expense (19,484) (480) (924) (20,888) -
Impairment (14,343) - (2,240) (16,583) (1,507)
Net foreign currency exchange difference 169 - - 169 569
Balance at the end of the financial year 154,967 6,361 3,952 165,280 712,329
2015
C. COMPOSITION
At cost 194,440 2,161 4,095 200,696 669,321
Accumulated amortisation (18,698) (415) (631) (19,744) -
175,742 1,746 3,464 180,952 669,321
D. MOVEMENTS
Balance at the beginning of the financial year 75,964 642 - 76,606 289,162
Additions - 1,281 18 1,299 -
Additions through business combinations 113,238 - 4,077 117,315 384,373
Reduction in intangibles upon loss of control (1,802) - - (1,802) (4,214)
Amortisation expense transferred to other reserve on hubbing 415 - - 415 -
Amortisation expense (12,073) (177) (631) (12,881) -
Balance at the end of the financial year 175,742 1,746 3,464 180,952 669,321
E. AMORTISATION RATES 10.0% 20.0%–100.0% 20.0%–33.3%
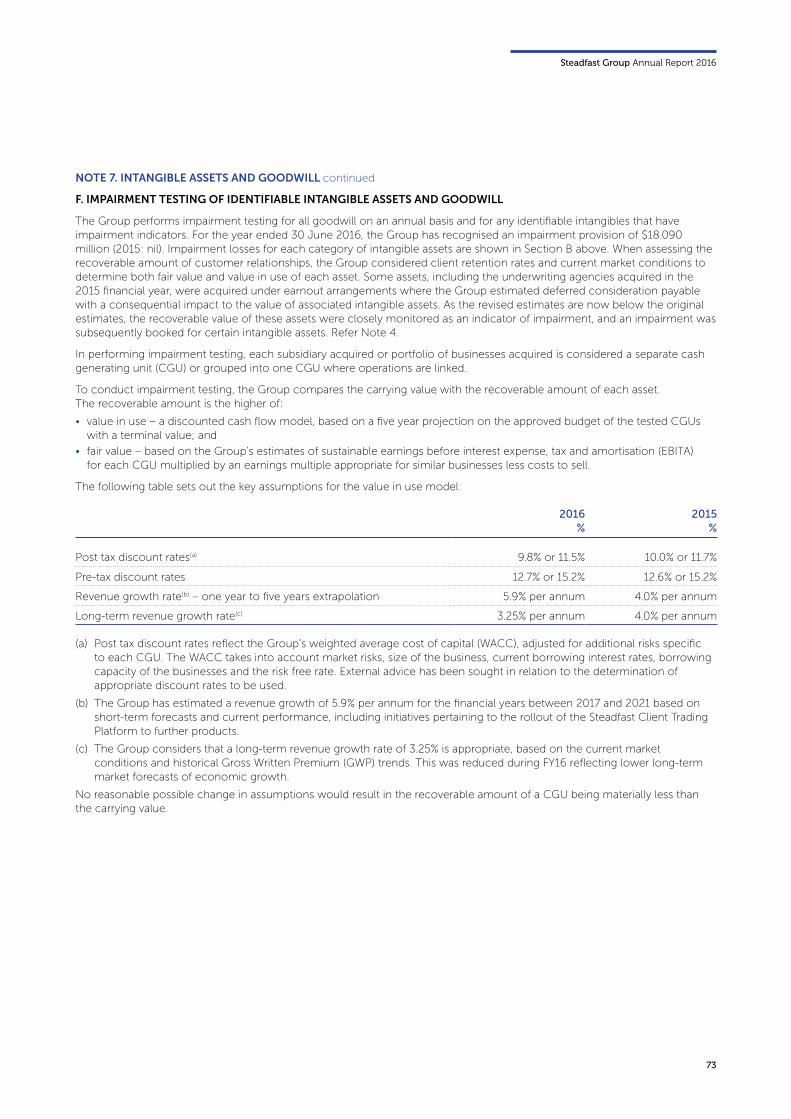
Steadfast Group Annual Report 2016
73
NOTE 7. INTANGIBLE ASSETS AND GOODWILL continued
F. IMPAIRMENT TESTING OF IDENTIFIABLE INTANGIBLE ASSETS AND GOODWILL
The Group performs impairment testing for all goodwill on an annual basis and for any identifiable intangibles that have impairment indicators. For the year ended 30 June 2016, the Group has recognised an impairment provision of $18.090 million (2015: nil). Impairment losses for each category of intangible assets are shown in Section B above. When assessing the recoverable amount of customer relationships, the Group considered client retention rates and current market conditions to determine both fair value and value in use of each asset. Some assets, including the underwriting agencies acquired in the 2015 financial year, were acquired under earnout arrangements where the Group estimated deferred consideration payable with a consequential impact to the value of associated intangible assets. As the revised estimates are now below the original estimates, the recoverable value of these assets were closely monitored as an indicator of impairment, and an impairment was subsequently booked for certain intangible assets. Refer Note 4.
In performing impairment testing, each subsidiary acquired or portfolio of businesses acquired is considered a separate cash generating unit (CGU) or grouped into one CGU where operations are linked.
To conduct impairment testing, the Group compares the carrying value with the recoverable amount of each asset. The recoverable amount is the higher of:
• value in use – a discounted cash flow model, based on a five year projection on the approved budget of the tested CGUs with a terminal value; and
• fair value – based on the Group’s estimates of sustainable earnings before interest expense, tax and amortisation (EBITA) for each CGU multiplied by an earnings multiple appropriate for similar businesses less costs to sell.
The following table sets out the key assumptions for the value in use model:
2016 %
2015 %
Post tax discount rates(a) 9.8% or 11.5% 10.0% or 11.7%
Pre-tax discount rates 12.7% or 15.2% 12.6% or 15.2%
Revenue growth rate(b) – one year to five years extrapolation 5.9% per annum 4.0% per annum
Long-term revenue growth rate(c) 3.25% per annum 4.0% per annum
(a) Post tax discount rates reflect the Group’s weighted average cost of capital (WACC), adjusted for additional risks specific to each CGU. The WACC takes into account market risks, size of the business, current borrowing interest rates, borrowing capacity of the businesses and the risk free rate. External advice has been sought in relation to the determination of appropriate discount rates to be used.
(b) The Group has estimated a revenue growth of 5.9% per annum for the financial years between 2017 and 2021 based on short-term forecasts and current performance, including initiatives pertaining to the rollout of the Steadfast Client Trading Platform to further products.
(c) The Group considers that a long-term revenue growth rate of 3.25% is appropriate, based on the current market conditions and historical Gross Written Premium (GWP) trends. This was reduced during FY16 reflecting lower long-term market forecasts of economic growth.
No reasonable possible change in assumptions would result in the recoverable amount of a CGU being materially less than the carrying value.
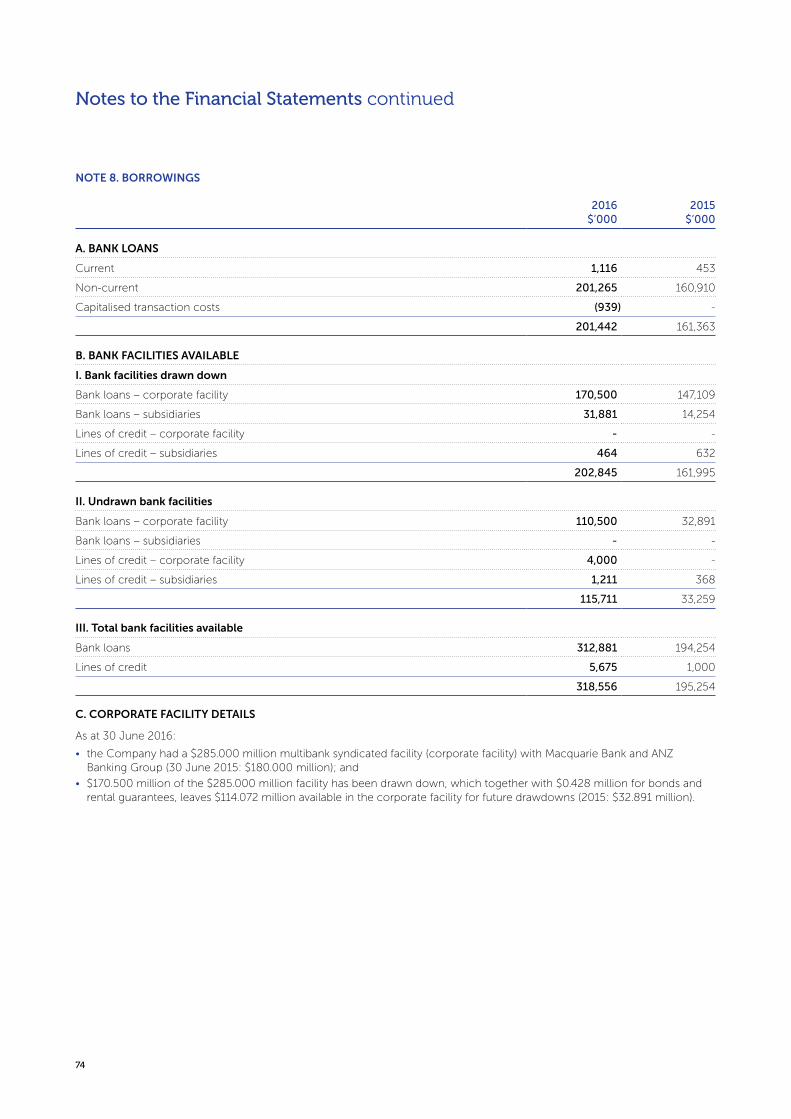
74
Notes to the Financial Statements continued
NOTE 8. BORROWINGS
2016 $’000
2015 $’000
A. BANK LOANS
Current 1,116 453
Non-current 201,265 160,910
Capitalised transaction costs (939) -
201,442 161,363
B. BANK FACILITIES AVAILABLE
I. Bank facilities drawn down
Bank loans – corporate facility 170,500 147,109
Bank loans – subsidiaries 31,881 14,254
Lines of credit – corporate facility - -
Lines of credit – subsidiaries 464 632
202,845 161,995
II. Undrawn bank facilities
Bank loans – corporate facility 110,500 32,891
Bank loans – subsidiaries - -
Lines of credit – corporate facility 4,000 -
Lines of credit – subsidiaries 1,211 368
115,711 33,259
III. Total bank facilities available
Bank loans 312,881 194,254
Lines of credit 5,675 1,000
318,556 195,254
C. CORPORATE FACILITY DETAILS
As at 30 June 2016:
• the Company had a $285.000 million multibank syndicated facility (corporate facility) with Macquarie Bank and ANZ Banking Group (30 June 2015: $180.000 million); and
• $170.500 million of the $285.000 million facility has been drawn down, which together with $0.428 million for bonds and rental guarantees, leaves $114.072 million available in the corporate facility for future drawdowns (2015: $32.891 million).
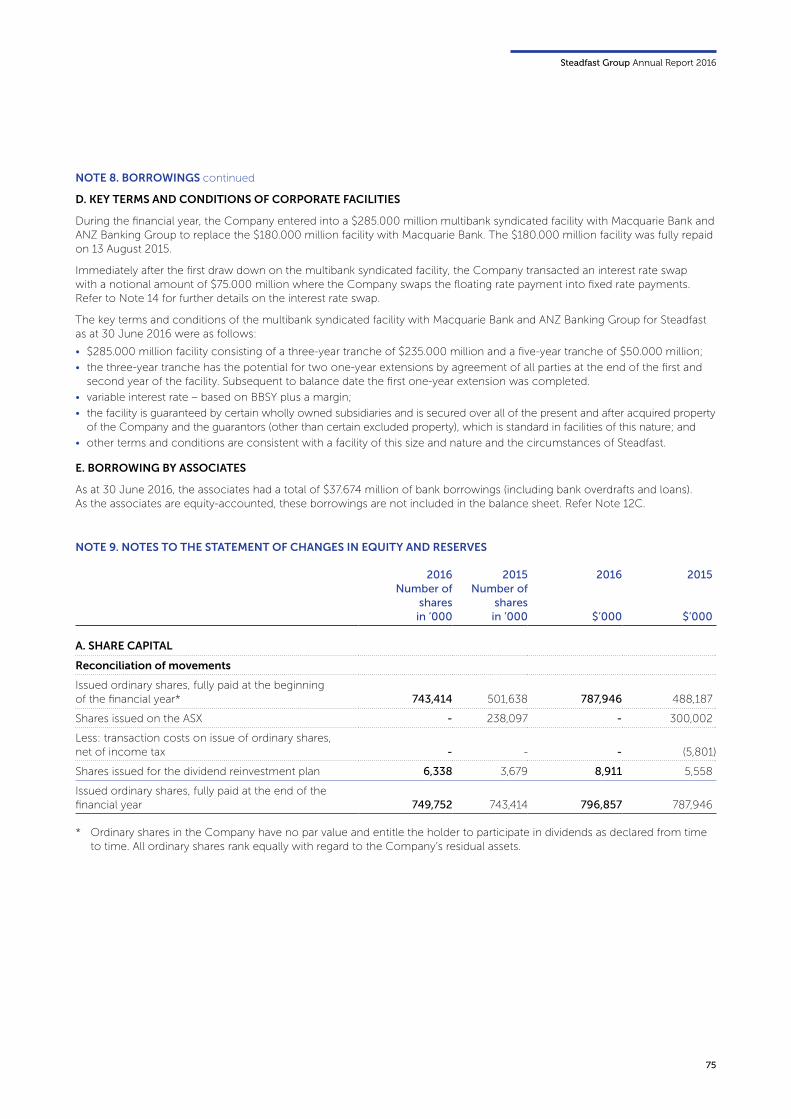
Steadfast Group Annual Report 2016
75
NOTE 8. BORROWINGS continued
D. KEY TERMS AND CONDITIONS OF CORPORATE FACILITIES
During the financial year, the Company entered into a $285.000 million multibank syndicated facility with Macquarie Bank and ANZ Banking Group to replace the $180.000 million facility with Macquarie Bank. The $180.000 million facility was fully repaid on 13 August 2015.
Immediately after the first draw down on the multibank syndicated facility, the Company transacted an interest rate swap with a notional amount of $75.000 million where the Company swaps the floating rate payment into fixed rate payments. Refer to Note 14 for further details on the interest rate swap.
The key terms and conditions of the multibank syndicated facility with Macquarie Bank and ANZ Banking Group for Steadfast as at 30 June 2016 were as follows:
• $285.000 million facility consisting of a three-year tranche of $235.000 million and a five-year tranche of $50.000 million;
• the three-year tranche has the potential for two one-year extensions by agreement of all parties at the end of the first and second year of the facility. Subsequent to balance date the first one-year extension was completed.
• variable interest rate – based on BBSY plus a margin;
• the facility is guaranteed by certain wholly owned subsidiaries and is secured over all of the present and after acquired property of the Company and the guarantors (other than certain excluded property), which is standard in facilities of this nature; and
• other terms and conditions are consistent with a facility of this size and nature and the circumstances of Steadfast.
E. BORROWING BY ASSOCIATES
As at 30 June 2016, the associates had a total of $37.674 million of bank borrowings (including bank overdrafts and loans). As the associates are equity-accounted, these borrowings are not included in the balance sheet. Refer Note 12C.
NOTE 9. NOTES TO THE STATEMENT OF CHANGES IN EQUITY AND RESERVES
2016 Number of
shares in ’000
2015Number of
shares in ’000
2016
$’000
2015
$’000
A. SHARE CAPITAL
Reconciliation of movements
Issued ordinary shares, fully paid at the beginning of the financial year* 743,414 501,638 787,946 488,187
Shares issued on the ASX - 238,097 - 300,002
Less: transaction costs on issue of ordinary shares, net of income tax - - - (5,801)
Shares issued for the dividend reinvestment plan 6,338 3,679 8,911 5,558
Issued ordinary shares, fully paid at the end of the financial year 749,752 743,414 796,857 787,946
* Ordinary shares in the Company have no par value and entitle the holder to participate in dividends as declared from time to time. All ordinary shares rank equally with regard to the Company’s residual assets.
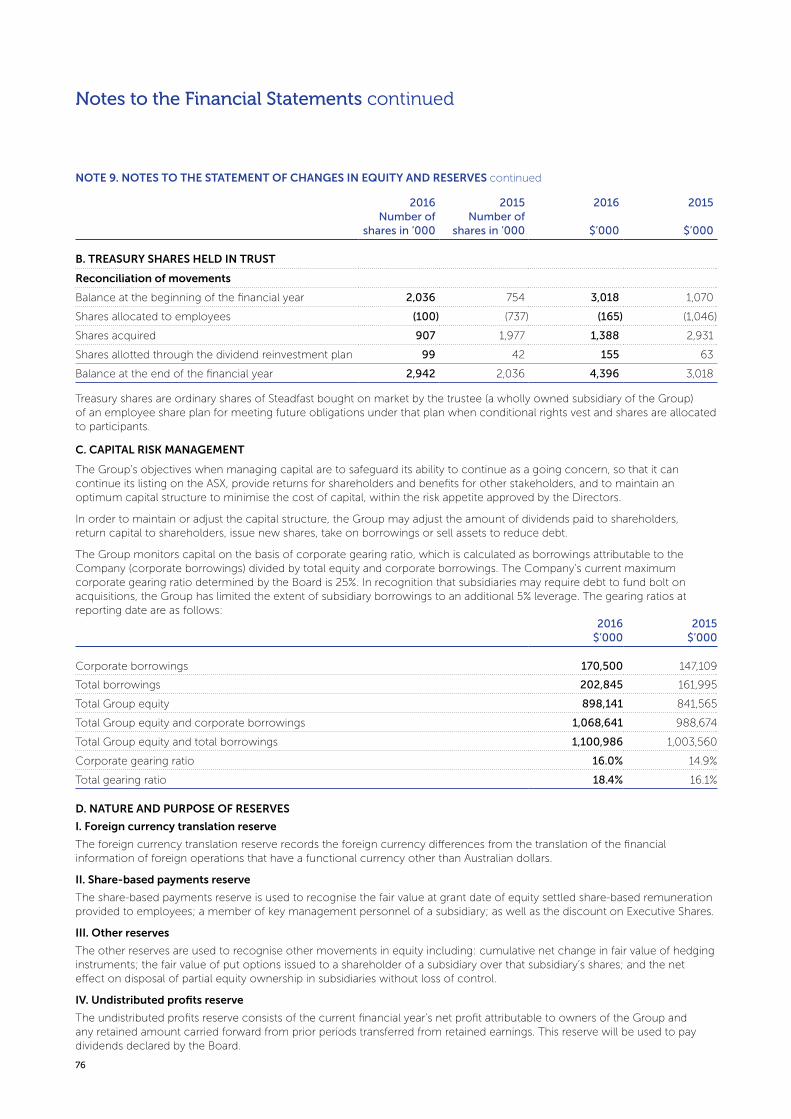
76
Notes to the Financial Statements continued
NOTE 9. NOTES TO THE STATEMENT OF CHANGES IN EQUITY AND RESERVES continued
2016Number of
shares in ’000
2015Number of
shares in ’000
2016
$’000
2015
$’000
B. TREASURY SHARES HELD IN TRUST
Reconciliation of movements
Balance at the beginning of the financial year 2,036 754 3,018 1,070
Shares allocated to employees (100) (737) (165) (1,046)
Shares acquired 907 1,977 1,388 2,931
Shares allotted through the dividend reinvestment plan 99 42 155 63
Balance at the end of the financial year 2,942 2,036 4,396 3,018
2016$’000
2015$’000
Corporate borrowings 170,500 147,109
Total borrowings 202,845 161,995
Total Group equity 898,141 841,565
Total Group equity and corporate borrowings 1,068,641 988,674
Total Group equity and total borrowings 1,100,986 1,003,560
Corporate gearing ratio 16.0% 14.9%
Total gearing ratio 18.4% 16.1%
Treasury shares are ordinary shares of Steadfast bought on market by the trustee (a wholly owned subsidiary of the Group) of an employee share plan for meeting future obligations under that plan when conditional rights vest and shares are allocated to participants.
C. CAPITAL RISK MANAGEMENT
The Group’s objectives when managing capital are to safeguard its ability to continue as a going concern, so that it can continue its listing on the ASX, provide returns for shareholders and benefits for other stakeholders, and to maintain an optimum capital structure to minimise the cost of capital, within the risk appetite approved by the Directors.
In order to maintain or adjust the capital structure, the Group may adjust the amount of dividends paid to shareholders, return capital to shareholders, issue new shares, take on borrowings or sell assets to reduce debt.
The Group monitors capital on the basis of corporate gearing ratio, which is calculated as borrowings attributable to the Company (corporate borrowings) divided by total equity and corporate borrowings. The Company’s current maximum corporate gearing ratio determined by the Board is 25%. In recognition that subsidiaries may require debt to fund bolt on acquisitions, the Group has limited the extent of subsidiary borrowings to an additional 5% leverage. The gearing ratios at reporting date are as follows:
D. NATURE AND PURPOSE OF RESERVES
I. Foreign currency translation reserve
The foreign currency translation reserve records the foreign currency differences from the translation of the financial information of foreign operations that have a functional currency other than Australian dollars.
II. Share-based payments reserve
The share-based payments reserve is used to recognise the fair value at grant date of equity settled share-based remuneration provided to employees; a member of key management personnel of a subsidiary; as well as the discount on Executive Shares.
III. Other reserves
The other reserves are used to recognise other movements in equity including: cumulative net change in fair value of hedging instruments; the fair value of put options issued to a shareholder of a subsidiary over that subsidiary’s shares; and the net effect on disposal of partial equity ownership in subsidiaries without loss of control.
IV. Undistributed profits reserve
The undistributed profits reserve consists of the current financial year’s net profit attributable to owners of the Group and any retained amount carried forward from prior periods transferred from retained earnings. This reserve will be used to pay dividends declared by the Board.
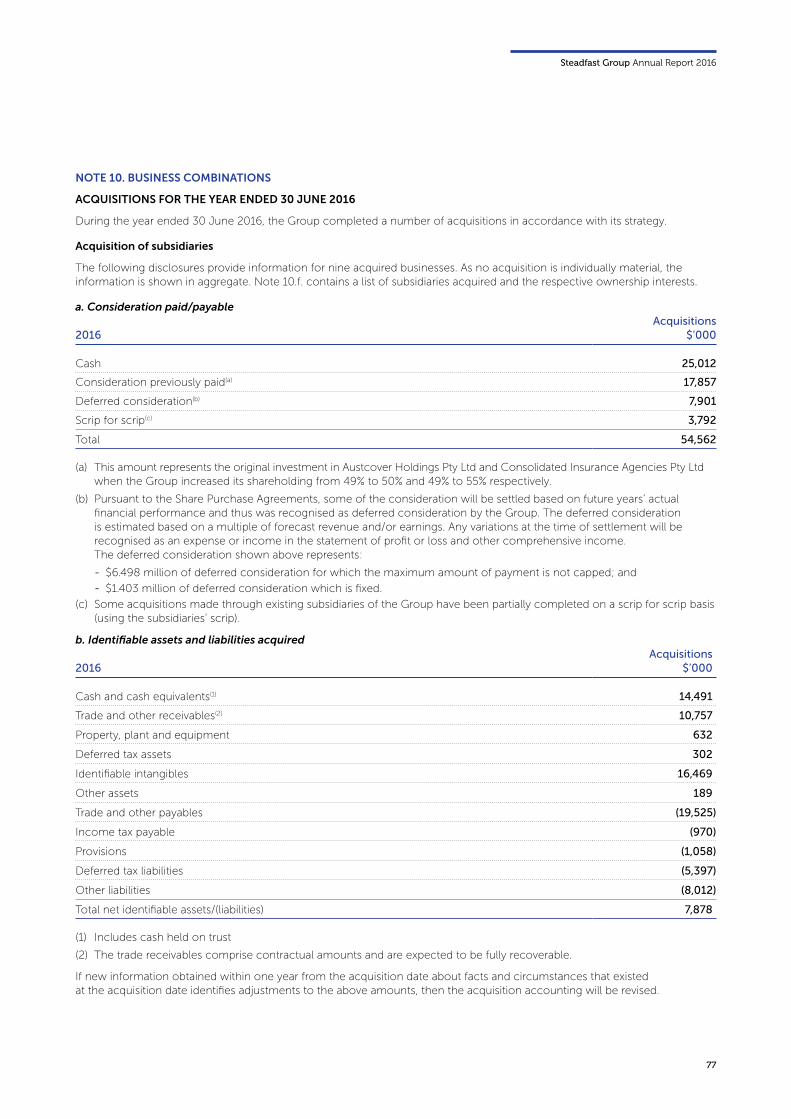
Steadfast Group Annual Report 2016
77
2016Acquisitions
$’000
Cash 25,012
Consideration previously paid(a) 17,857
Deferred consideration(b) 7,901
Scrip for scrip(c) 3,792
Total 54,562
2016Acquisitions
$’000
Cash and cash equivalents(1) 14,491
Trade and other receivables(2) 10,757
Property, plant and equipment 632
Deferred tax assets 302
Identifiable intangibles 16,469
Other assets 189
Trade and other payables (19,525)
Income tax payable (970)
Provisions (1,058)
Deferred tax liabilities (5,397)
Other liabilities (8,012)
Total net identifiable assets/(liabilities) 7,878
NOTE 10. BUSINESS COMBINATIONS
ACQUISITIONS FOR THE YEAR ENDED 30 JUNE 2016
During the year ended 30 June 2016, the Group completed a number of acquisitions in accordance with its strategy.
Acquisition of subsidiaries
The following disclosures provide information for nine acquired businesses. As no acquisition is individually material, the information is shown in aggregate. Note 10.f. contains a list of subsidiaries acquired and the respective ownership interests.
a. Consideration paid/payable
(a) This amount represents the original investment in Austcover Holdings Pty Ltd and Consolidated Insurance Agencies Pty Ltd when the Group increased its shareholding from 49% to 50% and 49% to 55% respectively.
(b) Pursuant to the Share Purchase Agreements, some of the consideration will be settled based on future years’ actual financial performance and thus was recognised as deferred consideration by the Group. The deferred consideration is estimated based on a multiple of forecast revenue and/or earnings. Any variations at the time of settlement will be recognised as an expense or income in the statement of profit or loss and other comprehensive income. The deferred consideration shown above represents:
- $6.498 million of deferred consideration for which the maximum amount of payment is not capped; and
- $1.403 million of deferred consideration which is fixed.
(c) Some acquisitions made through existing subsidiaries of the Group have been partially completed on a scrip for scrip basis (using the subsidiaries’ scrip).
b. Identifiable assets and liabilities acquired
(1) Includes cash held on trust
(2) The trade receivables comprise contractual amounts and are expected to be fully recoverable.
If new information obtained within one year from the acquisition date about facts and circumstances that existed at the acquisition date identifies adjustments to the above amounts, then the acquisition accounting will be revised.
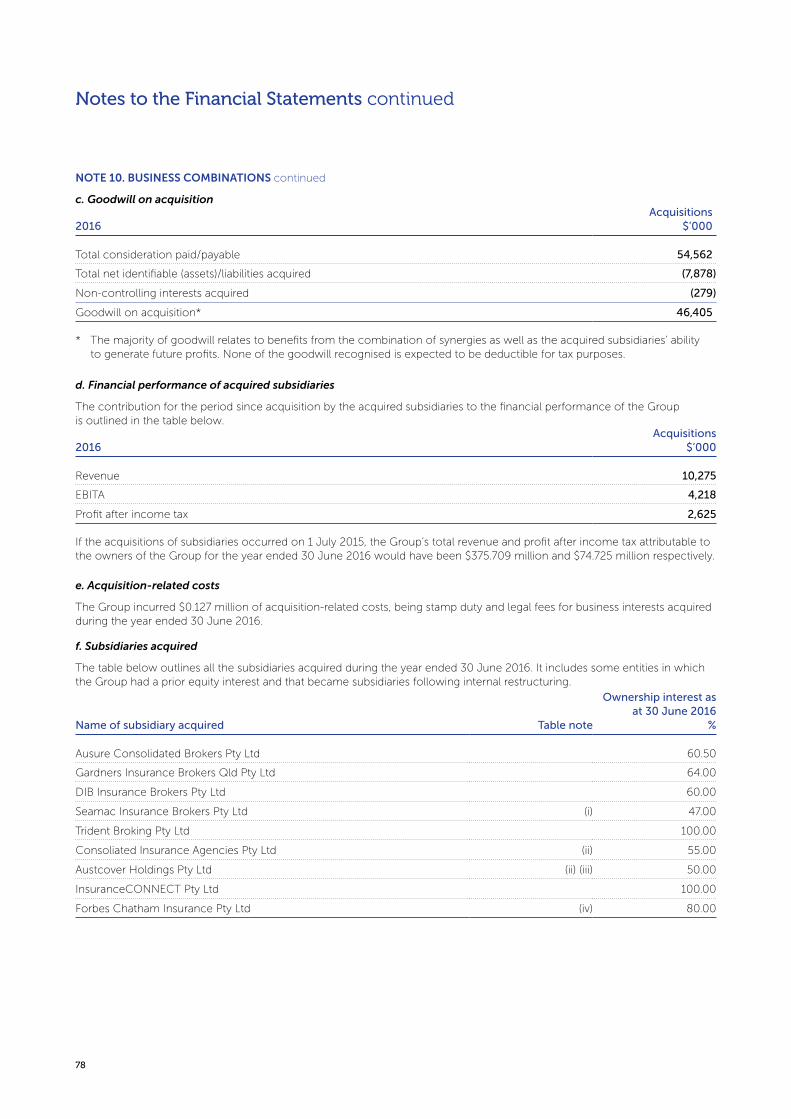
78
Notes to the Financial Statements continued
NOTE 10. BUSINESS COMBINATIONS continued
c. Goodwill on acquisition
2016Acquisitions
$’000
Total consideration paid/payable 54,562
Total net identifiable (assets)/liabilities acquired (7,878)
Non-controlling interests acquired (279)
Goodwill on acquisition* 46,405
Name of subsidiary acquired Table note
Ownership interest as at 30 June 2016
%
Ausure Consolidated Brokers Pty Ltd 60.50
Gardners Insurance Brokers Qld Pty Ltd 64.00
DIB Insurance Brokers Pty Ltd 60.00
Seamac Insurance Brokers Pty Ltd (i) 47.00
Trident Broking Pty Ltd 100.00
Consoliated Insurance Agencies Pty Ltd (ii) 55.00
Austcover Holdings Pty Ltd (ii) (iii) 50.00
InsuranceCONNECT Pty Ltd 100.00
Forbes Chatham Insurance Pty Ltd (iv) 80.00
2016Acquisitions
$’000
Revenue 10,275
EBITA 4,218
Profit after income tax 2,625
* The majority of goodwill relates to benefits from the combination of synergies as well as the acquired subsidiaries’ ability to generate future profits. None of the goodwill recognised is expected to be deductible for tax purposes.
d. Financial performance of acquired subsidiaries
The contribution for the period since acquisition by the acquired subsidiaries to the financial performance of the Group is outlined in the table below.
If the acquisitions of subsidiaries occurred on 1 July 2015, the Group’s total revenue and profit after income tax attributable to the owners of the Group for the year ended 30 June 2016 would have been $375.709 million and $74.725 million respectively.
e. Acquisition-related costs
The Group incurred $0.127 million of acquisition-related costs, being stamp duty and legal fees for business interests acquired during the year ended 30 June 2016.
f. Subsidiaries acquired
The table below outlines all the subsidiaries acquired during the year ended 30 June 2016. It includes some entities in which the Group had a prior equity interest and that became subsidiaries following internal restructuring.
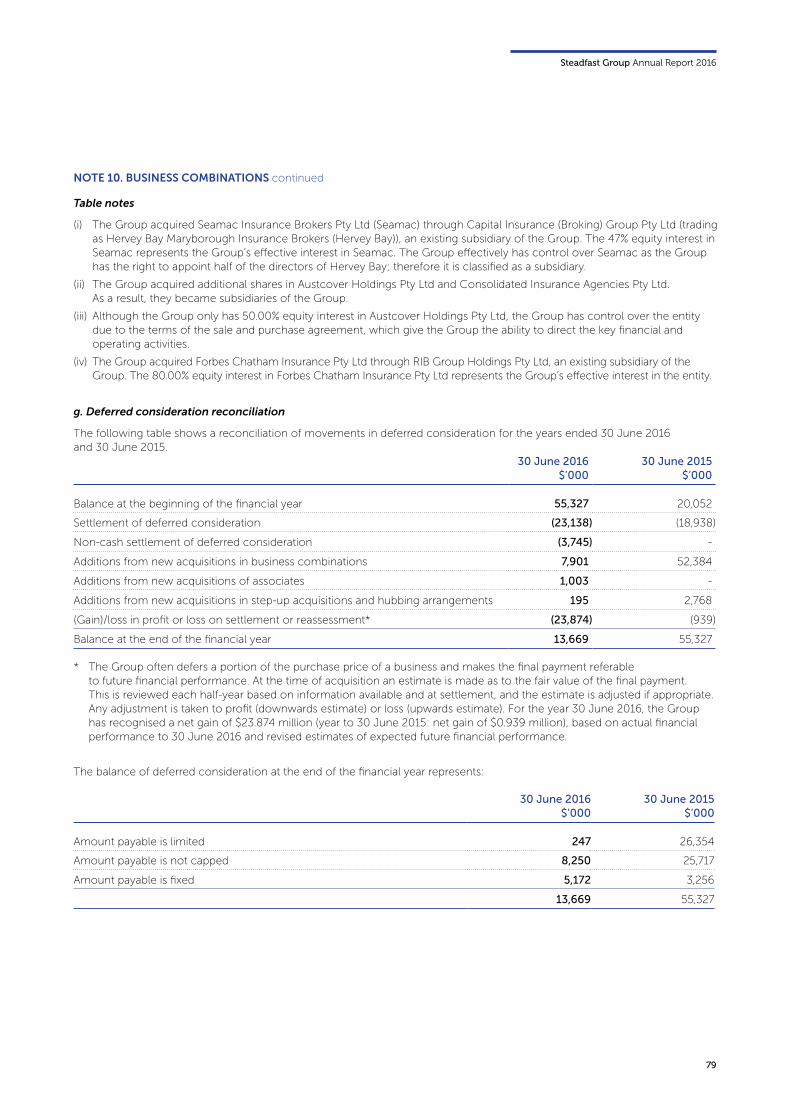
Steadfast Group Annual Report 2016
79
30 June 2016$’000
30 June 2015$’000
Balance at the beginning of the financial year 55,327 20,052
Settlement of deferred consideration (23,138) (18,938)
Non-cash settlement of deferred consideration (3,745) -
Additions from new acquisitions in business combinations 7,901 52,384
Additions from new acquisitions of associates 1,003 -
Additions from new acquisitions in step-up acquisitions and hubbing arrangements 195 2,768
(Gain)/loss in profit or loss on settlement or reassessment* (23,874) (939)
Balance at the end of the financial year 13,669 55,327
30 June 2016$’000
30 June 2015$’000
Amount payable is limited 247 26,354
Amount payable is not capped 8,250 25,717
Amount payable is fixed 5,172 3,256
13,669 55,327
NOTE 10. BUSINESS COMBINATIONS continued
Table notes
(i) The Group acquired Seamac Insurance Brokers Pty Ltd (Seamac) through Capital Insurance (Broking) Group Pty Ltd (trading as Hervey Bay Maryborough Insurance Brokers (Hervey Bay)), an existing subsidiary of the Group. The 47% equity interest in Seamac represents the Group’s effective interest in Seamac. The Group effectively has control over Seamac as the Group has the right to appoint half of the directors of Hervey Bay; therefore it is classified as a subsidiary.
(ii) The Group acquired additional shares in Austcover Holdings Pty Ltd and Consolidated Insurance Agencies Pty Ltd. As a result, they became subsidiaries of the Group.
(iii) Although the Group only has 50.00% equity interest in Austcover Holdings Pty Ltd, the Group has control over the entity due to the terms of the sale and purchase agreement, which give the Group the ability to direct the key financial and operating activities.
(iv) The Group acquired Forbes Chatham Insurance Pty Ltd through RIB Group Holdings Pty Ltd, an existing subsidiary of the Group. The 80.00% equity interest in Forbes Chatham Insurance Pty Ltd represents the Group’s effective interest in the entity.
g. Deferred consideration reconciliation
The following table shows a reconciliation of movements in deferred consideration for the years ended 30 June 2016 and 30 June 2015.
* The Group often defers a portion of the purchase price of a business and makes the final payment referable to future financial performance. At the time of acquisition an estimate is made as to the fair value of the final payment. This is reviewed each half-year based on information available and at settlement, and the estimate is adjusted if appropriate. Any adjustment is taken to profit (downwards estimate) or loss (upwards estimate). For the year 30 June 2016, the Group has recognised a net gain of $23.874 million (year to 30 June 2015: net gain of $0.939 million), based on actual financial performance to 30 June 2016 and revised estimates of expected future financial performance.
The balance of deferred consideration at the end of the financial year represents:
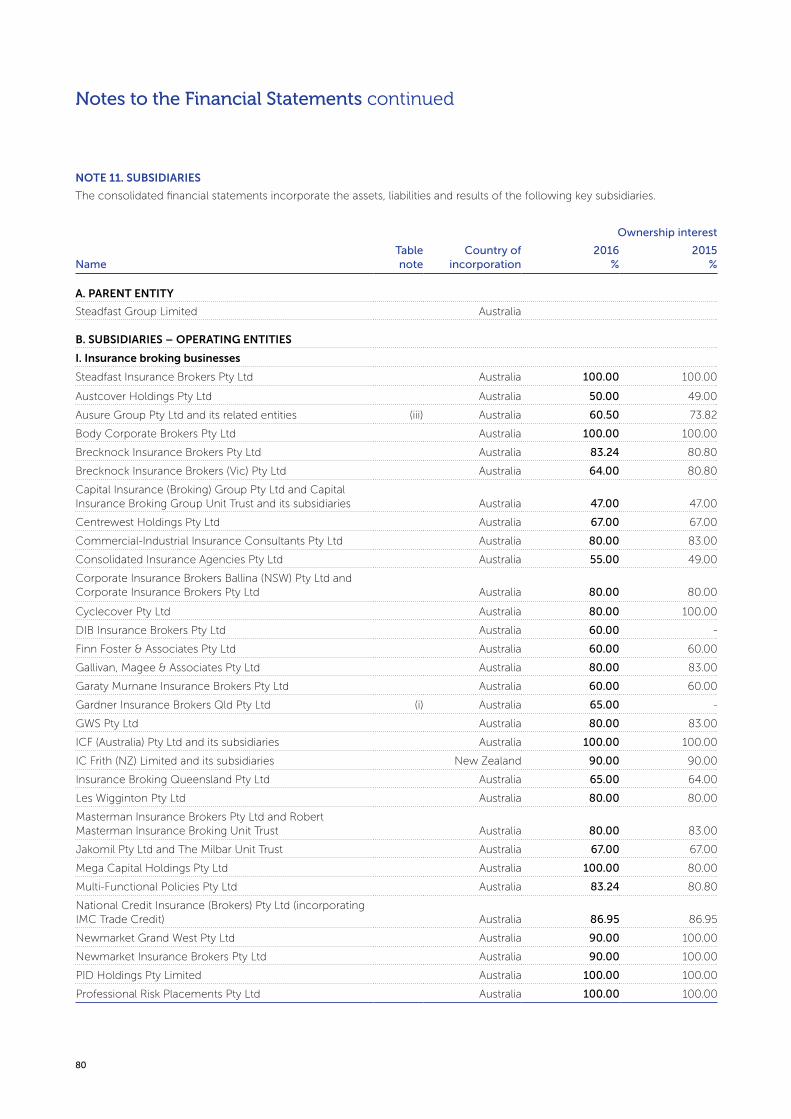
80
Notes to the Financial Statements continued
NOTE 11. SUBSIDIARIES
The consolidated financial statements incorporate the assets, liabilities and results of the following key subsidiaries.
Ownership interest
NameTable note
Country of incorporation
2016%
2015%
A. PARENT ENTITY
Steadfast Group Limited Australia
B. SUBSIDIARIES – OPERATING ENTITIES
I. Insurance broking businesses
Steadfast Insurance Brokers Pty Ltd Australia 100.00 100.00
Austcover Holdings Pty Ltd Australia 50.00 49.00
Ausure Group Pty Ltd and its related entities (iii) Australia 60.50 73.82
Body Corporate Brokers Pty Ltd Australia 100.00 100.00
Brecknock Insurance Brokers Pty Ltd Australia 83.24 80.80
Brecknock Insurance Brokers (Vic) Pty Ltd Australia 64.00 80.80
Capital Insurance (Broking) Group Pty Ltd and Capital Insurance Broking Group Unit Trust and its subsidiaries Australia 47.00 47.00
Centrewest Holdings Pty Ltd Australia 67.00 67.00
Commercial-Industrial Insurance Consultants Pty Ltd Australia 80.00 83.00
Consolidated Insurance Agencies Pty Ltd Australia 55.00 49.00
Corporate Insurance Brokers Ballina (NSW) Pty Ltd and Corporate Insurance Brokers Pty Ltd Australia 80.00 80.00
Cyclecover Pty Ltd Australia 80.00 100.00
DIB Insurance Brokers Pty Ltd Australia 60.00 -
Finn Foster & Associates Pty Ltd Australia 60.00 60.00
Gallivan, Magee & Associates Pty Ltd Australia 80.00 83.00
Garaty Murnane Insurance Brokers Pty Ltd Australia 60.00 60.00
Gardner Insurance Brokers Qld Pty Ltd (i) Australia 65.00 -
GWS Pty Ltd Australia 80.00 83.00
ICF (Australia) Pty Ltd and its subsidiaries Australia 100.00 100.00
IC Frith (NZ) Limited and its subsidiaries New Zealand 90.00 90.00
Insurance Broking Queensland Pty Ltd Australia 65.00 64.00
Les Wigginton Pty Ltd Australia 80.00 80.00
Masterman Insurance Brokers Pty Ltd and Robert Masterman Insurance Broking Unit Trust Australia 80.00 83.00
Jakomil Pty Ltd and The Milbar Unit Trust Australia 67.00 67.00
Mega Capital Holdings Pty Ltd Australia 100.00 80.00
Multi-Functional Policies Pty Ltd Australia 83.24 80.80
National Credit Insurance (Brokers) Pty Ltd (incorporating IMC Trade Credit) Australia 86.95 86.95
Newmarket Grand West Pty Ltd Australia 90.00 100.00
Newmarket Insurance Brokers Pty Ltd Australia 90.00 100.00
PID Holdings Pty Limited Australia 100.00 100.00
Professional Risk Placements Pty Ltd Australia 100.00 100.00

Steadfast Group Annual Report 2016
81
NOTE 11. SUBSIDIARIES continued
Ownership interest
NameTable note
Country of incorporation
2016%
2015%
Queensland Insurance Brokers Pty Ltd and QIS Financial Services Pty Ltd Australia 80.00 80.00
RIB Group Holdings Pty Limited and its subsidiaries (RIB Group) Australia 80.00 80.00
RSM Financial Services Pty Ltd Australia 100.00 100.00
Sawtell & Salisbury Pty Ltd and Sawtell & Salisbury Unit Trust Australia 65.00 64.00
Steadfast IRS Pty Limited Australia 100.00 100.00
Steadfast NZ Holdings Limited New Zealand 100.00 100.00
Steadfast NZ Limited New Zealand 100.00 100.00
Steadfast Re Pty Ltd (iv) Australia 50.00 50.00
Steadfast Taswide Insurance Brokers Pty Ltd Australia 73.21 70.70
Trident Broking Pty Ltd Australia 100.00 -
VBIH Pty Ltd Australia 80.00 -
V.F.P. Insurance Brokers Pty Limited Australia 80.00 80.80
Waveline Investments Pty Ltd Australia 67.00 67.00
Webmere Pty Ltd (i) Australia 65.00 64.00
Work Health Alternatives Pty Ltd Australia 70.00 -
II. Underwriting agency businesses
Steadfast Underwriting Agencies Holdings Pty Ltd Australia 100.00 100.00
SUA Services Pty Ltd Australia 100.00 100.00
Associated Marine Underwriting Agency Pty Limited Australia 100.00 100.00
CAIP Services Pty Ltd Australia 70.00 70.00
Calliden Group Pty Ltd and its subsidiaries Australia 100.00 100.00
CHU Underwriting Agencies Pty Ltd Australia 100.00 100.00
Grange Underwriting Pty Ltd Australia 65.00 64.00
Hostsure Underwriting Agency Pty Ltd Australia 100.00 100.00
Miramar Underwriting Agency Pty Limited Australia 100.00 100.00
NM Insurance Pty Ltd Australia 75.00 70.00
Procover Underwriting Agency Pty Ltd Australia 100.00 100.00
Protecsure Pty Limited Australia 80.00 90.00
Residential Builders Underwriting Agency Pty Ltd Australia 100.00 100.00
Sports Underwriting Australia Pty Ltd Australia 80.00 80.00
Steadfast Placement Solutions Pty Ltd Australia 100.00 100.00
Underwriting Agencies of Australia Pty Ltd (ii) Australia 90.00 100.00
Winsure Underwriting Pty Limited Australia 100.00 100.00
WM Amalgamated Pty Ltd Australia 85.00 86.00
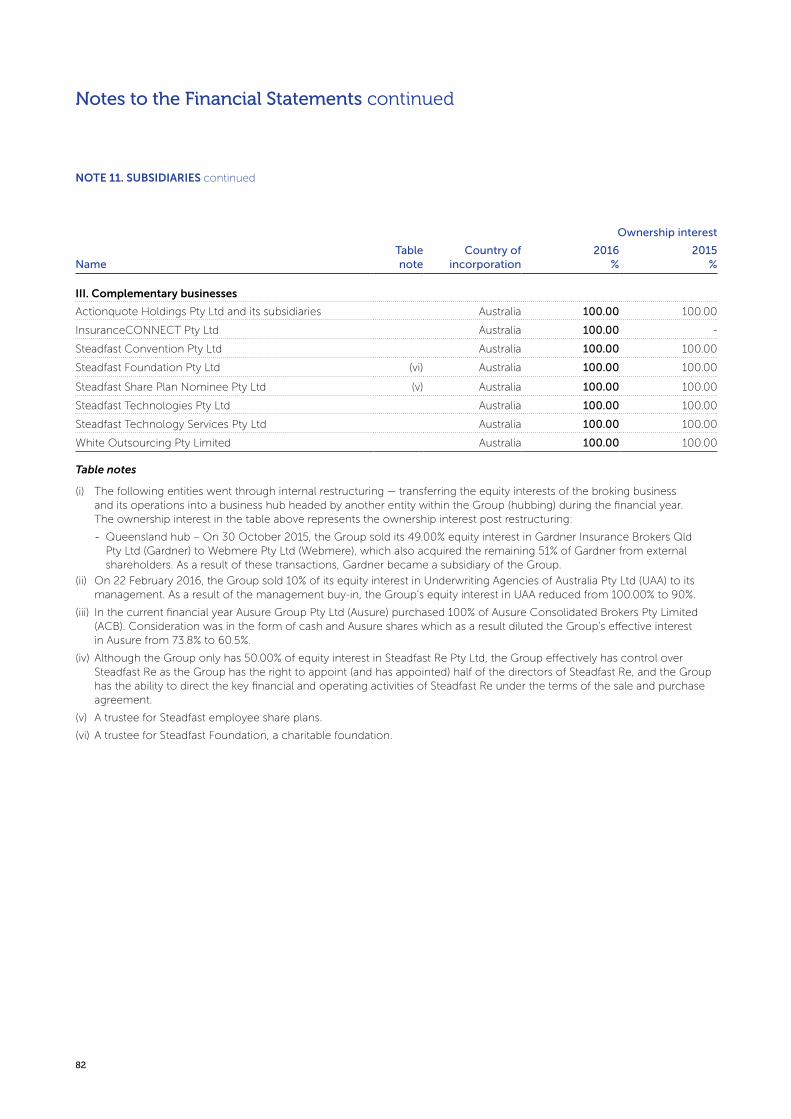
82
Notes to the Financial Statements continued
NOTE 11. SUBSIDIARIES continued
Ownership interest
NameTable note
Country of incorporation
2016%
2015%
III. Complementary businesses
Actionquote Holdings Pty Ltd and its subsidiaries Australia 100.00 100.00
InsuranceCONNECT Pty Ltd Australia 100.00 -
Steadfast Convention Pty Ltd Australia 100.00 100.00
Steadfast Foundation Pty Ltd (vi) Australia 100.00 100.00
Steadfast Share Plan Nominee Pty Ltd (v) Australia 100.00 100.00
Steadfast Technologies Pty Ltd Australia 100.00 100.00
Steadfast Technology Services Pty Ltd Australia 100.00 100.00
White Outsourcing Pty Limited Australia 100.00 100.00
Table notes
(i) The following entities went through internal restructuring — transferring the equity interests of the broking business and its operations into a business hub headed by another entity within the Group (hubbing) during the financial year. The ownership interest in the table above represents the ownership interest post restructuring:
- Queensland hub – On 30 October 2015, the Group sold its 49.00% equity interest in Gardner Insurance Brokers Qld Pty Ltd (Gardner) to Webmere Pty Ltd (Webmere), which also acquired the remaining 51% of Gardner from external shareholders. As a result of these transactions, Gardner became a subsidiary of the Group.
(ii) On 22 February 2016, the Group sold 10% of its equity interest in Underwriting Agencies of Australia Pty Ltd (UAA) to its management. As a result of the management buy-in, the Group’s equity interest in UAA reduced from 100.00% to 90%.
(iii) In the current financial year Ausure Group Pty Ltd (Ausure) purchased 100% of Ausure Consolidated Brokers Pty Limited (ACB). Consideration was in the form of cash and Ausure shares which as a result diluted the Group's effective interest in Ausure from 73.8% to 60.5%.
(iv) Although the Group only has 50.00% of equity interest in Steadfast Re Pty Ltd, the Group effectively has control over Steadfast Re as the Group has the right to appoint (and has appointed) half of the directors of Steadfast Re, and the Group has the ability to direct the key financial and operating activities of Steadfast Re under the terms of the sale and purchase agreement.
(v) A trustee for Steadfast employee share plans.
(vi) A trustee for Steadfast Foundation, a charitable foundation.

Steadfast Group Annual Report 2016
83
NOTE 12. INVESTMENTS IN ASSOCIATES
A. DETAILS OF ASSOCIATES
Interests in associates are accounted for using the equity method of accounting. Information relating to key associates is set out below.
Ownership interest Equity-accounted
Name2016
%2015
%2016
$’0002015
$’000
I. Insurance broking businesses
Armbro Insurance Brokers Pty Ltd 40.00 40.00 1,536 1,572
Armstrong's Insurance Brokers Pty Ltd and Armstrong's Insurance Brokers Unit Trust 25.00 25.00 832 798
Ausure Group Pty Ltd – associates thereof 27.02 23.99 3,577 1,124
Austcover Holdings Pty Ltd - 49.00 - 12,800
Blackburn (Insurance Brokers) Pty Ltd and Liability Brokers Pty Ltd 49.00 49.00 3,607 3,490
Consolidated Insurance Agencies Pty Ltd - 49.00 - 3,734
Covercorp Pty Ltd 49.00 49.00 1,158 1,174
Edgewise Insurance Brokers Pty Ltd and The Bradstock GIS Unit Trust 25.00 25.00 2,126 2,066
Empire Insurance Services Pty Ltd and McLardy McShane & Associates Pty Ltd 37.00 37.00 3,739 3,657
Finpac Insurance Advisors Pty Ltd 49.00 49.00 1,078 1,109
Gardner Insurance Brokers Qld Pty Ltd(a) - 49.00 - 1,367
Glenowar Pty Ltd 49.00 49.00 4,276 4,289
IPS Insurance Brokers Pty Ltd 40.00 40.00 3,100 3,243
J.D.I (YOUNG) Pty Limited 25.00 25.00 821 774
Johansen Insurance Brokers Pty Ltd 48.00 48.00 4,677 4,724
King Insurance Brokers Pty Ltd 37.00 37.00 - -
Lanyon Partners Consolidated Pty Ltd 45.00 45.00 4,908 5,053
McKillop Insurance Brokers Pty Ltd 49.00 49.00 4,845 4,979
Melbourne Insurance Brokers Pty Ltd 49.00 49.00 1,545 1,564
NCA Insurance Services Pty Ltd 49.00 49.00 3,550 3,471
Optimus 1 Pty Ltd 25.00 25.00 584 596
Paramount Insurance Brokers Pty Ltd 25.00 25.00 1,470 1,004
Phoenix Insurance Brokers Pty Ltd 46.00 46.00 4,851 5,046
Pollard Advisory Services Pty Ltd 49.00 49.00 4,714 4,700
QUS Pty Ltd 46.50 46.50 1,103 934
Risk Partners Pty Ltd 45.00 - 7,503 -
Rose Stanton Insurance Brokers Pty Limited 49.00 49.00 680 760
Rothbury Group Limited(b) 44.44 30.00 22,857 14,774
RSM Group Limited 49.00 49.00 5,953 6,071
Sapphire Star Pty Ltd 30.00 30.00 1,318 1,433
Scott & Broad Pty Ltd 42.88 49.00 8,242 8,971
Southside Insurance Brokers Pty Limited 49.00 49.00 660 662
Steadfast Life Pty Ltd 50.00 50.00 3,018 2,957
Tudor Insurance Australia (Insurance Brokers) Pty Ltd and Tudor Insurance Agency Unit Trust 48.00 48.00 2,002 2,050
Watkins Taylor Stone Insurance Brokers Pty Limited and D&E Watkins Unit Trust 35.00 35.00 1,824 1,860
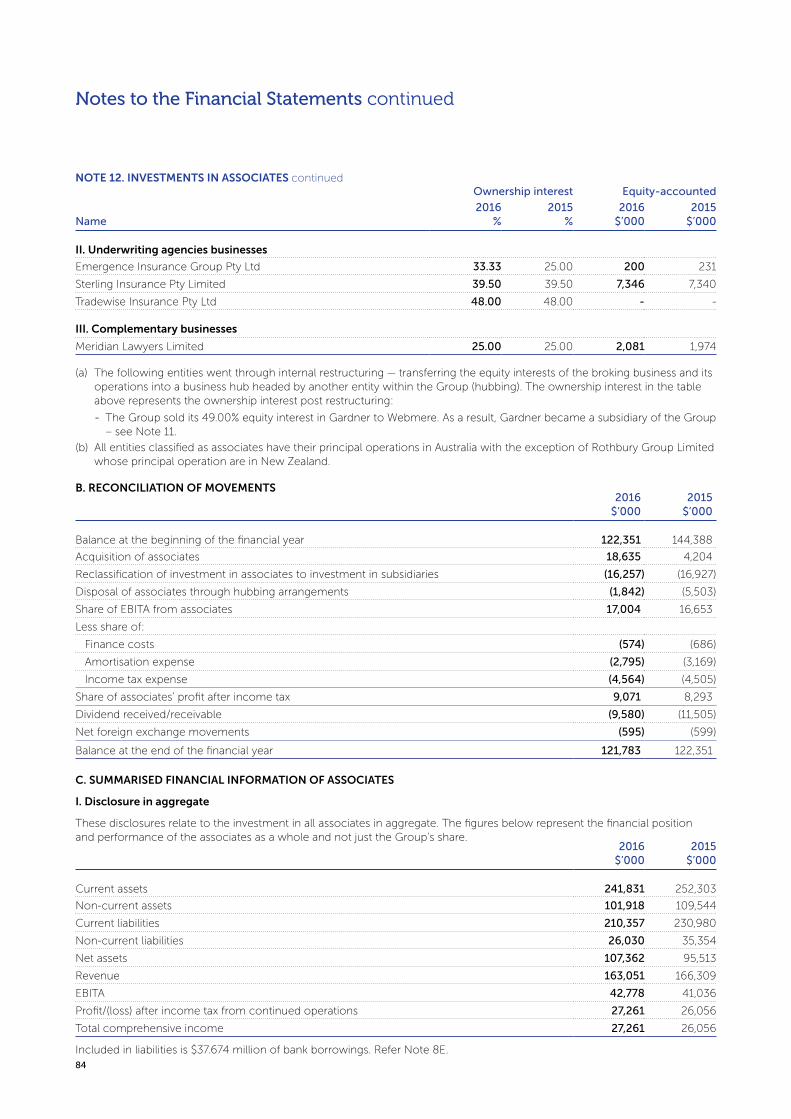
84
Ownership interest Equity-accounted
Name2016
%2015
%2016
$’0002015
$’000
II. Underwriting agencies businesses
Emergence Insurance Group Pty Ltd 33.33 25.00 200 231
Sterling Insurance Pty Limited 39.50 39.50 7,346 7,340
Tradewise Insurance Pty Ltd 48.00 48.00 - -
III. Complementary businesses
Meridian Lawyers Limited 25.00 25.00 2,081 1,974
NOTE 12. INVESTMENTS IN ASSOCIATES continued
2016$’000
2015$’000
Balance at the beginning of the financial year 122,351 144,388
Acquisition of associates 18,635 4,204
Reclassification of investment in associates to investment in subsidiaries (16,257) (16,927)
Disposal of associates through hubbing arrangements (1,842) (5,503)
Share of EBITA from associates 17,004 16,653
Less share of:
Finance costs (574) (686)
Amortisation expense (2,795) (3,169)
Income tax expense (4,564) (4,505)
Share of associates’ profit after income tax 9,071 8,293
Dividend received/receivable (9,580) (11,505)
Net foreign exchange movements (595) (599)
Balance at the end of the financial year 121,783 122,351
2016$’000
2015$’000
Current assets 241,831 252,303
Non-current assets 101,918 109,544
Current liabilities 210,357 230,980
Non-current liabilities 26,030 35,354
Net assets 107,362 95,513
Revenue 163,051 166,309
EBITA 42,778 41,036
Profit/(loss) after income tax from continued operations 27,261 26,056
Total comprehensive income 27,261 26,056
(a) The following entities went through internal restructuring — transferring the equity interests of the broking business and its operations into a business hub headed by another entity within the Group (hubbing). The ownership interest in the table above represents the ownership interest post restructuring:
- The Group sold its 49.00% equity interest in Gardner to Webmere. As a result, Gardner became a subsidiary of the Group – see Note 11.
(b) All entities classified as associates have their principal operations in Australia with the exception of Rothbury Group Limited whose principal operation are in New Zealand.
B. RECONCILIATION OF MOVEMENTS
C. SUMMARISED FINANCIAL INFORMATION OF ASSOCIATES
I. Disclosure in aggregate
These disclosures relate to the investment in all associates in aggregate. The figures below represent the financial position and performance of the associates as a whole and not just the Group’s share.
Included in liabilities is $37.674 million of bank borrowings. Refer Note 8E.
Notes to the Financial Statements continued
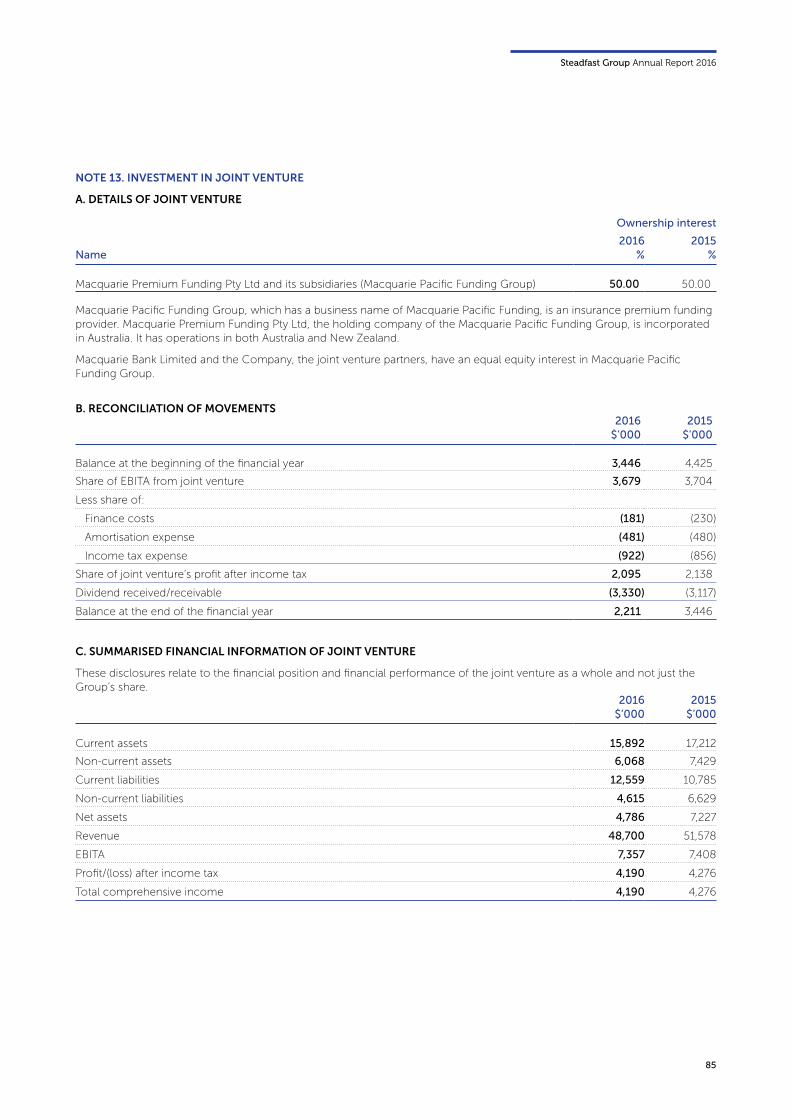
Steadfast Group Annual Report 2016
85
2016$’000
2015$’000
Balance at the beginning of the financial year 3,446 4,425
Share of EBITA from joint venture 3,679 3,704
Less share of:
Finance costs (181) (230)
Amortisation expense (481) (480)
Income tax expense (922) (856)
Share of joint venture’s profit after income tax 2,095 2,138
Dividend received/receivable (3,330) (3,117)
Balance at the end of the financial year 2,211 3,446
2016$’000
2015$’000
Current assets 15,892 17,212
Non-current assets 6,068 7,429
Current liabilities 12,559 10,785
Non-current liabilities 4,615 6,629
Net assets 4,786 7,227
Revenue 48,700 51,578
EBITA 7,357 7,408
Profit/(loss) after income tax 4,190 4,276
Total comprehensive income 4,190 4,276
Ownership interest
Name2016
%2015
%
Macquarie Premium Funding Pty Ltd and its subsidiaries (Macquarie Pacific Funding Group) 50.00 50.00
B. RECONCILIATION OF MOVEMENTS
C. SUMMARISED FINANCIAL INFORMATION OF JOINT VENTURE
These disclosures relate to the financial position and financial performance of the joint venture as a whole and not just the Group’s share.
NOTE 13. INVESTMENT IN JOINT VENTURE
A. DETAILS OF JOINT VENTURE
Macquarie Pacific Funding Group, which has a business name of Macquarie Pacific Funding, is an insurance premium funding provider. Macquarie Premium Funding Pty Ltd, the holding company of the Macquarie Pacific Funding Group, is incorporated in Australia. It has operations in both Australia and New Zealand.
Macquarie Bank Limited and the Company, the joint venture partners, have an equal equity interest in Macquarie Pacific Funding Group.
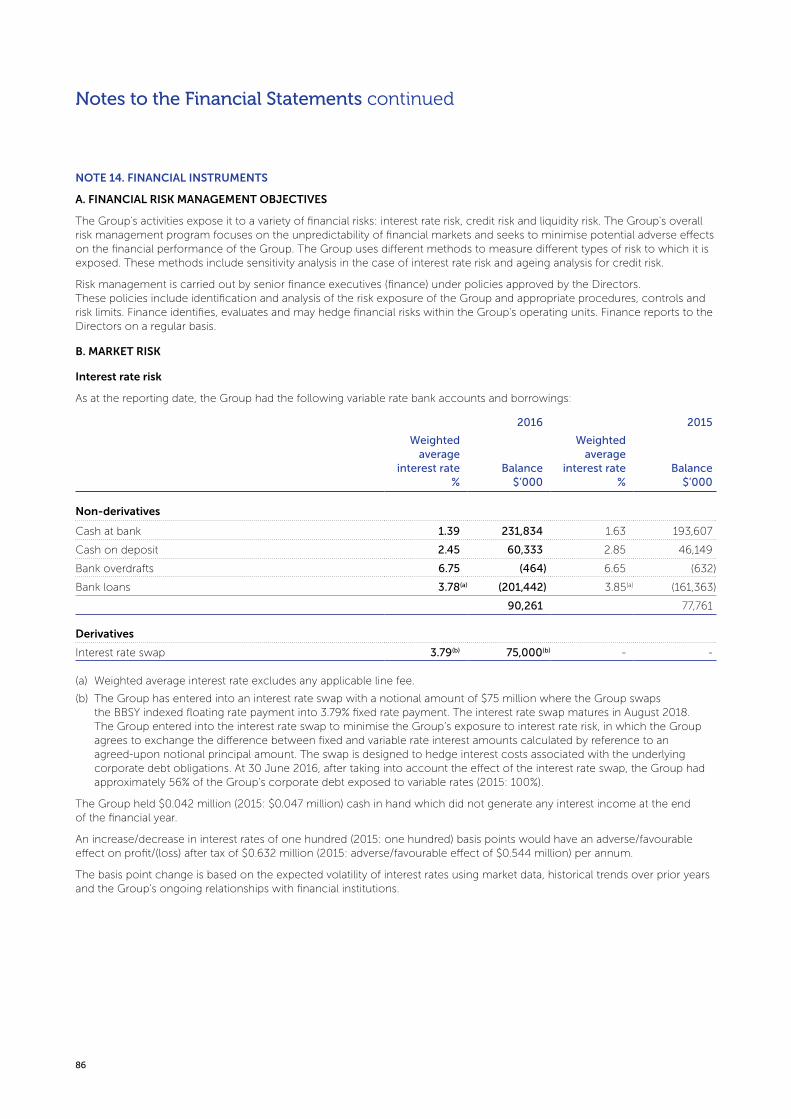
86
NOTE 14. FINANCIAL INSTRUMENTS
A. FINANCIAL RISK MANAGEMENT OBJECTIVES
The Group's activities expose it to a variety of financial risks: interest rate risk, credit risk and liquidity risk. The Group's overall risk management program focuses on the unpredictability of financial markets and seeks to minimise potential adverse effects on the financial performance of the Group. The Group uses different methods to measure different types of risk to which it is exposed. These methods include sensitivity analysis in the case of interest rate risk and ageing analysis for credit risk.
Risk management is carried out by senior finance executives (finance) under policies approved by the Directors. These policies include identification and analysis of the risk exposure of the Group and appropriate procedures, controls and risk limits. Finance identifies, evaluates and may hedge financial risks within the Group's operating units. Finance reports to the Directors on a regular basis.
B. MARKET RISK
Interest rate risk
As at the reporting date, the Group had the following variable rate bank accounts and borrowings:
Notes to the Financial Statements continued
2016 2015
Weighted average
interest rate %
Balance$’000
Weighted average
interest rate %
Balance$’000
Non-derivatives
Cash at bank 1.39 231,834 1.63 193,607
Cash on deposit 2.45 60,333 2.85 46,149
Bank overdrafts 6.75 (464) 6.65 (632)
Bank loans 3.78(a) (201,442) 3.85(a) (161,363)
90,261 77,761
Derivatives
Interest rate swap 3.79(b) 75,000(b) - -
(a) Weighted average interest rate excludes any applicable line fee.
(b) The Group has entered into an interest rate swap with a notional amount of $75 million where the Group swaps the BBSY indexed floating rate payment into 3.79% fixed rate payment. The interest rate swap matures in August 2018. The Group entered into the interest rate swap to minimise the Group’s exposure to interest rate risk, in which the Group agrees to exchange the difference between fixed and variable rate interest amounts calculated by reference to an agreed-upon notional principal amount. The swap is designed to hedge interest costs associated with the underlying corporate debt obligations. At 30 June 2016, after taking into account the effect of the interest rate swap, the Group had approximately 56% of the Group’s corporate debt exposed to variable rates (2015: 100%).
The Group held $0.042 million (2015: $0.047 million) cash in hand which did not generate any interest income at the end of the financial year.
An increase/decrease in interest rates of one hundred (2015: one hundred) basis points would have an adverse/favourable effect on profit/(loss) after tax of $0.632 million (2015: adverse/favourable effect of $0.544 million) per annum.
The basis point change is based on the expected volatility of interest rates using market data, historical trends over prior years and the Group's ongoing relationships with financial institutions.
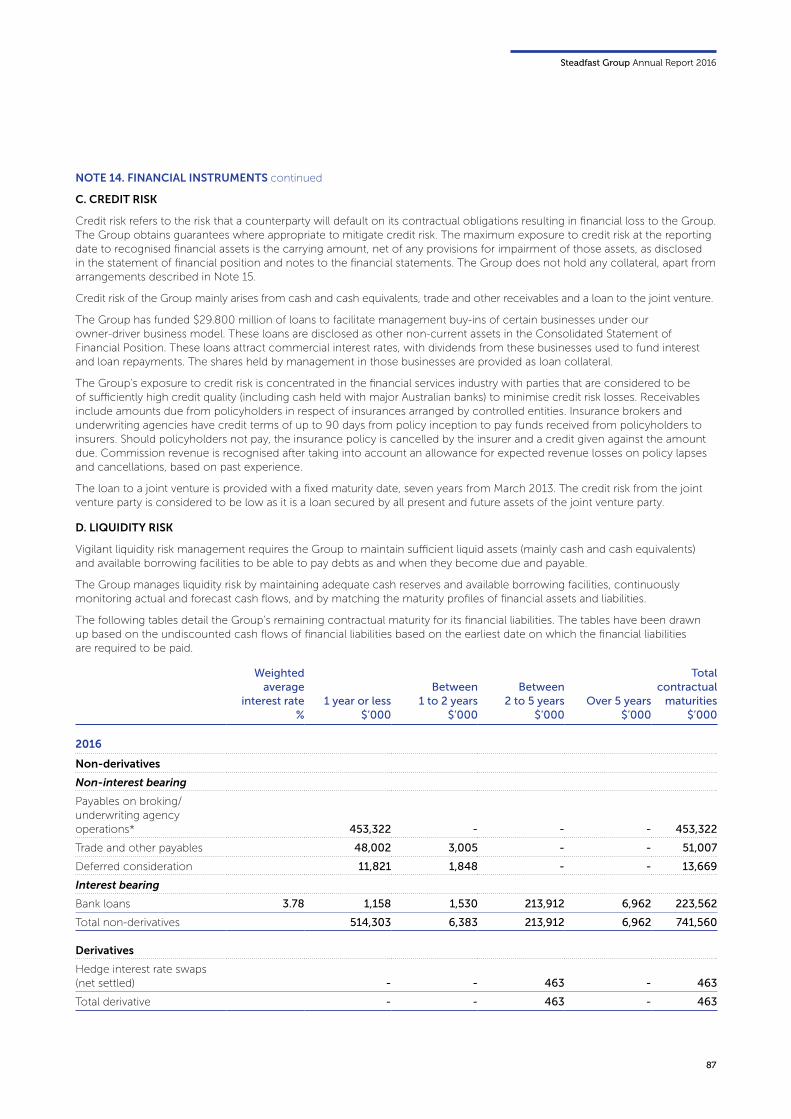
Steadfast Group Annual Report 2016
87
NOTE 14. FINANCIAL INSTRUMENTS continued
C. CREDIT RISK
Credit risk refers to the risk that a counterparty will default on its contractual obligations resulting in financial loss to the Group. The Group obtains guarantees where appropriate to mitigate credit risk. The maximum exposure to credit risk at the reporting date to recognised financial assets is the carrying amount, net of any provisions for impairment of those assets, as disclosed in the statement of financial position and notes to the financial statements. The Group does not hold any collateral, apart from arrangements described in Note 15.
Credit risk of the Group mainly arises from cash and cash equivalents, trade and other receivables and a loan to the joint venture.
The Group has funded $29.800 million of loans to facilitate management buy-ins of certain businesses under our owner-driver business model. These loans are disclosed as other non-current assets in the Consolidated Statement of Financial Position. These loans attract commercial interest rates, with dividends from these businesses used to fund interest and loan repayments. The shares held by management in those businesses are provided as loan collateral.
The Group’s exposure to credit risk is concentrated in the financial services industry with parties that are considered to be of sufficiently high credit quality (including cash held with major Australian banks) to minimise credit risk losses. Receivables include amounts due from policyholders in respect of insurances arranged by controlled entities. Insurance brokers and underwriting agencies have credit terms of up to 90 days from policy inception to pay funds received from policyholders to insurers. Should policyholders not pay, the insurance policy is cancelled by the insurer and a credit given against the amount due. Commission revenue is recognised after taking into account an allowance for expected revenue losses on policy lapses and cancellations, based on past experience.
The loan to a joint venture is provided with a fixed maturity date, seven years from March 2013. The credit risk from the joint venture party is considered to be low as it is a loan secured by all present and future assets of the joint venture party.
D. LIQUIDITY RISK
Vigilant liquidity risk management requires the Group to maintain sufficient liquid assets (mainly cash and cash equivalents) and available borrowing facilities to be able to pay debts as and when they become due and payable.
The Group manages liquidity risk by maintaining adequate cash reserves and available borrowing facilities, continuously monitoring actual and forecast cash flows, and by matching the maturity profiles of financial assets and liabilities.
The following tables detail the Group’s remaining contractual maturity for its financial liabilities. The tables have been drawn up based on the undiscounted cash flows of financial liabilities based on the earliest date on which the financial liabilities are required to be paid.
Weighted average
interest rate %
1 year or less$’000
Between 1 to 2 years
$’000
Between 2 to 5 years
$’000Over 5 years
$’000
Total contractual
maturities$’000
2016
Non-derivatives
Non-interest bearing
Payables on broking/underwriting agency operations* 453,322 - - - 453,322
Trade and other payables 48,002 3,005 - - 51,007
Deferred consideration 11,821 1,848 - - 13,669
Interest bearing
Bank loans 3.78 1,158 1,530 213,912 6,962 223,562
Total non-derivatives 514,303 6,383 213,912 6,962 741,560
Derivatives
Hedge interest rate swaps (net settled) - - 463 - 463
Total derivative - - 463 - 463
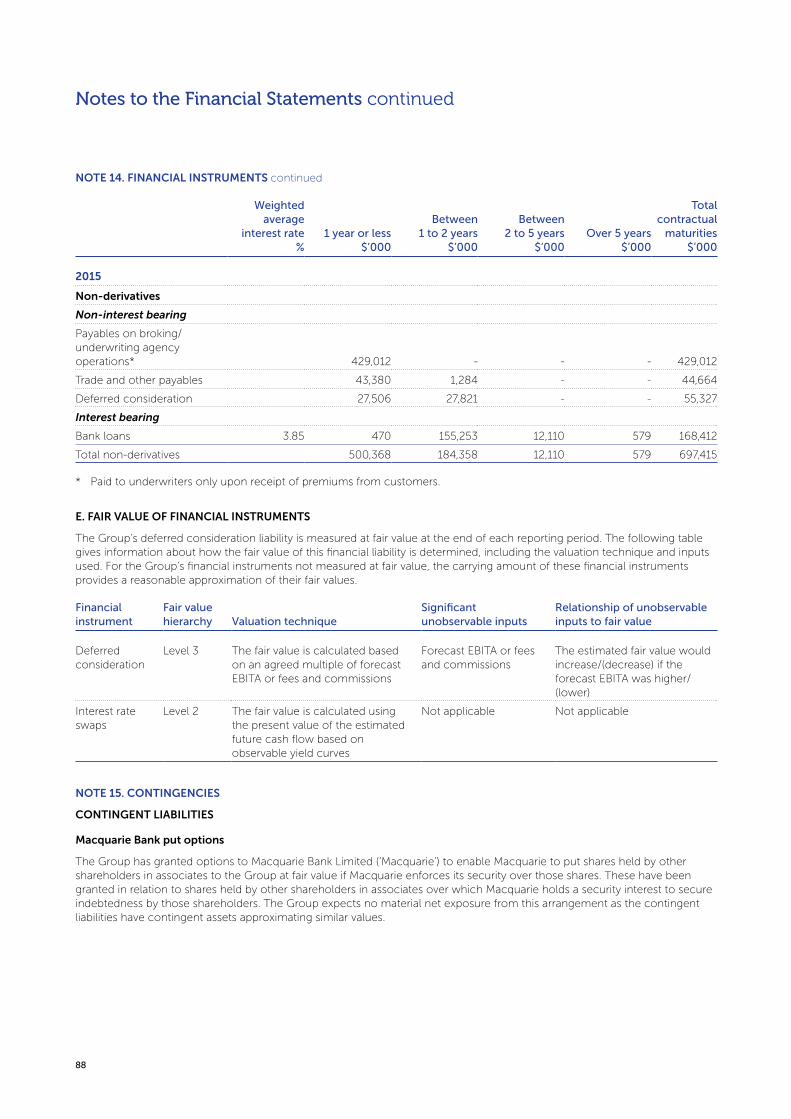
88
Weighted average
interest rate %
1 year or less$’000
Between 1 to 2 years
$’000
Between 2 to 5 years
$’000Over 5 years
$’000
Total contractual
maturities$’000
2015
Non-derivatives
Non-interest bearing
Payables on broking/underwriting agency operations* 429,012 - - - 429,012
Trade and other payables 43,380 1,284 - - 44,664
Deferred consideration 27,506 27,821 - - 55,327
Interest bearing
Bank loans 3.85 470 155,253 12,110 579 168,412
Total non-derivatives 500,368 184,358 12,110 579 697,415
Financial instrument
Fair value hierarchy Valuation technique
Significant unobservable inputs
Relationship of unobservable inputs to fair value
Deferred consideration
Level 3 The fair value is calculated based on an agreed multiple of forecast EBITA or fees and commissions
Forecast EBITA or fees and commissions
The estimated fair value would increase/(decrease) if the forecast EBITA was higher/(lower)
Interest rate swaps
Level 2 The fair value is calculated using the present value of the estimated future cash flow based on observable yield curves
Not applicable Not applicable
NOTE 14. FINANCIAL INSTRUMENTS continued
Notes to the Financial Statements continued
* Paid to underwriters only upon receipt of premiums from customers.
E. FAIR VALUE OF FINANCIAL INSTRUMENTS
The Group’s deferred consideration liability is measured at fair value at the end of each reporting period. The following table gives information about how the fair value of this financial liability is determined, including the valuation technique and inputs used. For the Group’s financial instruments not measured at fair value, the carrying amount of these financial instruments provides a reasonable approximation of their fair values.
NOTE 15. CONTINGENCIES
CONTINGENT LIABILITIES
Macquarie Bank put options
The Group has granted options to Macquarie Bank Limited (‘Macquarie’) to enable Macquarie to put shares held by other shareholders in associates to the Group at fair value if Macquarie enforces its security over those shares. These have been granted in relation to shares held by other shareholders in associates over which Macquarie holds a security interest to secure indebtedness by those shareholders. The Group expects no material net exposure from this arrangement as the contingent liabilities have contingent assets approximating similar values.
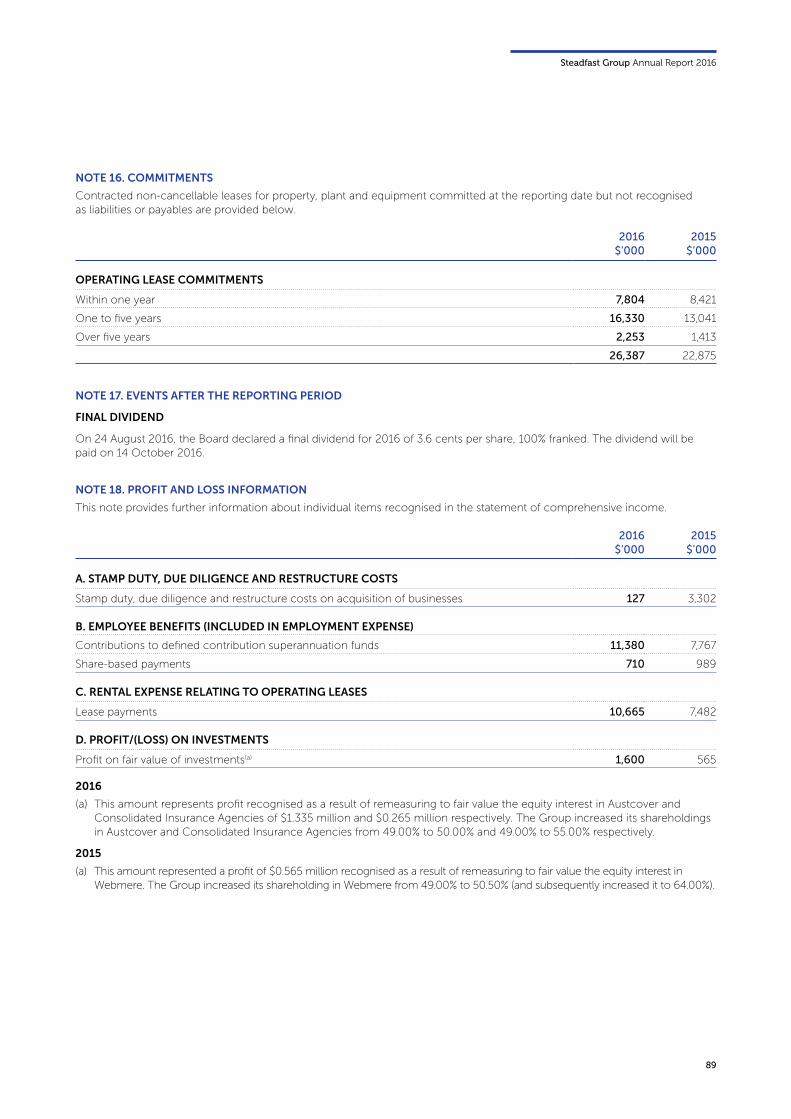
Steadfast Group Annual Report 2016
89
NOTE 16. COMMITMENTS
Contracted non-cancellable leases for property, plant and equipment committed at the reporting date but not recognised as liabilities or payables are provided below.
2016$’000
2015$’000
OPERATING LEASE COMMITMENTS
Within one year 7,804 8,421
One to five years 16,330 13,041
Over five years 2,253 1,413
26,387 22,875
2016$’000
2015$’000
A. STAMP DUTY, DUE DILIGENCE AND RESTRUCTURE COSTS
Stamp duty, due diligence and restructure costs on acquisition of businesses 127 3,302
B. EMPLOYEE BENEFITS (INCLUDED IN EMPLOYMENT EXPENSE)
Contributions to defined contribution superannuation funds 11,380 7,767
Share-based payments 710 989
C. RENTAL EXPENSE RELATING TO OPERATING LEASES
Lease payments 10,665 7,482
D. PROFIT/(LOSS) ON INVESTMENTS
Profit on fair value of investments(a) 1,600 565
NOTE 17. EVENTS AFTER THE REPORTING PERIOD
FINAL DIVIDEND
On 24 August 2016, the Board declared a final dividend for 2016 of 3.6 cents per share, 100% franked. The dividend will be paid on 14 October 2016.
NOTE 18. PROFIT AND LOSS INFORMATION
This note provides further information about individual items recognised in the statement of comprehensive income.
2016
(a) This amount represents profit recognised as a result of remeasuring to fair value the equity interest in Austcover and Consolidated Insurance Agencies of $1.335 million and $0.265 million respectively. The Group increased its shareholdings in Austcover and Consolidated Insurance Agencies from 49.00% to 50.00% and 49.00% to 55.00% respectively.
2015
(a) This amount represented a profit of $0.565 million recognised as a result of remeasuring to fair value the equity interest in Webmere. The Group increased its shareholding in Webmere from 49.00% to 50.50% (and subsequently increased it to 64.00%).
90
Notes to the Financial Statements continued
NOTE 19. SHARE-BASED REMUNERATION
SHARE-BASED PAYMENTS – EMPLOYEE RELATED
Share-based remuneration encourages employee share ownership, links employee reward to the performance of the Group and assists with retention of key personnel.
The Company intends to settle its obligations under share-based payment arrangements by the on-market purchase of the Company’s ordinary shares which will be held in trust. The Group has established a practice of purchasing a tranche of shares on or near grant date at the prevailing market price to facilitate building up a portfolio sufficient to meet the obligations when rights vest.
Trading in the Company’s ordinary shares awarded under the share-based remuneration arrangements is covered by the same restrictions that apply to all forms of share ownership by employees. These restrictions limit an employee trading in the Company’s ordinary shares when they are in a position to be aware, or are aware of price sensitive information.
The Group has the following types of share-based remuneration arrangements provided to employees; each arrangement has different purposes and different rules:
• conditional rights;
• short-term incentive plan; and
• long-term incentive plan.
The share-based payments are included in the employment expense line in the statement of comprehensive income.
I. Senior management and executive share plans
The senior management and executive share plan arrangements are awarded based on the terms and conditions as set out in the short-term and long-term incentive plans. The awards in these two plans when granted may be in the form of cash and/or conditional rights. The Remuneration & Succession Planning Committee has approved the participation of each individual in these arrangements as well as the actual awards based on the performance conditions in these two plans being met.
a. Short-term incentive plan
The STI plan is a discretionary, performance-based, at risk reward arrangement. STI is awarded based on each participant’s performance hurdles and whether the financial performance hurdle of minimum 5% underlying earnings per share growth of the Group are met.
The key terms of the STI plan are:
• total STI will be awarded and settled in the form of cash and conditional rights as approved by the Board if diluted EPS growth targets and individual participant’s performance criteria for the performance period (i.e. 1 July to 30 June) are met. If met:
- 60% of STI will be settled in the form of cash and will be paid annually in September after the performance period; and
- 40% of STI awarded will be deferred and granted in the form of conditional rights;
• conditional rights (rights) are granted for nil consideration;
• the vesting condition of rights is not market related and requires the participant to continue in relevant employment from the grant date of the rights (retention period), split one-third over one, two and three years;
• the rights will accrue notional dividends during the retention period;
• when vesting (after completion of the retention period), each right will be converted into one Steadfast ordinary share per right for nil consideration upon exercise by the participant. The notional dividends will be converted into an equivalent number of Steadfast ordinary shares based on the Dividend Reinvestment Plan issue price applicable to each dividend;
• the Board has discretion to settle the rights in cash instead of Steadfast ordinary shares; and
• if the vesting condition is not met then the rights lapse.
The first STI award was approved by the Board on 25 August 2014. Further details of the 2016 STI in relation to the Group’s key management personnel are disclosed in the Remuneration Report for the current financial year.

Steadfast Group Annual Report 2016
91
NOTE 19. SHARE-BASED REMUNERATION continued
b. Long-term incentive plan
The LTI plan is a discretionary, performance-based, at risk reward arrangement. LTI is awarded based on the Board’s approved percentage of the fixed remuneration for each participant (in the range of 35% to 50% for the financial year ended 30 June 2016).
The key terms of the LTI plan are:
• LTI will be awarded in the form of conditional rights as approved by the Board and will be granted in August following the end of each financial year;
• conditional rights (rights) are granted for nil consideration;
• the vesting condition of rights is not market related and is conditional on meeting the following performance hurdles:
- the participants meeting their individual performance hurdles during the three-year employment tenure from the grant date of the rights (retention period); and
- the Group’s achieving a minimum 5% average compound per annum diluted EPS growth during the retention period;
• the rights will not accrue notional dividends during the retention period but do accrue for FY14 and FY15 plans;
• the vesting is conditional on there being no material adverse deterioration of the EPS growth during the performance period before the exercise of the rights;
• before vesting, the Board will determine the number of rights to vest based on the combined outcome of the performance hurdles;
• when vesting (after completion of the retention period), each right will be converted into one Steadfast ordinary share for nil consideration upon exercise by the participant.
• the Board has discretion to settle the rights in cash instead of Steadfast ordinary shares; and
• if the vesting conditions are not met then the rights lapse.
Further details of the 2016 LTI in relation to the Group’s key management personnel are disclosed in the Remuneration Report for the current financial year.
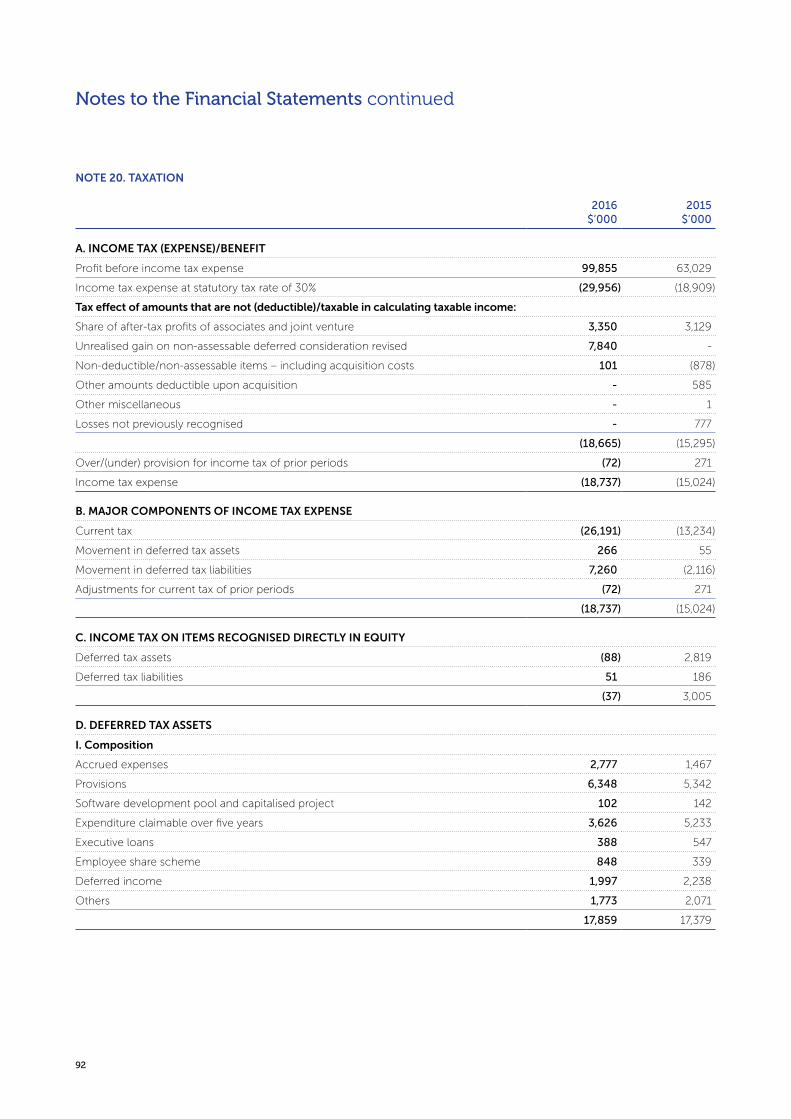
92
Notes to the Financial Statements continued
NOTE 20. TAXATION
2016 $’000
2015 $’000
A. INCOME TAX (EXPENSE)/BENEFIT
Profit before income tax expense 99,855 63,029
Income tax expense at statutory tax rate of 30% (29,956) (18,909)
Tax effect of amounts that are not (deductible)/taxable in calculating taxable income:
Share of after-tax profits of associates and joint venture 3,350 3,129
Unrealised gain on non-assessable deferred consideration revised 7,840 -
Non-deductible/non-assessable items – including acquisition costs 101 (878)
Other amounts deductible upon acquisition - 585
Other miscellaneous - 1
Losses not previously recognised - 777
(18,665) (15,295)
Over/(under) provision for income tax of prior periods (72) 271
Income tax expense (18,737) (15,024)
B. MAJOR COMPONENTS OF INCOME TAX EXPENSE
Current tax (26,191) (13,234)
Movement in deferred tax assets 266 55
Movement in deferred tax liabilities 7,260 (2,116)
Adjustments for current tax of prior periods (72) 271
(18,737) (15,024)
C. INCOME TAX ON ITEMS RECOGNISED DIRECTLY IN EQUITY
Deferred tax assets (88) 2,819
Deferred tax liabilities 51 186
(37) 3,005
D. DEFERRED TAX ASSETS
I. Composition
Accrued expenses 2,777 1,467
Provisions 6,348 5,342
Software development pool and capitalised project 102 142
Expenditure claimable over five years 3,626 5,233
Executive loans 388 547
Employee share scheme 848 339
Deferred income 1,997 2,238
Others 1,773 2,071
17,859 17,379
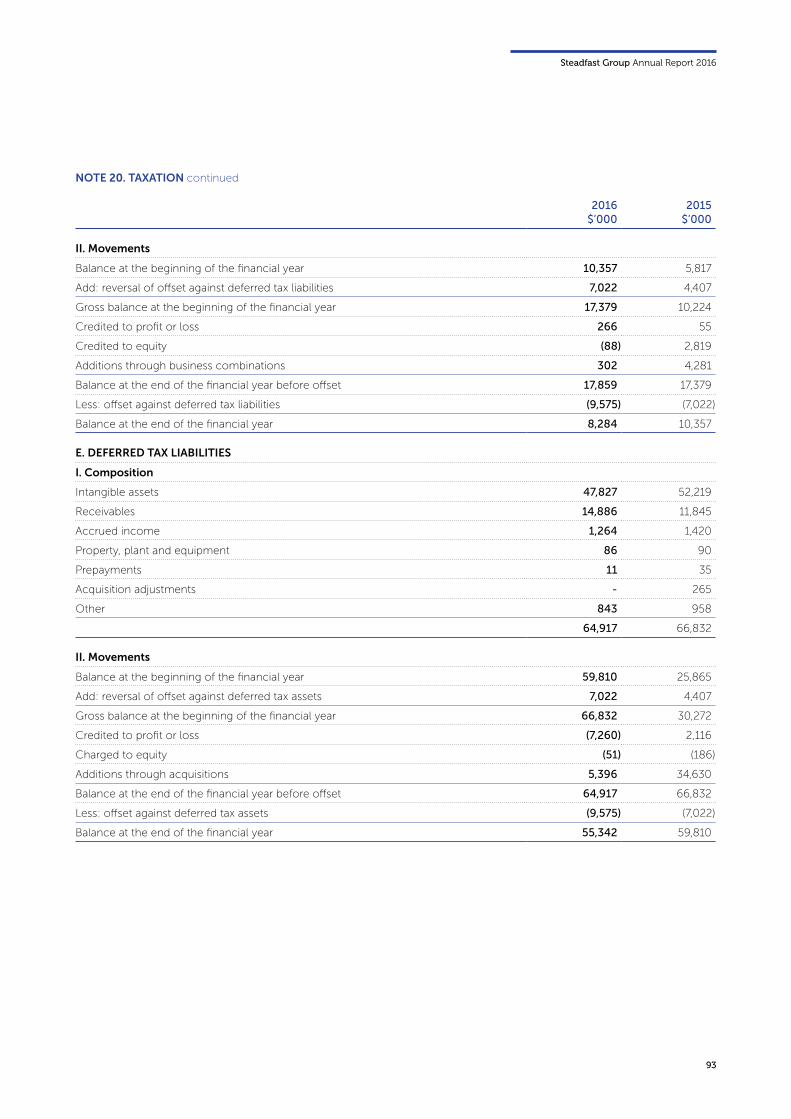
Steadfast Group Annual Report 2016
93
NOTE 20. TAXATION continued
2016 $’000
2015 $’000
II. Movements
Balance at the beginning of the financial year 10,357 5,817
Add: reversal of offset against deferred tax liabilities 7,022 4,407
Gross balance at the beginning of the financial year 17,379 10,224
Credited to profit or loss 266 55
Credited to equity (88) 2,819
Additions through business combinations 302 4,281
Balance at the end of the financial year before offset 17,859 17,379
Less: offset against deferred tax liabilities (9,575) (7,022)
Balance at the end of the financial year 8,284 10,357
E. DEFERRED TAX LIABILITIES
I. Composition
Intangible assets 47,827 52,219
Receivables 14,886 11,845
Accrued income 1,264 1,420
Property, plant and equipment 86 90
Prepayments 11 35
Acquisition adjustments - 265
Other 843 958
64,917 66,832
II. Movements
Balance at the beginning of the financial year 59,810 25,865
Add: reversal of offset against deferred tax assets 7,022 4,407
Gross balance at the beginning of the financial year 66,832 30,272
Credited to profit or loss (7,260) 2,116
Charged to equity (51) (186)
Additions through acquisitions 5,396 34,630
Balance at the end of the financial year before offset 64,917 66,832
Less: offset against deferred tax assets (9,575) (7,022)
Balance at the end of the financial year 55,342 59,810
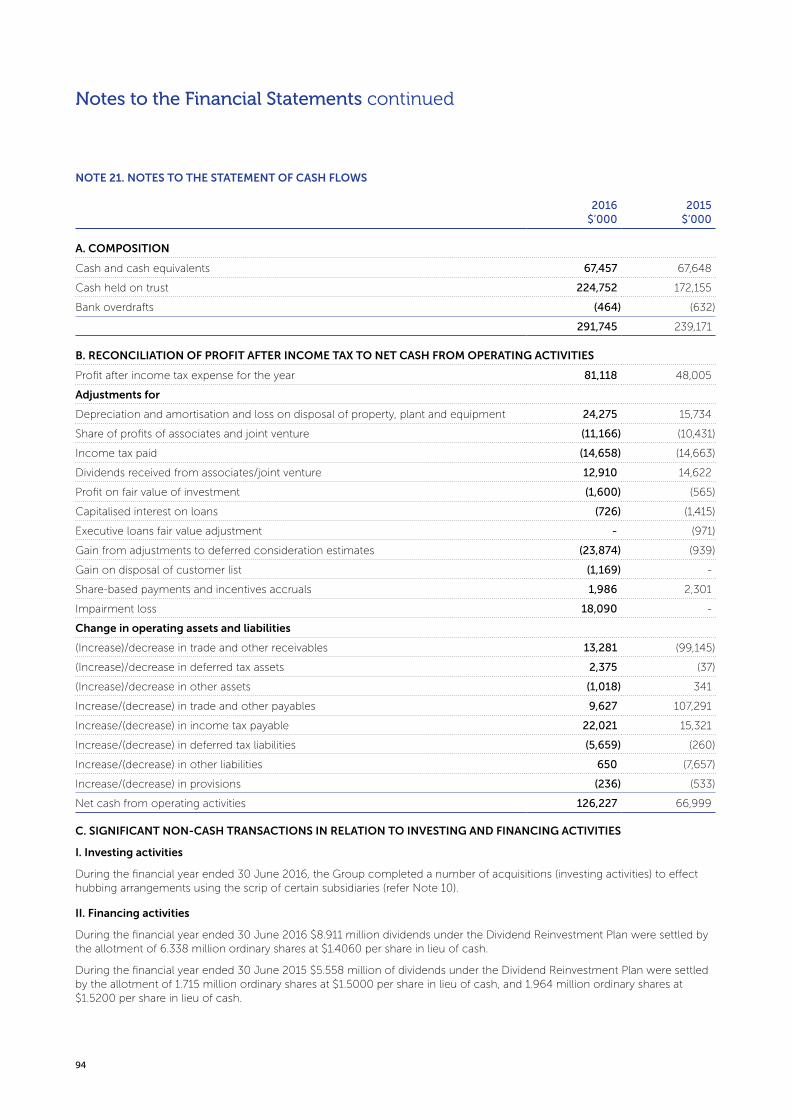
94
Notes to the Financial Statements continued
NOTE 21. NOTES TO THE STATEMENT OF CASH FLOWS
2016 $’000
2015 $’000
A. COMPOSITION
Cash and cash equivalents 67,457 67,648
Cash held on trust 224,752 172,155
Bank overdrafts (464) (632)
291,745 239,171
B. RECONCILIATION OF PROFIT AFTER INCOME TAX TO NET CASH FROM OPERATING ACTIVITIES
Profit after income tax expense for the year 81,118 48,005
Adjustments for
Depreciation and amortisation and loss on disposal of property, plant and equipment 24,275 15,734
Share of profits of associates and joint venture (11,166) (10,431)
Income tax paid (14,658) (14,663)
Dividends received from associates/joint venture 12,910 14,622
Profit on fair value of investment (1,600) (565)
Capitalised interest on loans (726) (1,415)
Executive loans fair value adjustment - (971)
Gain from adjustments to deferred consideration estimates (23,874) (939)
Gain on disposal of customer list (1,169) -
Share-based payments and incentives accruals 1,986 2,301
Impairment loss 18,090 -
Change in operating assets and liabilities
(Increase)/decrease in trade and other receivables 13,281 (99,145)
(Increase)/decrease in deferred tax assets 2,375 (37)
(Increase)/decrease in other assets (1,018) 341
Increase/(decrease) in trade and other payables 9,627 107,291
Increase/(decrease) in income tax payable 22,021 15,321
Increase/(decrease) in deferred tax liabilities (5,659) (260)
Increase/(decrease) in other liabilities 650 (7,657)
Increase/(decrease) in provisions (236) (533)
Net cash from operating activities 126,227 66,999
C. SIGNIFICANT NON-CASH TRANSACTIONS IN RELATION TO INVESTING AND FINANCING ACTIVITIES
I. Investing activities
During the financial year ended 30 June 2016, the Group completed a number of acquisitions (investing activities) to effect hubbing arrangements using the scrip of certain subsidiaries (refer Note 10).
II. Financing activities
During the financial year ended 30 June 2016 $8.911 million dividends under the Dividend Reinvestment Plan were settled by the allotment of 6.338 million ordinary shares at $1.4060 per share in lieu of cash.
During the financial year ended 30 June 2015 $5.558 million of dividends under the Dividend Reinvestment Plan were settled by the allotment of 1.715 million ordinary shares at $1.5000 per share in lieu of cash, and 1.964 million ordinary shares at $1.5200 per share in lieu of cash.
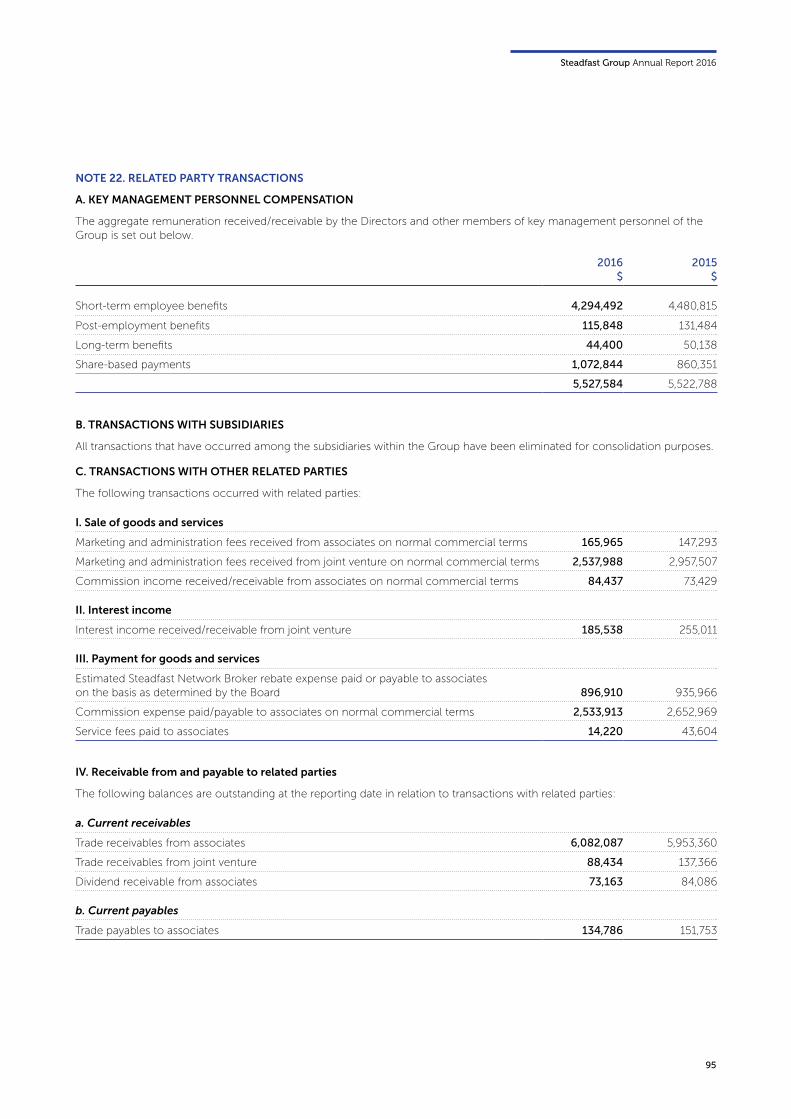
Steadfast Group Annual Report 2016
95
2016 $
2015 $
Short-term employee benefits 4,294,492 4,480,815
Post-employment benefits 115,848 131,484
Long-term benefits 44,400 50,138
Share-based payments 1,072,844 860,351
5,527,584 5,522,788
I. Sale of goods and services
Marketing and administration fees received from associates on normal commercial terms 165,965 147,293
Marketing and administration fees received from joint venture on normal commercial terms 2,537,988 2,957,507
Commission income received/receivable from associates on normal commercial terms 84,437 73,429
II. Interest income
Interest income received/receivable from joint venture 185,538 255,011
III. Payment for goods and services
Estimated Steadfast Network Broker rebate expense paid or payable to associates on the basis as determined by the Board 896,910 935,966
Commission expense paid/payable to associates on normal commercial terms 2,533,913 2,652,969
Service fees paid to associates 14,220 43,604
a. Current receivables
Trade receivables from associates 6,082,087 5,953,360
Trade receivables from joint venture 88,434 137,366
Dividend receivable from associates 73,163 84,086
b. Current payables
Trade payables to associates 134,786 151,753
NOTE 22. RELATED PARTY TRANSACTIONS
A. KEY MANAGEMENT PERSONNEL COMPENSATION
The aggregate remuneration received/receivable by the Directors and other members of key management personnel of the Group is set out below.
B. TRANSACTIONS WITH SUBSIDIARIES
All transactions that have occurred among the subsidiaries within the Group have been eliminated for consolidation purposes.
C. TRANSACTIONS WITH OTHER RELATED PARTIES
The following transactions occurred with related parties:
IV. Receivable from and payable to related parties
The following balances are outstanding at the reporting date in relation to transactions with related parties:
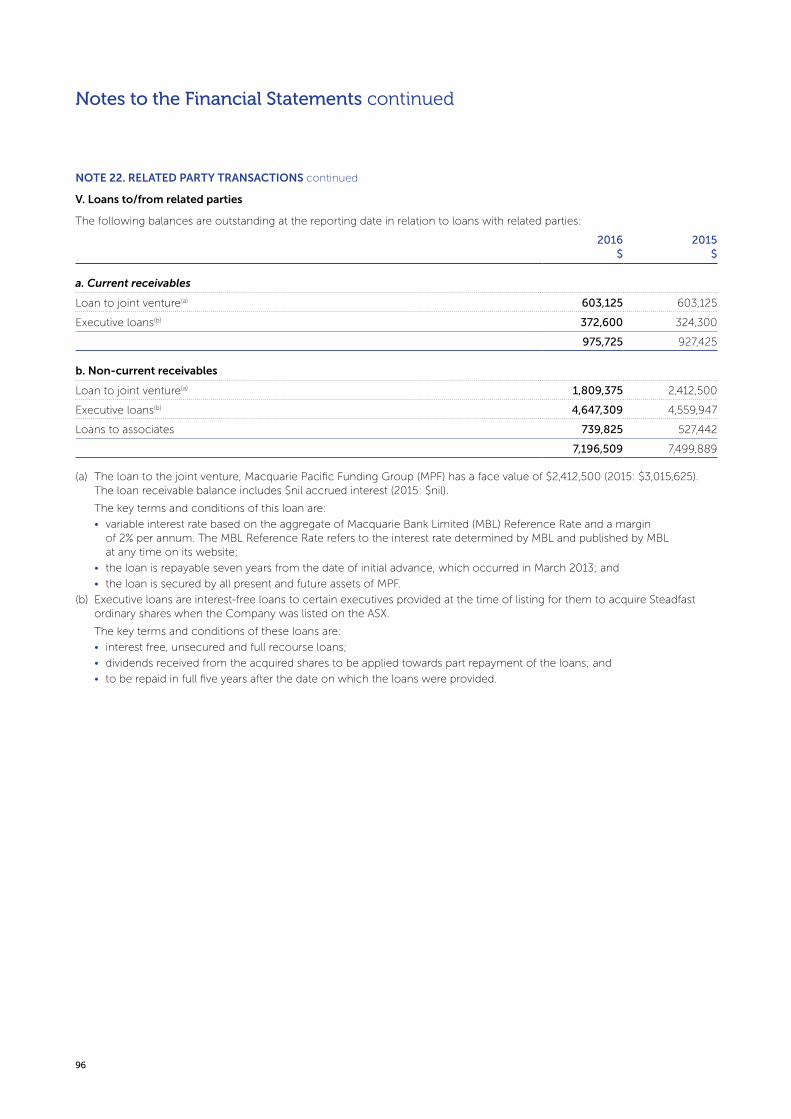
96
Notes to the Financial Statements continued
NOTE 22. RELATED PARTY TRANSACTIONS continued
V. Loans to/from related parties
The following balances are outstanding at the reporting date in relation to loans with related parties:
2016 $
2015 $
a. Current receivables
Loan to joint venture(a) 603,125 603,125
Executive loans(b) 372,600 324,300
975,725 927,425
b. Non-current receivables
Loan to joint venture(a) 1,809,375 2,412,500
Executive loans(b) 4,647,309 4,559,947
Loans to associates 739,825 527,442
7,196,509 7,499,889
(a) The loan to the joint venture, Macquarie Pacific Funding Group (MPF) has a face value of $2,412,500 (2015: $3,015,625). The loan receivable balance includes $nil accrued interest (2015: $nil).
The key terms and conditions of this loan are:
• variable interest rate based on the aggregate of Macquarie Bank Limited (MBL) Reference Rate and a margin of 2% per annum. The MBL Reference Rate refers to the interest rate determined by MBL and published by MBL at any time on its website;
• the loan is repayable seven years from the date of initial advance, which occurred in March 2013; and
• the loan is secured by all present and future assets of MPF.
(b) Executive loans are interest-free loans to certain executives provided at the time of listing for them to acquire Steadfast ordinary shares when the Company was listed on the ASX.
The key terms and conditions of these loans are:
• interest free, unsecured and full recourse loans;
• dividends received from the acquired shares to be applied towards part repayment of the loans; and
• to be repaid in full five years after the date on which the loans were provided.
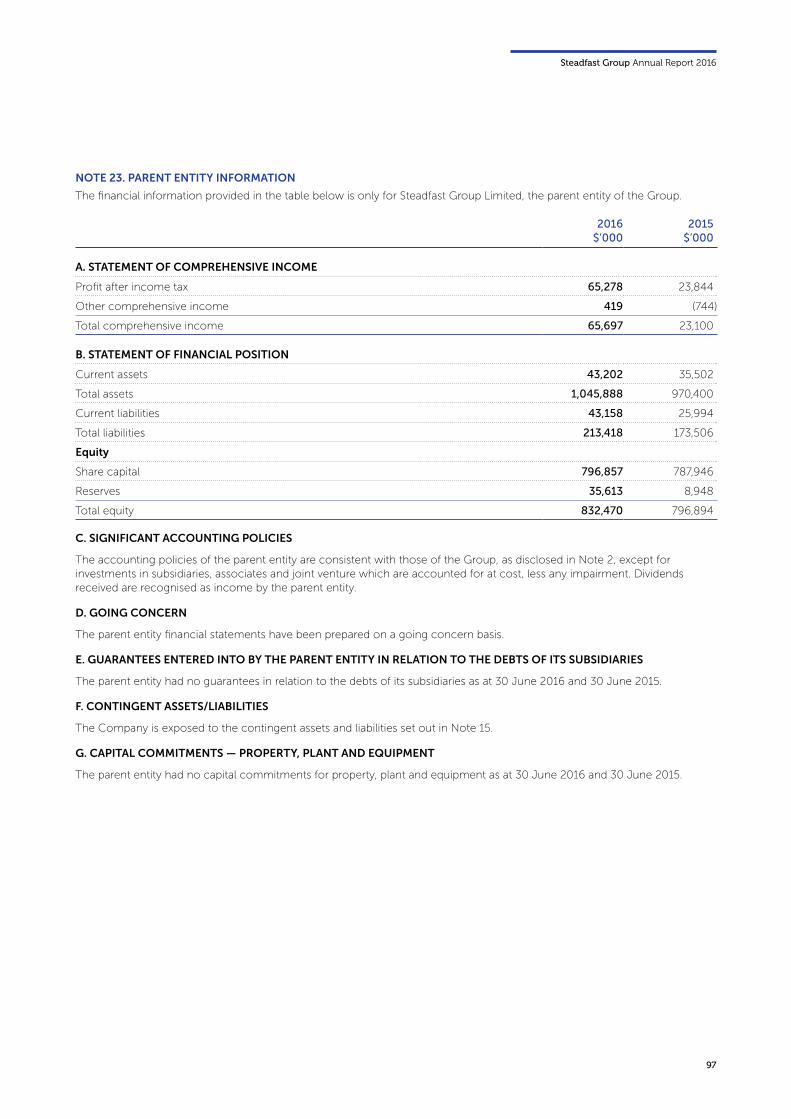
Steadfast Group Annual Report 2016
97
2016 $’000
2015 $’000
A. STATEMENT OF COMPREHENSIVE INCOME
Profit after income tax 65,278 23,844
Other comprehensive income 419 (744)
Total comprehensive income 65,697 23,100
B. STATEMENT OF FINANCIAL POSITION
Current assets 43,202 35,502
Total assets 1,045,888 970,400
Current liabilities 43,158 25,994
Total liabilities 213,418 173,506
Equity
Share capital 796,857 787,946
Reserves 35,613 8,948
Total equity 832,470 796,894
NOTE 23. PARENT ENTITY INFORMATION
The financial information provided in the table below is only for Steadfast Group Limited, the parent entity of the Group.
C. SIGNIFICANT ACCOUNTING POLICIES
The accounting policies of the parent entity are consistent with those of the Group, as disclosed in Note 2, except for investments in subsidiaries, associates and joint venture which are accounted for at cost, less any impairment. Dividends received are recognised as income by the parent entity.
D. GOING CONCERN
The parent entity financial statements have been prepared on a going concern basis.
E. GUARANTEES ENTERED INTO BY THE PARENT ENTITY IN RELATION TO THE DEBTS OF ITS SUBSIDIARIES
The parent entity had no guarantees in relation to the debts of its subsidiaries as at 30 June 2016 and 30 June 2015.
F. CONTINGENT ASSETS/LIABILITIES
The Company is exposed to the contingent assets and liabilities set out in Note 15.
G. CAPITAL COMMITMENTS — PROPERTY, PLANT AND EQUIPMENT
The parent entity had no capital commitments for property, plant and equipment as at 30 June 2016 and 30 June 2015.
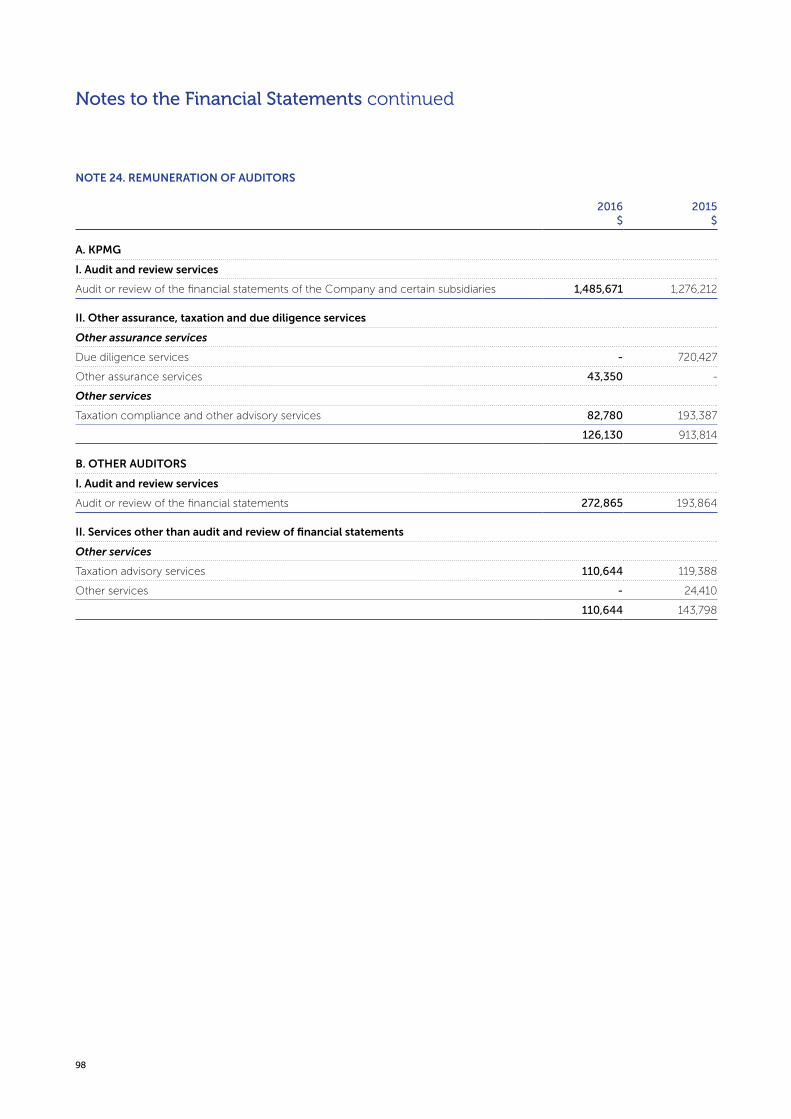
98
Notes to the Financial Statements continued
2016 $
2015 $
A. KPMG
I. Audit and review services
Audit or review of the financial statements of the Company and certain subsidiaries 1,485,671 1,276,212
II. Other assurance, taxation and due diligence services
Other assurance services
Due diligence services - 720,427
Other assurance services 43,350 -
Other services
Taxation compliance and other advisory services 82,780 193,387
126,130 913,814
B. OTHER AUDITORS
I. Audit and review services
Audit or review of the financial statements 272,865 193,864
II. Services other than audit and review of financial statements
Other services
Taxation advisory services 110,644 119,388
Other services - 24,410
110,644 143,798
NOTE 24. REMUNERATION OF AUDITORS
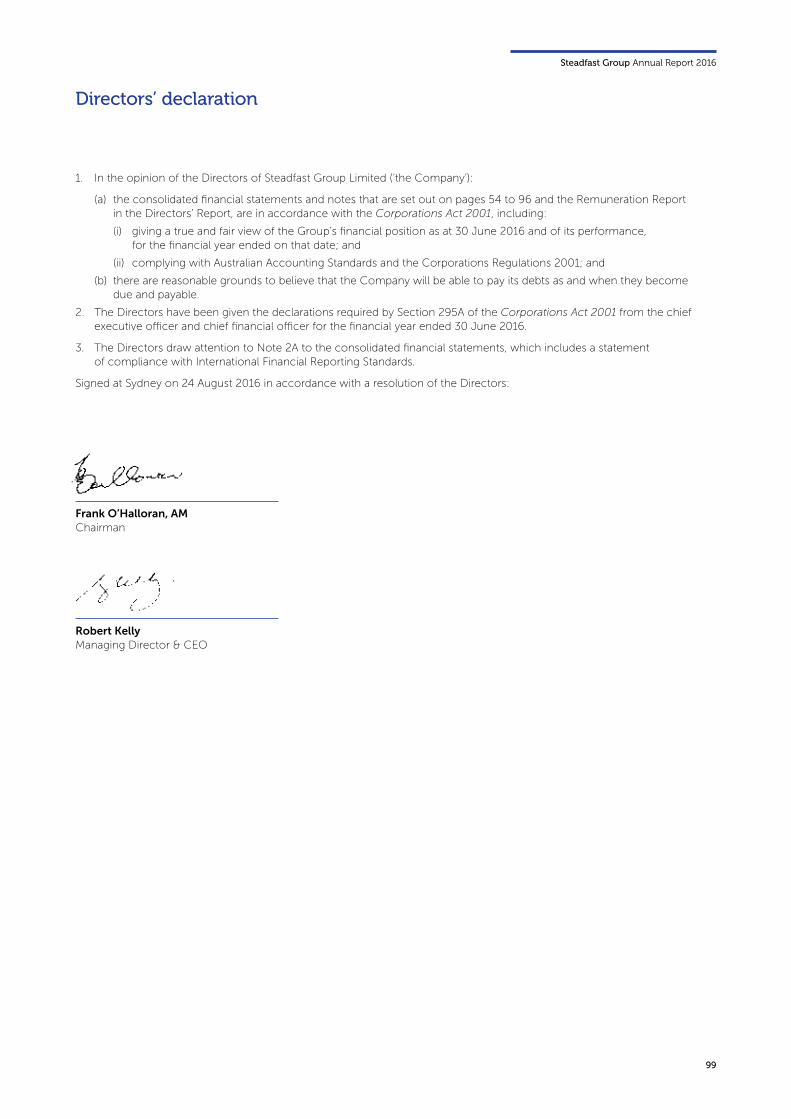
Steadfast Group Annual Report 2016
99
Directors’ declaration
1. In the opinion of the Directors of Steadfast Group Limited (‘the Company’):
(a) the consolidated financial statements and notes that are set out on pages 54 to 96 and the Remuneration Report in the Directors’ Report, are in accordance with the Corporations Act 2001, including:
(i) giving a true and fair view of the Group’s financial position as at 30 June 2016 and of its performance, for the financial year ended on that date; and
(ii) complying with Australian Accounting Standards and the Corporations Regulations 2001; and
(b) there are reasonable grounds to believe that the Company will be able to pay its debts as and when they become due and payable.
2. The Directors have been given the declarations required by Section 295A of the Corporations Act 2001 from the chief executive officer and chief financial officer for the financial year ended 30 June 2016.
3. The Directors draw attention to Note 2A to the consolidated financial statements, which includes a statement of compliance with International Financial Reporting Standards.
Signed at Sydney on 24 August 2016 in accordance with a resolution of the Directors:
Robert Kelly Managing Director & CEO
Frank O’Halloran, AM Chairman
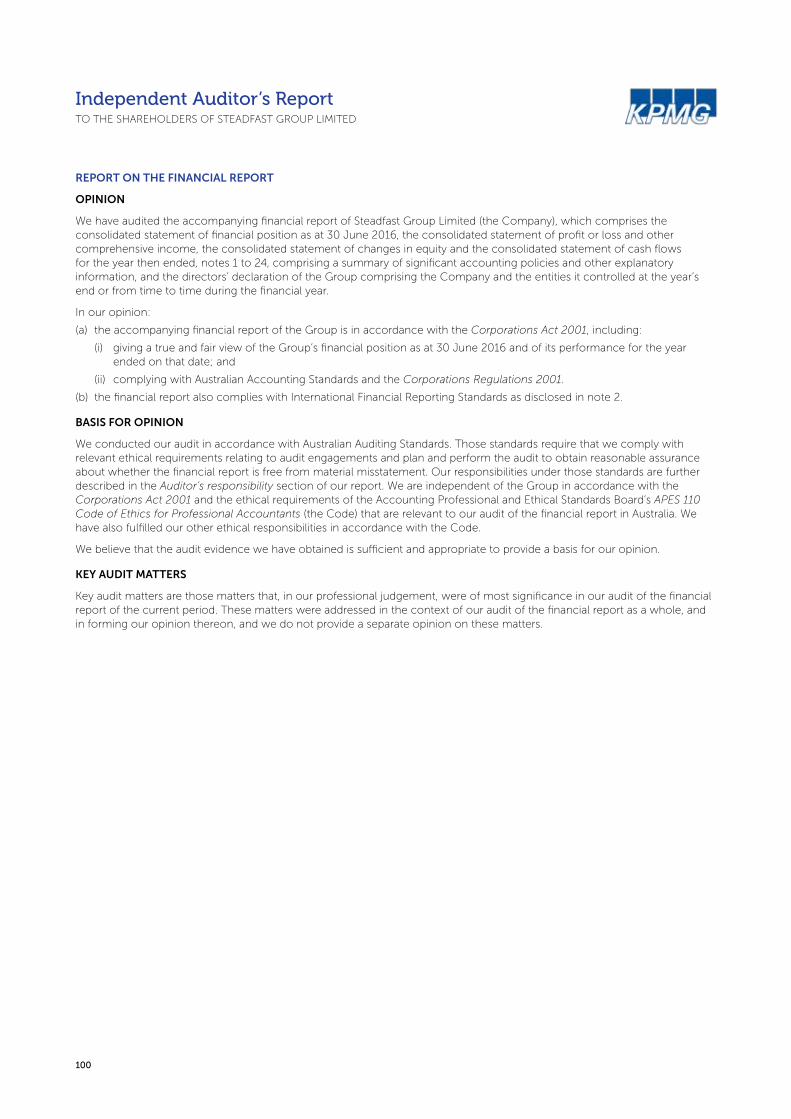
100
Independent Auditor’s Report TO THE SHAREHOLDERS OF STEADFAST GROUP LIMITED
REPORT ON THE FINANCIAL REPORT
OPINION
We have audited the accompanying financial report of Steadfast Group Limited (the Company), which comprises the consolidated statement of financial position as at 30 June 2016, the consolidated statement of profit or loss and other comprehensive income, the consolidated statement of changes in equity and the consolidated statement of cash flows for the year then ended, notes 1 to 24, comprising a summary of significant accounting policies and other explanatory information, and the directors’ declaration of the Group comprising the Company and the entities it controlled at the year’s end or from time to time during the financial year.
In our opinion:
(a) the accompanying financial report of the Group is in accordance with the Corporations Act 2001, including:
(i) giving a true and fair view of the Group’s financial position as at 30 June 2016 and of its performance for the year ended on that date; and
(ii) complying with Australian Accounting Standards and the Corporations Regulations 2001.
(b) the financial report also complies with International Financial Reporting Standards as disclosed in note 2.
BASIS FOR OPINION
We conducted our audit in accordance with Australian Auditing Standards. Those standards require that we comply with relevant ethical requirements relating to audit engagements and plan and perform the audit to obtain reasonable assurance about whether the financial report is free from material misstatement. Our responsibilities under those standards are further described in the Auditor’s responsibility section of our report. We are independent of the Group in accordance with the Corporations Act 2001 and the ethical requirements of the Accounting Professional and Ethical Standards Board’s APES 110 Code of Ethics for Professional Accountants (the Code) that are relevant to our audit of the financial report in Australia. We have also fulfilled our other ethical responsibilities in accordance with the Code.
We believe that the audit evidence we have obtained is sufficient and appropriate to provide a basis for our opinion.
KEY AUDIT MATTERS
Key audit matters are those matters that, in our professional judgement, were of most significance in our audit of the financial report of the current period. These matters were addressed in the context of our audit of the financial report as a whole, and in forming our opinion thereon, and we do not provide a separate opinion on these matters.
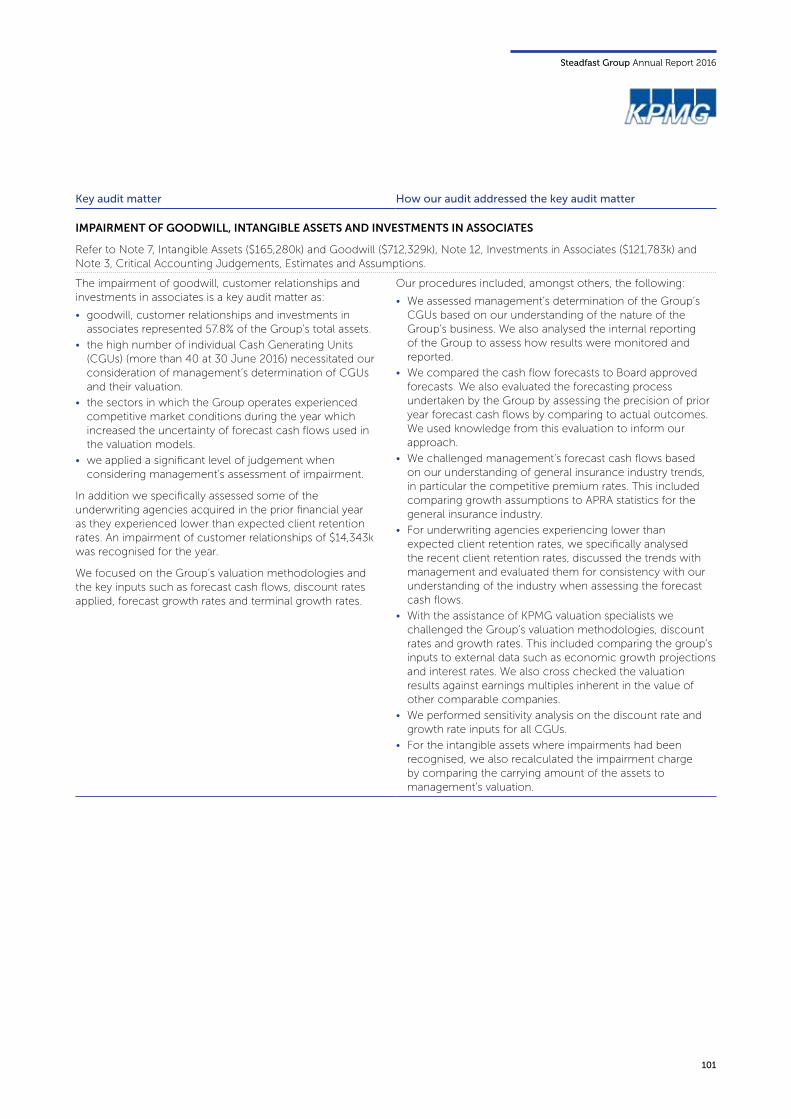
Steadfast Group Annual Report 2016
101
Key audit matter How our audit addressed the key audit matter
IMPAIRMENT OF GOODWILL, INTANGIBLE ASSETS AND INVESTMENTS IN ASSOCIATES
Refer to Note 7, Intangible Assets ($165,280k) and Goodwill ($712,329k), Note 12, Investments in Associates ($121,783k) and Note 3, Critical Accounting Judgements, Estimates and Assumptions.
The impairment of goodwill, customer relationships and investments in associates is a key audit matter as:
• goodwill, customer relationships and investments in associates represented 57.8% of the Group’s total assets.
• the high number of individual Cash Generating Units (CGUs) (more than 40 at 30 June 2016) necessitated our consideration of management’s determination of CGUs and their valuation.
• the sectors in which the Group operates experienced competitive market conditions during the year which increased the uncertainty of forecast cash flows used in the valuation models.
• we applied a significant level of judgement when considering management’s assessment of impairment.
In addition we specifically assessed some of the underwriting agencies acquired in the prior financial year as they experienced lower than expected client retention rates. An impairment of customer relationships of $14,343k was recognised for the year.
We focused on the Group’s valuation methodologies and the key inputs such as forecast cash flows, discount rates applied, forecast growth rates and terminal growth rates.
Our procedures included, amongst others, the following:
• We assessed management’s determination of the Group’s CGUs based on our understanding of the nature of the Group’s business. We also analysed the internal reporting of the Group to assess how results were monitored and reported.
• We compared the cash flow forecasts to Board approved forecasts. We also evaluated the forecasting process undertaken by the Group by assessing the precision of prior year forecast cash flows by comparing to actual outcomes. We used knowledge from this evaluation to inform our approach.
• We challenged management’s forecast cash flows based on our understanding of general insurance industry trends, in particular the competitive premium rates. This included comparing growth assumptions to APRA statistics for the general insurance industry.
• For underwriting agencies experiencing lower than expected client retention rates, we specifically analysed the recent client retention rates, discussed the trends with management and evaluated them for consistency with our understanding of the industry when assessing the forecast cash flows.
• With the assistance of KPMG valuation specialists we challenged the Group’s valuation methodologies, discount rates and growth rates. This included comparing the group’s inputs to external data such as economic growth projections and interest rates. We also cross checked the valuation results against earnings multiples inherent in the value of other comparable companies.
• We performed sensitivity analysis on the discount rate and growth rate inputs for all CGUs.
• For the intangible assets where impairments had been recognised, we also recalculated the impairment charge by comparing the carrying amount of the assets to management’s valuation.
102
Key audit matter How our audit addressed the key audit matter
DECENTRALISED OPERATIONS
Refer to Note 2, Significant Accounting Policies, Note 11, Subsidiaries and Note 12, Investments in Associates.
The Group comprises more than 100 subsidiaries and associates (components) whose operations are spread across Australia, as well as in New Zealand and Singapore. The Group’s business is general insurance distribution, and the individual components are wide ranging in size and also in the customers and products of each business operation.
The decentralised and varied nature of these operations require significant oversight by Steadfast management to monitor the activities, review component financial reporting and undertake the Group consolidation. This is an extensive process due to the variety of accounting processes and systems used across the Group.
This was a key audit matter for us given the high number of subsidiaries and associates, and the varied operations, accounting processes and systems. We focused on:
• understanding the components and identifying the significant risks of misstatement within them;
• the scoping of relevant procedures consistent with the risks identified and to enable coverage of significant aggregated balances;
• the assessment of components compliance with Group accounting policies, particularly regarding revenue recognition; and
• the consolidation process and aggregating results from component procedures.
Audit procedures included, amongst others, the following:
• We instructed component audit teams to perform procedures on the financial information prepared for consolidation purposes for 20 components. The selected components were those of most significance to the audit of the Group, either by individual size or by risk to the Group, and included over 75% of the Group’s assets and revenues. The objective of this approach was to gather evidence on significant balances that aggregate to form the Group’s financial reporting.
• The component audit teams performed audits of the financial information of the components on specific group reporting package information and local statutory financial reporting. We worked with the component audit teams to understand the components, to identify risks that are significant to the audit of the Group and to plan relevant procedures. We discussed the audits as they progressed to identify and address any issues, working with the component audit teams as appropriate. We read their audit reports to us and the underlying memos explaining component results. We evaluated the work performed by the component audit teams for sufficiency for our overall audit purpose. We also considered the component auditors' reporting about the components' compliance with the Group’s accounting policies, including revenue recognition.
• We tested the financial data used, in both the consolidation process and head office management review, for consistency with the financial data audited by component audit teams. We also assessed the consolidation process for compliance with accounting standards.
• For the other components, not within the scope of the component audit teams, our procedures included testing the Group’s key monitoring controls and performance of analytical procedures to deepen our understanding of these components. This included testing the head office management review of financial information received from components. We inspected a sample of bank reconciliations, statutory financial reports and accompanying audit reports, and enquired of head office and component management. In our analytical procedures we compared actual financial results to budgets and the prior year results, we enquired of management and considered trends within the insurance market.
Steadfast Group Annual Report 2016
103
DIRECTORS’ RESPONSIBILITY FOR THE FINANCIAL REPORT
The directors of the Company are responsible for the preparation of the financial report that gives a true and fair view in accordance with Australian Accounting Standards and the Corporations Act 2001 and for such internal control as the directors determine is necessary to enable the preparation of the financial report that gives a true and fair view and is free from material misstatement, whether due to fraud or error. In note 2, the directors also state, in accordance with Australian Accounting Standard AASB 101 Presentation of Financial Statements, that the financial report complies with International Financial Reporting Standards.
In preparing the financial report, the directors are responsible for assessing the Group’s ability to continue as a going concern, disclosing, as applicable, matters related to going concern and using the going concern basis of accounting unless the directors either intend to liquidate the Group or to cease operations, or have no realistic alternative but to do so.
AUDITOR’S RESPONSIBILITY
Our responsibility is to express an opinion on the financial report based on our audit. Our objectives are to obtain reasonable assurance about whether the financial report as a whole is free from material misstatement, whether due to fraud or error, and to issue an auditor’s report that includes our opinion. Reasonable assurance is a high level of assurance, but is not a guarantee that an audit conducted in accordance with Australian Auditing Standards will always detect a material misstatement when it exists. Misstatements can arise from fraud or error and are considered material if, individually or in the aggregate, they could reasonably be expected to influence the economic decisions of users taken on the basis of this financial report.
As part of an audit in accordance with Australian Auditing Standards, we exercise professional judgement and maintain professional scepticism throughout the audit.
An audit involves performing procedures to obtain audit evidence about the amounts and disclosures in the financial report.
The procedures selected depend on the auditor’s judgement, including the assessment of the risks of material misstatement of the financial report, whether due to fraud or error. In making those risk assessments, the auditor considers internal control relevant to the entity’s preparation of the financial report that gives a true and fair view in order to design audit procedures that are appropriate in the circumstances, but not for the purpose of expressing an opinion on the effectiveness of the entity’s internal control.
The risk of not detecting a material misstatement resulting from fraud is higher than for one resulting from error, as fraud may involve collusion, forgery, intentional omissions, misrepresentations, or the override of internal control.
An audit also includes evaluating the appropriateness of accounting policies used and the reasonableness of accounting estimates and related disclosures made by the directors, as well as evaluating the overall presentation of the financial report.
We conclude on the appropriateness of the directors’ use of the going concern basis of accounting and, based on the audit evidence obtained, whether a material uncertainty exists related to events or conditions that may cast significant doubt on the Group’s ability to continue as a going concern. If we conclude that a material uncertainty exists, we are required to draw attention in our auditor’s report to the related disclosures in the financial report or, if such disclosures are inadequate, to modify our opinion. Our conclusions are based on the audit evidence obtained up to the date of our auditor’s report. However, future events or conditions may cause the Group to cease to continue as a going concern.
We evaluate the overall presentation, structure and content of the financial report, including the disclosures, and whether the financial report represents the underlying transactions and events in a manner that achieves fair presentation.
We obtain sufficient appropriate audit evidence regarding the financial information of the entities or business activities within the Group to express an opinion on the financial report. We are responsible for the direction, supervision and performance of the Group audit. We remain solely responsible for our audit opinion.
We communicate with the directors regarding, amongst other matters, the planned scope and timing of the audit and significant audit findings, including any significant deficiencies in internal control that we identify during our audit.
The Auditing Standards require that we comply with relevant ethical requirements relating to audit engagements. We also provide the directors with a statement that we have complied with relevant ethical requirements regarding independence, and to communicate with them all relationships and other matters that may reasonably be thought to bear on our independence, and where applicable, related safeguards.
From the matters communicated with the directors, we determine those matters that were of most significance in the audit of the consolidated financial report of the current period and are therefore key audit matters. We describe these matters in our auditor’s report unless law or regulation precludes public disclosure about the matter or when, in extremely rare circumstances, we determine that a matter should not be communicated in our report because the adverse consequences of doing so would reasonably be expected to outweigh the public interest benefits of such communication.
104
REPORT ON THE REMUNERATION REPORT
We have audited the Remuneration Report included the Directors’ Report for the year ended 30 June 2016. The directors of the Company are responsible for the preparation and presentation of the Remuneration Report in accordance with Section 300A of the Corporations Act 2001. Our responsibility is to express an opinion on the Remuneration Report, based on our audit conducted in accordance with Australian Auditing Standards.
OPINION
In our opinion, the Remuneration Report of Steadfast Group Limited for the year ended 30 June 2016, complies with Section 300A of the Corporations Act 2001.
KPMG
Andrew Dickinson Partner
Sydney 24 August 2016
KPMG, an Australian partnership and a member firm of the KPMG network of independent member firms affiliated with KPMG International Cooperative (“KPMG International”), a Swiss entity. Liability limited by a scheme approved under Professional Standards Legislation.
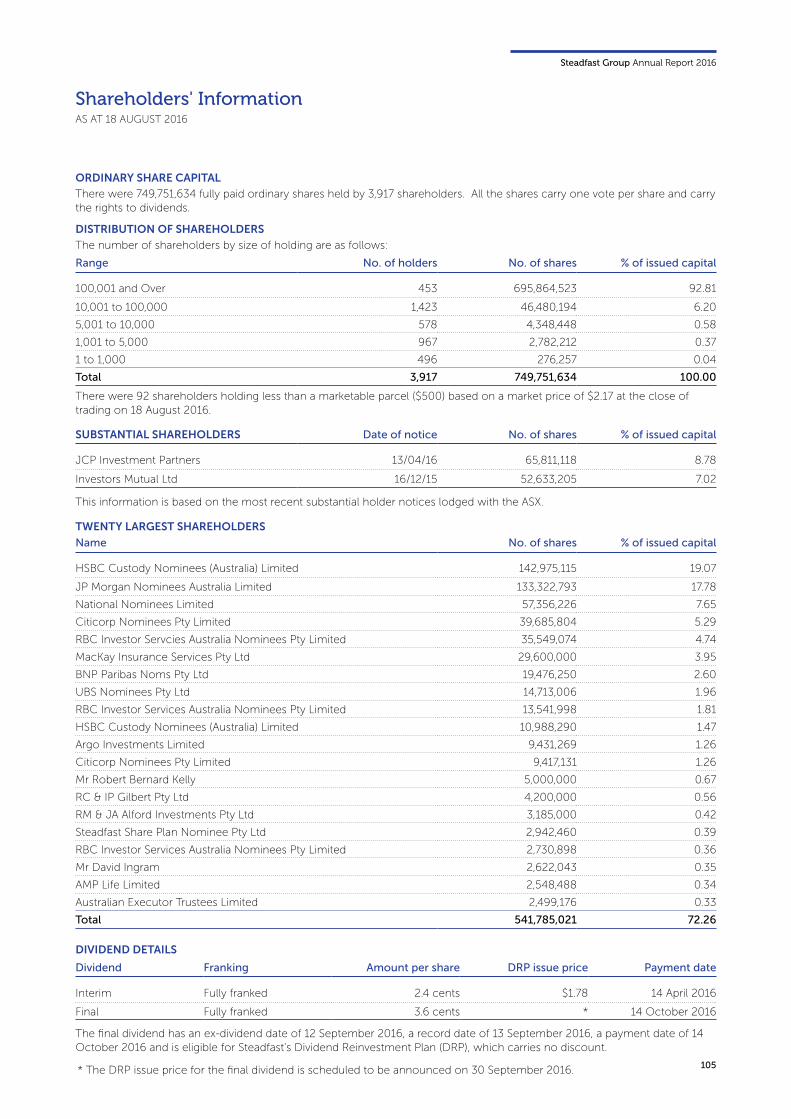
Steadfast Group Annual Report 2016
105
Shareholders' InformationAS AT 18 AUGUST 2016
ORDINARY SHARE CAPITAL
There were 749,751,634 fully paid ordinary shares held by 3,917 shareholders. All the shares carry one vote per share and carry the rights to dividends.
DISTRIBUTION OF SHAREHOLDERS
The number of shareholders by size of holding are as follows:
Range No. of holders No. of shares % of issued capital
100,001 and Over 453 695,864,523 92.81
10,001 to 100,000 1,423 46,480,194 6.20
5,001 to 10,000 578 4,348,448 0.58
1,001 to 5,000 967 2,782,212 0.37
1 to 1,000 496 276,257 0.04
Total 3,917 749,751,634 100.00
Name No. of shares % of issued capital
HSBC Custody Nominees (Australia) Limited 142,975,115 19.07
JP Morgan Nominees Australia Limited 133,322,793 17.78
National Nominees Limited 57,356,226 7.65
Citicorp Nominees Pty Limited 39,685,804 5.29
RBC Investor Servcies Australia Nominees Pty Limited 35,549,074 4.74
MacKay Insurance Services Pty Ltd 29,600,000 3.95
BNP Paribas Noms Pty Ltd 19,476,250 2.60
UBS Nominees Pty Ltd 14,713,006 1.96
RBC Investor Services Australia Nominees Pty Limited 13,541,998 1.81
HSBC Custody Nominees (Australia) Limited 10,988,290 1.47
Argo Investments Limited 9,431,269 1.26
Citicorp Nominees Pty Limited 9,417,131 1.26
Mr Robert Bernard Kelly 5,000,000 0.67
RC & IP Gilbert Pty Ltd 4,200,000 0.56
RM & JA Alford Investments Pty Ltd 3,185,000 0.42
Steadfast Share Plan Nominee Pty Ltd 2,942,460 0.39
RBC Investor Services Australia Nominees Pty Limited 2,730,898 0.36
Mr David Ingram 2,622,043 0.35
AMP Life Limited 2,548,488 0.34
Australian Executor Trustees Limited 2,499,176 0.33
Total 541,785,021 72.26
SUBSTANTIAL SHAREHOLDERS Date of notice No. of shares % of issued capital
JCP Investment Partners 13/04/16 65,811,118 8.78
Investors Mutual Ltd 16/12/15 52,633,205 7.02
Dividend Franking Amount per share DRP issue price Payment date
Interim Fully franked 2.4 cents $1.78 14 April 2016
Final Fully franked 3.6 cents * 14 October 2016
There were 92 shareholders holding less than a marketable parcel ($500) based on a market price of $2.17 at the close of trading on 18 August 2016.
This information is based on the most recent substantial holder notices lodged with the ASX.
TWENTY LARGEST SHAREHOLDERS
DIVIDEND DETAILS
The final dividend has an ex-dividend date of 12 September 2016, a record date of 13 September 2016, a payment date of 14 October 2016 and is eligible for Steadfast's Dividend Reinvestment Plan (DRP), which carries no discount.
* The DRP issue price for the final dividend is scheduled to be announced on 30 September 2016.

106
Corporate Directory
DIRECTORSFrank O’Halloran, AM (Chairman)Robert Kelly (Managing Director & CEO)David Liddy, AMAnne O’DriscollPhilip PurcellGreg Rynenberg
COMPANY SECRETARIESLinda EllisPeter Roberts
NOTICE OF AGMThe AGM will be held on Thursday 27 October 2016 at 10.00 am at the Sheraton on the Park, 161 Elizabeth Street, Sydney NSW 2000.
CORPORATE OFFICESTEADFAST GROUP LIMITEDLevel 399 Bathurst StreetSydney NSW 2000
Postal AddressPO Box A980Sydney South NSW 1235
P 02 9495 6500E [email protected] steadfast.com.au
SHARE REGISTRYLINK MARKET SERVICESLevel 12680 George StreetSydney NSW 2000
Postal AddressLocked Bag A14Sydney South NSW 1235
P 1300 554 474E [email protected]
STOCK LISTINGSteadfast Group Limited ordinary shares are listedon the Australian Securities Exchange (ASX code: SDF).
De
sig
n b
y A
sce
nd
er.c
om
.au

Steadfast Group Annual Report 2016
107
One Culture

108
Steadfast Group LimitedABN 98 073 659 677
www.steadfast.com.au


![All papers [3Mb]Opens new window](https://static.documents.pub/doc/80x56/58a2dde51a28abb5488bda64/all-papers-3mbopens-new-window.jpg)


