180
OpenWay® CENTRON® Polyphase Meter Technical Reference Guide System Release 6.1

OpenWay® CENTRON® Polyphase Meter
Technical Reference Guide System Release 6.1

Identification OpenWay CENTRON Polphase Meter Technical Reference Guide 14 March 2014 TDC-1396-002 Copyright © 2012-2014 Itron, Inc. All rights reserved. Confidentiality Notice The information contained herein is proprietary and confidential and is being provided subject to the condition that (i) it be held in confidence except to the extent required otherwise by law and (ii) it will be used only for the purposes described herein. Any third party that is given access to this information shall be similarly bound in writing. Trademark Notice Itron is a registered trademark of Itron, Inc. All other product names and logos in this documentation are used for identification purposes only and may be trademarks or registered trademarks of their respective companies. Suggestions If you have comments or suggestions on how we may improve this documentation, send them to [email protected] For more information about Itron or Itron products, see www.itron.com If you have questions or comments about the software or hardware product, contact Itron Technical Support Services. Contact Telephone Support 1-877-487-6602 Email Support [email protected] Web/Itron Access support.itron.com

Revision History The following table describes the changes to this document for each revision of the :
Revision Date Description of Change TDC-1396-000
October 2012 This is the initial release of this document under this document number. This document provides detail on the OpenWay CENTRON polphase meter features available as of System Release (SR) 5.0. This technical reference guide has been restructured to accommodate the variety of communications options being offered. Similar information for previous OpenWay CENTRON system releases is available under the document number 100914GM-xx.
TDC-1396-001 March 2013 This document provides detail on the OpenWay CENTRON polphase meter features available as of SR 5.5.
TDC-1396-002 March 2014 This document provides detail on the OpenWay CENTRON polphase meter features available as of SR 6.1.
FCC Compliance
FCC Part 15, Class B This equipment has been tested and found to comply with the limits for a Class B digital device, pursuant to Part 15 of the FCC Rules. These limits are designed to provide reasonable protection against harmful interference in a residential installation. This equipment generates uses and can radiate radio frequency energy and, if not installed and used in accordance with the instructions, may cause harmful interference to radio communications. However, there is no guarantee that interference will not occur in a particular installation. If this equipment does cause harmful interference to radio or television reception, which can be determined by turning the equipment off and on, the user is encouraged to try to correct the interference by one or more of the following measures:
• Reorient or relocate the receiving antenna.
• Increase the separation between the equipment and receiver.
• Connect the equipment into an outlet on a circuit different from that to which the receiver is connected.
• Consult the dealer or an experienced radio/TV technician for help.
Changes or modifications to this device not expressly approved by Itron, Inc. could void the user’s authority to operate the equipment.

RF Exposure The antenna(s) used for this transmitter must be installed to provide a separation distance of at least 20 cm from all persons and must not be co-located or operating in conjunction with any other antenna or transmitter. End-users and installers must be provided with antenna installation instructions and transmitter operating conditions for satisfying RF exposure compliance.
Under Industry Canada regulations, this radio transmitter may only operate using an antenna of a type and maximum (or lesser) gain approved for the transmitter by Industry Canada. To reduce potential radio interference to other users, the antenna type and its gain should be so chosen that the equivalent isotropically radiated power (e.i.r.p.) is not more than that necessary for successful communication.
This radio transmitter (identify the device by certification number, or model number if Category II) has been approved by Industry Canada to operate with the antenna types listed below with the maximum permissible gain and required antenna impedance for each antenna type indicated. Antenna types not included in this list, having a gain greater than the maximum gain indicated for that type, are strictly prohibited for use with this device.
Listed Antennas Manufacturer Model Number Gain* Connector PCTEL ASPG918 3.0 dB N ComTelco A158192A, B 2.0 dB SMA Larsen Antennas LP800 2.14 dB SMA
* Antennas of equal or lesser gain and same type may be substituted.
Professional Installation These antennas are intended for professional installation by the integrator. The OEM integrator is still responsible for the FCC compliance requirement of the end product, which integrates this antenna.
Modification and Repairs To ensure FCC compliance and system performance, this device, antenna and/or coaxial assembly shall not be changed or modified without the express written approval of Itron. Any unauthorized modification will void the user’s authority to operate the equipment.
This device contains no user serviceable parts. Attempts to repair this device by unauthorized personnel may subject the person to shock hazard if removal of protected covers is attempted. Unauthorized repair will void the warranty and/or maintenance contract with your company.

Canadian Interference Causing Equipment Regulations This Class B digital apparatus meets all requirements of the Canadian Interference Causing Equipment Regulations. Operation is subject to the following two conditions: (1) this device may not cause harmful interference, and (2) this device must accept any interference received, including interference that may cause undesired operation.
Cet appareillage numérique de la classe B répond à la norme Canadienne sur le matériel brouilleur. L'opération est sujette aux deux conditions suivantes: (1) ce dispositif ne peut pas causer d'interférence nocive, et (2) ce dispositif doit accepter n'importe quelle interférence reçue, y compris les interférences pouvant entraîner un fonctionnement indésirable.
Factory Repair of Meters Itron recommends that all repairs be performed at the factory. Certain repairs may be performed by the user; however, unauthorized repairs will cause any existing warranty to be void.
Repair of Meters Under Warranty If the meter is under warranty and has failed due to components or workmanship, then Itron, Inc. will repair the meter at no charge. A return authorization number must be obtained before the equipment can be sent back to the factory. Contact your Itron Sales Representative for assistance.
Repair of Meters Not Under Warranty The same procedure as above applies. Itron will charge for the necessary repairs based on the failure.
Service Return Address Itron, Inc. Customer Repair Department 313 North Highway 11 Dock C West Union, SC 29696
Recycling Information The product you have purchased may contain a battery (or batteries), circuit boards, and switches. The batteries are recyclable. At the end of the meter’s useful life, under various state and local laws, it may be illegal to dispose of certain components into the municipal waste system. Check with your local solid waste officials for details about recycling options or proper disposal.
Although polycarbonate is not a commonly recycled plastic, the recycling number for the polycarbonate inner and outer cover is seven (7).


Revision History ................................................................................................................................. iii FCC Compliance ................................................................................................................................ iii
FCC Part 15, Class B ............................................................................................................... iii RF Exposure ............................................................................................................................ iv Listed Antennas ....................................................................................................................... iv
Professional Installation ................................................................................................. iv Modification and Repairs ............................................................................................... iv
Canadian Interference Causing Equipment Regulations .......................................................... v Factory Repair of Meters ..................................................................................................................... v
Repair of Meters Under Warranty ............................................................................................. v Repair of Meters Not Under Warranty ...................................................................................... v Service Return Address ............................................................................................................ v
Recycling Information .......................................................................................................................... v
Chapter 1 General Information .................................................................................... 1
About This Manual .............................................................................................................................. 1 General Description ............................................................................................................................. 1 OpenWay System Overview ............................................................................................................... 2
IPv6 Network ............................................................................................................................. 2 Network Management ..................................................................................................... 3 Field Area Network ......................................................................................................... 3 Connected Grid Router ................................................................................................... 4
C12.22 Network ........................................................................................................................ 5 OpenWay Collection Engine (CE)............................................................................................. 5 Collection Engine to Meter Security .......................................................................................... 6 OpenWay RFLAN ..................................................................................................................... 7
Priority Network Traffic Handling .................................................................................... 8 RFLAN Range Extender ............................................................................................... 10 RFLAN and Cell Relay Communications ...................................................................... 10
OpenWay Home Area Network (HAN) ................................................................................... 11 HAN Device Mirroring ................................................................................................... 11 Event Storage ............................................................................................................... 11 Gas Module Configuration ............................................................................................ 11 Gas Module Firmware Download ................................................................................. 12 HAN Join/Rejoin/Disable .............................................................................................. 12 HAN Multiplier ............................................................................................................... 13 Tiered Pricing ................................................................................................................ 13 Residential Inclining Block Pricing ................................................................................ 13 HAN Security ................................................................................................................ 14 Network Key ................................................................................................................. 14 APS Link Key ................................................................................................................ 14
OpenWay Enhanced Security ........................................................................................................... 15 Industrial Defender 300B Security Event Monitoring .............................................................. 15 Certicom AMI 7100 Signing and Encryption Server ............................................................... 16 Certicom AMI 7200 Decryption and Key Update Server ........................................................ 16 C12.22 and Meter Security ..................................................................................................... 16 Security Standards .................................................................................................................. 16 Meter Tampering ..................................................................................................................... 17
Contents
IT Department Technical Reference Guide vii Proprietary and Confidential
Contents
Canadian Metering Support .................................................................................................... 17 Physical Description .......................................................................................................................... 18
Meter Components ................................................................................................................. 18 Meter Base .............................................................................................................................. 19 Modular Assembly................................................................................................................... 20
Product Availability ............................................................................................................................ 21 Output Options .................................................................................................................................. 21 Serial Number ................................................................................................................................... 22 Electronic Serial Number ................................................................................................................... 23 Specifications .................................................................................................................................... 24
Electrical .................................................................................................................................. 24 Characteristic Data ................................................................................................................. 24 Operating Environment ........................................................................................................... 24 Burden Data ............................................................................................................................ 25 Technical Data ........................................................................................................................ 29 Type Codes ............................................................................................................................. 29 Dimensions ............................................................................................................................. 30 Shipping Weights .................................................................................................................... 30
Chapter 2 Meter Installation ....................................................................................... 31
Unpacking and Inspection ................................................................................................................. 31 Battery ............................................................................................................................................... 31 Storage .............................................................................................................................................. 31 Selecting a Site ................................................................................................................................. 32 Installing the Meter into Service ........................................................................................................ 32
Chapter 3 Base Metrology Operation ....................................................................... 33
Metrology ........................................................................................................................................... 33 Form 9S/36S Support ........................................................................................................................ 35 Surge Protection ................................................................................................................................ 36 Sampling ............................................................................................................................................ 37 Voltage and Current Measurement ................................................................................................... 38 Watt-hour (Wh) Measurement ........................................................................................................... 38 VAR-hour (VARh) Measurement ....................................................................................................... 38 Volt-ampere hour (VAh) Measurement ............................................................................................. 39 Demand Calculations ........................................................................................................................ 39
Block Interval Demand Calculation ......................................................................................... 40 Rolling/Sliding Demand Interval Calculation ........................................................................... 40 Thermal Emulation .................................................................................................................. 40 Coincident Demand ................................................................................................................ 41
Power Factor (PF) Calculations ........................................................................................................ 41 Multiple Self Reads ........................................................................................................................... 42 KYZ Option Board ............................................................................................................................. 43
Chapter 4 OpenWay Polyphase Register Operation ............................................... 45
Polyphase Basic/Advanced Features ............................................................................................... 45 Controls and Indicators ..................................................................................................................... 46
Liquid Crystal Display (LCD) ................................................................................................... 46 Load Emulator ......................................................................................................................... 47 Optical Port ............................................................................................................................. 48 LED Configuration ................................................................................................................... 49
Application of Power and Power-up .................................................................................................. 49
IT Department Technical Reference Guide viii Proprietary and Confidential

Contents
Demand Functionality ............................................................................................................. 49 TOU/Load Profile Functionality ............................................................................................... 49 Cold Load Pickup .................................................................................................................... 49 Interval Make-up ..................................................................................................................... 50
Registers ........................................................................................................................................... 50 Energy Quantities.................................................................................................................... 50 Demand Quantities ................................................................................................................. 51
Demand Calculations .................................................................................................... 52 Peak Demand (Maximum Demand) ............................................................................. 53 Cumulative Demand Values ......................................................................................... 54 Continuous Cumulative Demand Values ...................................................................... 54 Present Demand ........................................................................................................... 54
Coincident Demand Quantities ............................................................................................... 54 Power Factor (PF) Calculation ................................................................................................ 55
Operating Modes ............................................................................................................................... 55 Normal Mode ........................................................................................................................... 55 Test Mode ............................................................................................................................... 56
Display Items ..................................................................................................................................... 57 Energy Data Display Items ..................................................................................................... 57 Demand Data Display Items ................................................................................................... 58 Instantaneous Data Display Items .......................................................................................... 58 Informational Data Display Items ............................................................................................ 59 Normal Display Mode .............................................................................................................. 59 Error Code Displays ................................................................................................................ 59
Tamper Detection .............................................................................................................................. 60 Time Synchronization ........................................................................................................................ 60 Time of Use (TOU) ............................................................................................................................ 60
TOU Schedules ....................................................................................................................... 61 Calendar Schedule ....................................................................................................... 61 Rates............................................................................................................................. 61 Daily Patterns ............................................................................................................... 61 Day Types ..................................................................................................................... 61 Seasonal Schedules ..................................................................................................... 61
TOU Registers ........................................................................................................................ 62 Current Season Registers ............................................................................................ 62
TOU Operation ........................................................................................................................ 62 Rate Annunciators and Active Rate Indicators ............................................................. 62 Season Change ............................................................................................................ 62
Critical Peak Pricing .......................................................................................................................... 63 Load Profile ....................................................................................................................................... 63
Load Profile Specifications ...................................................................................................... 63 Load Profile Quantities ................................................................................................. 63 Capacity ........................................................................................................................ 64 Bit Resolution ................................................................................................................ 64 Interval Lengths ............................................................................................................ 64 Power Outage ............................................................................................................... 64
Channel Configuration ............................................................................................................ 64 Data Storage ........................................................................................................................... 65 Pulse Constants ...................................................................................................................... 66 Recording Duration ................................................................................................................. 66 Load Profile Self Reads .......................................................................................................... 67
Extended (Non-Billing) Energy and Load Profile............................................................................... 67 Extended Energy and Load Profile Specifications .................................................................. 68
Extended Energy and Load Profile Quantities ............................................................. 68
IT Department Technical Reference Guide ix Proprietary and Confidential

Contents
Capacity ........................................................................................................................ 68 Bit Resolution ................................................................................................................ 68 Interval Lengths ............................................................................................................ 68 Power Outage ............................................................................................................... 69
Channel Configuration ............................................................................................................ 69 Data Storage ........................................................................................................................... 69 Pulse Constants ...................................................................................................................... 70 Recording Duration ................................................................................................................. 71
Instrumentation Profile ...................................................................................................................... 71 Instrumentation Profile Specifications ..................................................................................... 72
Instrumentation Profile Capacity ................................................................................... 72 Available Quantities ...................................................................................................... 72 Power Outage ............................................................................................................... 73 Read Time Offset .......................................................................................................... 73 Interval Status Codes ................................................................................................... 73
Voltage Monitoring ............................................................................................................................ 75 Interval and Block Data ........................................................................................................... 76 Nominal Voltage Calculation ................................................................................................... 77
Service Type Handling .................................................................................................. 78 Threshold Monitoring .............................................................................................................. 79 Reconfiguration ....................................................................................................................... 79 Time Adjustment ..................................................................................................................... 80 DST Adjustment ...................................................................................................................... 80 Test Mode Operation .............................................................................................................. 80 Periodic Read .......................................................................................................................... 81 Voltage Monitoring Recording Duration .................................................................................. 81 Calculating Voltage Monitoring Size ....................................................................................... 82
Power Outage Notification (PON) and Restoration (PRN) ................................................................ 83 Outage .................................................................................................................................... 83 Restoration .............................................................................................................................. 83
Multiple Self Reads ........................................................................................................................... 83 Extended Self Read Data .................................................................................................................. 83 Event (History) Log ............................................................................................................................ 84
Download Events .................................................................................................................... 94 Security Events ....................................................................................................................... 95
Interrogation and Configuration ......................................................................................................... 97 Interrogation ............................................................................................................................ 97 Programming ........................................................................................................................... 98 Software Support .................................................................................................................... 98 Firmware Upgrades Over the Air ............................................................................................ 99 Firmware Upgrades Optically .................................................................................................. 99 Backward Compatibility ......................................................................................................... 100
Asset Synchronization ..................................................................................................................... 100
Chapter 5 Testing, Troubleshooting, and Maintenance ........................................ 102
Recommended Energy Testing Procedures ................................................................................... 102 Annunciators.................................................................................................................................... 102
Load Indication/Direction Annunciator .................................................................................. 102 Phase-Voltage Indication Annunciators ................................................................................ 102 Nominal Voltage Indication Annunciator ............................................................................... 102
Demand Testing .............................................................................................................................. 103 Demand Test Method ........................................................................................................... 103 Demand Calculations ............................................................................................................ 104
Calculation A: Actual Active Energy (kWh)................................................................. 104 Calculation B: Actual Active Demand (kW) ................................................................ 104
IT Department Technical Reference Guide x Proprietary and Confidential

Contents
Calculation C: Actual KVA Hours ............................................................................... 104 Calculation D: Actual kVA Demand ............................................................................ 105
Field Testing .................................................................................................................................... 105 Required Hardware ............................................................................................................... 105 Test Method Using Infrared Pulse Adapter ........................................................................... 105 Test Method Using a Snap Switch Assembly ....................................................................... 105
Visual Indicators .............................................................................................................................. 105 Infrared Test LED .................................................................................................................. 105
Troubleshooting ............................................................................................................................... 106 Fatal Errors ........................................................................................................................... 106
Fatal Error Recovery ................................................................................................... 106 List of Fatal Errors ...................................................................................................... 108
Non-Fatal Errors.................................................................................................................... 109 List of Non-Fatal Errors ............................................................................................... 110
Other Issues .......................................................................................................................... 111 Incorrect or No Accumulation of kWh or kW............................................................... 111 Blank Display .............................................................................................................. 111 Time and Date Wrong (TOU Version) ........................................................................ 112 On-Site Programmer Cannot Communicate with Meter ............................................. 112
Maintenance .................................................................................................................................... 112 Preventive Maintenance ....................................................................................................... 112 Corrective Maintenance ........................................................................................................ 113
Phasor Diagrams ............................................................................................................................. 114 Form 9S 4-Wire Delta ........................................................................................................... 114 Form 9S 4-Wire Wye ............................................................................................................ 115 Form 12S 3-Wire Network .................................................................................................... 116 Form 16S 4-Wire Delta ......................................................................................................... 117 Form 16S 4-Wire Wye .......................................................................................................... 118 Form 45S 3-Wire Delta ......................................................................................................... 119 Form 45S 3-Wire Network .................................................................................................... 120 Form 45S 4-Wire Delta ......................................................................................................... 121 Form 45S 4-Wire Wye .......................................................................................................... 122
Appendix A SiteScan On-Site Monitoring System ................................................ 123
SiteScan Service Sense Delay........................................................................................................ 123 Auto-Service Sensing ...................................................................................................................... 123 SiteScan Events .............................................................................................................................. 124 Override Auto Service Sensing ....................................................................................................... 125 SiteScan Meter Self-Diagnostic Checks ......................................................................................... 125 Diagnostic Logging .......................................................................................................................... 126 SiteScan System and Installation Diagnostic Checks ..................................................................... 126 Meter Services ................................................................................................................................ 128
3-Element Transformer Rated (Class 20): 9S ...................................................................... 128 2-Element Self Contained (Class 200 and Class 320): 12S ................................................. 130 3-Element Self Contained (Class 200 and 320): 16S ........................................................... 131 2-Element Transformer Rated (Class 20): 45S(5S).............................................................. 132 1-Element Self Contained (Class 100): 1S ........................................................................... 133 1-Element Self Contained (Class 200 and Class 320): 2S ................................................... 134 1-Element Transformer Rated (Class 20): 3S ...................................................................... 135 1-Element Transformer Rated Contained (Class 20): 4S ..................................................... 136
Phase Indicators .............................................................................................................................. 136 Voltage Service Indicator (120, 240, 277, 480) ............................................................................... 137 Diagnostic Error Triggering Mechanism (Diagnostics 1 - 4) ........................................................... 137
IT Department Technical Reference Guide xi Proprietary and Confidential
Contents
SiteScan Diagnostic #1 (Cross-Phase, Polarity, and Energy Flow Check) .................................... 137 Diagnostic #1 Error Example ................................................................................................ 139
SiteScan Diagnostic #2 (Phase Voltage Deviation Check) ............................................................. 141 Diagnostic #2 Error Example ................................................................................................ 142
SiteScan Diagnostic #3 (Inactive Phase Current Check) ................................................................ 144 Diagnostic #3 Error Example ................................................................................................ 145
SiteScan Diagnostic #4 (Low End Threshold Current) ................................................................... 146 Phase Angle Displacement Check........................................................................................ 147
Diagnostic #4 Error Example ...................................................................................... 148
Appendix B OpenWay HAN Communications ...................................................... 150
Overview .......................................................................................................................................... 150 Software Support .................................................................................................................. 150 Supported HAN Devices ....................................................................................................... 150 Joining HAN Devices ............................................................................................................ 151 HAN Device Messaging ........................................................................................................ 151 Demand Response and Load Control .................................................................................. 152 Securing HAN Communications ........................................................................................... 152 HAN Event Logs.................................................................................................................... 152
Dynamic Pricing Support ................................................................................................................. 155 Simple Recurring Price ......................................................................................................... 156
Glossary ..................................................................................................................... 157
Index ........................................................................................................................... 166
IT Department Technical Reference Guide xii Proprietary and Confidential

This technical reference guide describes the installation, operation, and maintenance of the OpenWay CENTRON meter (Hardware 2.0 and 3.x). The Itron OpenWay CENTRON meter is one component of the OpenWay System described in the OpenWay Collection Engine User Guide. In addition, refer to the OpenWay Tools User Manual. Itron urges you to read the entire manual before attempting installation, testing, operation, or maintenance of a meter.
About This Manual This manual contains the following information as listed in the chapter descriptions below:
Chapter Title Description
General Information Provides a general description, operation, physical and functional descriptions, as well as complete specifications.
Installation Gives instructions for the proper handling and installation.
Base Metrology Operations Describes the measurement techniques used for the base on the meter.
OpenWay Polyphase Register Operation
Provides a physical description and operational characteristics for the OpenWay Polyphase Register.
Testing, Troubleshooting, and Maintenance
Provides information and instructions to help in testing, troubleshooting and maintaining the meter.
General Description The OpenWay CENTRON polyphase meter is fully compliant with the ANSI C12.19 and C12.22 standards for storage and transport of register data over a network, providing a secure, open-standards approach to data collection and communications with the meter. In addition, each OpenWay CENTRON polyphase meter comes factory-equipped with a ZigBee radio chip to provide a built-in communications pathway to the home for data presentment, load control and demand response.
The OpenWay CENTRON polyphase meter also provides robust data storage capability to support time-of-use pricing, load profile data and other data-intensive applications, as well as the most advanced feature set available to support “Smart Grid” requirements. These features include full two-way communication, power outage detection and restoration notification, voltage monitoring, automatic tamper and theft detection, as well as the ability to reprogram the meter remotely and upload new firmware via the network.
C H A P T E R 1
General Information
IT Department Technical Reference Guide 1 Proprietary and Confidential

General Information
OpenWay System Overview The OpenWay implementation includes three distinct communication technologies and two communication protocols. ANSI C12.22 is used as the communication protocol from the OpenWay Collection Engine to the OpenWay CENTRON meter. Web Services are used to communicate from the Collection Engine to all upstream applications including Meter Data Management (MDM). The communication technologies used are:
• TCP/IP is used to communicate between the OpenWay Cell Relay and the Collection Engine
• Itron proprietary RFLAN (unlicensed 900MHz frequency) is used to communicate between the cell relay and the OpenWay CENTRON meter
• ZigBee® wireless technology is used to communicate to in home devices and gas odules
IPv6 Network SR5.5 uses a completely open implementation of the IP stack throughout the smart grid architecture to provide utilities with a secure, reliable, and scalable communication network. This network enables a diverse set of uses such as smart metering, distribution automation, asset management, workforce automation, electric vehicles, and distributed generation and storage.
Key elements of the IPv6 architecture are:
• Cisco Connected Grid Network Management System (CG-NMS)
• IPv6 Field Area Network
• Cisco Connected Grid Router (CGR)
IT Department Technical Reference Guide 2 Proprietary and Confidential

General Information
Network Management The Cisco Connected Grid Network Management System (CG-NMS) is a Fault, Configuration, Accounting, Performance, Security (FCAPS) software platform used to manage network elements such as the Connected Grid Routers and IPv6 enabled meters (HW3.1 +). CG-NMS is a scalable and open platform with pluggable architecture designed to enable a secure, multi-service network and security infrastructure for smart grid applications.
CG-NMS is built around a layered system architecture that enables clear separation between network management functionality and smart grid applications. Smart grid applications have varied requirements in terms of latency, bandwidth, and traffic patterns. The CG-NMS architecture enables multiple traffic patterns, such as hub-and-spoke and peer-to-peer communications, and provides highly differentiated services and network traffic management for those applications.
Field Area Network Secure and scalable, Itron’s multi-service communication platform interconnects smart grid applications and devices across the HAN, FAN, and WAN tiers of the architecture.. A clean, end-to-end implementation of the Cisco IPv6 architecture makes the platform technology capable of incorporating multiple networks, applications, and devices within a single, unified communications architecture.
This means implementing open standards at every layer of the Open Systems Interconnection (OSI) model rather than simple IP addressing or a proprietary IP veneer. Standardization at all levels of the FAN ensures device and system interoperability.
The use of IPv6 enables common application layer services over various wired and wireless communication technologies.
IT Department Technical Reference Guide 3 Proprietary and Confidential

General Information
Connected Grid Router The FAN is enabled by the Cisco Connected Grid Router. The 1000 Series Connected Grid Router (CGR) is a portfolio of ruggedized communications platforms optimized for use in FAN applications such as smart metering, distribution/feeder automation, and distributed generation. The modular CGR serves as the collection device for various neighborhood area network (NAN) technologies (i.e. RF Mesh).
The CGR 1000 Series provides grid operators with the benefits of converged networking, distributed intelligence, improved security, manageability, and network reliability.
Key features include:
• 4-slot router designed for pole-top installations with a rugged NEMA 4 (IP 67) enclosure for deployment in extreme weather
• Modular interfaces that support a wide range of connectivity options such as RF Mesh, Powerline Communications (PLC), 3G Mobile, and WiMAX
• Integrated switch for LAN connectivity and serial ports for legacy devices
• Integrated AC/DC power supply supporting a wide voltage range for worldwide use
• Integrated Wi-Fi for wireless router configuration with future upgrade to allow managing other devices connected to the router
• Integrated GPS function for tracking theft and physical security along with provision for tamper detection alarms
IT Department Technical Reference Guide 4 Proprietary and Confidential

General Information
C12.22 Network The ANSI C12.22 OpenWay implementation includes three distinct communication technologies and two communication protocols. ANSI C12.22 is used as the communication protocol from the OpenWay Collection Engine to the OpenWay CENTRON meter. Web Services are used to communicate from the Collection Engine to all upstream applications including Meter Data Management (MDM). The communication technologies used are:
• TCP/IP is used to communicate between the OpenWay Cell Relay and the Collection Engine
• Itron proprietary RFLAN (unlicensed 900MHz frequency) is used to communicate between the cell relay and the OpenWay CENTRON meter
• ZigBee® wireless technology is used to communicate to in-home devices and gas modules
OpenWay Collection Engine (CE) The OpenWay Collection Engine is an ANSI C12.22-based system which provides the interface between upstream applications, such as Meter Data Management and the OpenWay network. Communications between the OpenWay Collection Engine and other web service oriented software are handled through web services. All command and control as well as data acquisition from the OpenWay network is handled by the Collection Engine. The Collection Engine maintains information concerning the RFLAN, network cells, and their contents, such as the cell location of each meter and its C12.22 address. The OpenWay Collection Engine, however, does not store any data. All data storage must be done by upstream software such as a Meter Data Management system.
The OpenWay Collection Engine allows for communication to a single meter or through a multicast/broadcast to groups of meters. Additionally, the OpenWay Collection Engine provides access to direct IP connected meters.
IT Department Technical Reference Guide 5 Proprietary and Confidential

General Information
Collection Engine to Meter Security The Collection Engine is responsible—in conjunction with the security appliances—for supporting the integrity of the control of the system. As a result, asymmetric cryptography is supported for command and control messages. Every node in the system has a set of asymmetric keys that are used for authentication and non-repudiation functions. Initial meter registration involves a key exchange process that establishes mutual authentication based upon a Diffie-Hellman exchange. When sending out messages, the C12.22 payload is signed and encrypted before being wrapped in the C12.22 protocol. This is accomplished by the integrated Signing and Encryption appliance.
As control over this operation is absolutely critical to ensuring control over the system, the Signing and Encryption Server will never expose the signing key. When the meter communicates information upstream to the Collection Engine, the C12.22 messages are encrypted to protect the confidentiality of data and decrypted by the DKUS appliance.
An overview of this exchange is depicted in the figure below.
IT Department Technical Reference Guide 6 Proprietary and Confidential

General Information
OpenWay RFLAN The OpenWay Radio Frequency LAN (RFLAN) is a proprietary frequency-hopping RF network deployed in North America, using the 900 MHz ISM band. Messages are transmitted in accordance with the ANSI C12.22 protocol, and are encrypted using 128-bit shared AES keys and signed using 256-bit ECC private keys.
The figure below depicts an OpenWay cell formed with 4 levels in the RFLAN network.
Figure 1: OpenWay RFLAN
Data is passed to/from the Collection Engine to a Cell Relay through IP Protocol and from the Cell Relay to the specific endpoint via the RFLAN.
IT Department Technical Reference Guide 7 Proprietary and Confidential

General Information
Priority Network Traffic Handling Routine network traffic, including periodic read responses, exception notifications (alarms) and registration requests, may at times prevent successful communication of high priority events/exceptions from reaching endpoints in the OpenWay RFLAN network. High priority traffic might include requests such as service limiting overrides.
To ensure that high priority traffic is not impeded, the OpenWay register firmware can disable sending unsolicited messages from the meter to allow the higher priority traffic to pass and then re-enable the sending of other messages. Messages that can be disabled include periodic read responses and all exception notifications and registration requests. The period when unsolicited messages are disabled is called the blanking period.
The procedure to disable unsolicited messages includes the fixed number of minutes to disable the unsolicited communication. The procedure to re-enable unsolicited messages resets the parameter value to zero.
A history event is logged at the start of the blanking period and contains the number of minutes specified for the duration. No additional history event is made for messages that are discarded as a result of this procedure since this log entry defines processing.
The blanking message will be broadcast (or multicast) several times in order to reach all target endpoints. If multiple requests to disable unsolicited messages are received during the blanking period, the new received duration will take effect with each received disable request, possibly extending or reducing the length of the blanking period. A history event is logged for each message received.
Effect on message types during the blanking period:
• Direct responses to messages that request responses (for example, interactive reads) will not be affected. The meter will continue to respond to these messages.
• Periodic read responses and interrogation responses will be disabled.
• Any pending periodic read will be unscheduled.
• Registration attempts that are scheduled to occur during the blanking period will be rescheduled as if the registration request were sent and no response received. Registration attempts would otherwise be possible due to cell migration.
• Exceptions that are configured to be sent will be discarded. Any pending events already in the randomized exception queue will also be discarded.
• Power outage notification exceptions will not be effected by the blanking period. These events are generated independently by the RFLAN communications module. If these events need to be disabled, firmware changes would be needed in the RFLAN firmware to support that.
Effect on message types at the end of the blanking period:
• Periodic read responses and interrogation responses will not be rescheduled. A new manufacturers procedure 39 request will be required from the Collection Engine to cause a periodic read or interrogation response.
• Registration attempts will be allowed and will occur at the next scheduled time.
IT Department Technical Reference Guide 8 Proprietary and Confidential

General Information
• New exceptions that occur will be sent as normal.
Exceptions supported by the OpenWay register:
• Fatal Error*
• Time Adjustment Failed
• Load Voltage Present
• Connect Relay Activated
• Disconnect Relay Activated
• Connect Failed
• Configuration Error
• Demand Reset
• Register Download Failed
• RFLAN Download Failed
• ZigBee Download Failed
• Firmware Download Failed
• PowerUp
• Self Read
• Pending Table Full
• Pending Table Clear Failed
• Pending Table Swap
• Removal Tamper
• Inversion Tamper
• Reverse Power Flow Error
• Tamper Cleared
• Voltage Below Low Threshold
• Voltage Above High Threshold
• VH Below Low Threshold
• VH Above High Threshold
• Base Mode Error
• HAN Device Added or Removed
• HAN Load Control Event Exception
(*) Note: After a fatal error, the meter normally does a core dump and then resets into a safe configuration. In this case, any blanking period in effect will be canceled.
IT Department Technical Reference Guide 9 Proprietary and Confidential
General Information
RFLAN Range Extender The RFLAN Range Extender is a lightweight watertight device that can be installed in a variety of wall or pole-mounted configurations such as vertical poles or horizontal davit arms for optimal range communication effectiveness and range. The RFLAN Range Extender increases the effective transmission range of devices within the network. The RFLAN Range Extender collects data from devices within the OpenWay RFLAN and transmits it to other devices within the network.
The range extender can be used to:
• Fill holes in areas where an additional RFLAN node will strengthen network self healing capabilities, and/or eliminate the need for an additional Cell Relay to be deployed.
• Overcome network problems caused by environmental changes (i.e. building constructed in the middle of a cell) in lieu of moving or adding Cell Relays.
The range extender firmware can be upgraded transparent to the system - the same way firmware in metering devices is upgraded. The extender includes a ZigBee interface for configuration and local diagnostic purposes.
For more information, see the RFLAN Range Extender User's Guide.
RFLAN and Cell Relay Communications The Collection Engine interfaces with meters through cell relays. Firewalls are recommended between portions of the system; however, the OpenWay architecture requires full two-way communication between the Collection Engine and the Cell Relay. The Collection Engine can be placed behind a firewall and still allow traffic on port 1153 (C12.22) to pass through. The Collection Engine needs to be able to access its database instance as well as the enterprise management system and the meter data management application. These applications may be behind additional firewalls, or they may be on the same network as the Collection Engine, provided the Collection Engine has full two-way access to the appropriate ports for data transfer. This initial communication is done using TCP/IP. As either the Collection Engine or the cell relay can initiate communications, both products must accept incoming C12.22 messages on TCP/IP port 1153. The Collection Engine listens on port 1153 for C12.22 communication and monitors the network for Web services calls.
IT Department Technical Reference Guide 10 Proprietary and Confidential

General Information
OpenWay Home Area Network (HAN) Each meter is equipped with a ZigBee radio used for communications in the Home Area Network. The HAN communicates over the unlicensed 2.4 GHz frequency band. Up to 10 HAN devices are allowed to join to the meter. The 10 supported HAN devices can be any combination of gas modules and provisioned HAN devices.
Below is a model of how ZigBee can be used to communicate with devices in the home as well as gas meters.
In the figure above the ZigBee network is used to provide the following services:
• Load Control/Demand Response
• In-home Display of Electricity Usage
• Communications to Gas Meter
HAN Device Mirroring The ZigBee Smart Energy Profile provides a mechanism for communicating sub-metered data such as gas consumption as reported by an Itron gas module. Once the data is received by the electricity meter, it can be sent upstream over the AMI network to a billing system through the Collection Engine.
The OpenWay CENTRON meter currently only supports mirroring for Itron gas modules.
Event Storage The meters store and deliver Demand Response Load Control (DRLC) events scheduled by the Collection Engine to HAN devices so that electricity load shedding can be coordinated to reduce peak usage. The meter can store a maximum of 10 scheduled DRLC events.
Gas Module Configuration The meter provides a mechanism for changing the way gas consumption is reported - daily, hourly, historical (40 days in the past). The Collection Engine puts one or more commands into a specified meter memory area for each individual gas module and the meter communicates these commands to the gas module.
IT Department Technical Reference Guide 11 Proprietary and Confidential

General Information
Gas Module Firmware Download The meter provides support to securely download firmware to the Itron gas modules bound to it. The progress of the gas module firmware download is tracked. Gas modules can join an ongoing download process if they join the meter after it has been initiated, and gas modules leaving the meter afterwards are removed from the download queue. The meter supports multiple downloads of a gas module firmware image to it, with each download overwriting any existing image and thus interrupting the latter’s transfer to gas modules. Gas modules that have not yet activated the previous image will start downloading the most recent image.
Note The battery life for a gas module is determined by how many ZigBee packets are sent and received by the gas module. Each time gas module firmware is pushed to a gas module, battery life will be reduced because it requires many extra ZigBee packets to be sent and received and each requires additional power that was not factored into battery life calculations.
HAN Join/Rejoin/Disable The process of the Collection Engine providing the MAC address and Install Code for the HAN device to the meter is known as provisioning. Each meter must be provisioned prior to allowing a HAN device to join.
Joining is the process of the HAN device finding and negotiating with the meter to establish the Zigbee SEP1.x capabilities of the meter and the HAN device and a secure communications key to encrypt data traffic between the HAN device and the meter.
Rejoining is the process of a HAN device attempting to regain communication with a meter that it has previously joined. Thus, the rejoining process is abbreviated in comparison with the joining process in that fewer things have to happen to rejoin.
Disabling ZigBee is the action of turning the ZigBee radio ‘off’ so that it cannot transmit or receive ZigBee traffic.
Itron gas modules join the meter using a different process than normal HAN devices.
The Itron Private Profile (IPP) gas module joins the meter using the secure rejoin process which does not require that the gas module be provisioned. A regular HAN device may join a HAN supported by the meter only after it has been provisioned to the meter and when the meter has received a request from the head-end system to start allowing HAN devices join the meter. The HAN device will start the joining process by requesting all meters to respond to the HAN device’s request for a ‘beacon’ or statement of the meter’s SEP 1.x capabilities and willingness to allow a HAN device to join the meter. If the meter has been told to allow a device to join, the HAN device then starts a negotiation process to make sure that it has been provisioned to that meter and then to establish an encryption key between the meter and the HAN device. This process is known as Certificate Based Key Exchange (CBKE). Once the HAN device successfully completes CBKE, it is commissioned to the meter (establish full, secure communications with the HAN). If it fails CBKE, the HAN device attempts to join another meter.
The meter can decommission a HAN device by sending the HAN device a command to 'Leave' the network.
IT Department Technical Reference Guide 12 Proprietary and Confidential

General Information
The number of supported HAN devices (including gas modules) is limited to 10 HAN devices.
HAN Multiplier The meter provides the capability to program the CT, VT and Register Multiplier Values into the HAN so they can be sent to the In Home Display or other ZigBee devices. The meter stores one Multiplier and one Divisor. The OpenWay Tools (OpenWay Field-Pro) software provides the ability to write in the Multiplier and Divisor.
Tiered Pricing The meter stores pricing data that is used by the HAN devices for display on in-home displays. These prices are written to the meter by the Collection Engine. The meter shares the price data with the HAN devices. This data is also available in OpenWay Field-Pro; the HAN pricing data screen shows a list of prices and tiers for the HAN devices.
The meter provides a storage location to which the CE can write price information (tiered price labels and pricing value) known as the Pricing Cluster. The prices include labels that are reported to the in-home display device so that customers get some information about the price through the label, for example, Time Of Use 1 (TOU1) or CPP, etc.
Tiered Pricing is a set of up to five scheduled prices each with a specified duration. These prices can exist on a schedule as well as a pending pricing table that can replace it upon the activation date of the pending price table.
Only one price can be active at a time and each price only lasts for the assigned duration in the price table, as defined by the collection engine.
Residential Inclining Block Pricing As of SR3.9 SP1, the OpenWay CENTRON meter supports residential inclining block pricing which is a consumption-based pricing model where a consumer is given a fixed kWh price for a fixed number of kWhs and once that threshold is exceeded, the price is raised.
The meter maintains the price information and tracks the electricity consumption so that In-Home Displays that can understand the data, can present it to the consumer to track energy usage and billing costs for the current billing period.
IT Department Technical Reference Guide 13 Proprietary and Confidential

General Information
HAN Security SEP 1.x HAN encryption uses two security key levels to encrypt data: Network Key and Application Presentation Session (APS) Link key.
Network Key The Network Key is a pre-defined key that is placed in each meter and is used to encrypt network layer communications. This key will be the same for all devices on the meter, thus, all network layer communications that occur on the home area network.
APS Link Key The APS Link key is derived from the Install Code for the Smart Energy digital certificate of a HAN device and the meter’s Smart Energy certificate. This key is used to encrypt application layer communications between a single HAN device and the meter. Knowing one key does not help you to determine the APS link key for any other HAN device-to-meter communications stream.
As shown in the graphic above, the APS Link key encrypts the information in the application layer (along with the presentation and session layers) to ensure that communication between the meter and the HAN device that is specific to ZigBee Smart Energy Profile 1.x data, is secured between the two devices.
In addition, the Network Key encrypts all of the data in the layers above it, creating a sort of double encryption. Thus, even if the Network Key is known, the SEP1.x data are still secure while it is protected by the APS Link Key.
IT Department Technical Reference Guide 14 Proprietary and Confidential

General Information
OpenWay Enhanced Security Securing the OpenWay system involves being able to sign command messages, encrypt and decrypt messages, audit the security activities, audit the events being returned by the meter, manage the keys, and manage the larger set of security components deployed with the system. With this in mind, the security architecture for OpenWay includes the following specific security components:
• Industrial Defender 300B Security Event Monitoring
• Certicom AMI 7100 Signing and Encryption Server
• Certicom AMI 7200 Decryption and Key Update Server with Key Management Server
Downstream messages from the Collection Engine to the meter are encrypted using an AES-128 bit key and signed using an ECC-256 bit key. For the Collection Engine, the security architecture allows for broadcast and multicast communications, where a single message from the Collection Engine can direct behavior for a large number, potentially millions, of meters simultaneously. This has the advantage over a point-to-point system in which every meter needs a message from the Collection Engine. For the OpenWay system, signature verification and decryption is pushed out to the meters in a distributed fashion. The meter processes these security functions in milliseconds once the command is received. Thus, while each meter will need to validate the signature on the message to ensure its authenticity, those validations occur in parallel. The result is very little latency is ever added to a group operation no matter how many meters are involved. At the Collection Engine, the system can easily sign and encrypt 200 operations per second.
Upstream messages from the meter to the Collection Engine are encrypted with an AES-128 bit key. The OpenWay architecture is optimized such that an IP load balancer shapes the ingress traffic, distributing it equally among the Collection Engine subcomponents for processing. The Collection Engine unwraps the network portion of the packet and passes the payload to the Certicom AMI 7200 Decryption and Key Update Server for processing. This appliance is scaled to decrypt 24,000 messages per second. From a scalability perspective, this maps out to over a million meters per minute processing.
Cryptographic processing at the meter is done using libraries provided by Certicom. These libraries include the algorithms recommended by the National Security Agency under their "Suite B" recommendations for commercial security. Elliptic Curve Cryptography (ECC) provides the most security per bit of any known public-key scheme.
Industrial Defender 300B Security Event Monitoring The Industrial Defender 300B component provides the ability to collect, correlate and analyze audit events to allow detection of intrusions and attacks. Examples of audit events include: device reprogramming, device authentication failure, signature verification failure, message decryption failure, home area network traffic rate exceeding threshold, device firmware upgrade and various HAN and LAN messages. These events are primarily generated at the meter or from WAN devices and sent to the OpenWay Collection Engine. The Collection Engine translates these lower level protocol alerts into API calls for submission to the security event monitor.
IT Department Technical Reference Guide 15 Proprietary and Confidential

General Information
Certicom AMI 7100 Signing and Encryption Server The Signing and Encryption Server is responsible for securing command messages being sent from the Collection Engine to the meters. As a result, the number of keys managed for these messages is quite small, potentially as little as two keys that need active control. However, these keys must be very tightly controlled to ensure that the system is not compromised. The private signing key of the Collection Engine is never exposed in raw form, though there are facilities to back it up. To protect the keys, the Signing and Encryption Server includes an integral Hardware Security Module (HSM). The HSM is FIPS 140-2 level 3 compliant, meaning that it is government-certified to protect the keys it contains against both physical and electronic attacks.
Certicom AMI 7200 Decryption and Key Update Server This component provides rapid message decryption and comprehensive key management. Messages coming from the meters to the Collection Engine need to be quickly decrypted. In a large-scale OpenWay implementation, the system can decrypt more than 1,000 messages a second, each with its own unique key. While the messages are small, over the course of several hours, the system may need to decrypt messages using between 5 and 10 million unique AES keys. The solution must be able to quickly handle accessing millions of keys, decrypting thousands of messages and passing them on to the Collection Engine.
C12.22 and Meter Security The C12.22 architecture plays an important role regarding the implementation of security. The major benefit of the design of a C12.22 network is that the CE interfaces at an application level protocol layer, enabling both session- and sessionless-based communication directly to the meter register. Unlike designs tied to a single communications network, with OpenWay the security architecture does need to change if the communication architecture changes. For example, an IP based network may provide IP communications and security to the NIC (Network Interface Card); however, after decrypting the message, another security function may be required for the NIC card to communicate using a C12.18 protocol for logging on to the register of the meter. An unfortunate consequence of this process is reduced reliability and the inability to perform simultaneous functions during the session.
OpenWay also benefits from the ability to perform broadcast and multicast communications to meters, minimizing the amount of messages that require encryption and processing, as opposed to sending multiple messages point to point to meters.
Security Standards The OpenWay security architecture is designed to support North American Electric Reliability Corporation (NERC) Critical Infrastructure Protection (CIP) requirements for critical cyber assets. In order to address this design criterion, OpenWay also supports the following security standards for security controls and functions.
• Designed to adhere to NSA Suite B requirements, including:
• FIPS 197 approved encryption algorithms
• FIPS 186-2 approved signature algorithms
• FIPS 180-2 approved hashing algorithms
IT Department Technical Reference Guide 16 Proprietary and Confidential

General Information
• Meets FIPS 140-2 Level 3 for cryptographic modules
Meter Tampering Hardware 3.x meters contain an accelerometer. This replaces the tilt switch found in Hardware 1.x and Hardware 2.x meters. The linear accelerometer sensor is a Micro-electronic Mechanical Sensor (MEMS) and detects motion in three planes. It detects tamper removal and inversion as well as angle of installation with equal or better accuracy than previous solutions.
The meter takes a reference reading of all three axes when installed and readings are retained. If the meter detects a change from reference on at least one of the planes and no outage is associated with it, the variation is communicated to the Meter Data Management (MDM) system.
Canadian Metering Support Electric smart meters being deployed in the Canadian market are sealed in accordance with Measurement Canada’s requirements of the Electricity and Gas Inspection Act and Regulations. Measurement Canada requires two types of seal on a smart meter. One is the physical seal which prevents physical tampering to the interior, adjustments, or controls of a meter; the other is the software seal which prevents reconfiguring, resetting (such as reset energy to zero) or modifying billing registers (such as energy) while the meter is physically sealed. Only demand quantities are resettable on a physically sealed meter. Additionally, to allow for over-the-air firmware updates, the meter must demonstrate that all billing registers are being preserved and have not been tampered with because of the firmware updates.
A bit in the meter can be set to enable it to be supported in Canada. Setting this bit can only be done in the factory. Once the bit is set, the meter is sealed.
A smart meter designed for the Canadian market is unable to do the following:
• Set Energy
• Configure Demand (even if identical to current)
• Configure Energy (even if identical to current)
• Configure Load Profile (even if identical to current)
• Clear Billing Registers
• Clear Base Values
• Clear Self Read
• Clear Event Log
• Clear History Log
• Clear Load Profile
IT Department Technical Reference Guide 17 Proprietary and Confidential

General Information
These meters load the register with base values upon every power up in order to ensure the register matches the base. In addition, the event log will return the Event Number and Sequence Number regardless if it is a sealed or non-sealed meter.
Physical Description The features a common meter base. The cover is polycarbonate.
Meter Components The figure below shows the major components of the OpenWay CENTRON polyphase meter.
IT Department Technical Reference Guide 18 Proprietary and Confidential
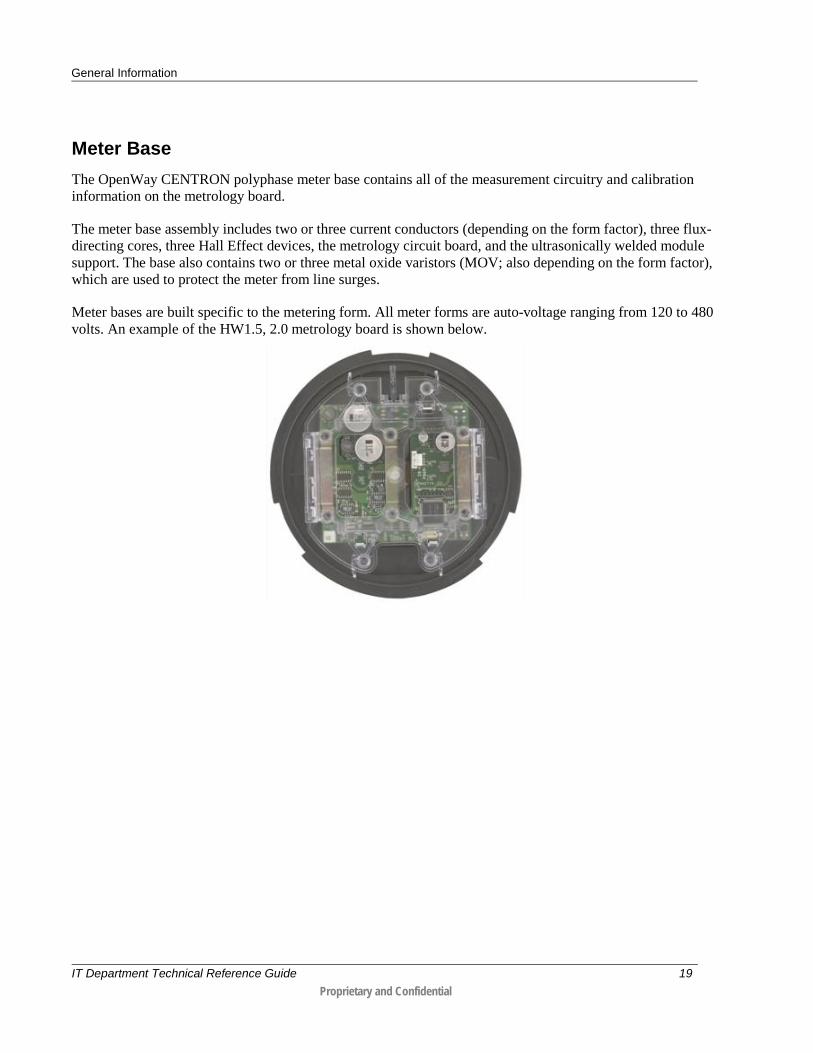
General Information
Meter Base The OpenWay CENTRON polyphase meter base contains all of the measurement circuitry and calibration information on the metrology board.
The meter base assembly includes two or three current conductors (depending on the form factor), three flux-directing cores, three Hall Effect devices, the metrology circuit board, and the ultrasonically welded module support. The base also contains two or three metal oxide varistors (MOV; also depending on the form factor), which are used to protect the meter from line surges.
Meter bases are built specific to the metering form. All meter forms are auto-voltage ranging from 120 to 480 volts. An example of the HW1.5, 2.0 metrology board is shown below.
IT Department Technical Reference Guide 19 Proprietary and Confidential

General Information
Modular Assembly The OpenWay CENTRON polyphase meter contains a Metrology board, a Register board, and an Option board (if installed). A board-to-board-to-board (B3B) connector provides signal and power connections between the boards. From the base metrology, the energy and instantaneous data is transmitted to the register module, which contains the meter display, RFLAN transceiver, ZigBee transceiver, and all register functionality.
Currently, the only option board available for the OpenWay CENTRON polyphase meter is the Input/Output (KYZ) board. Alternatively, the Option board slot can be used by Third Party developers. For more information, prospective Third Party developers should contact Itron Metering Product Support.
IT Department Technical Reference Guide 20 Proprietary and Confidential

General Information
Product Availability The current offerings for the OpenWay CENTRON Polyphase meter are:
Metrology Class Elements Wires Voltage Test Amps
1S1 100 1 2 120-480 15
2S1 200 1.5 3 120-480 30
2S1 320 1.5 3 120-480 50
3S1 20 1 2 120-480 2.5
4S1 20 2 3 120-480 2.5
9S(8S) 20 3 4 120-480 2.5
9S(8S)/36S 20 3 4 / 3 120-480 2.5
45S/5S 20 2.5 3 120-480 2.5
12S 200 2 3 120-480 30
12S 320 2 3 120-480 50
16S(14S,15S,17S) 200 3 4 120-480 30
16S(14S,15S,17S) 320 3 4 120-480 50
1These meter forms are only available in Hardware 3.0.
Output Options The OpenWay CENTRON polyphase meter supports 2 KYZ output channels and 1KY output channel either on a bare leads pigtail, DB9, or Viking connector. Each channel is rated to switch up to 240V AC RMS or 400V DC. The outputs can switch 100mA maximum; either AC or DC current. Each channel provides 2500V AC RMS isolation between the output cables and the meter circuitry.
IT Department Technical Reference Guide 21 Proprietary and Confidential

General Information
Serial Number A unique Electronic Serial Number (ESN) is assigned to each meter so that specific meters can be identified across all manufacturers and product lines. Part of the ESN (meter or cell relay serial number) is indicated on either the meter nameplate and/or the identification sticker below (located on the side of a cell relay meter).
Figure 2: Serial Number
The endpoint serial number is the human readable meter identifier located on the nameplate and below the barcode on the face of the meter. The illustration shows a meter serial number as it appears on the cover of a meter and in an OpenWay Collection Engine UI endpoint details report. The serial number is used by the OpenWay Collection Engine to identify a meter (endpoint).
1. Serial number: A serial number is assigned by the manufacturer of the meter.
2. Electronic Serial Number (ESN): The ESN is a globally unique Universal Object Identifier. The ESN is a much longer number, which includes the meter serial number in the final segment.
IT Department Technical Reference Guide 22 Proprietary and Confidential
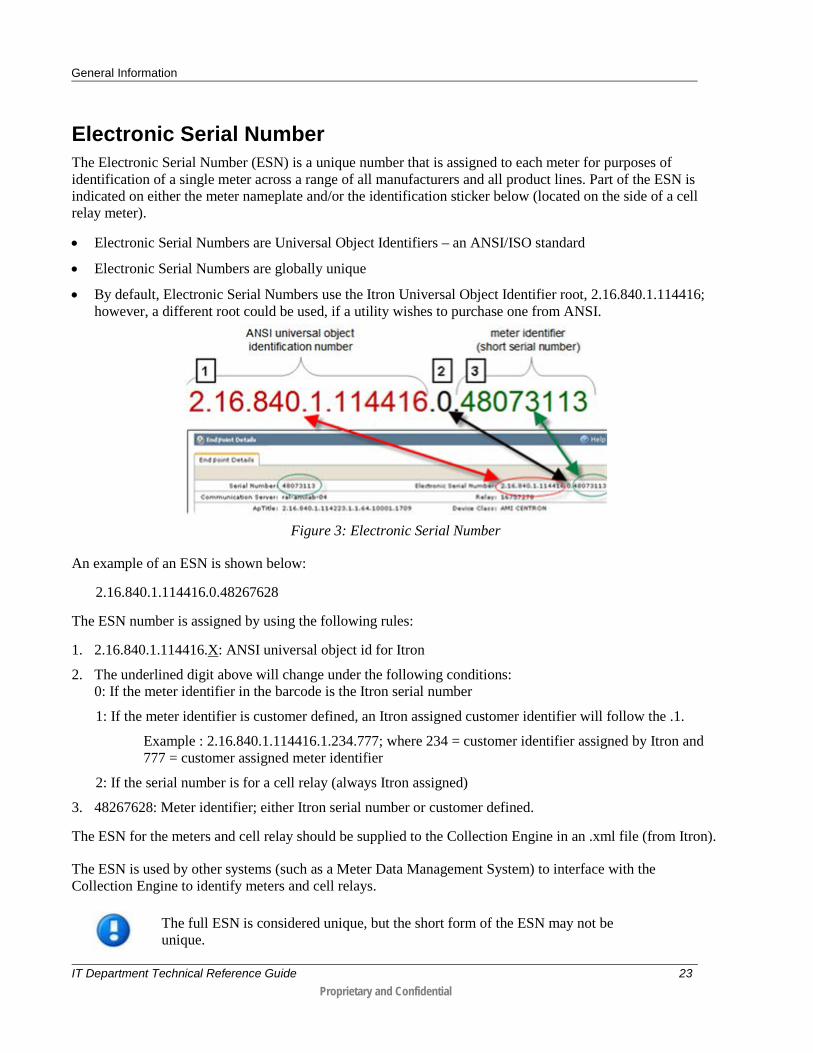
General Information
Electronic Serial Number The Electronic Serial Number (ESN) is a unique number that is assigned to each meter for purposes of identification of a single meter across a range of all manufacturers and all product lines. Part of the ESN is indicated on either the meter nameplate and/or the identification sticker below (located on the side of a cell relay meter).
• Electronic Serial Numbers are Universal Object Identifiers – an ANSI/ISO standard
• Electronic Serial Numbers are globally unique
• By default, Electronic Serial Numbers use the Itron Universal Object Identifier root, 2.16.840.1.114416; however, a different root could be used, if a utility wishes to purchase one from ANSI.
Figure 3: Electronic Serial Number
An example of an ESN is shown below:
2.16.840.1.114416.0.48267628
The ESN number is assigned by using the following rules:
1. 2.16.840.1.114416.X: ANSI universal object id for Itron
2. The underlined digit above will change under the following conditions: 0: If the meter identifier in the barcode is the Itron serial number
1: If the meter identifier is customer defined, an Itron assigned customer identifier will follow the .1.
Example : 2.16.840.1.114416.1.234.777; where 234 = customer identifier assigned by Itron and 777 = customer assigned meter identifier
2: If the serial number is for a cell relay (always Itron assigned)
3. 48267628: Meter identifier; either Itron serial number or customer defined.
The ESN for the meters and cell relay should be supplied to the Collection Engine in an .xml file (from Itron).
The ESN is used by other systems (such as a Meter Data Management System) to interface with the Collection Engine to identify meters and cell relays.
The full ESN is considered unique, but the short form of the ESN may not be unique.
IT Department Technical Reference Guide 23 Proprietary and Confidential

General Information
Specifications
Electrical Voltage Rating 120 - 480V Operating Voltage ± 20% (60 Hz); ± 10% (50 Hz) Frequency 60 Hz, 50 Hz Operating Range ± 3 Hz Battery Type: Voltage (HW 1.5 and 2.0) Operating Range: Shelf Life: Voltage (HW 3.0) Operating Range: Shelf Life:
TADIRAN type TL-4902 3.6 V nominal; 3.4 V - 3.8 V 20 years minimum 3.3 V nominal; 3.1 V - 3.8 20 years minimum
Characteristic Data Temperature Rise Meets ANSI C12.1 Section 4.7.2.9
Operating Environment Temperature -40°C to +85°C Humidity 0% to 95% non-condensing Accuracy ± 0.2% @ unity power factor; ± 0.2% @ 50% power factor
Transient/Surge Suppression
ANSI C62.45 - 1992 IEC 61000-4-4
IT Department Technical Reference Guide 24 Proprietary and Confidential

General Information
Burden Data Hardware 2.0 Meter
Values shown are after the meter has registered to an OpenWay Cell Relay and no communications are active on the LAN or ZigBee transmitters.
Meter Form Watt Loss VA Loss Test At Voltage 9S
1.6 2.5 120
2.2 3.6 240
3.9 6.1 480
12S 1.5 2.4 120
1.9 3.2 240
3.1 5.3 480
16S 1.6 2.5 120
2.2 3.6 240
3.8 6.0 480
9S/36S 1.6 2.5 120
2.2 3.6 240
3.9 6.2 480
45S 1.5 2.4 120
2.0 3.3 240
3.6 5.8 480
IT Department Technical Reference Guide 25 Proprietary and Confidential

General Information
Hardware 3.0 Meter Tested at 120 Volts
Meter Form
Meter Class
Watt Burden Normal Operation (No Transmission)
VA Burden Normal Operation (No Transmission)
Additional Watt Burden LAN Transmission
Additional VA Burden LAN Transmission
1S 100 1.99 3.79 0.12 0.17
1S1 200 2.12 5.86 0.26 0.45
2S 200/320 1.95 3.83 0.13 0.19
3S 20 2.02 3.93 0.12 0.16
3S1 20 1.86 7.01 0.21 0.46
4S 20 2.00 3.77 0.05 0.10
9S 20 1.89 3.68 0.21 0.28
12S 200 1.74 3.44 0.31 0.52
12S1 200 2.21 6.17 0.39 0.60
16S 200 1.88 3.62 0.26 0.42
45S(A) 20 1.99 3.85 0.34 0.49
1 Non Auto-Ranging
Meter Form
Meter Class
Additional Watt Burden ZigBee Transmission
Additional VA Burden ZigBee Transmission
1S 100 0.01 0.01
1S1 200 0.01 0.01
2S 200/320 0.01 0.01
3S 20 0.01 0.01
3S1 20 0.02 0.06
4S 20 0.01 0.01
9S 20 0.01 0.02
12S 200 0.03 0.07
12S1 200 0.07 0.07
16S 200 0.03 0.08
45S(A) 20 0.02 0.03
1 Non Auto-Ranging
IT Department Hardware 3.0 Meter 26 Proprietary and Confidential

General Information
Tested at 480 Volts
Meter Form
Meter Class
Watt Burden Normal Operation (No Transmission)
VA Burden Normal Operation (No Transmission)
Additional Watt Burden LAN Transmission
Additional VA Burden LAN Transmission
1S 100 2.91 6.46 0.14 0.30
2S 200/320 3.14 6.80 0.14 0.30
3S 20 2.97 6.69 0.10 0.41
4S 20 3.14 6.63 0.10 0.21
9S 20 2.79 6.36 0.29 0.69
12S 200 2.91 6.11 0.25 0.63
16S 200 3.22 6.54 0.29 0.71
45S(A) 20 3.10 6.59 0.26 0.60
Meter Form
Meter Class
Additional Watt Burden ZigBee Transmission
Additional VA Burden ZigBee Transmission
1S 100 0.01 0.01
2S 200/320 0.01 0.01
3S 20 0.01 0.05
4S 20 0.01 0.01
9S 20 0.01 0.01
12S 200 0.01 0.05
16S 200 0.01 0.13
45S(A) 20 0.02 0.16
Tested at 240 Volts
Meter Form
Meter Class
Watt Burden Normal Operation (No Transmission)
VA Burden Normal Operation (No Transmission)
Additional Watt Burden LAN Transmission
Additional VA Burden LAN Transmission
2S1 200 2.64 9.91 0.16 0.39
3S1 20 1.94 14.29 0.26 1.19
4S1 20 2.03 14.28 0.26 1.14
1 Non Auto-Ranging
IT Department Hardware 3.0 Meter 27 Proprietary and Confidential
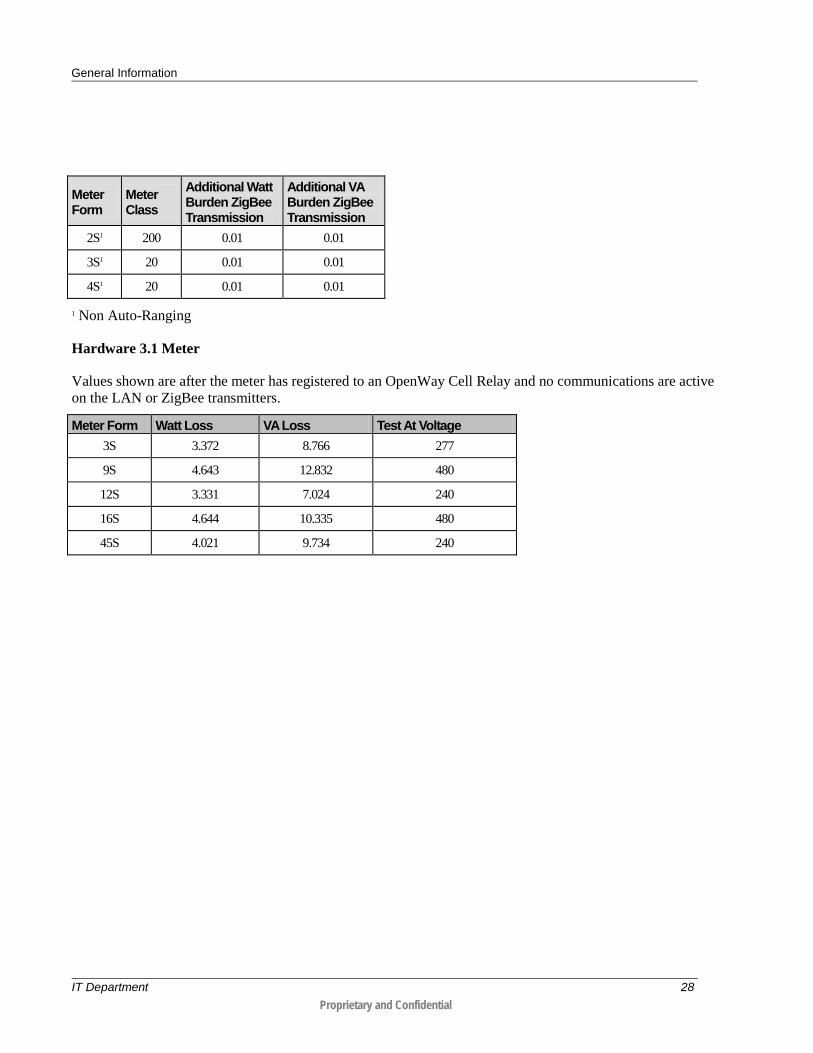
General Information
Meter Form
Meter Class
Additional Watt Burden ZigBee Transmission
Additional VA Burden ZigBee Transmission
2S1 200 0.01 0.01
3S1 20 0.01 0.01
4S1 20 0.01 0.01
1 Non Auto-Ranging
Hardware 3.1 Meter
Values shown are after the meter has registered to an OpenWay Cell Relay and no communications are active on the LAN or ZigBee transmitters.
Meter Form Watt Loss VA Loss Test At Voltage 3S 3.372 8.766 277
9S 4.643 12.832 480
12S 3.331 7.024 240
16S 4.644 10.335 480
45S 4.021 9.734 240
IT Department 28 Proprietary and Confidential

General Information
Technical Data Meets applicable standards:
• ANSI C12.1 - 2001 (American National Standard for Electric Meters - Code for Electricity Metering)
• ANSI C12.18 - 1996 (American National Standard - Protocol Specification for ANSI Type 2 Optical Port)
• ANSI C12.19 - 1997 (American National Standard - Utility Industry End Device Data Tables)
• ANSI C12.20 - 2002 (American National Standard for Electricity Meters - 0.2 and 0.5 Accuracy Classes)
• ANSI C12.22 - 2008 (American National Standard - Protocol Specifications for Interfaces to Data Communication Networks)
• ANSI/IEEE C62.45 - 1992 (Guide to Surge Testing on Low-Voltage AC Power Circuits)
• ANSI MH 10.8 - 1983 Specification for Bar Code
• ANSI ASQZ 1.4 - 2003 Sampling Procedures and Tables for Inspection by Attributes
• IEC 61000-4-2
• IEC 61000-4-4
• IEEE C37.90.1 - 2002 SWC Surge Testing
• IEEE C65.42 Recommended Practice on Surge Testing for Equipment Connected to Low Voltage (1000V or less) AC Power Circuits
• NEMA SG-AMI 1 - 2009 Requirements for AMI Meter Upgradeability
• IEC 62052-11 (2003-02) Part 11 metering Equipment, General Requirements, Test and Conditions
Type Codes The type code indicates the metrology, version, base, functionality, and type of meter. The type code is found on the nameplate of the meter. The following is a depiction of how type codes are displayed for the OpenWay CENTRON polyphase meter:
IT Department 29 Proprietary and Confidential

General Information
Dimensions The following dimensional measurements are shown in inches and (centimeters).
Figure 4: CP1SO (CP2SO) Dimensions
A B C D E F 6.29
(16.00) 6.95
(17.70) 3.84
(9.80) 4.30
(10.90) 5.67
(14.40) 6.11
(15.50)
Shipping Weights The following weight measurements are shown in pounds and (kilograms).
4 Meters and Carton 11.0 (4.98951)
96 Meter Pallet 299.0 (135.624)
IT Department 30 Proprietary and Confidential

This chapter provides information on unpacking, inspecting and storing, the OpenWay CENTRON meter.
Unpacking and Inspection Upon receipt:
• Check the condition of the packaging to ensure there was no damage during shipment.
• Verify that the packaging label matches the order.
• Inspect for obvious damage to the cover, base, and meter assembly.
• Compare the meter and register nameplates to the record card and invoice. Verify the type, class, voltage, form number, and other pertinent data.
• Verify that the meter seals are in place.
As with all precision electronic instruments, the meter should be handled with care. Follow these precautions when handling the meter:
• Avoid damaging the meter base, cover, reset mechanism (if supplied), and optical connector (if supplied).
• When handling modules, grip the circuit board by its edges. Do not touch the liquid crystal display.
Be sure you are working in a static-free environment; electrostatic discharge (ESD) can damage meter components.
• Save the original packing materials.
Battery The OpenWay CENTRON polyphase meter contains a battery that powers the clock circuit during a power outage. The battery is permanently soldered to the module and is expected to last the life of the meter.
The product you have purchased contains a recyclable battery. At the end of its useful life, under various state and local laws, it may be illegal to dispose of this battery into the municipal waste stream. Check with your local area solid waste officials for details about recycling options or proper disposal.
Storage Store the meter in a clean, dry (Relative Humidity < 50%) environment between -40°C to +85°C (-40°F to +185°F). Avoid prolonged storage (more than one year) at temperatures above +70°C (+158°F). Store the meter in the original packing material.
C H A P T E R 2
Meter Installation
IT Department 31 Proprietary and Confidential

Meter Installation
Selecting a Site The meter is designed and manufactured to be installed in an outdoor environment, at an operating temperature range between -40°C and +85°C (-40°F to +185°F). Operation in moderate temperatures increases reliability and product life.
Installing the Meter into Service Install the meter using standard meter installation practices.
IT Department 32 Proprietary and Confidential

This chapter describes the operation of the basic features and functionality of the OpenWay CENTRON polyphase meter.
Metrology The OpenWay CENTRON polyphase meter is a solid-state meter which uses the Hall Effect (one per phase) to measure metered current and voltage dividers (one per phase) to measure metered voltage as indicated in block diagram below.
C H A P T E R 3
Base Metrology Operation
IT Department 33 Proprietary and Confidential

Base Metrology Operation
The metrology performs the direct sampling of the voltage and current waveforms and the raw processing of these samples to compute all the energy quantities. It is comprised of a dedicated microprocessor and an analog-to-digital (A/D) converter. Low level signals proportional to the service voltages and currents are connected to the analog inputs of the A/D converters. These converters, which are contained in one package, individually sample the signals and send the digital results to the microprocessor. The microprocessor takes these samples, applies precision calibration corrections and computes all the quantities required for the specific meter configuration.
The OpenWay CENTRON polyphase meter metrology communicates with the Hardware 1.5 polyphase register using CPC communications to request Cosmos-Poly-Complex (CPC) data every second. Hardware 2.0 and 3.0 use BLURT messaging.
All energy values are stored in the metrology and passed to the register via the Board-to-Board (B2B) connector using Itron protocol BLURT messages. The BLURT message contains: Wh d, Wh r, VAh d, VAh r, instantaneous voltage, instantaneous demand, and status information.
Single phase metrology sub-systems transmit energy measurements to the register sub-system using an unsolicited data packet transmitted across a serial communications channel at one second intervals (BLURT message). Currently there are three different BLURT message formats supported by the metrology.
• Standard BLURT message
• Enhanced BLURT message
• Advanced BLURT message (HW 3.1 only)
All metrology bases support the standard BLURT message format and will default to this format upon power up.
Factory configured meter keys are used by the register sub-system firmware to determine additional BLURT messages supported by the metrology. The register sub-system issues a command to the metrology sub-system to request alternate BLURT message formats. Upon receiving a request for an alternate format, the metrology responds by transmitting the requested BLURT message type for a one minute period. The metrology reverts back to the standard BLURT message format after one minute has elapsed during which no request for an alternate BLURT message format is received.
The HW 3.1 metrology provides support for the advanced BLURT message format. The advanced BLURT message provides the flexibility of a factory configurable energy. The configurable energy is referred to as a secondary saved quantity and includes energy quantities not available in previous BLURT message formats.
IT Department 34 Proprietary and Confidential

Base Metrology Operation
Form 9S/36S Support The Form 9S(8S)/36S OpenWay CENTRON polyphase meter can be placed in either a 9S(8S) service or a 36S service. The meter will monitor for the presence of the C phase voltage on bayonet 7 in the diagram below.
1 2
86 119 1075
4
12 13 15
If the C phase voltage is not present at power up, the meter will operate as a Form 36S. The presence of the C phase voltage is only checked when one of the following occurs:
• At power up
• SiteScan reconfigure
• Initialization
• Exiting Test Mode
If a form 9S(8S)/36S is to be used in a true 9S/8S service, the meter should not be configured to “Auto Service Sense” using OpenWay Field-Pro. See the table below for different scenarios.
For the following table, the voltages are referenced using the Form 9S Bayonets diagram above.
• A Phase (Bayonet 5)
• B Phase (9S) or C Phase (36S) (Bayonet 6)
• C Phase - 9S/8S only (Bayonet 7)
IT Department 35 Proprietary and Confidential

Base Metrology Operation
Meter is ordered as FM 9S(8S)/36S OpenWay Field-Pro Reconfigure SiteScan
Power up Voltages present
Conditions
Meter Operates
as
Auto Service Sense
Service Type
Enabled Phase A Phase B Phase C
If the meter loses Phase C voltage during normal operation, the meter continues to operate as FM9S and triggers diagnostic errors.
FM9S
Enabled Phase A Phase B Phase C
If loss of Phase C voltage is followed by a power outage and the meter has no voltage on Bayonet 7 after power restoration, the meter begins new service operation as FM36S.
FM9S
Enabled Phase A Phase B
FM36S
Disabled 3 element, 3 Phase, 4 Wire WYE is selected
Phase A Phase B
The meter does not recognize this condition as proper service and triggers a non-Fatal 9 error (SiteScan error)
Phase A Phase C
Triggers Diagnostic errors 1 and 2. FM9S
2.5 element 3 Phase 4 Wire wye (9S) Phase A Phase B
In this condition, the meter has been pre-determined in OpenWay Field-Pro to be a 2.5 element meter.
FM36S
3 element 3 Phase 4 Wire wye or 3 element 3 Phase 4 Wire delta
Phase A Phase B
In this condition, the meter has been pre-determined in OpenWay Field-Pro to be a 3 element meter. The meter will trigger the proper diagnostics.
FM9S
Surge Protection Surge protection for the electronics in the is provided by Metal Oxide Varistors (MOVs). MOVs are clamping devices that allow voltage up to a limit, and then increasingly conduct current to prevent the voltage from exceeding the limit. The MOVs on the power supply board are connected directly across the voltage inputs to the meter. Although this approach requires very large MOVs, it prevents high voltages from appearing on or near the electronic boards giving the superior performance when exposed to extremely high-voltage surges.
IT Department 36 Proprietary and Confidential

Base Metrology Operation
Sampling The analog-to-digital converter samples each phase voltage and current signal (independent of the line frequency) and sends the digital values immediately to the microprocessor. Each time a new set of digital samples is received by the microprocessor, it calculates all of the selected metrological quantities.
Figure 5: Sampled Waveform
At this sampling rate, harmonics to the 15th are measured. The high rate of the sampling enables the to measure energy quantities accurately under high harmonic distortion conditions. The sampling continues uninterrupted as long as the meter is powered up. All other processing is done in the background between samples. From the continuous train of digital samples on each of the six channels, current, voltage, active energy, reactive energy, and apparent energy quantities are computed.
IT Department 37 Proprietary and Confidential

Base Metrology Operation
Voltage and Current Measurement
Watt-hour (Wh) Measurement Watt-hours are measured by multiplying the instantaneous value of the voltage on each phase times the instantaneous value of the current on the same phase.
The resulting values are added to the Wh accumulator. The meter can be configured to register watt-hours either in the delivered quadrants only, or under bidirectional measurement, in the delivered and received quadrants. When only delivered watt-hours are measured, any negative watt-hour value is ignored. This has the same effect as a detent mechanism on an induction watt-hour meter.
When delivered and received watt-hours are measured, there will be one register for each quantity available: Wh delivered and Wh received, as well as two combined values at the register: Wh net and Wh uni.
VAR-hour (VARh) Measurement VAR-hour measurement is much like Watt-hour measurement. The voltage sample buffer is created when the meter powers up. This buffer is up to 12 samples deep. The OpenWay CENTRON polyphase meter multiplies the current sample by a previous voltage sample. Since the sampling is not synchronized to the line frequency, as the frequency changes, the number of samples that the OpenWay CENTRON polyphase meter must shift is different. The meter also needs to correct for the phase difference between 90 degrees and the actual amount of phase error that is generated by the buffered samples. The OpenWay CENTRON polyphase meter metrology places the reactive energy into one of four quadrant registers based on the result of the accumulator after two cycles have been completed. These accumulators can also be configured as required to provide the various VARh options such as VARh delivered (Q1+Q2), VARh received (Q3+Q4), VARh net delivered (Q1-Q4), and VARh net received (Q2-Q3).
IT Department 38 Proprietary and Confidential

Base Metrology Operation
Volt-ampere hour (VAh) Measurement The OpenWay CENTRON polyphase meter measures either Vectorial or RMS volt-amperes using arithmetic phase summation. The arithmetic method of measurement ensures that the resulting VAh value contains as much of the harmonic information as possible.
Volt-ampere values are calculated by multiplying the RMS voltage value times the coincident RMS current value.
The voltage and current values from each phase are squared and then stored in their respective accumulators. At the end of one second, each accumulator contains the sums of the square of the voltages or currents for each phase. The contents of these accumulators are passed to the consumption routine where they are averaged (divided by the sample count) and the square root is taken, yielding the RMS voltage and RMS current for each phase.
The RMS voltage and the RMS current for each phase are multiplied together every second to establish a VA-second value for each phase. These values are scaled and corrected.
The total VAh value is calculated by adding the VA-second quantities for each phase and dividing the total by 3600. This value is added to the appropriate register. If the harmonics on the voltage waveform differ from the harmonics on the current waveform, then the harmonic energies will fall out of the watt-hour and VARh calculation, and thus the VA Vectorial measurement, but they will not fall out of the VA Arithmetic measurement.
The VA Vectorial and VA Arithmetic measurements will also differ when there is imbalanced power. Imbalanced power is generated when the phases of the service are not in balance with one another.
Demand Calculations The Basic Polyphase register supports one Demand Quantity. The Advanced Polyphase register supports three Demand quantities (two regular Demand quantities and one Coincidental Demand quantity).
To calculate demand, the selected quantities are accumulated over a programmable time period (5, 6, 10, 12, 15, 20, 30, or 60 minutes) depending on the programmed demand interval length. At the end of the interval, the accumulated values are stored in separate demand storage registers and the accumulating registers are cleared. Incremental values for the next demand interval are then accumulated.
The maximum demand in a billing period is determined by comparing the demand values for the most recently completed interval to the respective readings presently stored in the peak demand registers. If the previous demand is greater than the value in the corresponding peak demand register, the lower value (the maximum demand recorded so far) is replaced. If the previous demand is less than the value in the corresponding peak demand register, the maximum demand value remains unchanged. This update process is carried out when a demand interval is completed, when a power outage occurs, when Test Mode is initiated, or when a Real Time Rate change occurs.
The OpenWay CENTRON polyphase meter demand calculations are performed using one of three possible methods: block, sliding (rolling), or thermal emulation. The demand method is selected when the register is programmed.
IT Department 39 Proprietary and Confidential

Base Metrology Operation
Block Interval Demand Calculation Block Demand calculations are based on user-defined interval lengths. The demand is the total energy accumulated during the interval divided by the length of the interval. At each end of interval (EOI), demand calculations are made and “EOI” can be displayed on the LCD.
For block interval, demand calculations are made at the end of each completed demand interval. This method is similar to the way mechanical demand meters operate. As load is applied to the demand register, an indicating pointer and maximum demand indicator are driven upscale. At the end of each interval, the indicating demand pointer is returned to the zero position, and the maximum demand pointer retains its highest or maximum position.
Rolling/Sliding Demand Interval Calculation A selected number of subintervals make up the demand interval. At the end of each subinterval, new demand calculations occur based on the last full demand interval and “EOI” can be displayed on the LCD.
Block interval demand calculation is subject to peak splitting, whereby it is possible for an electricity consumer to manipulate the load for limited periods within the demand interval. The registered demand reading will be less than the actual maximum demand of the load.
To counter this situation, the concept of rolling demand was introduced. Rolling demand is calculated as follows:
1. For illustration purposes, assume a 15 minute billing demand interval with three five-minute subintervals has been selected. Then, at any given moment, the meter has three complete sets of five-minute information available for demand calculations.
2. At the end of the present five-minute subinterval, the information on the oldest five-minute subinterval is discarded, and demand calculations are performed on the three newest sets of subintervals. In this manner, the OpenWay CENTRON polyphase meter with the rolling demand option updates the demand calculations every five minutes.
3. If the billing demand interval is 30 minutes with five-minute subintervals, then six sets of five-minute information or updates will be used for calculating previous demand.
Thermal Emulation The OpenWay CENTRON polyphase meter will emulate the response of a thermal demand meter for kW and kVA. This type of demand calculation is approximated exponentially. The meter will record 90% of a change in load in 15 minutes, 99% in 30 minutes, and 99.9% in 45 minutes. The four characteristics of a thermal demand meter that the OpenWay CENTRON polyphase meter will emulate are:
IT Department 40 Proprietary and Confidential

Base Metrology Operation
• Arithmetic phase summation
• Continuous rolling average demand
• Response calibrated to RMS values
• No End-of-Interval (EOI)
The demand registers are processed according to the demand type defined in the meter program. Most demand values are reset at a demand reset, but some provide other functionality. The types of demand values available are described in the following sections.
The thermal demand option has only one demand interval available. This interval length (response time) is 15 minutes.
Coincident Demand Coincident Demand is the energy accumulated in an interval where a second trigger energy attained a peak. For example, VAR demand when Watt demand attained a peak. Coincident demands are programmable.
Options are:
• VAR d at max W d
• VA arithmetic d at max W d
• PF arithmetic at max W d
• W d at max VAR d
• VA arithmetic d at max VAR d
• PF arithmetic at max VAR d
Only one coincident demand is supported at a time.
Power Factor (PF) Calculations The OpenWay CENTRON polyphase meter calculates four power factor quantities:
• Instantaneous Power Factor—This is the division of the Instantaneous kW value by the Instantaneous kVA value. It is calculated upon request.
• Previous Interval Power Factor—This is the division of the previous demand interval kW value by the previous demand interval kVA value. It is calculated at the end of each demand interval.
• Minimum Power Factor—This is the lowest previous demand interval power factor value calculated since last demand reset. This value is reset to 1.00 at a demand reset.
• Average Power Factor—When the demand reset is executed, the total kWh and total kVAh values at that time are stored in non-volatile memory. When the average power factor value is displayed, these previously stored kWh and kVAh values are subtracted from the kWh and kVAh totals at the last end-of-interval (EOI). The differential kWh is divided by the differential kVAh, yielding the average power factor since the last demand reset.
IT Department 41 Proprietary and Confidential

Base Metrology Operation
Multiple Self Reads The OpenWay CENTRON meter can read and store multiple self reads for extraction by the OpenWay system. This includes both a single automatic self read configured for a specific time of day (typically midnight) as well as self reads associated with interrogation requests from the Collection Engine.
IT Department 42 Proprietary and Confidential

Base Metrology Operation
KYZ Option Board The advanced OpenWay CENTRON Polyphase register supports an optional output board for a total of 2 KYZ and 1 KY output. The configuration of this board is performed using OpenWay Field-Pro on a site by site basis; KYZ functionality is managed entirely by OpenWay Field-Pro. The configuration of these fields is not provided by the collection engine.
The pulse weight multiplier(Ke) is 0.01. Pulse weights can range from 0.01 to 655.35 in increments of 0.01.
Customers using these boards must configure all KYZ boards the same. OpenWay Field-Pro does not have different configuration files for the KYZ board. Current values are pulled out of the meter to use as the defaults on the UI for KYZ Configuration.
The list of supported output types for the KYZ has been reduced to a set that applies to the OpenWay Polyphase meter. The list is as follows:
• Configured Energy Quantities (Whd, VAh, Arithmetic d)
• Demand Reset (Pulse Width)
• End of Interval (EOI) (Pulse Width)
• Rate Change (Pulse Width)
The Output Type drop down box shows the applicable output types. Configured Net energy quantities are not shown. Rate Change is only shown if TOU is enabled.
Pulse Weight and Pulse Width values allow you to type in a specific value or use the up or down buttons to increase or decrease the value by a increment corresponding to the selected Output Type. Any value entered that does not fall on the increment boundary is changed to the next lowest value that falls on the increment boundary. The values are also limited to a maximum and minimum value corresponding to the selected Output Type. Any value entered above the max is changed to the maximum value or any value entered below the minimum is changed to the minimum value.
The Pulse Weight and Pulse Width items are enabled when a quantity is selected. Only the Pulse Width option is used for the Demand Reset, End of Interval and Rate Change types. When the Pulse Width or Pulse Weight controls are disabled, they will revert to their default values. For the Pulse Width is 10 msec. and for the Pulse Weight this is 1.800 Ke.
The KYZ outputs can support all output types. The Low Current (KY) Output can support all items except for the Energy Quantities. At the very bottom there is a checkbox that allows you to disable the Outputs while the meter is in Test Mode. The default state is unchecked.
After configuring KYZ with the selected configuration a summary screen is shown with the existing KYZ configuration in the meter and the result of the operation at the top of the screen.
For testing purposes, the KYZ Option Board is fully functional in Test mode. However, it can be disabled if required by the test.
The KYZ Option Board connection point from the polyphase register is a 10-pin edge connector. The table below shows the signals available from the connection point.
IT Department 43 Proprietary and Confidential

Base Metrology Operation
Pin Number Signal 1 +3.3V DC
2 Ground
3 WAN TX to LAN
4 LAN TX to WAN
5 +4.5V DC
6 EPF Signal
7 KYZ 3
8 APG
9 KYZ 2
10 KYZ 1
The diagram below shows the color coding for the outputs.
In the diagram below, NO represents Normally Open.
K
Z
YYellow
Black
Red
Form CKYZ Output #1}
K
Z
Y Yellow / White
Black / White
Red / White
Form CKYZ Output #2}
NO
Common
Orange
White } Form ALow Current / High CurrentSolid-state Contact
IT Department 44 Proprietary and Confidential

This chapter describes the basic operation of the OpenWay CENTRON polyphase meter. It also provides detailed information on energy and demand functions.
The OpenWay CENTRON polyphase meter operates with either Basic or Advanced register functionality. The functionality selection is available at the time of purchase. The Advanced Polyphase meter is an extended functionality set of the basic meter.
Device Class Supported Hardware ITR3 - Basic Polyphase HW 2.0, HW3.0 ITR4 - Advanced Polyphase HW2.0 ITRF - Advance Polyphase HW3.1
Polyphase Basic/Advanced Features Certain options are available in both the Standard and the Advanced Polyphase; others are available only in the Advanced Polyphase. The versions of the are identified uniquely by their Device Class as previously described.
The following table defines the capabilities of the Basic and the Advanced OpenWay Polyphase meters:
Standard Feature Set Advanced Feature Set kWh (delivered, received, net, uni-directional) kWh (delivered, received, net, uni-directional) kVAh (delivered, received, net) kVAh (delivered, received, net) 1 Demand 2 Demands; 1 Coincident Test Mode support Test Mode support KYZ output support KYZ output support
Normal and Test LED Normal and Test LED Phase indicators on the display Phase indicators on the display Non-fatal error support for Loss of Phase Non-fatal error support for Loss of Phase Service Sensing (shown on display) Service Sensing (shown on display)
kVARh (Q1, Q4, delivered, received, net)
Power Factor (average, instantaneous)
SiteScan Diagnostics
C H A P T E R 4
OpenWay Polyphase Register Operation
IT Department 45 Proprietary and Confidential

OpenWay Polyphase Register Operation
Controls and Indicators All controls and indicators are shown in the figure below.
Description
Liquid Crystal Display (LCD). The LCD can be programmed to display a wide variety of quantities and other status information.
Test Mode Button
Optical Port. In addition to the two way RF network, some of the meter’s firmware and configuration files can be upgraded via the optical port. This functionality can also be provided through the ZigBee port.
Infrared Test LED
Nameplate with Meter Barcode. This is typically the identifier used by the utility to track the meters. This identifier may follow American Electric Power (AEP) encoding rules, or it may be assigned by the utility. When AEP rules are used, it will include the meter serial number assigned by Itron. The meter identifier is also encoded as a bar code. This barcode or meter identifier can be used during incoming acceptance and installation at the customer site. This number portion of the meter identifier is also included in the meter electronic serial number (ESN).
Liquid Crystal Display (LCD) The features a versatile ANSI C12.10-compliant, 104-segment LCD. The LCD with all segments lit is shown below. There are several static indicators available on the LCD as described in the table below the figure.
IT Department 46 Proprietary and Confidential

OpenWay Polyphase Register Operation
Common LCD Indicators Indicator Description
Load Emulator (-> for positive, <- for negative)
888 888888 Nine digits (7 segments each) for display of alphanumeric information
120 240 277 480 Nominal Voltage Indicator
EOI End of Interval (Registers - Demand)
nor disp Entry into Normal Display Mode
not sync1 Not synchronized to RFLAN
sync net1 Synchronized with a cell relay
sync1 Communicating with neighbor meters, but not with a cell relay
not reg1 Meter does not have C12.22 registration to Collection Engine
reg1 Meter has C12.22 registration to Collection Engine
level x1 Configuration status: - level 0 = not yet communicating with neighbor meters - level 1 = cell relay state - level 2-31 = levels an endpoint can attain; based on number of hops between meter and cell relay
crc calc Cyclic Redundancy Check Calculation; verifies firmware downloaded correctly with no data errors
boot Moving firmware into active table
send Sending packets to the meter to handle firmware upload
no lan1 RFLAN not working properly - contact Itron support
1 These messages are optional configuration displays.
The indicators shown in the table above actually display in a digital readout font; some characters may display as upper case.
Load Emulator The Watt-disk (Load) Emulator follows the Infrared Test LED. For each pulse of the Test LED, the Watt-disk Emulator increments one segment. Since the Watt-disk emulator is tied to the same quantity that is being pulsed on the LED, the supported quantities are the same as those that can be associated with the LED:
IT Department 47 Proprietary and Confidential

OpenWay Polyphase Register Operation
Quantity
Wh delivered Wh received Wh (delivered + received) VARh delivered(Advanced only) VARh received(Advanced only) VARh (delivered + received) (Advanced only) VAh delivered VAh received VAh (delivered + received)
The figure below represents a typical progression of the Watt-disk Emulator segments:
The sequence will flow as shown toward the right whenever watt-hours are being delivered and toward the left whenever watt-hours are being received. Note that this direction is based on the direction of watt-hour flow even if VARs or other quantities are being emulated.
The LCD will also have two arrows ( ) next to the watt-disk emulator. Only one arrow will be on at a time. The arrow pointing upward will be on whenever VARs during the previous second are mostly delivered (Q1 and Q2). The arrow pointing downward will be on whenever VARs during the previous second are mostly received (Q3 and Q4). These arrows will be updated once per second.
Optical Port The optical port is mounted on the meter cover. The optical port is a communication interface from the meter to a PC. Interface to a PC is accomplished through a communication cable which attaches to the optical port on one end and a PC serial or USB port on the other end. This interface cable can be powered by a DC TAP, an AC Adapter, or the PC COM Port. Communication through the optical port may be at 9600, 14400, 19200, or 28800 bps.
IT Department 48 Proprietary and Confidential

OpenWay Polyphase Register Operation
LED Configuration For each of the two operating modes (Normal and Test), a quantity and a pulse weight can be configured for the metrological LED. The quantities listed in the Watt-disk Emulator section above are available.
The pulse-weight of the metrological LED is configurable from 0.025 to 150 [unit-hours/pulse] in 0.025 increments.
Application of Power and Power-up To energize all electronics, apply applicable voltage based on meter form and voltage rating.
Do not power up the meter if the inner and outer covers are not properly secured. Line-level voltages are present inside the housings. Failure to follow this procedure could result in serious personal injury or death.
Demand Functionality The demand interval is synchronized to the top of the hour. The first demand interval after a power outage may be shorter than the configured interval value. Billing data is stored in non-volatile memory.
TOU/Load Profile Functionality All OpenWay meters have a permanently installed battery from the factory. The battery allows the timekeeping circuitry in the meter to maintain the meter's clock during an outage. Load Profile data is periodically committed to flash as described in the Load Profile section. If a battery goes dead on a TOU/Load Profile meter during an outage, then the meter's clock will be off by the duration of the outage and the TOU data and some Load Profile data will be lost.
Upon the return of proper AC power, the register undergoes a procedure similar to the initial power-up. The meter performs self-diagnostic checks, data is retrieved from non-volatile memory, and normal operation is resumed. The number of minutes of power outage maintained while the meter was in carry-over operation is added to the Time on Battery register.
Cold Load Pickup Normally, when power is restored to the meter after an outage, a new, but short, demand interval is started and demand calculations begin immediately. The meter can be configured to recognize a demand delay or cold load pickup (CLPU) time. If a CLPU is configured in the meter, the meter will delay demand calculations for the configured amount of time—0 to 255 minutes in one-minute increments. For example, if a CLPU time of five minutes is configured into the meter, a power outage will cause the meter to wait five minutes after power restoration before resuming demand calculations.
Defining CLPU as zero will cause demand calculations to restart immediately after any recognized power outage.
IT Department 49 Proprietary and Confidential

OpenWay Polyphase Register Operation
Interval Make-up During power-up processing, the Load Profile component checks if the duration of the outage exceeds the configured minimum duration time. If it does, then at least one interval will be tagged with an outage status. The interval that was active when outage occurred is tagged as a partial interval due to the outage. If the outage ended in the middle of another interval, then that interval is also tagged as a partial interval due to the outage. If any intervals occurred in between, then those intervals are tagged as skipped intervals due to the outage and their data will be all zeroes.
Registers The following are register quantities in the OpenWay Register:
• Energy Quantities
• Demand Quantities
• Self Read Quantities
• Instantaneous Quantities
• Information Quantities
Energy Quantities The OpenWay CENTRON Polyphase meter can measure numerous energy quantities (as shown in the table below) from which the user can configure the quantities to be registered based on the meter's Device Class. ITR3, and ITR4 device class meters can display up to four energy quantities; ITRF device class meters can measure and display up to five energy quantities.
Quantity Description Wh delivered Quad I + Quad IV Wh received Quad II + Quad III Wh net Wh delivered – Wh received Wh Uni-directional Wh delivered + Wh received VARh Q11 Quad I VARh Q41 Quad IV VARh delivered Quad I + Quad II VARh received Quad III + Quad IV VARh net VARs delivered – VARs received VAh delivered Quad I + Quad IV Vect.or Arith. VAh received Quad II + Quad III Vect.or Arith. VAh lag
IT Department 50 Proprietary and Confidential
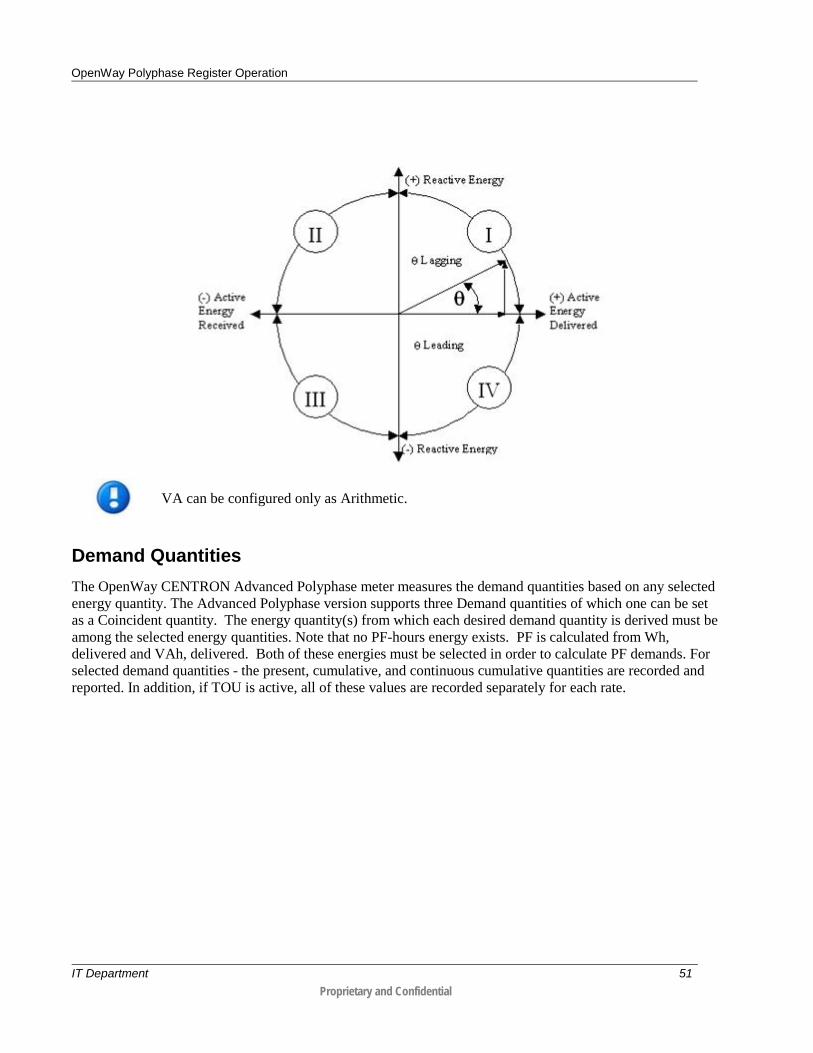
OpenWay Polyphase Register Operation
VA can be configured only as Arithmetic.
Demand Quantities The OpenWay CENTRON Advanced Polyphase meter measures the demand quantities based on any selected energy quantity. The Advanced Polyphase version supports three Demand quantities of which one can be set as a Coincident quantity. The energy quantity(s) from which each desired demand quantity is derived must be among the selected energy quantities. Note that no PF-hours energy exists. PF is calculated from Wh, delivered and VAh, delivered. Both of these energies must be selected in order to calculate PF demands. For selected demand quantities - the present, cumulative, and continuous cumulative quantities are recorded and reported. In addition, if TOU is active, all of these values are recorded separately for each rate.
IT Department 51 Proprietary and Confidential

OpenWay Polyphase Register Operation
Demand Calculations To calculate demand, the selected quantities are accumulated over a programmable time period (5, 6, 10, 12, 15, 20, 30, or 60 minutes) depending on the programmed demand interval length. At the end of the interval, the accumulated values are stored in separate demand storage registers and the accumulating registers are cleared. Incremental values for the next demand interval are then accumulated.
The maximum demand in a billing period is determined by comparing the demand values for the most recently completed interval to the respective readings presently stored in the peak demand registers. If the previous demand is greater than the value in the corresponding peak demand register, the lower value (the maximum demand recorded so far) is replaced. If the previous demand is less than the value in the corresponding peak demand register, the maximum demand value remains unchanged. This update process is carried out when a demand interval is completed, when a power outage occurs, or when a Critical Peak Pricing change occurs.
The OpenWay CENTRON meter demand calculations are performed using one of two possible methods: block or rolling. The demand calculation method is selected when the register is programmed.
Block Interval Demand Calculation Block Demand calculations are based on user-defined interval lengths. The demand is the total energy accumulated during the interval divided by the length of the interval. At each end of interval (EOI), demand calculations are made and “EOI” can be displayed on the LCD.
For block interval, demand calculations are made at the end of each completed demand interval. This method is similar to the way mechanical demand meters operate. As load is applied to the demand register, an indicating pointer and maximum demand indicator are driven upscale. At the end of each interval, the indicating demand pointer is returned to the zero position, and the maximum demand pointer retains its highest or maximum position.
IT Department 52 Proprietary and Confidential

OpenWay Polyphase Register Operation
Rolling Demand Interval Calculation A selected number of subintervals make up the demand interval. At the end of each subinterval, new demand calculations occur based on the last full demand interval and “EOI” can be displayed on the LCD.
Block interval demand calculation is subject to peak splitting, whereby it is possible for a consumer to manipulate the load for limited periods within the demand interval. The registered demand reading will be less than the actual maximum demand of the load.
To counter this situation, the concept of rolling demand was introduced. Rolling demand is calculated as follows:
• For illustration purposes, assume a 15 minute billing demand interval with three 5 minute subintervals has been selected. Then, at any given moment, the meter has three complete sets of 5 minute information available for demand calculations.
• At the end of the present 5 minute subinterval, the information on the oldest 5 minute subinterval is discarded, and demand calculations are performed on the three newest sets of subintervals. In this manner, the OpenWay CENTRON meter with the rolling demand option updates the demand calculations every five minutes.
• If the billing demand interval is 30 minutes with 5 minute subintervals, then six sets of 5 minute interval information or updates will be used for calculating previous demand.
Thermal Emulation The OpenWay CENTRON Polyphase meter will emulate the response of a thermal demand meter for kW and kVA. This type of demand calculation is approximated exponentially. The meter will record 90% of a change in load in 15 minutes, 99% in 30 minutes, and 99.9% in 45 minutes. The four characteristics of a thermal demand meter that the OpenWay CENTRON Polyphase meter will emulate are:
• Arithmetic phase summation
• Continuous rolling average demand
• Response calibrated to RMS values
• No End-of-Interval (EOI)
The demand registers are processed according to the demand type defined in the meter program. Most demand values are reset at a demand reset, but some provide other functionality. The types of demand values available are described in the following sections. The thermal demand option has only one demand interval available. This interval length (response time) is 15 minutes. When you enter into Test Mode, this interval length is fixed at 1 minute.
Peak Demand (Maximum Demand) Peak Demand is the largest demand value that has occurred during any demand interval since the last demand reset. At the end of a demand interval, the present demand is compared with the current maximum demand register. If the present demand is greater, it is transferred to the maximum demand. The maximum demand is reset to zero on a demand reset. The date and time of the maximum demand are also recorded. Maximum demand is used for block, rolling, and thermal demand types.
IT Department 53 Proprietary and Confidential
OpenWay Polyphase Register Operation
Cumulative Demand Values Cumulative Demand is the summation of previous maximum demands after each demand reset. When a demand reset occurs, the maximum demand values are added to the existing corresponding cumulative demand values, and the sums are saved as the new cumulative demands. These values will not increase until the next demand reset. This feature not only protects the user from false or erroneous readings, but also provides the customer with extra security against tampering. Cumulative demand may be used for block, sliding and thermal demand types.
Continuous Cumulative Demand Values Continuous Cumulative Demand is the sum of the maximum demand and the cumulative demand at any point in time. At the end of each demand interval, if a new maximum demand is reached, continuous cumulative demand will also be adjusted to reflect this new maximum demand value. A demand reset will clear the maximum demand value, but will not affect the continuous cumulative demand. Continuous cumulative demand may be used for block, rolling and thermal demand types.
Present Demand Present Demand is the value that would be used if an EOI were to occur when the data is being viewed. It is calculated by dividing the accumulated energy in the current interval by the time of a full interval. For block demands, present demand starts at zero for each interval and ramps up to the demand value at the EOI. For rolling demands, the energy from the oldest subinterval is discarded and the present demand is calculated using the energy in the remaining subintervals and the energy in the current subinterval. At the beginning of a new subinterval, it drops by the demand of the oldest subinterval and ramps up to the demand value at the next EOI.
Present demand is not affected by a demand reset.
Coincident Demand Quantities A Coincident Demand quantity can be configured in the Advanced Polyphase register. It is not available in the Basic Polyphase register. Coincident values can only be captured for certain quantities. The coincident demand is the demand value of a quantity (the captured quantity) during the same interval when a maximum demand occurs on another quantity (the trigger quantity).
Below are the selection options available on the OpenWay CENTRON advanced polyphase register for the coincident demand register triggers and captures:
IT Department 54 Proprietary and Confidential

OpenWay Polyphase Register Operation
Trigger Quantities (Energy and Demand Needed) Captured Quantities (Energy Needed)
Maximum W delivered W delivered Maximum VAR Q1 VAR Q1 Maximum VAR Q4 VAR Q4 Maximum VAR delivered VAR delivered Maximum VA delivered (Arithmetic or Vectorial*)
VA delivered (Arithmetic or Vectorial*)
Minimum PF Average for interval (Demand Only needed)
PF Average for interval
* Option is selected during programming of the quantity. Both values are not simultaneously available.
Power Factor (PF) Calculation The OpenWay CENTRON Advanced Polyphase meter can calculate average power factor since the last demand reset.
• Instantaneous Power Factor—This is the division of the Instantaneous kW value by the Instantaneous kVA value. It is calculated upon request, and is available via the display only.
• Average Power Factor—When the demand reset is executed, the total kWh and total kVAh values at that time are stored in non-volatile memory. When the average power factor value is displayed, these previously stored kWh and kVAh values are subtracted from the kWh and kVAh totals at the last end-of-interval (EOI). The differential kWh is divided by the differential kVAh, yielding the average power factor since the last demand reset.
Operating Modes The OpenWay Register operates in the Normal mode and Test mode. The following sections describe each of these modes.
Normal Mode Normal mode is the standard mode of operation and the mode in which the meter automatically starts when energized. Selected quantities are measured and processed in billing registers. During this mode of operation, billing registers are saved in non-volatile memory during power outages.
IT Department 55 Proprietary and Confidential

OpenWay Polyphase Register Operation
Test Mode The meter can only be placed into Test mode using the OpenWay Tools software; there is no hardware test switch on the meter. For more details on using OpenWay Tools, refer to the OpenWay Tools User Manual available online through the Itron Access portal. This document includes information on using OpenWay Field-Pro, Shop Manager and the ZigBee Device Manager.
While in Test mode, the “TEST” annunciator is displayed on the LCD. Upon entry of Test mode, an end of interval (EOI) is forced. As with any EOI, present demands are compared to the existing maximum(s) and stored if it is a new maximum value. All billing data is then transferred to non-volatile memory. Test mode configuration parameters (demand test interval length, number of subintervals and Test mode pulse weights) will become active. A Demand Test Interval will also begin upon entering Test mode.
Issuing a Demand Reset request via OpenWay Tools will restart a demand test interval. This interval is not synchronized with the hour. Display scrolling in Test mode is the same as for normal display mode.
One quantity and an associated pulse weight is configurable for pulsing on the metrological test LED during Test mode. These values are configurable via OpenWay Field-Pro; however, the quantity is configured in the Collection Engine.
Test mode can be terminated via software command through OpenWay Tools or once the configurable mode timeout is reached. Values calculated during Test mode will not be added to previous billing data and are not stored. After Test mode is terminated, all billing data will be restored and normal interval registration will resume.
A user must have proper security (level 4) in order to enter the meter into Test mode during a response to a C12.22 request.
The meter will not respond to most network commands, including reads, while in Test mode.
IT Department 56 Proprietary and Confidential

OpenWay Polyphase Register Operation
Display Items The OpenWay Register normal display mode has a list of items (quantities) it can display. The aggregate of items associated with a display mode is called a display list. The OpenWay CENTRON polyphase meter can display a maximum of 80 items; all items are user-selectable. The display items and sequence of display, along with any desired annunciators or ID code number, are selected during program setup.
The following types of displayable items are available for the user-defined display lists:
• Energy registers
• Demand registers
• Instantaneous registers
• Informational items (configuration, state informational items, network connection parameters)
Numerical values may be displayed in various formats depending on configuration. For example, kilo units, mega units, fixed decimal point, floating decimal point, and leading zeros can all be configured.
The following tables show items programmable for display in the modes indicated.
All of the display items in the next two tables may be selected by TOU Rate. They also may be selected from the Self Read buffer.
Energy Data Display Items
Energy Data Display Item Display Mode
Normal Test
Wh (delivered, received, net, uni-directional) X X
VARh (delivered [lag], received [lead], Net, Q1, Q4) (Only available in Polyphase Advanced) X X
VAh (delivered, received, arithmetic) X X
IT Department 57 Proprietary and Confidential

OpenWay Polyphase Register Operation
Demand Data Display Items
Demand Data Display Item Display Mode
Normal Test
W Delivered (Max, Instantaneous) X X
W Received (Max, Instantaneous) X X
W Net (Max) X X
W Uni-directional (Max) X
VAR Q1, VAR Q4 (Max) (only available in Polyphase Advanced) X X
VAR delivered (Max) (only available in Polyphase Advanced) X X
VAR received (Max) (only available in Polyphase Advanced) X X
Max VAR Net(only available in Polyphase Advanced) X X
VA delivered [arithmetic] (Max) X X
VA received [arithmetic] (Max) X X
VA Lag (Max) X X
Coincident Demands (only available in Polyphase Advanced) X
Instantaneous Data Display Items
Instantaneous Data Display Item Display Mode
Normal Test Instantaneous W (aggregate, A, B, C) X X
Instantaneous VAR (aggregate, only available in Advanced Polyphase) X X
Instantaneous VA (aggregate, arithmetic) X X
Instantaneous Volts RMS (A, B, C) X
Instantaneous Amps RMS (A, B, C) X
Instantaneous Power Factor X
Instantaneous Frequency (Hz) X
Instantaneous data items are for display purposes only and are not stored on power down.
IT Department 58 Proprietary and Confidential

OpenWay Polyphase Register Operation
Informational Data Display Items
Informational Data Display Item Display Mode
Normal Test Comm. Status Field 1-3 X
Current Date, Day & Current Time X
Last Configuration Date X
Minutes on Battery X
Normal Kh
Number of Inversion Tampers X
Number of Removal Tampers X
Number of Power Outages X
Number of Test Subintervals X
Option Board Fields 1 - 3 X
Segment Test X
Service Type X
Test Kh X
Time Remaining in Demand Subinterval X X
Time Remaining in Test Mode X
User Data 1-3 X X
Normal Display Mode The Normal Display mode is the default display when the meter is energized and when the meter is in Normal Operating mode. When Mode Timeout occurs from Test mode, the display returns to Normal Display mode.
Error Code Displays The user may configure the behavior that the meter should exhibit for every specific error condition. The possible actions in order of increasing severity are to ignore the error (do not display the error code); scroll its error code (an error code is automatically displayed after each display item); or lock the display, showing only the error code (do not display anything else).
IT Department 59 Proprietary and Confidential
OpenWay Polyphase Register Operation
Tamper Detection The OpenWay CENTRON meter reports to the network all attempts at tampering. The following tamper events are defined:
• Removal from socket
• Inversion
• Magnetic Detected
• Magnetic Cleared
• Outage
• Unauthorized network access attempt
Tamper events are sent to the system with a daily read or can be configured to send real time alarms.
Time Synchronization Time synchronization is an automatic feature that periodically checks synchronization of the register time every 60 minutes. If the time in the register processor gets more than 20 seconds off from the main system time, the register will adjust time. System time is provided to the meter by the RFLAN and is based on network time which is synchronized to an NTP server. The time is propagated through the network by the RFLAN and checked at each endpoint for the above described parameters.
In the case that a meter's time is off from the system time by more than 120 seconds, the meter will no longer synchronize its time with the RFLAN automatically. In this case, the user can use the Force Time Sync functionality available in OpenWay Tools or via the network which will generate an event that will be recorded for later retrieval.
If the meter is using Enhanced Security and the time is off by more than 10 minutes, any call by the system will be treated as a replay attack. In the case of a forced time sync, the replay attack is ignored for this one message as follows:
1. The Collection Engine sends a request to the meter to do a time sync operation.
2. If the requested message is built on the enhanced security mechanism, then the meter will process it without logging a replay attack.
3. After the meter has processed the message, it will log a history event to indicate whether the time sync operation is a success or a failure.
Time of Use (TOU) The Time of Use (TOU) functionality is designed for use in billing applications where multiple rates (bins) are required for energy and demand. The TOU option provides four rates plus the total rate plus the CPP rate.
IT Department 60 Proprietary and Confidential
OpenWay Polyphase Register Operation
TOU Schedules The OpenWay CENTRON meter TOU schedule is programmed in the meter up to 25 years at a time. New seasons are sent to the meter via pending tables. The schedule can be changed at any time via the network.
When using the TOU functions of the meter, energy and demand registrations are segmented into time blocks during the day. Each time block is assigned one of four rate periods. In addition to these four rate periods, a total rate is always available.
Calendar Schedule The OpenWay CENTRON meter supports a 25 year calendar. The calendar schedule contains all daily information needed for the meter to measure and register data in real time. The schedule contains daily patterns with configurable day types and rates.
Rates Four independent rates are available for TOU registration. These are designated A, B, C, and D. Only one of these rates can be active at a time. The Total register, designated Rate T, is always active, regardless of the active rate period. The CPP Rate is activated from the Collection Engine. CPP events are limited to one per day and up to 30 per year.
The OpenWay Register TOU rates are applied to all energy and demand registers that have been selected for measurement. Therefore, all energy and demand registers are segmented as per the TOU schedule and available in each rate period, in addition to the Total rate.
Daily Patterns Each pattern defines the times during the day that rate period A, B, C, or D begins and ends. Up to six rate period changes may be specified for each daily pattern.
Day Types There are four day types: Weekday, Saturday, Sunday, and Holiday. Each day of the week is assigned to one of the four day types. Each day type is assigned one of the four daily patterns when each season is defined. Any of the daily patterns can be used in any combination with the day types.
Seasonal Schedules A season is a period of weeks during the year when a particular rate structure is in effect. Multiple seasons can be set up per year.
When the meter is configured, the current season's TOU schedule is loaded. Before the next season begins, the Collection Engine automatically sends the new TOU schedule to the meter, which holds it in a pending table. On the date when the new season begins, the meter handles the transition to the new TOU schedule.
IT Department 61 Proprietary and Confidential

OpenWay Polyphase Register Operation
TOU Registers The OpenWay register can measure up to four energies and one demand. When the meter is configured for a TOU calendar, all energies and demands that are selected for measurement also have the configured TOU rates applied to them.
Rate E is used to accumulate data when the meter is triggered to be in Critical Peak Pricing (CPP). This value will be cleared along with the other TOU Register values during a Clear Billing Register operation.
Current Season Registers All energy and demand TOU registers stored on the meter are current season registers.
TOU Operation This section describes TOU operation specific to the meter display. Several TOU indicators are available on the liquid crystal display (LCD).
Rate Annunciators and Active Rate Indicators Rate annunciators are available with each demand and energy register. An A, b, c, or d will be displayed on the far right side of the LCD to indicate the rate period for each quantity being displayed.
If the rate annunciator is flashing while a demand or energy value is displayed, the annunciator indicates that it is the current rate in effect. This gives a quick indication that the register is configured with the correct TOU schedule and that it is currently set to the correct time.
Season Change Because the meter can be programmed for up to 25 years, there can be numerous seasons and switchpoints, all of which can be changed at any time through the network.
IT Department 62 Proprietary and Confidential

OpenWay Polyphase Register Operation
Critical Peak Pricing Critical Peak Pricing (CPP) is an extension of Time-Of-Use (TOU) scheduling. From the meter's perspective, CPP is just another TOU rate.
In OpenWay CENTRON meters, CPP is activated and deactivated through the use of pending tables. The Collection Engine activates CPP by sending an activation message. This message contains:
• The day schedule information for the day, hour, minute and CPP rate for the activation.
• The day schedule information for the day, hour, minute and normal TOU rate for the deactivation. The deactivation schedule is generally the original schedule data.
If a duplicate CPP message is received, the duplicate is acknowledged, but rejected.
CPP activation does not replace an entire day's schedule. To minimize network traffic, only the affected time periods are written into the TOU schedules when CPP is activated.
Load Profile Load Profile (mass memory) data is stored in blocks (records) of 96 intervals. The profile interval length is the same for all channels and is independent of the interval length for demand quantities. Each interval of load profile data is identified by date and time. Each interval contains status bits indicating the occurrence of outages, Daylight Saving Time, and other significant events or errors.
The Load Profile functionality is designed for use in billing and load research applications where multi-channel high resolution data is needed.
Load Profile Specifications
Load Profile Quantities The following energy quantities will be selectable:
Quantity Wh delivered Wh received Wh net Wh unidirectional VARh Q1 (Advanced Polyphase only) VARh Q4 (Advanced Polyphase only) VARh delivered (Advanced Polyphase only) VARh received (Advanced Polyphase only) VAh delivered VAh received
IT Department 63 Proprietary and Confidential

OpenWay Polyphase Register Operation
Capacity The load profile option is available in 144 Kbytes of memory. Five channels are available in the ITRF device class.
Bit Resolution The load profile operates with 16-bit data resolution. Equivalent pulse count resolution is as follows:
Bits Pulse Counts 16 65,535
151 32,767
1 When a Net quantity (such as Net Wh) is chosen as a load profile channel, all load profile channels have 15-bit data resolution because one of the bits must be used to indicate if the value is positive or negative.
Interval Lengths The load profile records data on a block interval basis. The interval length is programmable for 5, 10, 15, 30, or 60 minutes. The interval length is the same for all channels and is independent of the interval length for demand quantities.
Power Outage The OpenWay Register flags an interval when a power outage exceeds a specified number of seconds. The range for power outage length is programmable from 0 to 255 seconds and must not exceed the programmed interval length.
• During power outages the OpenWay CENTRON meter maintains all meter data as well as timekeeping functions (powered by the internal battery).
• During an outage, billing data is stored in non-volatile memory.
• When power is restored, data is returned to active memory and normal metering resumes.
• The meter records the date and time of the power outage and the power restoration.
Channel Configuration Each load profile channel corresponds to an energy register selected during the programming process. In order to profile a specific energy, the energy must first be selected as a quantity to be measured.
Selection of channel configuration and pulse constants is accomplished through the programming software. Each data channel is programmed to record load profile data from a user-selected register. The energy registers allowed for load profile are listed in Energy Data.
IT Department 64 Proprietary and Confidential

OpenWay Polyphase Register Operation
Data Storage The OpenWay Register uses non-volatile flash memory to record load profile data. Data is stored in load profile memory at the end of each interval. Each channel has 16 bits written to load profile memory. At the end of an interval, a 16-bit number is written into load profile memory for channel 1; a 16-bit number for channel 2 follows immediately.
The process continues for each interval until 128 intervals (one block or record) have been recorded. In addition to the profile data, each interval contains eight types of status bits written into each data interval. The following are the status codes used when viewing data on OpenWay Field-Pro:
Status Definition Cause A Time Adjustment The meter time was adjusted during the specified interval. When A appears, you also
see a status of K, L, or S, indicating whether the time adjustment caused an interval to be skipped or to be longer or shorter than normal.
D In DST The interval occurred during Daylight Saving Time. K Skipped Interval The interval was skipped and no data was recorded. Intervals can be skipped due to
either a power outage or a time adjustment during that interval. L Long Interval A time adjustment occurred during the interval causing it to be longer than the normal
interval length. O Outage An outage occurred during the specified interval. The minimum outage length is
recorded in seconds and is specified in the Collection Engine in the load profile section.
R Power Restoration Power was restored after a power outage during this interval. S Short Interval The interval was shorter than normal either because of an outage or a time adjustment. T Test Mode The meter was placed into test mode during the specified interval. V Overflow The value recorded in this interval was outside of the range that the meter is capable of
storing. This could happen because there was a large amount of data stored or there was a time adjustment backwards. If this occurs frequently for load profile data, try using a smaller pulse weight.
In addition to the interval profile data and the interval status data, each block contains a time tag specifying the month, day, hour, and second of the end of the data block.
IT Department 65 Proprietary and Confidential

OpenWay Polyphase Register Operation
Pulse Constants The Collection Engine allows the entry of a Pulse Weight (PW) between 0.01 to 50 in increments of 0.01 and limiting the decimal places to two.
The load profile pulse constants apply to secondary readings only.
Example: Calculation of pulse weight from Wh
A meter, 1-element, 240 Volts, CL200 is programmed to record Wh in load profile with 15 minute intervals.
First, calculate the maximum watt-hour accumulation during 15 minute intervals:
)25.0()1()200()240(max hoursXphaseXAXVWh =
watthoursWh 000,12max =
The maximum number of pulses supported by the OpenWay CENTRON meter is 65,535; therefore, the smallest pulse weight (PW) that can be used is:
pulseWhpulsesWhPW /1831.0
535,65000,12min ==
Since the pulse weight value must be a multiple of 0.01and is limited to two decimals places, 0.18 Wh/pulse could be programmed as the pulse weight (Ke) for the Wh channel in load profile in this example. However, Itron recommends using the immediate upper value multiple of 0.01.
For this case, this value is 0.19.
Recording Duration The following equation can be used to determine the recording duration of the load profile:
Recording Duration (days) = (M x I x 1024) / (1,440 x [(2 x C + 2) + ((6 x C + 4) / 128)])
M = Memory size in kilobytes
C = Number of channels
I = Interval Length in minutes
IT Department 66 Proprietary and Confidential

OpenWay Polyphase Register Operation
The table below shows the recording duration (in days) for 144 kilobytes (KB) load profile memory size.
Number of Channels
Interval Length (Minutes) 5 10 15 30 60
1 126 253 379 759 1519
2 84 168 252 505 1011
3 63 126 189 379 758
4 50 101 151 303 606
5 42 83 125 250 501
Load Profile Self Reads When enabled, the number of hourly self reads is configurable with values of 1, 2, 3, 4, 6, 8 and 12. Hourly self reads occur at fixed times throughout the day and are evenly spaced as defined in the table below.
Self Reads per Day Self Read Times
1 0:00
2 0:00, 12:00
3 0:00, 8:00, 16:00
4 0:00, 6:00, 12:00, 18:00
6 0:00, 4:00, 8:00, 12:00, 16:00, 20:00
8 0:00, 3:00, 6:00, 9:00, 12:00, 15:00, 18:00, 21:00
12 0:00, 2:00, 4:00, 6:00, 8:00, 10:00, 12:00, 14:00, 16:00, 18:00, 20:00, 22:00
Self Read times are in local time (adjusted for DST changes) or standard time.
Extended (Non-Billing) Energy and Load Profile Extended, or "Non-Billing" Energy and Load Profile (mass memory) data is supported by the ITRF device class and gives customers the ability to change energy and load profile configurations for quantities that may not have been selected during the initial configuration of the meter, and are therefore in a sealed state.
Six additional energy quantities, and six additional load profile quantities are selectable. Energies available for selection are very similar to what is available in standard energy and load profile with some minor exceptions outlined in the table below.
IT Department 67 Proprietary and Confidential

OpenWay Polyphase Register Operation
Extended Energy and Load Profile Specifications
Extended Energy and Load Profile Quantities The following energy quantities will be selectable for energy and load profile:
Quantity Wh delivered Wh received Wh net Wh unidirectional Wh Net Phase A Wh Net Phase B Wh Net Phase C VARh Q1 VARh Q4 VARh delivered VARh received VARh Net VAh delivered
Capacity The extended load profile option is available in 144 Kbytes of memory. There are up to six channels available in the Extended Non Billing load profile.
Bit Resolution The load profile operates with 16-bit data resolution. Equivalent pulse count resolution is as follows:
Bits Pulse Counts 16 65,535
151 32,767 1 When a Net quantity (such as Net Wh) is chosen as a load profile channel, all load profile channels have 15-bit data resolution because one of the bits must be used to indicate if the value is positive or negative.
Interval Lengths Like standard load profile, the Extended Non-Billing load profile records data on a block interval basis. The interval length is programmable for 5, 10, 15, 30, or 60 minutes. The interval length is the same for all extended channels and is independent of the interval length for demand quantities and that of standard load profile.
IT Department 68 Proprietary and Confidential

OpenWay Polyphase Register Operation
Power Outage The OpenWay Register flags an interval when a power outage exceeds a specified number of seconds. The range for power outage length is programmable from 0 to 255 seconds and must not exceed the programmed interval length.
• During power outages the OpenWay CENTRON Polyphase meter maintains all meter data as well as timekeeping functions (powered by the internal battery).
• During an outage, billing data is stored in non-volatile memory.
• When power is restored, data is returned to active memory and normal metering resumes.
• The meter records the date and time of the power outage and the power restoration.
Channel Configuration Each load profile channel corresponds to an energy register selected during the programming process. In order to profile a specific energy, the energy must first be selected as a quantity to be measured.
Selection of channel configuration and pulse constants is accomplished through the programming software. Each data channel is programmed to record load profile data from a user-selected register. The energy registers allowed for load profile are listed in Energy Data.
Data Storage The OpenWay Register uses non-volatile flash memory to record load profile data. Data is stored in load profile memory at the end of each interval. Each channel has 16 bits written to load profile memory. At the end of an interval, a 16-bit number is written into load profile memory for channel 1; a 16-bit number for channel 2 follows immediately.
The process continues for each interval until 128 intervals (one block or record) have been recorded. In addition to the profile data, each interval contains eight types of status bits written into each data interval. The following are the status codes used when viewing data on OpenWay Field-Pro:
IT Department 69 Proprietary and Confidential

OpenWay Polyphase Register Operation
Status Definition Cause
A Time Adjustment A time was adjusted during the specified interval. When using a status of an A, there will also be a status of S, K, or L.
D In DST The status was recorded during DST time within the specified interval.
K Skipped Interval The interval was skipped either due to a outage or a time adjustment during the specified interval. No data was accumulated during this interval.
L Long Interval A time adjustment occurred during the specified interval causing the interval to be longer than the specified interval length.
O Outage An outage occurred during the specified interval. The minimum outage length is recorded in seconds and is specified in the Collection Engine (load profile section).
R Power Restoration Power was restored during the specified interval.
S Short Interval Either an outage or a time adjustment which caused the interval to be shorter than the specified interval length.
T Test Mode The meter was placed into test mode during the specified interval.
V Overflow More data was accumulated in the specified interval than could be properly stored. This could happen because there was a large amount of data stored or there was a time adjustment backwards. If this occurs frequently, a smaller pulse weight should be used.
In addition to the interval profile data and the interval status data, each block contains a time tag specifying the month, day, hour, and second of the end of the data block.
Pulse Constants The Collection Engine allows to enter a Pulse Weight (PW) between 0.01 to 50 in increments of 0.01 and limiting the decimal places to two. This matches Pulse Weight specification for standard load profile. See standard load profile description for additional information on pulse weights.
IT Department 70 Proprietary and Confidential

OpenWay Polyphase Register Operation
Recording Duration The following equation can be used to determine the recording duration of the load profile:
Recording Duration (days) = (M x I x 1024) / (1,440 x [(2 x C + 2) + ((6 x C + 4) / 128)])
M = Memory size in kilobytes
C = Number of channels
I = Interval Length in minutes
The table below shows the recording duration (in days) for 144 kilobytes (KB) load profile memory size.
Number of Channels
Interval Length (Minutes) HW 3.1 Advanced Polyphase Register
5 10 15 30 60 1 126 253 379 759 1519
2 84 168 252 505 1011
3 63 126 189 379 758
4 50 101 151 303 606
5 42 83 125 250 501
Instrumentation Profile The OpenWay CENTRON meter can be configured to record up to nine channels of Instrumentation Profile. Instrumentation Profile is a type of interval data. Each interval contains a per-phase instantaneous reading of a configured quantity at a configured offset from the start of the interval. Configured interval lengths are synchronized to the top of the hour and can be set to 5, 10, 15, 30, or 60 minutes. Interval lengths are the same for each selected channel.
The profile interval length is the same for all channels and is independent of the interval lengths for other types of interval data. Each interval of instrumentation profile is identified by date and time and contains status bits indicating the occurrence of outages, Daylight Saving Time, and other significant events or errors.
Instrumentation is supported by HW 3.x.
IT Department 71 Proprietary and Confidential

OpenWay Polyphase Register Operation
Instrumentation Profile Specifications
Instrumentation Profile Capacity The instrumentation profile has dedicated memory of 70 Kbytes. The table below shows the recording time in days for all possible instrumentation profile configurations before data rollover begins:
Number of Channels
Interval Length (Minutes) 5 10 15 30 60
1 61 122 183 366 732
2 41 81 122 244 488
3 30 61 81 183 365
4 24 49 73 146 292
5 20 41 61 122 243
6 17 35 52 104 209
7 15 30 46 91 183
8 14 27 41 81 162
9 12 24 37 73 146
Available Quantities Up to three of the following may be selected simultaneously. A per-phase channel is recorded for each quantity selection:
Quantity Watts VA VAR Volts
IT Department 72 Proprietary and Confidential
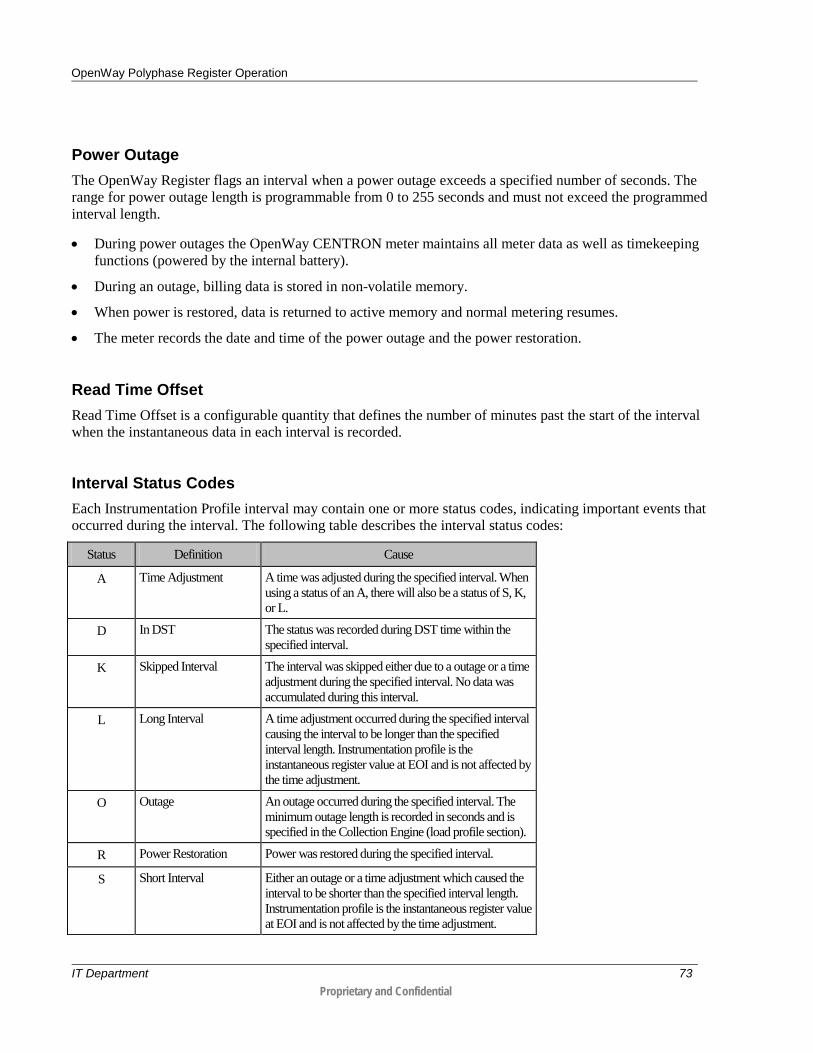
OpenWay Polyphase Register Operation
Power Outage The OpenWay Register flags an interval when a power outage exceeds a specified number of seconds. The range for power outage length is programmable from 0 to 255 seconds and must not exceed the programmed interval length.
• During power outages the OpenWay CENTRON meter maintains all meter data as well as timekeeping functions (powered by the internal battery).
• During an outage, billing data is stored in non-volatile memory.
• When power is restored, data is returned to active memory and normal metering resumes.
• The meter records the date and time of the power outage and the power restoration.
Read Time Offset Read Time Offset is a configurable quantity that defines the number of minutes past the start of the interval when the instantaneous data in each interval is recorded.
Interval Status Codes Each Instrumentation Profile interval may contain one or more status codes, indicating important events that occurred during the interval. The following table describes the interval status codes:
Status Definition Cause
A Time Adjustment A time was adjusted during the specified interval. When using a status of an A, there will also be a status of S, K, or L.
D In DST The status was recorded during DST time within the specified interval.
K Skipped Interval The interval was skipped either due to a outage or a time adjustment during the specified interval. No data was accumulated during this interval.
L Long Interval A time adjustment occurred during the specified interval causing the interval to be longer than the specified interval length. Instrumentation profile is the instantaneous register value at EOI and is not affected by the time adjustment.
O Outage An outage occurred during the specified interval. The minimum outage length is recorded in seconds and is specified in the Collection Engine (load profile section).
R Power Restoration Power was restored during the specified interval.
S Short Interval Either an outage or a time adjustment which caused the interval to be shorter than the specified interval length. Instrumentation profile is the instantaneous register value at EOI and is not affected by the time adjustment.
IT Department 73 Proprietary and Confidential

OpenWay Polyphase Register Operation
Status Definition Cause
T Test Mode The meter was placed into test mode during the specified interval.
V Overflow More data was accumulated in the specified interval than could be properly stored. This could happen because there was a large amount of data stored or there was a time adjustment backwards. If this occurs frequently, a smaller pulse weight should be used.
IT Department 74 Proprietary and Confidential

OpenWay Polyphase Register Operation
Voltage Monitoring The OpenWay CENTRON polyphase meter can be configured to store the Volt hour (Vh) data for average voltage measurement. Voltage Monitoring supports measurement of average voltage data (line-to-neutral) per phase for all three phases. The interval data for each phase is compared with the configured thresholds at each EOI. If it is below or above a configured threshold, corresponding events are recorded in the event log, but their event statuses are not flagged in the interval status.
Voltage Monitoring also supports the monitoring of instantaneous voltages during each interval. Monitoring of instantaneous voltages tracks minimum and maximum voltages during each interval. Voltage is constantly monitored, and corresponding events are recorded if the minimum voltage is below a desired threshold or the maximum voltage is above a desired threshold. The event status is flagged in the interval status. In addition, an instantaneous minimum and an instantaneous maximum voltage quantity is recorded in association with each interval, per phase.
Voltage Monitoring also supports meter activities such as reconfiguration, time adjustment, DST time, power outage, test mode operation (in polyphase meters only) and Periodic Read.
Since Voltage Monitoring is an EOI event, it is handled by the Event Manager and is scheduled whenever Voltage Monitoring is enabled. Then, it is rescheduled upon each Voltage Monitoring EOI event. It is also rescheduled for a new Voltage Monitoring EOI upon a time forward adjustment and a test mode exit.
When a Voltage Monitoring EOI function is called (assuming Voltage Monitoring is still enabled), the Voltage Monitoring module processes the interval data for each configured phase by taking a delta between a phase’s current Vh reading and the phase’s end value that was saved when this interval was started. The Voltage Monitoring module checks if it is starting a new block of Voltage Monitoring before the interval data is written. If it is, then the unread block count is updated. If the new block is overwriting an old block, then the unread block index and the oldest block offset are updated. The block interval count is set to 0.
After the check for a new block, the interval data is written. The interval data consists of the Voltage Monitoring accumulation values for each configured phase and the interval status. This data is stored until a data flash page boundary is encountered and is then written to memory. After the interval data is written, the block time stamp is updated and the block interval count is incremented. If the end of the block has occurred, then the updated phase end values are stored until a data flash page boundary is encountered and then written to memory. If the end of the block corresponds to the end of the Voltage Monitoring memory, a wrap occurs.
A Voltage Monitoring interval time is added to the time that this EOI was scheduled for to get a preliminary next Voltage Monitoring EOI time. The next Voltage Monitoring EOI is scheduled with the Time Manager.
IT Department 75 Proprietary and Confidential
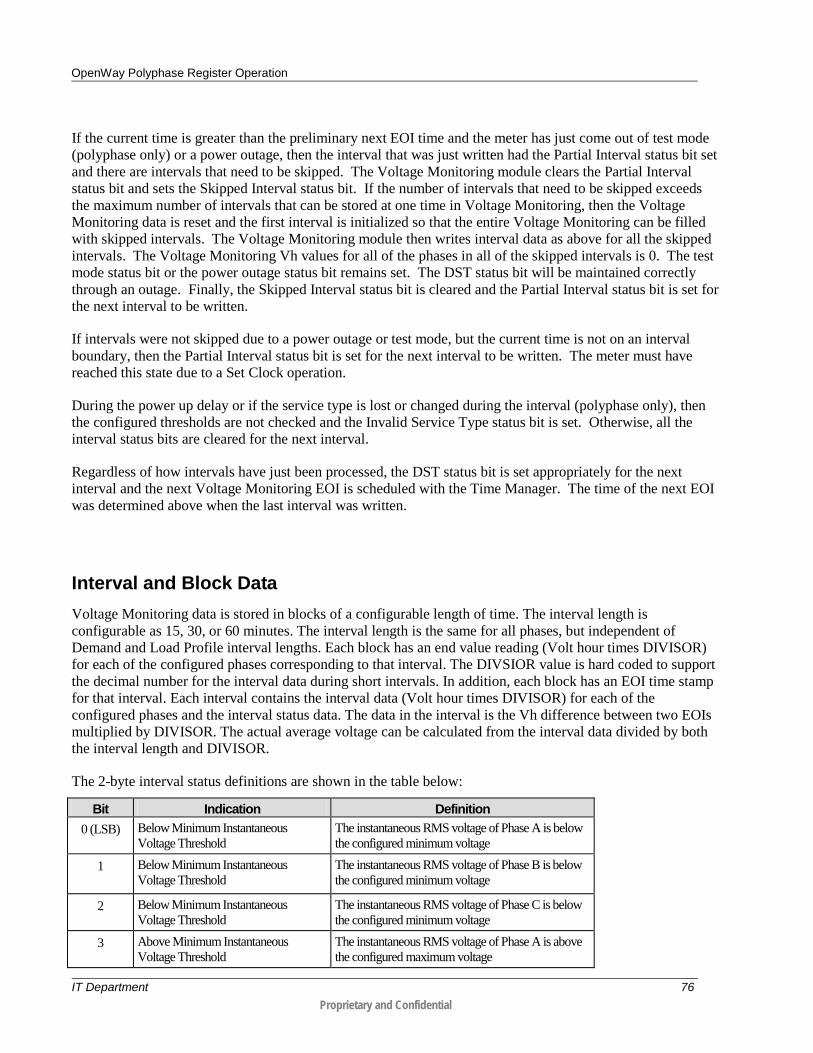
OpenWay Polyphase Register Operation
If the current time is greater than the preliminary next EOI time and the meter has just come out of test mode (polyphase only) or a power outage, then the interval that was just written had the Partial Interval status bit set and there are intervals that need to be skipped. The Voltage Monitoring module clears the Partial Interval status bit and sets the Skipped Interval status bit. If the number of intervals that need to be skipped exceeds the maximum number of intervals that can be stored at one time in Voltage Monitoring, then the Voltage Monitoring data is reset and the first interval is initialized so that the entire Voltage Monitoring can be filled with skipped intervals. The Voltage Monitoring module then writes interval data as above for all the skipped intervals. The Voltage Monitoring Vh values for all of the phases in all of the skipped intervals is 0. The test mode status bit or the power outage status bit remains set. The DST status bit will be maintained correctly through an outage. Finally, the Skipped Interval status bit is cleared and the Partial Interval status bit is set for the next interval to be written.
If intervals were not skipped due to a power outage or test mode, but the current time is not on an interval boundary, then the Partial Interval status bit is set for the next interval to be written. The meter must have reached this state due to a Set Clock operation.
During the power up delay or if the service type is lost or changed during the interval (polyphase only), then the configured thresholds are not checked and the Invalid Service Type status bit is set. Otherwise, all the interval status bits are cleared for the next interval.
Regardless of how intervals have just been processed, the DST status bit is set appropriately for the next interval and the next Voltage Monitoring EOI is scheduled with the Time Manager. The time of the next EOI was determined above when the last interval was written.
Interval and Block Data Voltage Monitoring data is stored in blocks of a configurable length of time. The interval length is configurable as 15, 30, or 60 minutes. The interval length is the same for all phases, but independent of Demand and Load Profile interval lengths. Each block has an end value reading (Volt hour times DIVISOR) for each of the configured phases corresponding to that interval. The DIVSIOR value is hard coded to support the decimal number for the interval data during short intervals. In addition, each block has an EOI time stamp for that interval. Each interval contains the interval data (Volt hour times DIVISOR) for each of the configured phases and the interval status data. The data in the interval is the Vh difference between two EOIs multiplied by DIVISOR. The actual average voltage can be calculated from the interval data divided by both the interval length and DIVISOR.
The 2-byte interval status definitions are shown in the table below:
Bit Indication Definition 0 (LSB) Below Minimum Instantaneous
Voltage Threshold The instantaneous RMS voltage of Phase A is below the configured minimum voltage
1 Below Minimum Instantaneous Voltage Threshold
The instantaneous RMS voltage of Phase B is below the configured minimum voltage
2 Below Minimum Instantaneous Voltage Threshold
The instantaneous RMS voltage of Phase C is below the configured minimum voltage
3 Above Minimum Instantaneous Voltage Threshold
The instantaneous RMS voltage of Phase A is above the configured maximum voltage
IT Department 76 Proprietary and Confidential

OpenWay Polyphase Register Operation
Bit Indication Definition 4 Above Minimum Instantaneous
Voltage Threshold The instantaneous RMS voltage of Phase B is above the configured maximum voltage
5 Above Minimum Instantaneous Voltage Threshold
The instantaneous RMS voltage of Phase C is above the configured maximum voltage
6 Invalid or Changed Service Type A valid service type does not exist or it has changed
7 0 Reserved
8 Partial Interval Set to “1” if a time adjustment forward occurs during the interval. “0” otherwise.
9 Long Interval Set to “1” if a time adjustment is backward to a time before the beginning of the interval. “0” otherwise.
10 Skipped Interval Set to “1” if a time adjustment is forward to a time after the end of the interval. “0” otherwise.
11 Test Mode (Polyphase Only) Set to “1” if Meter was in Test Mode during this interval.
12 DST Set to “1” if DST is in effect during or at start of interval.
13 Power Outage Set to “1” if Power Outage was present during the interval (outage must be longer than minimum time). “0” otherwise.
14 Time Adjustment Forward Set to “1” if a time adjustment forward has occurred during this interval. “0” otherwise.
15 (MSB) Time Adjustment Backward Set to “1” if a time adjustment backward has occurred during this interval. “0” otherwise.
Nominal Voltage Calculation To support the percentage threshold configuration, the nominal voltages for the configured phases are calculated when Voltage Monitoring is configured. The calculation is based on the meter service type and Phase A voltage. If the service voltage is configured in SiteScan, Phase A nominal voltage can be obtained from the relationship between service voltage and Phase A nominal voltage according to the service type. If the service voltage is not configured in SiteScan, a sampled Phase A voltage can be used to determine Phase A nominal voltage by comparing the sampled value with predefined nominal voltages (120V, 240V, 277V and 480V). If the meter has a Phase A nominal voltage other than these predefined values, then the service voltage of the meter must be configured in SiteScan such that Phase A nominal voltage can be calculated from the configured service voltage.
Once Phase A nominal voltage is calculated, the nominal voltages for Phase B and Phase C are further determined according to the service type under which the meter is operating. The relationship between service voltage and Phase A nominal voltage and the relationship between nominal voltages of Phase B, Phase C and Phase A are shown in the table below.
Service Type Value
Service Type Name Meter Form Service Voltage
Phase B Voltage (VB)
Phase C Voltage (VC)
0 3 Element 4-Wire Wye 9S, 16S VA VB = VA VC = VA
IT Department 77 Proprietary and Confidential

OpenWay Polyphase Register Operation
Service Type Value
Service Type Name Meter Form Service Voltage
Phase B Voltage (VB)
Phase C Voltage (VC)
1 2½ Element 4-Wire Wye 36S, 46S VA VB = VA VC = VA
2 2 Element Network 12S, 45S VA VB = 0 VC = VA
3 3 Element 4-Wire Delta 9S, 16S 2*VA VB = VA VC = VA
4 2 Element 4-Wire Wye 45S VA VB = 0 VC = VA
5 2 Element 3-Wire Delta 12S, 45S, 66S VA VB = 0 VC = VA
6 2 Element 4-Wire Delta 45S VA VB = 0
7 2 Element Single 12S, 45S 2*VA VB = 0 VC = VA
8 1 Element 3-Wire 2S, 4S VA VB = 0 VC = 0
9 1 Element 2-Wire 1S, 3S VA VB = 0 VC = 0
10 2½ Element 4-Wire Wye
9S doing 36S/46S (96S) VA VB = VA VC = VA
254 Auto Detect (with No "B" Phase Present)
255 Auto Detect
* In this case Voltage Monitoring shall continue to run, but not check the events upon EOI.
Service Type Handling The service type is critical to the calculation of nominal voltages. First, the meter may experience the loss of a valid service type during operation. Second, SiteScan may override the service type if it has a configured valid service type, which might cause the meter service type to be changed during power up. Voltage Monitoring can handle the service type loss and change.
If Voltage Monitoring is enabled, it checks the service type every second. If it detects that the meter loses a valid service type during an interval, Voltage Monitoring marks the interval and skips checking the configured event thresholds when the interval EOI is executed. Voltage Monitoring recalculates the nominal voltages when a valid service is detected again.
After power up, Voltage Monitoring uses the startup delay time as configured in SiteScan to delay the checking of interval events thresholds. In other words, any interval whose EOI time is within the delay time does not check the event thresholds. This is because the service type is not determined yet during that time. After the delay, the Voltage Monitoring one second function checks the service type and if it detects a change of service type, it marks the interval, recalculates the nominal voltages and skips checking the configured event thresholds for the interval during which the service type is changed.
IT Department 78 Proprietary and Confidential

OpenWay Polyphase Register Operation
Threshold Monitoring Every second during the interval, current RMS voltage is compared with minimum and maximum voltages in each phase. If current RMS voltage is less than the minimum voltage, the minimum voltage is set to be current RMS voltage. If current RMS voltage is greater than the maximum voltage, the maximum voltage is set to be current RMS voltage.
At EOI, if the service type has not experienced the loss or change during the interval, Voltage Monitoring module checks if the minimum voltage value during the interval is below the configured RMS Low Voltage Threshold Percentage multiplied by the Nominal Voltage, or the maximum value during the interval is above the configured RMS High Voltage Threshold Percentage multiplied by the Nominal Voltage. If either condition exists, a corresponding event is recorded and a bit is set in the interval status. The minimum and maximum values are reset for the next interval tracking. The Voltage Monitoring module also checks if the accumulation value during the interval is below the configured Vh Low Voltage Threshold Percentage/100*Nominal Voltage*Interval Length/60 or above the configured Vh High Voltage Threshold Percentage/100 *Nominal Voltage*Interval Length/60). If either condition exists, a corresponding event is recorded, but no bit is set in the interval status.
Reconfiguration Voltage Monitoring supports meter reconfiguration. Voltage Monitoring is enabled or disabled by meter reconfiguration and is tracked by a flag stored in a meter table. The table below shows the results after reconfiguration under different scenarios.
Enable Flag Before
Reconfiguration
Enable Flag After
Reconfiguration
Result After Reconfiguration
FALSE FALSE Voltage Monitoring is disabled.
FALSE TRUE Voltage Monitoring is enabled and starts running.
TRUE FALSE Voltage Monitoring is disabled. But all existing data are still readable.
TRUE TRUE Voltage Monitoring is enabled. If configuration is changed, Voltage Monitoring restarts. Otherwise, Voltage Monitoring keeps running.
IT Department 79 Proprietary and Confidential

OpenWay Polyphase Register Operation
Time Adjustment Upon time adjustment, Voltage Monitoring performs operations both before and after the actual time change.
Before the Time Change If Voltage Monitoring is enabled, then Voltage Monitoring checks the direction of the time change.
• If the time change is a jump backward, then the status bits in the current Voltage Monitoring interval are set for a Long Interval and a Time Change Backward.
• If the Time Change is forward, then the status bits in the current Voltage Monitoring interval are set for a Partial Interval and a Time Change Forward.
• If the Time Change jumps forward to a time that is beyond the current interval, then the current interval is written and any intervals between the current interval and the interval that is being jumped to are written with the status bits set for a Skipped Interval and a Time Change Forward.
• If the Time Change jumps to the beginning of an interval, then no Time Change status bits are set for that interval.
• If the Time Change jumps to the middle of an interval, then the status bits are set for a Partial Interval and a Time Change Forward.
After the Time Change If Voltage Monitoring is already enabled, then the next Voltage Monitoring EOI event is scheduled with the Time Manager and the DST status bit is set appropriately for that interval. If Voltage Monitoring is not enabled, then no operation is performed.
DST Adjustment Voltage Monitoring supports the DST time adjustment. The meter always uses GMT time. To indicate DST, the DST bit in the interval status is set if DST is in effect at the start of an interval.
Test Mode Operation Voltage Monitoring supports Test Mode operation. When the meter enters test mode, all scheduled events in the meter are disabled. Thus, the Voltage Monitoring is paused during test mode operation. When the meter exits test mode, Voltage Monitoring skips all intervals during test mode and marks them as skipped intervals. It then schedules the next Voltage Monitoring EOI event and resumes normal operation.
IT Department 80 Proprietary and Confidential

OpenWay Polyphase Register Operation
Periodic Read When a Periodic Read is requested, a Requested Time is calculated from the time parameters. The time parameters include a start time and an end time for the requested data range. A Periodic Read queue entry is made that schedules a callback at the Requested Time.
When the callback occurs, the callback function pulls the entry from the Periodic Read queue. If the action specified is requesting the Voltage Monitoring data, Voltage Monitoring reports the data to the host through the C12.22 interface in the following manner:
1. The earliest time and latest time among current Voltage Monitoring block data are calculated. They are compared with the start time and end time passed from the Periodic Read request. If the start time is less than the earliest time, the start time is set to the earliest time. If the end time is greater than the latest time, the end time is set to the latest time. If the end time is less than the earliest time or the start time is greater than the latest time, no data are returned and the process is ended.
2. Otherwise, it finds the block number corresponding to the first block having a block end time no less than the start time among all blocks. It also finds the block number corresponding to the first block having a block end time no less than the end time. Then it calculates the number of blocks to be reported.
3. Voltage Monitoring reports the data by iterating all reported blocks with the block numbers between the starting block number and the ending block number. Each reported block has a Request Start Time. The Request Start Time of the starting block number is the start time from the Periodic Read request. The Request Start Time of any other block is the block end time of the previous iterated block.
4. It then calculates the number of intervals between Request Start Time and the block end time. It also calculates the number of total valid intervals in this block. Based on these two data, it obtains the first interval to be reported in this block.
5. For each block to be reported, an offset table read is sent to the C12.22 interface through the C12.22 API interface. It first sends the block head data via an offset table read. Then it generates another offset table read for all reported interval data with the information of the first interval number and the number of intervals to be reported in this block.
6. The Periodic Read request is completed when the iteration is ended.
Voltage Monitoring Recording Duration The table below shows the recording duration (in days) for 144 kilobytes (KB) voltage monitoring memory size.
Number of Phases
Interval Length (Minutes) 5 10 15 30 60
1 126 253 379 759 1519
2 84 168 252 505 1011
3 63 126 189 379 758
IT Department 81 Proprietary and Confidential

OpenWay Polyphase Register Operation
Calculating Voltage Monitoring Size Number of Blocks
The size of a block in memory is computed as follows:
Block Size = Number of Intervals * ((Number of Phases * 2 Bytes Interval Data) + 2 Bytes Status)) + 4 Bytes Time Stamp + (Number of Phases * 4 Bytes End Values) + (Number of Intervals / 8) Bytes Simple Interval Status
The Number of Blocks in Memory is computed as:
Number of Blocks = (Configured Memory Size * 1024) / Block Size
If the blocks do not fit evenly into the configured memory size, then the last block that straddles the configured memory size boundary shall always be included unless it also straddles the maximum memory size boundary.
Number of Days
The Number of Days can be calculated as follows:
Number of Minutes = Number of Blocks * Number of Intervals * Configured Interval Length
Number of Days = Number of Minutes / 1440 Minutes Per Day
Size of Table 2152
Table Size = Number of Blocks * Block Size
Duration Calculation
If Number of Intervals = 128, Number of Phases = 1 and memory size = 145.25K bytes; then
Block Size = 536 Bytes
Number of Blocks = (Configured Memory Size * 1024) / Block Size
145.25*1024/536 = 277
Therefore, if Configured Interval Length = 60 minutes, the Voltage Monitoring data can be stored up to:
Number of Days = 277*128*60/1440 = 1477.33 days
If Configured Interval Duration = 15 minutes:
Number of Days = 277*128*15/1440 = 369.33 days
IT Department 82 Proprietary and Confidential

OpenWay Polyphase Register Operation
If Configured Interval Duration = 1 minute:
Number of Days = 277*128*1/1440 = 24.62 days
Power Outage Notification (PON) and Restoration (PRN)
Outage The OpenWay CENTRON meter provides a feature known as Power Outage Notification (PON). At the point of AC power loss for more than 1.0 seconds, the meter enters ultra-low power mode. Upon a power outage, the OpenWay CENTRON meter three separate messages, randomized in 3 intervals of 5 seconds, into the OpenWay system. These messages are received into the system through any OpenWay CENTRON meter that is connected on the network and not in a state of power loss. Any meter in the network that receives the message has direction to pass the message up to the cell relay.
The outage alarm in the OpenWay CENTRON meter uses the network time which means the alarm time stamp could be up to 15 seconds (depending which outage alarm makes it the 1st, 2nd or 3rd as time is stamped by the receiving meter) off from the history log or register time.
Restoration Upon a power restoration, the meter has the functionality to alert the utility that the premise is online. This feature is known as Power Restoration Notification (PRN). After power-up, the OpenWay CENTRON meter will join the network. Once the meter has re-synchronized to the network, it will send its restoration event through the system via a standard C12.22 message structure. These messages are received in a similar way as PON messages and include the time stamp of the restoration.
Multiple Self Reads The OpenWay CENTRON meter can read and store multiple self reads for extraction by the OpenWay system. This includes both a single automatic self read configured for a specific time of day (typically midnight) as well as self reads associated with interrogation requests from the Collection Engine.
Extended Self Read Data Extended Self Read data is supported by the ITRF device class. This data is an optional configuration item, and when enabled, adds additional data fields to each self read. Configurable data fields include:
Quantity Inst Watts Phase A Inst Watts Phase B Inst Watts Phase C Inst VARs Phase A
IT Department 83 Proprietary and Confidential

OpenWay Polyphase Register Operation
Quantity Inst VARs Phase B Inst VARs Phase C Inst Volts Phase A Inst Volts Phase B Inst Volts Phase C Inst Watts Total Inst VAR Total Inst VA Total (Vectorial)
Event (History) Log The OpenWay Register has an Event (History) Log that records historical events that have taken place in the meter. The OpenWay Register Event Log is circular in nature, allowing for the capture of the most recent events in the meter at all times. The meter is capable of retaining 420 events prior to wrapping.
Each event log record includes an event description, a time and date stamp, and additional information on certain events. All logged events are retained through a power outage.
The OpenWay Register can monitor C12.22 Exceptions. C12.22 Exceptions are sent to the collection engine as soon as possible after their occurrence, but are not stored in the meter as other events are. The contents of the event log are sent to the collection engine daily. An "X" in the C12.22 Exception Alarm column indicates the events that can be configured as Exception Alarms. An "X" in the Configured in CE column indicates the events that can be configured in the OpenWay Collection Engine.
Event Name C12.22 Exception Alarm
Configured in CE Event Description
Primary Power Down X Power Outage (only with battery)
Primary Power Up X X Power Restored
Clear Billing Data X Billing Data was cleared
Billing Schedule Expiration X Billing Schedule to expire in one year
Time Change X Time changed either manually or via time sync
ANSI Security Fail X Incorrect password used over the optical port
History Log Cleared X History log was cleared
Demand Reset X X Demand reset was initiated
Self Read Occurred X Self read occurred; Scheduled or ANSI command
SiteScan Error (Polyphase Only)
X Unable to determine Service Type
Pending Table Activation Pending table successfully activated
IT Department 84 Proprietary and Confidential

OpenWay Polyphase Register Operation
Event Name C12.22 Exception Alarm
Configured in CE Event Description
Pending Table Clear Pending table successfully cleared
Test Mode Enter (Polyphase Only) X Meter entered Test Mode
Test Mode Exit (Polyphase Only)
X Meter exited Test Mode
ABC Phase Rotation Active (Polyphase Only)
X ABC Phase Rotation Detected
CBA Phase Rotation Active (Polyphase Only)
X CBA Phase Rotation Detected
Meter Reconfigure Meter reconfigure occurred
Configuration Error X X Error occurred during a reconfigure, configuration rejected
CPC Communication Error (Polyphase Only)
X X Generated after 15 consecutive failures to communicate with CPC
TOU Schedule Error X Current year or season not programmed or no battery
Mass Memory Error Load Profile halted due to outage or the meter was configured without a battery
Loss of Phase Restore (Polyphase Only)
Power on all phases restored
Low Battery X Battery voltage has fallen below 3.2V
Loss of Phase Detected loss on power on a phase
Register Full Scale Exceeded X Wh register has exceeded threshold
Reverse Power Flow X X Detected reverse power flow on one or more phases
SiteScan Diag 1 Active (Polyphase Only)
X Polarity, cross-phase, and energy flow check
SiteScan Diag 2 Active (Polyphase Only)
X Phase voltage deviation check
SiteScan Diag 3 Active (Polyphase Only)
X Inactive phase current check
SiteScan Diag 4 Active (Polyphase Only)
X Phase angle displacement check
SiteScan Diag 1 Inactive (Polyphase Only)
X Polarity, cross-phase, and energy flow check
SiteScan Diag 2 Inactive (Polyphase Only)
X Phase voltage deviation check
SiteScan Diag 3 Inactive (Polyphase Only)
X Inactive phase current check
SiteScan Diag 4 Inactive (Polyphase Only)
X Phase angle displacement check
IT Department 85 Proprietary and Confidential

OpenWay Polyphase Register Operation
Event Name C12.22 Exception Alarm
Configured in CE Event Description
Inversion Tamper Detected X X Inversion Tamper detected by the meter
Removal Tamper Detected X X Removal Tamper detected by the meter
Register Download Failed X Register Download failed for the described reasons
Register Download Success Register Download was successful
RFLAN Download Success RFLAN Download was successful
ZigBee Download Success ZigBee Download was successful
Meter Firmware Download Success This event reports the Firmware Download status along a successful path
Meter Firmware Download Failed X This event reports a failure in the Firmware Download process to the meter
ZigBee Download Failed X ZigBee download failed for any of the reasons
RFLAN Download Failed X RFLAN download failed for any of the reasons
SiteScan Error Clear X SiteScan errors have been cleared
Fatal Error X Logged whenever a Fatal error is detected
PR Transmit Report 0 Indicates a periodic read has occurred
Service Limiting Active Tier Changed
Logged whenever a change in active tier for service limiting is requested
Service Limiting Connect Switch
RND RCD Exceptions Unable to schedule randomized service limiting exception reporting
Service Limiting Switch Period
Table Written Event Table 2090 was written
BASE Mode Error X X Logged when a base configured for ENHANCED Mode does not respond with ENHANCED Mode messages
PR Demand Reset Used to schedule a Demand Reset related to a Periodic Read
PR Self Read Used to schedule a Self Read related to a Periodic Read
Pending Reconfigure X Pending (except the firmware download) table activated
Event Tamper Cleared X X Tamper event was cleared
IT Department 86 Proprietary and Confidential

OpenWay Polyphase Register Operation
Event Name C12.22 Exception Alarm
Configured in CE Event Description
Safe Init after Fatal 7
RND Power Up Used to schedule randomized power up events
Base Switch Command Used to periodically send base switch mode commands (SR 2.0 and above)
Voltage Monitoring EOI
Commit Lan Log No longer used, commented out
Commit Han Log No longer used, commented out
Lan Han Log Reset Reset of LAN and HAN logs
Lan Han Locate By Event
Lan Han Locate Byt Time
CONSTANT_IDS_RECONFIGURE
COEFFICIENTS_RECONFIGURE
CPC_RECONFIGURE
IO_OUT_RECONFIGURE
DEMAND_SCHEDULE_RECONFIG
TOU_DAY_TYPE1
TOU_Day_Type2
TOU_Day_Type3
TOU_Day_Type4
Pending Table Activate Fail
HAN Device Status Change Logged whenever a ZigBee Devices Status Changes
HAN Load Control Event Sent Logged whenever a load control message is sent to a device.
HAN Load Control Event Status Logged whenever a load control status message is received.
HAN Load Control Event Opt Out X Logged whenever a load control event status of Opt out is received.
HAN Messaging Event Logged whenever a Messaging Event is sent or received.
HAN Device Added or Removed Logged when a HAN device added or removed
Register Download Initiated The meter is ready to accept Register firmware blocks
IT Department 87 Proprietary and Confidential
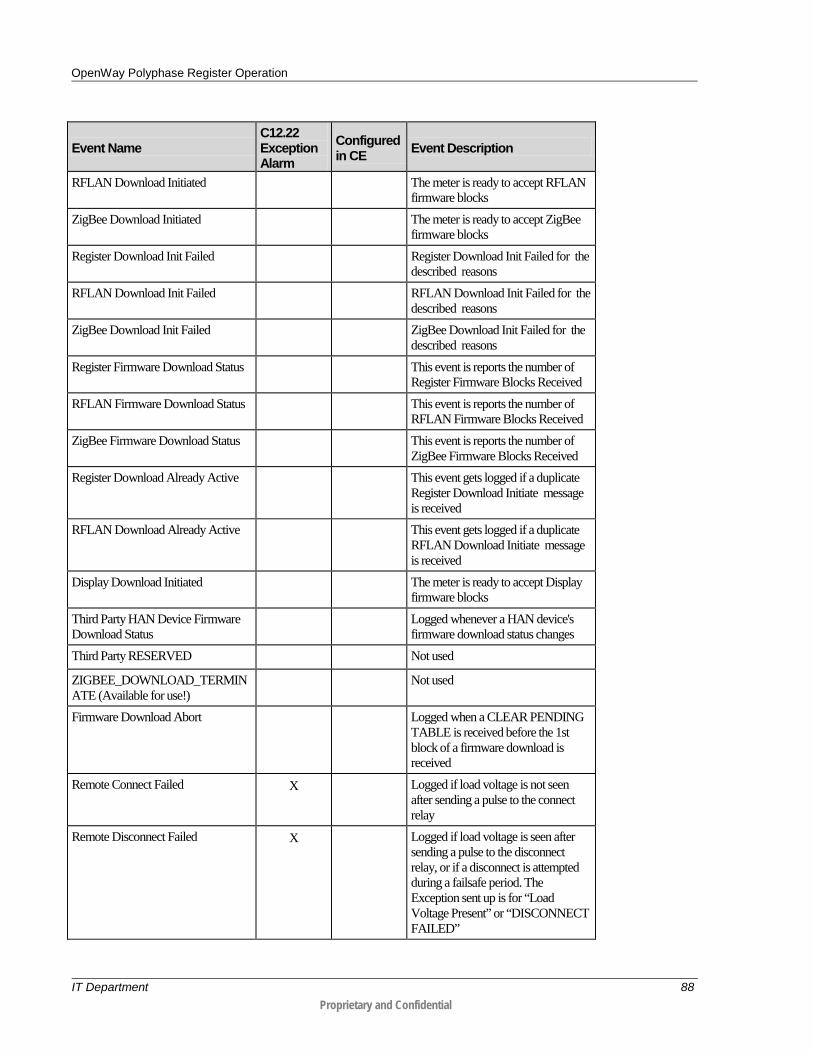
OpenWay Polyphase Register Operation
Event Name C12.22 Exception Alarm
Configured in CE Event Description
RFLAN Download Initiated The meter is ready to accept RFLAN firmware blocks
ZigBee Download Initiated The meter is ready to accept ZigBee firmware blocks
Register Download Init Failed Register Download Init Failed for the described reasons
RFLAN Download Init Failed RFLAN Download Init Failed for the described reasons
ZigBee Download Init Failed ZigBee Download Init Failed for the described reasons
Register Firmware Download Status This event is reports the number of Register Firmware Blocks Received
RFLAN Firmware Download Status This event is reports the number of RFLAN Firmware Blocks Received
ZigBee Firmware Download Status This event is reports the number of ZigBee Firmware Blocks Received
Register Download Already Active This event gets logged if a duplicate Register Download Initiate message is received
RFLAN Download Already Active This event gets logged if a duplicate RFLAN Download Initiate message is received
Display Download Initiated The meter is ready to accept Display firmware blocks
Third Party HAN Device Firmware Download Status
Logged whenever a HAN device's firmware download status changes
Third Party RESERVED Not used
ZIGBEE_DOWNLOAD_TERMINATE (Available for use!)
Not used
Firmware Download Abort Logged when a CLEAR PENDING TABLE is received before the 1st block of a firmware download is received
Remote Connect Failed X Logged if load voltage is not seen after sending a pulse to the connect relay
Remote Disconnect Failed X Logged if load voltage is seen after sending a pulse to the disconnect relay, or if a disconnect is attempted during a failsafe period. The Exception sent up is for “Load Voltage Present” or “DISCONNECT FAILED”
IT Department 88 Proprietary and Confidential
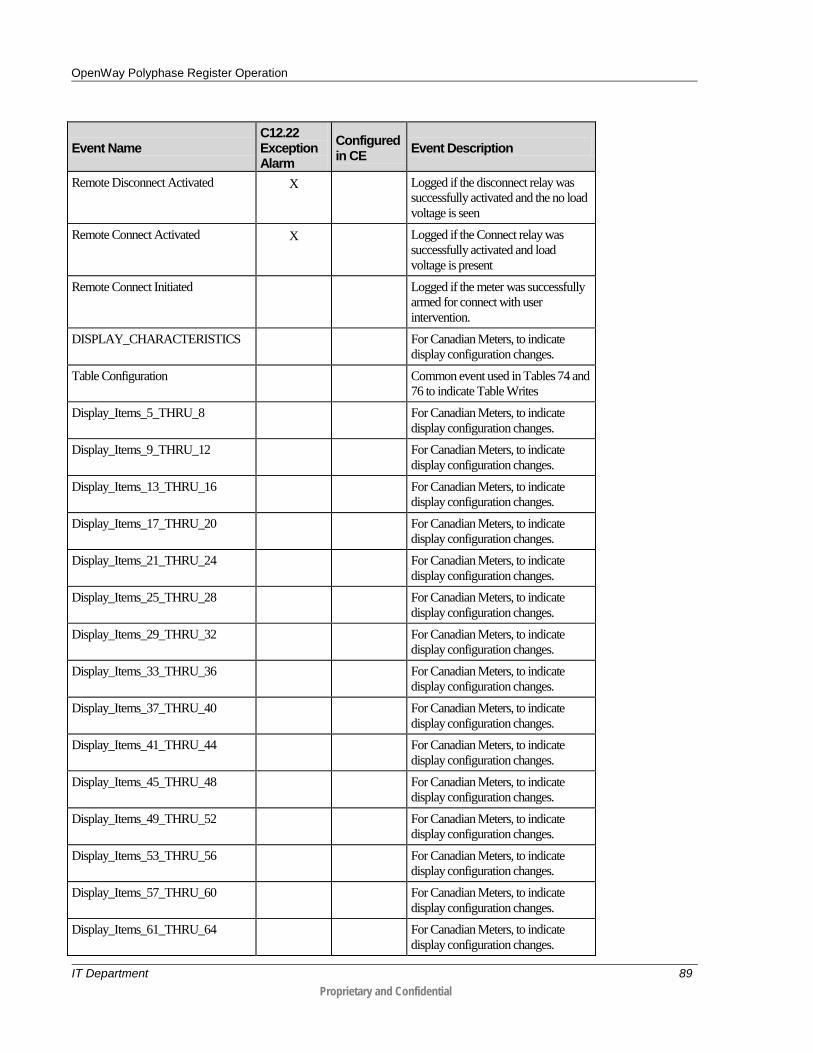
OpenWay Polyphase Register Operation
Event Name C12.22 Exception Alarm
Configured in CE Event Description
Remote Disconnect Activated X Logged if the disconnect relay was successfully activated and the no load voltage is seen
Remote Connect Activated X Logged if the Connect relay was successfully activated and load voltage is present
Remote Connect Initiated Logged if the meter was successfully armed for connect with user intervention.
DISPLAY_CHARACTERISTICS For Canadian Meters, to indicate display configuration changes.
Table Configuration Common event used in Tables 74 and 76 to indicate Table Writes
Display_Items_5_THRU_8 For Canadian Meters, to indicate display configuration changes.
Display_Items_9_THRU_12 For Canadian Meters, to indicate display configuration changes.
Display_Items_13_THRU_16 For Canadian Meters, to indicate display configuration changes.
Display_Items_17_THRU_20 For Canadian Meters, to indicate display configuration changes.
Display_Items_21_THRU_24 For Canadian Meters, to indicate display configuration changes.
Display_Items_25_THRU_28 For Canadian Meters, to indicate display configuration changes.
Display_Items_29_THRU_32 For Canadian Meters, to indicate display configuration changes.
Display_Items_33_THRU_36 For Canadian Meters, to indicate display configuration changes.
Display_Items_37_THRU_40 For Canadian Meters, to indicate display configuration changes.
Display_Items_41_THRU_44 For Canadian Meters, to indicate display configuration changes.
Display_Items_45_THRU_48 For Canadian Meters, to indicate display configuration changes.
Display_Items_49_THRU_52 For Canadian Meters, to indicate display configuration changes.
Display_Items_53_THRU_56 For Canadian Meters, to indicate display configuration changes.
Display_Items_57_THRU_60 For Canadian Meters, to indicate display configuration changes.
Display_Items_61_THRU_64 For Canadian Meters, to indicate display configuration changes.
IT Department 89 Proprietary and Confidential

OpenWay Polyphase Register Operation
Event Name C12.22 Exception Alarm
Configured in CE Event Description
Display_Items_65_THRU_68 For Canadian Meters, to indicate display configuration changes.
Display_Items_69_THRU_72 For Canadian Meters, to indicate display configuration changes.
Display_Items_73_THRU_76 For Canadian Meters, to indicate display configuration changes.
Display_Items_77_THRU_80 For Canadian Meters, to indicate display configuration changes.
SEAL_METER
UNSEAL_METER
BILLING_SCHEDULE_RECONFIG
BILLING_SCHEDULE_Items_0_23
BILLING_SCHEDULE_Items_24_47
BILLING_SCHEDULE_Items_48_71
BILLING_SCHEDULE_Items_72_95
BILLING_SCHEDULE_Items_96_119
BILLING_SCHEDULE_Items_120_143
BILLING_SCHEDULE_Items_144_167
BILLING_SCHEDULE_Items_168_191
BILLING_SCHEDULE_Items_192_215
BILLING_SCHEDULE_Items_216_239
BILLING_SCHEDULE_Items_240_263
BILLING_SCHEDULE_Items_264_287
BILLING_SCHEDULE_Items_288_299
Self Read Reconfiguration
Constant Fields Reconfiguration
Network Hush Started Logged on reception of a network hush procedure
IT Department 90 Proprietary and Confidential
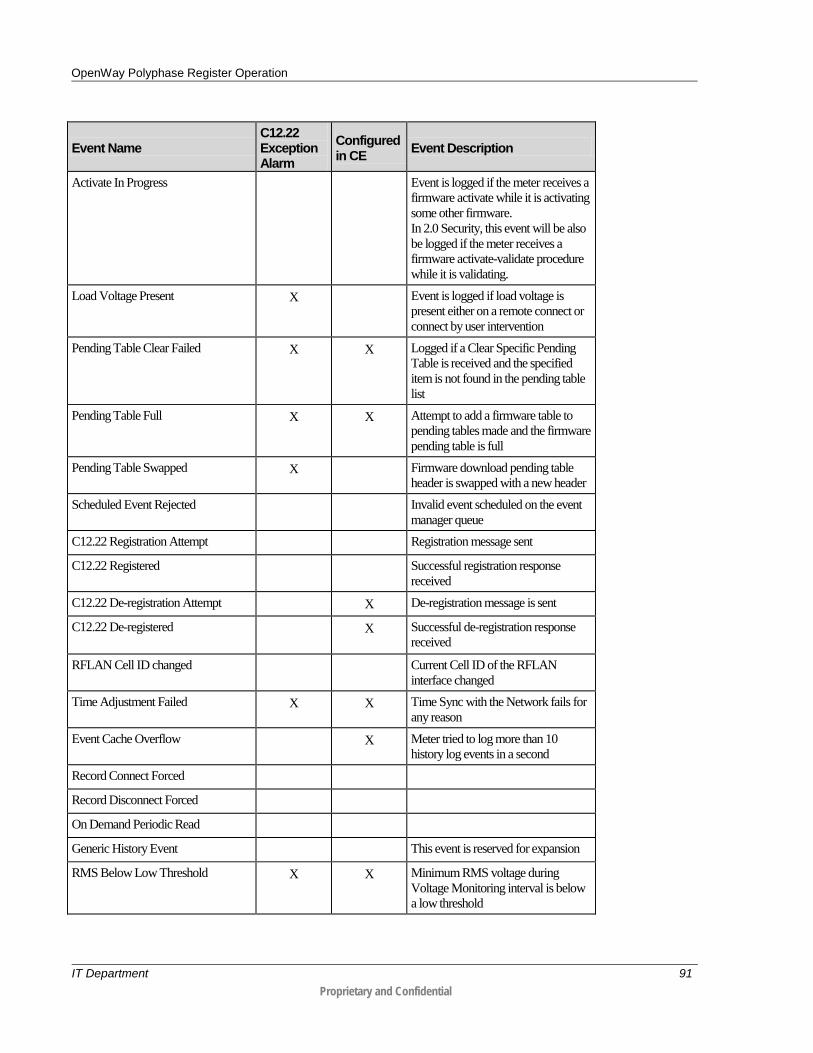
OpenWay Polyphase Register Operation
Event Name C12.22 Exception Alarm
Configured in CE Event Description
Activate In Progress Event is logged if the meter receives a firmware activate while it is activating some other firmware. In 2.0 Security, this event will be also be logged if the meter receives a firmware activate-validate procedure while it is validating.
Load Voltage Present X Event is logged if load voltage is present either on a remote connect or connect by user intervention
Pending Table Clear Failed X X Logged if a Clear Specific Pending Table is received and the specified item is not found in the pending table list
Pending Table Full X X Attempt to add a firmware table to pending tables made and the firmware pending table is full
Pending Table Swapped X Firmware download pending table header is swapped with a new header
Scheduled Event Rejected Invalid event scheduled on the event manager queue
C12.22 Registration Attempt Registration message sent
C12.22 Registered Successful registration response received
C12.22 De-registration Attempt X De-registration message is sent
C12.22 De-registered X Successful de-registration response received
RFLAN Cell ID changed Current Cell ID of the RFLAN interface changed
Time Adjustment Failed X X Time Sync with the Network fails for any reason
Event Cache Overflow X Meter tried to log more than 10 history log events in a second
Record Connect Forced
Record Disconnect Forced
On Demand Periodic Read
Generic History Event This event is reserved for expansion
RMS Below Low Threshold X X Minimum RMS voltage during Voltage Monitoring interval is below a low threshold
IT Department 91 Proprietary and Confidential

OpenWay Polyphase Register Operation
Event Name C12.22 Exception Alarm
Configured in CE Event Description
RMS Above High Threshold X X Maximum RMS voltage during Voltage Monitoring interval is above a high threshold
Volt Hour Below Low Threshold X X Volt Hour during Voltage Monitoring interval is below a low threshold
Volt Hour Above High Threshold X X Volt Hour during Voltage Monitoring interval is above a high threshold
Pending Table Error Error occurred during pending table procedure
FW DL Debug Provides detailed history of firmware download actions
Security Event Events that are related to the security of the meter's operations
Key Rollover Pass If key rollover passed
Sign Key Replace Processing Pass If Replacing Signing Key passed
Symmetric Key Replace Processing Pass
If Replacing Symmetric Key passed
Additional tables in the following sections describe these specific types of events:
• Download-related events
• LAN/HAN-related events
• Remote Disconnect-related events
• Security-related events
IT Department 92 Proprietary and Confidential

OpenWay Polyphase Register Operation
Users can configure the meter to enable or disable logging of these items individually. All firmware download events default to be logged in the configuration files generated by the Collection Engine.
Events are logged in a RAM image of a data flash page. A data flash page consists of 256 bytes of data. One page of events can be committed to data flash at a time. When a page boundary is crossed, the events on the previous page are committed to the data flash and the RAM image represents the next page of data flash.
On a Demand-only meter, events that have not been committed to data flash can be lost due to a power outage (at most, one page of events can be lost). Due to this, there are two sets of History Log control variables: a RAM image set that includes uncommitted events, and an Early Power Failure (EPF) backed set that only includes committed events. When events are committed to data flash, both sets of control variables will agree.
There are several instances where events are committed to the data flash. These are:
• Command Time Change
• DST Adjustment
• Enter Test Mode (polyphase meters only)
• Exit Test Mode (polyphase meters only)
• Register Firmware Download Over The Network
In addition, events are committed to data flash at a time relative to the occurrence of an event. The algorithm for this is as follows:
• When an event is logged, if a Commit History Log event is not already scheduled, then one is scheduled to occur in 5 seconds.
• When a Commit History Log is performed (due to either a Commit History Log event, a Time Change event, a DST Time Adjustment event, an Enter Test Mode event, or an Exit Test Mode event), then, if an event has occurred since the last Commit History Log, another Commit History Log event is scheduled to occur in one hour.
When the number of new events on the current data flash page has been reached and a new event occurs, the new event will go on the next page. If this is the first page boundary crossing since the last Commit History Log, then the current page will be committed to data flash, the new event will be logged on the next page, and a Commit History Log event may be scheduled as described above. If this is the second page boundary crossing since the last Commit History Log, then the new event will be discarded. This is to prevent a run-away condition from rapidly filling the log and potentially exceeding the allowable number of write operations to the data flash.
Currently, the History Log has 20 pages of data flash dedicated to it. If a run-away condition occurs and persists, the History Log will fill and wrap approximately once a day (or 20 hours). In the unlikely case that a meter has a run-away condition, then each data flash page of the History Log is written to more than once a day. If this condition persisted for 20 years, then the number of write operations to the data flash pages should still be within the limits of the chip.
IT Department 93 Proprietary and Confidential

OpenWay Polyphase Register Operation
Download Events The table below describes the events related to downloads.
Event Name C12.22 Exception Alarm
Configured in CE Event Description
Register Download Failed Register download failed for the described reasons
Register Download Success Register Download was successful
RFLAN Download Success RFLAN download was successful
ZigBee Download Success ZigBee download was successful
Meter Firmware Download Success
Meter firmware download was successful
Meter Firmware Download Failed
Meter firmware download failed
ZigBee Download Failed ZigBee download failed
RFLAN Download Failed RFLAN download failed
Register Download Initiated Meter ready to accept Register firmware blocks
RFLAN Download Initiated Meter ready to accept RFLAN firmware blocks
ZigBee Download Initiated Meter ready to accept ZigBee firmware blocks
Register Download Initiation Failed
Register download initialization failed for the described reasons
RFLAN Download Initiation Failed
RFLAN download initialization failed for the described reasons
ZigBee Download Initiation Failed
ZigBee download initialization failed for the described reasons
Register Firmware Download Status
Reports the number of Register firmware blocks received
RFLAN Firmware Download Status
Reports the number of RFLAN firmware blocks received
ZigBee Firmware Download Status
Reports the number of ZigBee firmware blocks received
ZigBee Device Status Change Event
X Logged whenever a Zigbee Devices Status Changes
Logged whenever a ZigBee Devices Status Changes
ZigBee Message Event X Logged whenever a Messaging Event is sent or received .
Register Download Already Active
Duplicate Register download initiate message received
IT Department 94 Proprietary and Confidential

OpenWay Polyphase Register Operation
Event Name C12.22 Exception Alarm
Configured in CE Event Description
RFLAN Download Already Active
Duplicate RFLAN download initiate message received
Third Party HAN Device Firmware Download Status
HAN Device firmware download status changed
Security Events The meter categorizes security events into four event groups: first, second, third and fourth. The security events shown in the tables below may be configured for recording in the OpenWay Register Event Log. There are no Exception Alarms for the security events.
The First group, Security Generic Event Codes, indicate a failure in processing a security feature in the meter. There are 20 of these failures:
Event Name Event Description
Replay Attack The meter local time is greater than the time in the received message by 10 minutes.
Key Rollover No Key Failed The meter received a key-rollover request to rollover a key that cannot be identified by the meter. The only identified keys are: 7, 8, 9, and 10.
Hash 256 Processing Failed The Certicom Functions to do a HASH256 operation failed.
EDCSA Verify Failed Signature validation failed.
ECDSA Processing Failed Processing a Certicom Function to do signature validation failed.
ECDSA Incorrect Key Usage A user tried to sign the request Replace Signing Key using Revocation Key 5 or Revocation Key 6.
ECIES Decryption Processing Failed Processing ECIES decryption failed processing an Authenticate Request or a Replace Meter Key Request.
Unknown Asymmetric Sign Key The meter received a message that is signed by an unidentified command key. The only identified command keys are: 1, 2, 3, 4, 5 and 6.
Unknown Symmetric Sign Key The meter received a message that is encrypted with an unidentified meter key, or the meter received a message that is requesting the meter to encrypt the response with an unidentified meter key. The only identified keys are: 7, 8, 9, and 10.
IT Department 95 Proprietary and Confidential

OpenWay Polyphase Register Operation
Event Name Event Description
Unknown Key Logged if any of the following is true: a. Replace Meter Key failed because the requested key to be replaced is the same as the key used in the received message. b. Replace Signing Key failed because the requested key to be replaced is the same as the key used in the received message. c. Key Rollover failed because the requested key to be rolled over is the same as the key used in the received message. d. The meter received a message that was encrypted with AES using a key that is not identified by the meter (not any one of key slot 7, 8, 9, and 10). This event will be logged if and only if the meter was authenticated and registered. e. The meter received a message that has a logon procedure with enhanced security. If the meter passes the signature verification, but the meter is not authenticated, it will log this event and reject the request. f. The meter received an Activate New Firmware command. If the meter passes the signature verification, but the meter is not authenticated, it will log this event and reject the request. g. The meter received a message. If the meter passes the signature verification, but the meter is not authenticated, it will log this event and reject the request.
Storing Keys Failed The meter failed to store a key in data flash. Specifically, the meter tried to store new keys in response to one of the following commands: Meter Key Replacement Request, Signing Key Replacement Request, Authentication Request, or Key Rollover Request.
Reading Keys Failed The meter failed reading a key (7, 8, 9, or 10) from data flash. Specifically, the meter tried to decrypt a key, but processing Certicom AES decryption function failed.
Key Rollover Failed Processing a Key Rollover request failed. Replace Meter Key Failed Processing a Replace Meter Key request failed. Replace Sign Key Failed Processing a Replace Signing Key request failed. ANSIX931 Processing Failed Processing a Certicom function to do ANSI X931 failed. This
occurs in a Key Rollover operation. IV Generate Processing Failed Processing a Certicom function ANSI X931 failed. This occurs
when the meter prepares a response message, wants to encrypt it using AES, and wants to generate an IV to do this encryption.
HMAC Processing Failed Processing Certicom function HMAC failed. This occurs when the meter prepares a response message and wants to include the HMAC value in the message.
AES Decryption Processing Failed Processing a Certicom function to do AES decryption failed.
AES Encryption Processing Failed Processing a Certicom function to do AES encryption failed.
IT Department 96 Proprietary and Confidential

OpenWay Polyphase Register Operation
The Second group:
Event Name Event Description
Key Rollover Success Key rollover succeeded.
The Third group:
Event Name Event Description
Sign Key Replace Processing Success
Replacing signing key succeeded.
The Fourth group:
Event Name Event Description
Symmetric Key Replace Processing Success
Replacing symmetric key succeeded.
Interrogation and Configuration
Interrogation The meter can be interrogated via the optical port using PSEM protocol. The meter can also be interrogated using the ZigBee link. The meter can also be interrogated over the air via the Collection Engine.
IT Department 97 Proprietary and Confidential

OpenWay Polyphase Register Operation
Programming The software for programming the meter is a 32-bit Windows NT/2000/XP/Vista application. User-definable security codes in both the programming software and the meter prevent unauthorized access to the meter.
Programming and/or interrogation of the meter can be accomplished through the optical port or ZigBee link using a laptop PC running OpenWay Tools.
System Component Recommended Unsupported Windows 2000 X
Windows XP Professional (32 bit) SP3
Windows XP Professional (64 bit) X
Vista Enterprise (32 bit) SP2
Vista Enterprise (64 bit) X
Windows 7 Professional (32 bit) Enterprise Edition
Windows 7 Professional (64 bit)1 Enterprise Edition
Internet Explorer 8.0
1Itron will support Windows 7 (64 bit) through the Windows XP virtual machine. Contact your Itron Account Representative for more information.
Software Support The following software support is available for OpenWay CENTRON meters:
OpenWay Collection Engine:
• Program & TOU Schedule Development
• Remote Programming
• Remote Firmware Upgrading
OpenWay Tools:
• Meter Programming
• Disconnect/Reconnect
• Create Data Files
• Firmware Downloads
IT Department 98 Proprietary and Confidential

OpenWay Polyphase Register Operation
Firmware Upgrades Over the Air The meter's firmware can be upgraded via the RFLAN and through the optical port using OpenWay Field-Pro. If the upgrade is done locally, ensure that the correct firmware is reflected in OpenWay Shop Manager. RFLAN and ZigBee firmware requires extra time for loading and verification.
If a firmware upgrade fails to activate, the meter will return to the previous firmware version. If configured, an event can be recorded when a firmware upgrade is successful or fails, and an exception alarm can be sent to the Collection Engine for failures.
With Service Release 3.0, the system utilizes a 640 byte packet reducing the time for downloading firmware (high data rate meters).
Firmware Upgrades Optically To Import Firmware using OpenWay Shop Manager
1. Open the Shop Manager application (Start | Programs | OpenWay Tools | Shop Manager). If prompted, enter User ID and Password.
2. Go to the Firmware Files tab on the left side of the screen.
3. Under Program Options menu on the left side of the screen, click Import.
4. The Import Firmware dialog will open.
5. Click the Browse… button to locate the import files. These file have a .bin extension. Once the directory is located, click OK.
6. Check the firmware needing to be imported. To select the firmware listed, click the box next to the Firmware you want to import and click OK to begin the Import.
7. Go to the Firmware Files tab on the left side, and make sure that the firmware is checked to Active so it can be enabled in OpenWay Field-Pro.
To Import a Program
1. Open the Shop Manager application (Start | Programs | OpenWay Tools | Shop Manager). If prompted, enter User ID and Password.
2. Go to the Meter Programs tab on the left side of the screen.
3. Under Program Options menu on the left side of the screen, click Import.
4. The Import Programs dialog will open.
5. Click the Browse… button to locate the import files. Once the directory is located, click OK.
6. Check (or use the Select All feature) the programs needing to be imported. The file name of the program that is to be imported will have an .xml extension. To import the selected programs, click OK.
7. Go to the Meter Programs tab on the left side of the screen.
8. Make sure that the program you imported is checked to Active so it can be enabled in OpenWay Field-Pro.
IT Department 99 Proprietary and Confidential

OpenWay Polyphase Register Operation
9. Exit Shop Manager.
To Load Firmware using OpenWay Field-Pro
1. Open the OpenWay Field-Pro application (Start | Programs | OpenWay Tools | OpenWay Field-Pro).
2. Log on to the meter by selecting F1 log on.
3. Navigate to the Programming Functions | Firmware Load.
4. Check the Register Firmware that should be available on the right and click F1 Select Firmware File.
5. Click F1 Select Firmware File.
6. Click F1 Confirm Download to begin downloading the firmware.
To Load Program using OpenWay Field-Pro
1. Open the OpenWay Field-Pro application (Start | Programs | OpenWay Tools | OpenWay Field-Pro).
2. Log on to the meter by selecting F1 to log onto the meter.
3. Navigate to the Programming Functions | Initialize Device.
4. Highlight the program you want to load to the meter (make sure you select the program that corresponds to the correct meter).
5. Click F1 Initialize Meter.
Backward Compatibility 2G RFLAN
SR 3.x for 2G RFLAN is backward compatible to Hardware 2.0 meters (singlephase and polyphase) in the U.S.market.
Asset Synchronization Asset synchronization is a cooperative effort between the meter and the Collection Engine. Asset synchronization is turned on or off in the meter by enabling/disabling it in the collection engines configuration for the meter as shown below.
IT Department 100 Proprietary and Confidential

OpenWay Polyphase Register Operation
The collection engine and upstream systems are notified by the meter any time a modification is made to the meter by an entity other than the collection engine. The meter notifies the collection engine of a change by including information about the change in subsequent interrogation responses. The collection engine compares the new information against what is on file and notifies upstream systems of changes.
The firmware and configuration change events are delivered to upstream systems that subscribe to receive events if:
• Meter is registered and providing interrogation responses.
• Meter is running on SR 3.0 Register firmware or higher.
• Meter is operating with a Configuration Program definition from an SR 3.0 or higher OpenWay Collection Engine and the Enable Asset Synchronization checkbox is selected.
• Upstream systems are prepared to accept the new Events from the OpenWay Collection Engine.
The collection engine sends events to upstream subscribers (such as MDM’s) when the meter says the configuration has changed even if the configuration tag on file in the Collection Engine matches that of the meter. Such a notification might indicate a failed attempt to modify a meters configuration outside the collection engine. If the meter sends up a firmware change notice and the firmware version matches what is on file in the collection engine, no event is generated.
IT Department 101 Proprietary and Confidential

This section provides information and instructions to help you test and maintain the meter. Topics covered include:
• Visual indicators
• Troubleshooting (fatal and non-fatal errors)
• Maintenance
Recommended Energy Testing Procedures Itron recommends using modern test boards with the latest software to test its electrical meters. Otherwise, erroneous readings could occur on light-load tests when the test sequence calls for a light-load test following a full-load or power-factor test. When proper testing equipment is not used, power-factor readings may also be in error when following a full-load test. The errors are always positive and may be a few percent for power-factor and even greater for light-load. The problem is aggravated on lower voltages and when using large test constants, Kt, similar to the typical Kh values of comparable induction meters.
Annunciators The OpenWay CENTRON Meter is equipped with a variety of annunciators for a more meaningful display.
Load Indication/Direction Annunciator The OpenWay CENTRON meter is equipped with a Liquid Crystal Display (LCD) load emulation indicator. The Load Emulator follows the Infrared Test LED. For each pulse of the Test LED, the Load Emulator increments one segment. The operation of the Load Emulator is based on the bi-directional Wh energy.
The Load Emulator scrolls to the right when energy is being delivered and scrolls to the left when energy is being received.
Phase-Voltage Indication Annunciators The meter is equipped with three LCD voltage indicator annunciators. They are located in the lower left portion of the LCD display. Illuminated annunciators (VA, VB, and VC) indicate active voltage for these respective phases. Depending on how the user configures the meter, a loss of voltage may be indicated with either a missing or flashing annunciator. The threshold for these indicators is 20% below nominal. The LCD also supports displaying V Nominal.
Nominal Voltage Indication Annunciator The OpenWay CENTRON meter is equipped with a nominal voltage indication annunciator. This annunciator indicates the voltage value to which the nominal voltage is nearest. Nominal voltage indication values are 120 and 240 (277 and 480 for polyphase).
C H A P T E R 5
Testing, Troubleshooting, and Maintenance
IT Department 102 Proprietary and Confidential
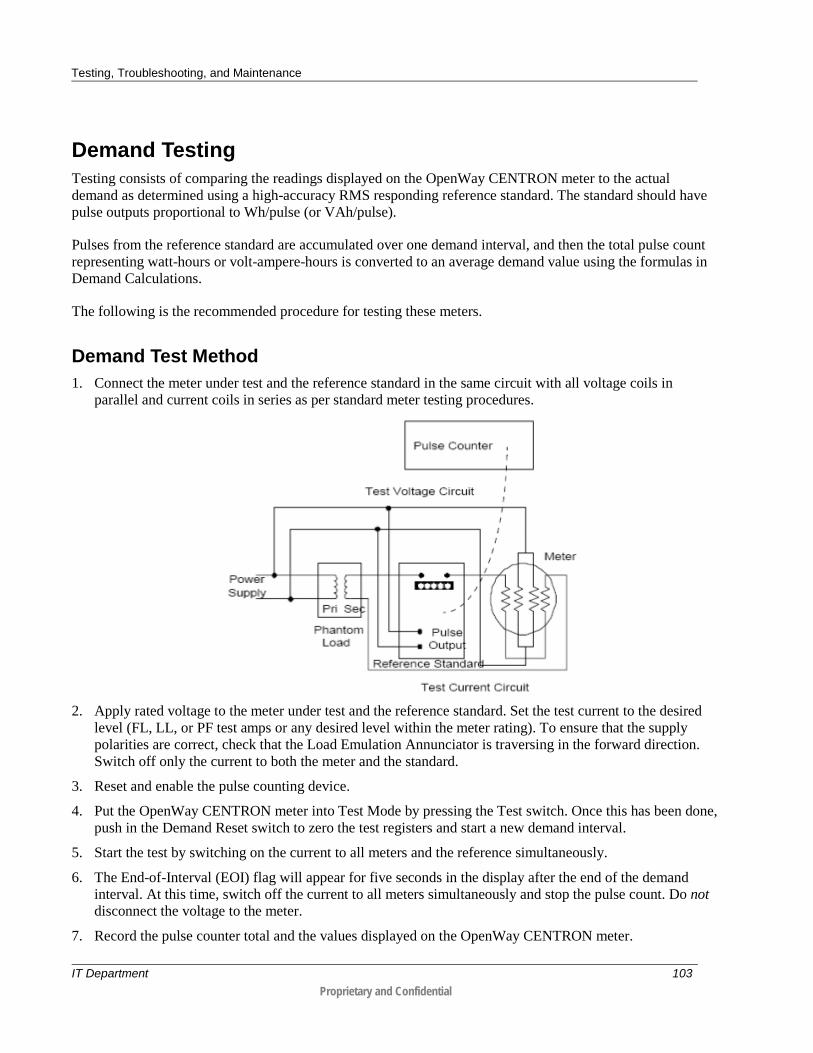
Testing, Troubleshooting, and Maintenance
Demand Testing Testing consists of comparing the readings displayed on the OpenWay CENTRON meter to the actual demand as determined using a high-accuracy RMS responding reference standard. The standard should have pulse outputs proportional to Wh/pulse (or VAh/pulse).
Pulses from the reference standard are accumulated over one demand interval, and then the total pulse count representing watt-hours or volt-ampere-hours is converted to an average demand value using the formulas in Demand Calculations.
The following is the recommended procedure for testing these meters.
Demand Test Method 1. Connect the meter under test and the reference standard in the same circuit with all voltage coils in
parallel and current coils in series as per standard meter testing procedures.
2. Apply rated voltage to the meter under test and the reference standard. Set the test current to the desired level (FL, LL, or PF test amps or any desired level within the meter rating). To ensure that the supply polarities are correct, check that the Load Emulation Annunciator is traversing in the forward direction. Switch off only the current to both the meter and the standard.
3. Reset and enable the pulse counting device.
4. Put the OpenWay CENTRON meter into Test Mode by pressing the Test switch. Once this has been done, push in the Demand Reset switch to zero the test registers and start a new demand interval.
5. Start the test by switching on the current to all meters and the reference simultaneously.
6. The End-of-Interval (EOI) flag will appear for five seconds in the display after the end of the demand interval. At this time, switch off the current to all meters simultaneously and stop the pulse count. Do not disconnect the voltage to the meter.
7. Record the pulse counter total and the values displayed on the OpenWay CENTRON meter.
IT Department 103 Proprietary and Confidential

Testing, Troubleshooting, and Maintenance
8. Perform calculations A, B, C, and D (if applicable) in the demand calculations section and compare the results.
This test method is valid for kWh, kVAh, kvarh, kW, kVA, and kvar at any load or power factor.
Demand Calculations With solid-state metering, conducting energy and demand tests may be considered redundant since they are both results of the same measurement.
Calculation A: Actual Active Energy (kWh) Actual active energy is calculated using the following formula:
kWh = PT x Kh x N/1000
where: Kh = watt-hours per pulse output value from the reference standard. (A watt and/or a VA standard must be used.) PT = Total pulses accumulated from the reference standard N = Coil factor (See Testing With the infrared Test LED)
Pre-calculate the total pulses expected with the following formula to ensure that the pulse counter display does not overflow:
PT x Kh = V x I x T/(Kh x 60)
where: V = Voltage applied to standard I = Current applied to standard T = Test Mode demand interval length in minutes
If Test Mode display is in watt-hours (Wh), divide by 1000 to get kWh.
Calculation B: Actual Active Demand (kW) Actual active demand is calculated using the following formula:
kW = kWh x 60/T where: T = Test Mode demand interval length in minutes
Calculation C: Actual KVA Hours kVAh = PT x Kh x N/ (1000*SPTC)
where: N = Coil factor (See Testing With the Infrared Test LED) SPTC = Singlephase test constant (See the table in Demand Test Method)
IT Department 104 Proprietary and Confidential

Testing, Troubleshooting, and Maintenance
Calculation D: Actual kVA Demand kVA = kVAh x 60/T where: T = Test Mode demand interval length in minutes
Field Testing Field testing of the OpenWay CENTRON meter may be accomplished with conventional methods using either the infrared test pulses or the load emulation annunciator.
Required Hardware The typical field test setup consists of a phantom load, a portable standard, and an infrared test pulse adapter with counter or snap switch assembly.
Test Method Using Infrared Pulse Adapter The pulse adapter runs the test for a programmed number of pulses. The number of pulses is set on the test pulse adapter by the use of counter switches. The adapter will automatically start the test when the START COUNT button is pressed.
When the test begins, the test pulse adapter counts the pulses it receives from the meter until the programmed number of pulses have been received.
When this occurs, the pulse adapter automatically shuts off the portable standard. The standard then displays the number of equivalent disk revolutions which is then compared to the number of pulses for the test.
Test Method Using a Snap Switch Assembly This method is similar to the above except starting and stopping of the standard is performed manually.
To conduct the test, the technician observes the position of the load emulation annunciator and simultaneously starts the standard through the snap switch. After observing a predetermined number of emulated disk rotations, the technician stops the standard with the snap switch. A comparison is then made between the predetermined number of emulated disk rotations and equivalent disk rotations indicated on the watthour standard.
Visual Indicators The Infrared Test LED, as well as several other annunciators, assists in testing and troubleshooting the OpenWay CENTRON meter.
Infrared Test LED The meter is equipped with an Infrared (IR) Test Light Emitting Diode (LED) for testing meter accuracy; the LED is located at the top of the meter.
IT Department 105 Proprietary and Confidential

Testing, Troubleshooting, and Maintenance
Troubleshooting
Fatal Errors Fatal errors cause the display to lock on the error code because of the possibility that billing data may have been corrupted or that the meter may not be operating correctly. If multiple fatal errors occur, the one with the lowest number will be the error code that locks on the display.
The OpenWay CENTRON meter will check for fatal errors:
• When a meter reconfigure is performed.
• When power is initially energized and upon future power restoration.
• While performing key operations.
Because a fatal error can cause the meter to be inaccurate or to lose billing data, it may be necessary to return the meter to the factory if a fatal error 2, 4, 6, or 7 occurs. Follow the procedures below to understand how to clear the fatal error condition in the meter.
The OpenWay CENTRON battery is permanently soldered to the meter register board. Attempting to remove it will cause Fatal Error 7 and the meter will have to be sent back to the factory.
Fatal Error Recovery System Release (SR) 3.0 allows the meter to return to metering energy as rapidly as possible and without losing important energy information after fatal errors 2, 6, or 7 have been detected.
"Enable Fatal Error Recovery" must be selected for the meter configuration file created in the Collection Engine program as shown below.
IT Department 106 Proprietary and Confidential

Testing, Troubleshooting, and Maintenance
If a recoverable fatal error occurs, the meter shows on the meter's LCD display (unless it is superseded by another quick display item). The meter produces a core dump which (if necessary) can be read using OpenWay Tools.
On the next periodic read of the meter, the Collection Engine is notified of the error condition. The Collection Engine clears the condition. The Event Log records that the fatal error and when it happened.
If the fatal error status is not cleared and another fatal error is detected, then the meter performs another fatal error using the current procedure (perform a safe reset, stop all operations, and display the fatal error on the display). Exception is that the second core dump is skipped.
Items Maintained During a Fatal Error Recovery The following items will be maintained within the meter after a fatal error recovery:
• Energy will be restored
• Configuration (last used)
• Factory data
• Portions of EPF Data (fatal recovery data, history, HAN, and LAN pointers, energy values, disconnect switch position). All other data are cleared.
• Time/Date information
• Exception host and multicast addresses
• All history logs will be maintained. There is a possibility that the saving of the logs caused the fatal error. This can be checked and if so the logs would not be saved (partially written).
• AP Title
• Does not reset the communication module
Items Not Maintained During a Fatal Error Recovery The following items are not maintained within the meter after a fatal error recovery:
• Load Profile, Demand, and voltage monitoring data during the fatal error (clear billing w/o clear energy)
• All ZigBee bindings
• In-home display connections
History Log The history log needs to contain a listing of the fatal error event (event FATAL_ERROR, currently defined as 121). There is also room for a 32-bit number as an argument. In this 32-bit number, the following will be stored:
IT Department 107 Proprietary and Confidential

Testing, Troubleshooting, and Maintenance
• EPF_Data.fatal_recovery_error (Bits 0 – 7)
• EPF_Data.fatal_recovery_status (Bits 8 – 15)
• EPF_Data.fatal_error_reason (Bits 16 – 31)
The condition 0x80 will be stripped from the fatal errors byte from EPF data so the number 128 (FAT8) will never show up in the log.
Currently, the history log counters in OpenWay Field-Pro already count the number of times these events occur.
A new table is defined as part of this project that contains a quick place to check for the last several fatal errors that the meter has experienced. The format of this table can be found in the Tables document listed in the reference section.
Information will include:
• Last Recovery Status
• Last Valid Log Entry
• Last Recovery Count
And for each fatal error, the following will be stored:
• Time of Occurrence (GMT)
• Fatal Error (this will include the 0x80 portion of the fatal error)
• Recovery Status
• Fatal Error Reason Code
There will be 14 such records stored to flash.
List of Fatal Errors
Fatal Error 1: MCU FLASH Error Error Code: FATError1
Possible Causes: The meter has detected a problem with the configuration memory.
Description: If this error occurs, return the meter for repair.
Fatal Error 2: RAM Error Error Code: FATError2
Possible Causes: The meter has detected a problem with the RAM.
Description: If this error occurs, return the meter to the factory for repair.
IT Department 108 Proprietary and Confidential

Testing, Troubleshooting, and Maintenance
Fatal Error 3: DATA FLASH Error Error Code: FATError3
Possible Causes: The meter has detected a problem with the data flash (non-volatile memory).
Description: If this error occurs, return the meter for repair.
Fatal Error 4: Front End Processor Error Error Code: FATError4
Possible Causes: A problem has occurred with the metrology portion of the meter.
Description: If this error occurs, return the meter for repair.
Fatal Error 5: Power Down Error Error Code: FATError5
Possible Causes: A problem has occurred while saving billing data at time of a power outage.
Description: If this error occurs, return the meter for repair.
Fatal Error 6: File System Error Error Code: FATError6
Possible Causes: The meter has detected a problem with the file system.
Description: If this error occurs, return the meter for repair.
Fatal Error 7: Operating System Error Error Code: FATError7
Possible Causes: The meter has detected a problem with the operating system.
Description: If this error occurs, return the meter for repair.
Non-Fatal Errors Non-fatal errors can be configured to ignore, scroll, or lock during the one second display off-time. If multiple non-fatal errors occur, the meter will display a combined error message. For example, if a Low Battery error and a Loss of Phase error exist, the error display will read Err 12----. In this case, if one of the errors had been configured to lock, and the other error had been configured to scroll, the display will lock on the combined error message.
IT Department 109 Proprietary and Confidential

Testing, Troubleshooting, and Maintenance
List of Non-Fatal Errors
Non-Fatal Error 1: Low Battery Error Error Code: Err 1-----
Possible Causes: The battery voltage is low or the battery is not connected properly.
Description: A low battery check is performed once a day and upon a set clock procedure. A low battery continues to function; however, its reliability decreases over time. As long as the meter is not powered down with a dead or missing battery, the meter will continue to function as normal.
If the meter is powered down with a dead or missing battery, then when power is restored, the meter's clock will be off by the duration of the outage, and Load Profile and TOU will be halted.
Non-Fatal Error 2: Loss of Phase Error Error Code: Err -2----
Possible Causes: The voltage on one of the phases dropped below 45 volts.
Description: The voltage on each phase is checked every five seconds. A phase must fail consecutively on two checks to cause an error. A Demand Reset will clear this error.
Non-Fatal Error 3: Time of Use (TOU) Error Error Code: Err --3---
Possible Causes: The Current Season is not configured, the Current Year is not configured, current DST dates are not configured, or TOU halted due to power down with a dead or missing battery.
Description: This condition is tested at power-up, at midnight crossings, at season changes, upon reconfigures and upon set clocks.
Depending on the cause of the error, it can be cleared with a corrective reconfigure or with a set clock with a good battery present.
Non-Fatal Error 4: Reverse Power Flow Error Error Code: Err ---4--
Possible Causes: The configured reverse power threshold has been reached.
Description: Reverse power is tested every second and an accumulator for the time it is maintained. If power is delivered during the second, then the accumulator is cleared. If power is received during the second, then the accumulator is incremented. If the accumulator reaches the reverse power threshold (1 Wh), then the error is triggered.
A Demand Reset will clear this error.
IT Department 110 Proprietary and Confidential

Testing, Troubleshooting, and Maintenance
Non-Fatal Error 5: Clock/Load Profile Error Error Code: Err ----5-
Possible Causes: Battery not working correctly.
Description: This condition is tested upon power-up.
A set-clock command with a good battery present will clear this error. Be sure to read the Load Profile data prior to setting the clock to clear the error. The dead battery will cause some invalid intervals at the end of the data. When the error is cleared, Load Profile will be restarted from the beginning to purge the bad data.
Non-Fatal Error 6: Full Scale Overflow Error Error Code: -----6
Possible Causes: The calculated W delivered demand at an EOI exceeded the configured full scale value.
Description: This condition is tested at a demand EOI. The maximum demand register continues to accumulate and W delivered is still correctly displayed. When a demand reset is performed, the correct maximum W delivered will be added to the cumulative register.
A Demand Reset will clear this error.
If a full scale overflow occurs, check the installation to ensure that the current capacity of the meter has been exceeded. A full scale overflow error does not affect the existing billing data.
Other Issues
Incorrect or No Accumulation of kWh or kW • Demand Delay Selected—kW will not accumulate immediately after a power outage if Cold Load Pickup
(demand delay) has been selected. Accumulation will begin immediately after demand delay expires. Verify meter configuration and reconfigure meter.
• Component Failure—Return the meter for repair.
Blank Display • Power Not Applied to Meter—Apply voltage to A phase (or phase-to-phase voltage with a polyphase
power supply).
• Voltage Too Low for Meter Startup—the OpenWay CENTRON meter is guaranteed to start at 80% of rated voltage.
• Component Failure—Return the meter for repair.
• Board-to-Board Connector Not Seated—Verify proper connection of board-to-board connector.
IT Department 111 Proprietary and Confidential
Testing, Troubleshooting, and Maintenance
Time and Date Wrong (TOU Version) • Time/Date Wrong in PC or Handheld Device—Verify and update time/date in configuring device and
download new time and date to meter. Refer to the appropriate software manual for more detailed directions.
• Wrong Line Frequency—Verify proper line frequency is selected in setup routine in configuration software. Select proper frequency and reconfigure meter.
• Daylight Saving Time Not configured Correctly—Verify DST is selected in configuration. Reconfigure meter with correct configuration.
On-Site Programmer Cannot Communicate with Meter • Communication Port Driver No Longer Works—When the meter is no longer communicating with the PC
(the software times out before it is able to connect to the meter), it is recommended to reboot the computer.
• Optical Probe Cable Assembly Failure—Check cable with known meter that communicates. Check meter against known cable that is functioning. Also check batteries in cable assembly (if applicable).
• COM Port in Programmer Is Set Wrong—Verify proper COM port number has been selected in the setup routine of the programming software. If the wrong COM port is selected, communications will not occur.
• Security Code in Meter—If security codes have been downloaded to the meter, the programming device must have the proper code to make connection to the meter. Verify security codes in the setup routine of the programming software.
• Cable Not Connected Properly—Verify optical probe lines up properly over the optical connector. Re-install cover for proper alignment. Verify PC (or handheld) and cable are securely connected and attached to the correct COM port.
• Incorrect Cable Selection—Wrong cable selected.
• Main Register Electronics Failure—Return meter for repair.
Maintenance
Preventive Maintenance No scheduled or preventive maintenance is necessary for the meter.
IT Department 112 Proprietary and Confidential

Testing, Troubleshooting, and Maintenance
Line potential may exist on the battery terminals. Follow these precautions:
• Never short-circuit batteries (such as by measuring current capability with an ammeter).
• Do not recharge batteries. • Do not store or transport batteries in metal or other electrically
conductive containers. • Keep batteries separated. If stored in a container where they can
contact each other, face them in the same direction to prevent short circuits.
• Do not operate batteries at temperatures above 85°C (185°F). • Dispose of batteries where they will not be punctured, crushed, or
incinerated. • Discard the battery using proper hazardous waste procedures.
Corrective Maintenance Because of the high level of integrated packaging and surface-mount components, on-board component repairs are not recommended. The entire meter should be returned to Itron Customer Service for repair.
IT Department 113 Proprietary and Confidential
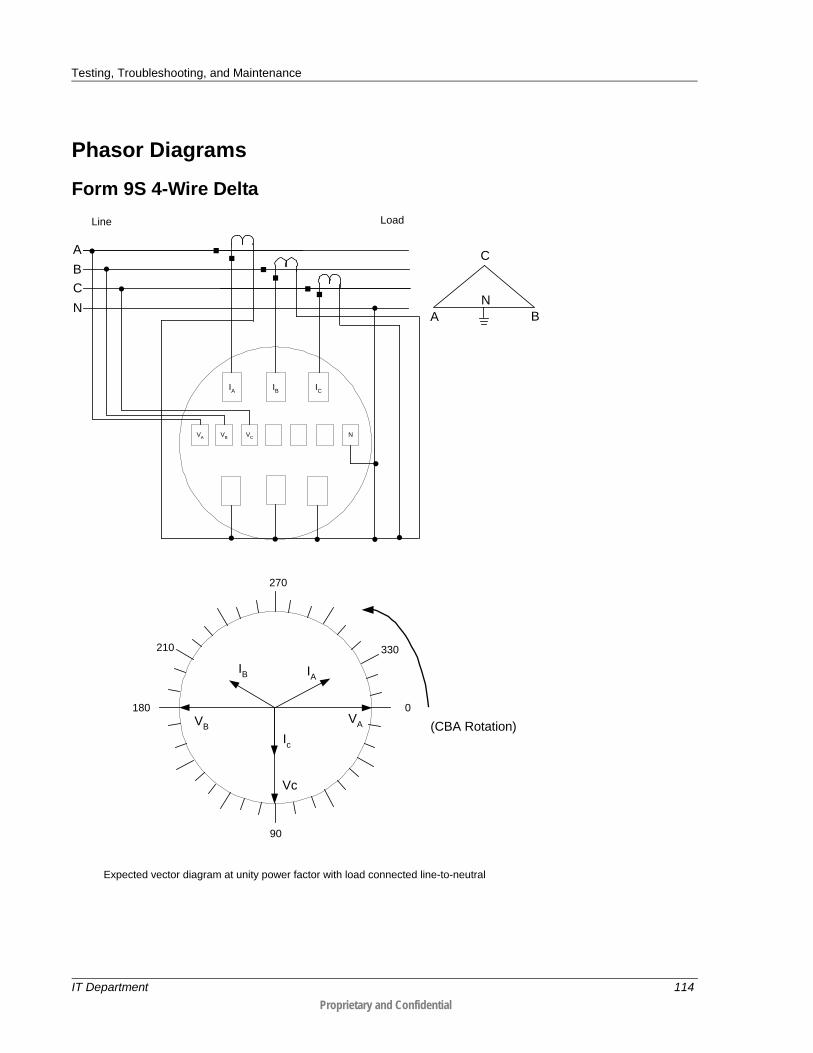
Testing, Troubleshooting, and Maintenance
Phasor Diagrams
Form 9S 4-Wire Delta
IA IB IC
270
0180
90
Ic
Vc
IA
VA
ABC
Line Load
A
C
210
BN N
IB
VA VC NVB
VB (CBA Rotation)
Expected vector diagram at unity power factor with load connected line-to-neutral
330
IT Department 114 Proprietary and Confidential

Testing, Troubleshooting, and Maintenance
Form 9S 4-Wire Wye
IA IB IC
270
0180
90
Ic
Vc
IA VA
ABC
Line Load
A C
240
B
N
N
IB
120
VA VC NVB
VB
(ABC Rotation)
IT Department 115 Proprietary and Confidential

Testing, Troubleshooting, and Maintenance
Form 12S 3-Wire Network
++ +
+IA IC
VA
(ENA)VC
(ENC)
FM 12S
SERVICE PHASORS
INA
ENA
INC
ENC
ICIA
0
90
180
270
IA
IC
VA (ENA)
IA = INA
IC = INC
A-B-C
A C
ENA
INC
ENC
INA
B
N
INBENB
A-B-C
A-B-C
++ +
+IA IC
VA
(ENA)VC
(ENC)
FM 12S
++ +
+IA IC
VA
(ENA)VC
(ENC)
FM 12SFM 12S
SERVICE PHASORS
INA
ENA
INC
ENC
INA
ENA
INC
ENC
ICIA
LOAD
00
9090
180180
270270
IA
IC
VA (ENA)
IA
IC
VA (ENA)
METER PHASORS
IA = INA
IC = INC
IA = INA
IC = INC
(Resistive load connected Phase-to-Neutral)
A-B-CA-B-C
A C
ENA
INC
ENC
INA
B
NN
INBENBINBENB
NETWORK, 3-WIRE
A-B-CA-B-C
A-B-CA-B-C
VC (ENC)VC (ENC)VC (ENC)
IT Department 116 Proprietary and Confidential

Testing, Troubleshooting, and Maintenance
Form 16S 4-Wire Delta
IAVA
IBVB
ICVc
N
ABC
Line
Load
N
ABCN
A
C
B
270
0180
90
Ic
Vc
IA
VA
210
IB
VB (CBA Rotation)
330
N
IT Department 117 Proprietary and Confidential

Testing, Troubleshooting, and Maintenance
Form 16S 4-Wire Wye
IAVA
IBVB
ICVc
N
270
0180
90
Ic
Vc
IA VA
120
Expected vector diagram at unity power factor with load connected phase-to-neutral
ABC
Line
Load
A C
240
B
N
N
ABCN
VB
IB (ABC Rotation)
IT Department 118 Proprietary and Confidential
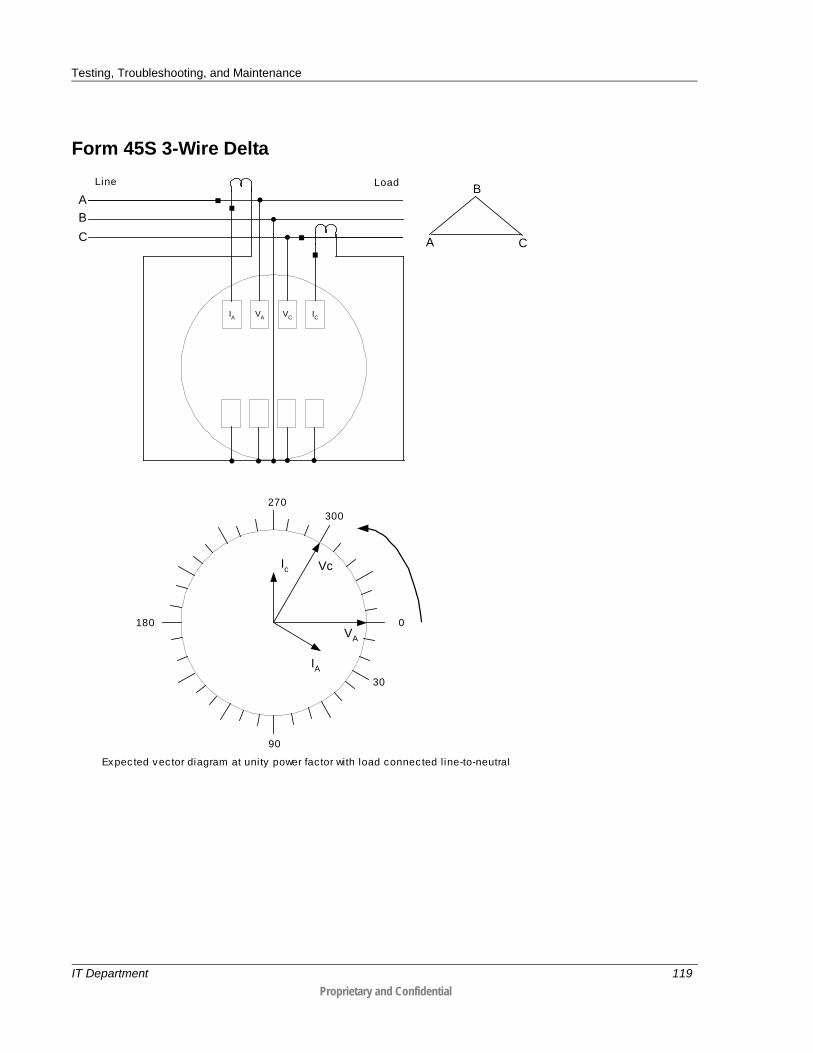
Testing, Troubleshooting, and Maintenance
Form 45S 3-Wire Delta
IA VA VC IC
270
0180
90
Ic Vc
IA
VA
300
Expec ted vector diagram at unity power factor with load connected line-to-neutral
ABC
Line Load
A C
B
30
IT Department 119 Proprietary and Confidential

Testing, Troubleshooting, and Maintenance
Form 45S 3-Wire Network
IA VA VC IC
270
0180
90
Ic
Vc
IA VA
240
Expec ted vector diagram at unity power factor with load connected line-to-neutral
ACN
Line Load
A C
N
IT Department 120 Proprietary and Confidential

Testing, Troubleshooting, and Maintenance
Form 45S 4-Wire Delta
*Note :The C CT must be at 1/2the ratio of the A CT.
IA VA VC IC
VB N
270
0180
90
Ic
Vc
IA VA
Expec ted vec tor diagram at unity power fac tor with balanced loading
CAB
Line Load
A
C
30
BN
N
C*A
IT Department 121 Proprietary and Confidential

Testing, Troubleshooting, and Maintenance
Form 45S 4-Wire Wye
IA VA VC IC
270
0180
90
IcVcIA
VA
330
Expected vector diagram at unity power factor with load connected line-to-neutral
ABC
Line Load
A C
30
240
B
N
C
A
N
IT Department 122 Proprietary and Confidential

The SiteScan on-site monitoring system (available only on the Advanced OpenWay polyphase meter) consists of the following features:
• Meter self-diagnostic checks
• Toolbox Mode with its on-site and/or on-line display
• SiteScan system and installation diagnostic checks
• Diagnostic output alarms
Using OpenWay Field-Pro, you can customize the SiteScan System for each individual metering site. The use of the SiteScan on-site monitoring system greatly enhances the ability to diagnose and resolve site-specific metering or tampering problems.
SiteScan Service Sense Delay Before any SiteScan checks can be performed, the meter's service must be determined. The meter may be configured to use a selected service or it may be configured to sense its own service. Regardless of which method is configured, a Service Sense Delay is always used. The Service Sense Delay may be configured from 1 to 255 seconds. It is used after a power-up, after exiting Test Mode, and after SiteScan configuration data has been changed.
Once the Service Sense Delay has expired, the service type is determined and diagnostic checks may be started. If the meter is configured to Auto Service Sense, but it cannot determine its service, then a Non-Fatal Error 9 condition occurs. This condition remains until the meter can determine its service. For more information about Non-Fatal Error 9, see Non-Fatal Errors.
Auto-Service Sensing One of the main functions of SiteScan is to detect the current meter service on power-ups, after exiting Test Mode, and after SiteScan configuration data has been changed. There are fourteen (14) different meter services defined, most of which depend on the form (number of measurement elements) of the meter.
2-element, 3-phase, 4-wire Wye 2-element network
2.5-element, 3-phase, 4-wire Wye (9S) 2-element single-phase
3-element, 3-phase, 4-wire Wye 2-wire single-phase
2-element, 3-phase, 3-wire Delta 3-wire single-phase
2-element, 3-phase, 4-wire Delta 9S metering as a 46S
3-element, 3-phase, 3-wire Delta 2.5-element, 3-phase, 4-wire Wye (6S/46S)
1 element single-phase 3 wire 1 element single-phase 2 wire
A P P E N D I X A
SiteScan On-Site Monitoring System
IT Department 123 Proprietary and Confidential
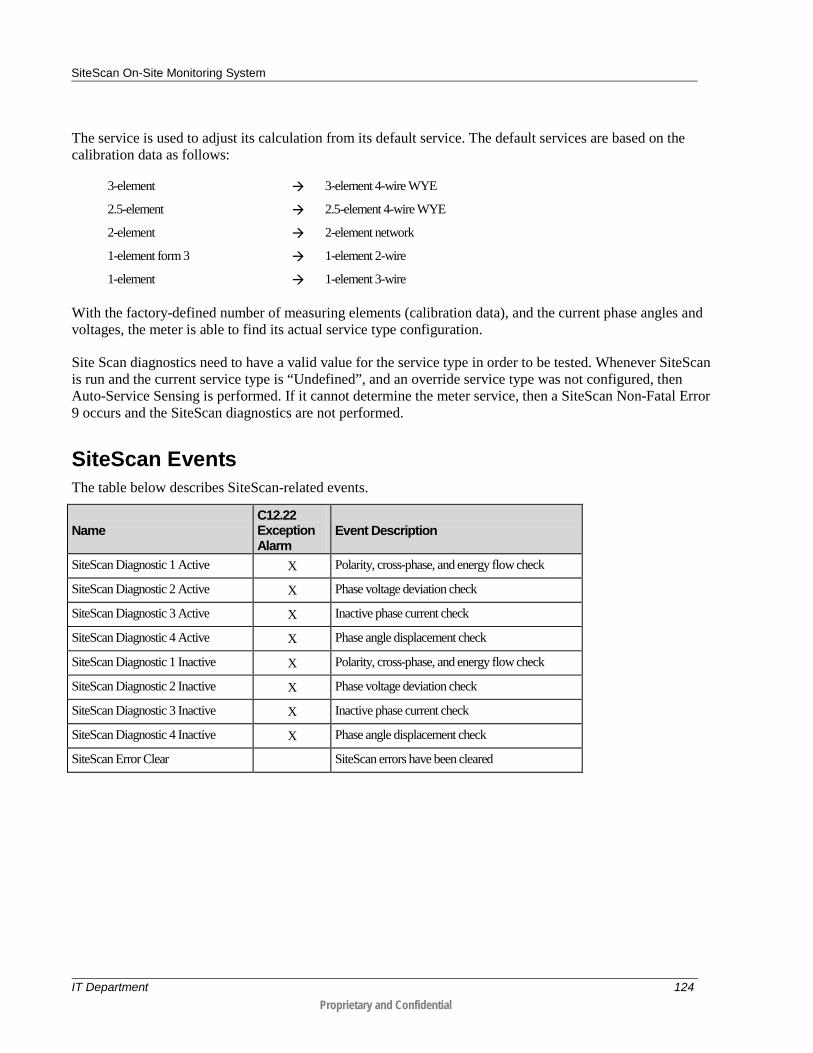
SiteScan On-Site Monitoring System
The service is used to adjust its calculation from its default service. The default services are based on the calibration data as follows:
3-element 3-element 4-wire WYE
2.5-element 2.5-element 4-wire WYE
2-element 2-element network
1-element form 3 1-element 2-wire
1-element 1-element 3-wire
With the factory-defined number of measuring elements (calibration data), and the current phase angles and voltages, the meter is able to find its actual service type configuration.
Site Scan diagnostics need to have a valid value for the service type in order to be tested. Whenever SiteScan is run and the current service type is “Undefined”, and an override service type was not configured, then Auto-Service Sensing is performed. If it cannot determine the meter service, then a SiteScan Non-Fatal Error 9 occurs and the SiteScan diagnostics are not performed.
SiteScan Events The table below describes SiteScan-related events.
Name C12.22 Exception Alarm
Event Description
SiteScan Diagnostic 1 Active X Polarity, cross-phase, and energy flow check
SiteScan Diagnostic 2 Active X Phase voltage deviation check
SiteScan Diagnostic 3 Active X Inactive phase current check
SiteScan Diagnostic 4 Active X Phase angle displacement check
SiteScan Diagnostic 1 Inactive X Polarity, cross-phase, and energy flow check
SiteScan Diagnostic 2 Inactive X Phase voltage deviation check
SiteScan Diagnostic 3 Inactive X Inactive phase current check
SiteScan Diagnostic 4 Inactive X Phase angle displacement check
SiteScan Error Clear SiteScan errors have been cleared
IT Department 124 Proprietary and Confidential

SiteScan On-Site Monitoring System
Override Auto Service Sensing The SiteScan configuration in the OpenWay Field-Pro provides an entry to specify the service type as opposed to having auto service sensing. This configuration parameter allows the user to specify the service type instead of having the meter auto service sense. This configuration setting is checked on a SiteScan startup event such as power-up.
• If the configured service is found to be valid, then it is used.
• If a valid service is not found, then the auto service sensing is performed.
SiteScan Meter Self-Diagnostic Checks The OpenWay CENTRON polyphase meter performs self-diagnostic checks to confirm proper meter operation. The following is a list of possible errors and associated error codes:
Error Error Type Error Code Flash Error Fatal Error FAtError1
RAM Error Fatal Error FAtError2
Data Flash Error Fatal Error FAtError3
CPC/Metrology Error Fatal Error FAtError4
Power Down Error Fatal Error FAtError5
Low Battery Error Non-Fatal Error ERR1-----
Loss of Phase Voltage Error Non-Fatal Error ERR-2----
TOU Schedule Error Non-Fatal Error ERR--3---
Reverse Power Flow Error Non-Fatal Error ERR---4--
Load Profile Error Non-Fatal Error ERR----5-
Fullscale Exceeded Non-Fatal Error ERR-----6
Valid Service Not Found (SiteScan Error) Non-Fatal Error ERR--9---
Diagnostic 1 Diagnostic diA 1-----
Diagnostic 2 Diagnostic diA -2----
Diagnostic 3 Diagnostic diA --3---
Diagnostic 4 Diagnostic diA ---4--
A fatal error indicates an internal meter problem, which ceases all meter functions except communications. These errors cause the display to lock on the error code until the meter is re-initialized.
The non-fatal errors can indicate either a meter problem such as low battery error or a site problem such as the loss of phase voltage error. The non-fatal self-diagnostic checks can be independently enabled or disabled through the Collection Engine software.
IT Department 125 Proprietary and Confidential

SiteScan On-Site Monitoring System
Diagnostic Logging All of the SiteScan diagnostics can be configured to register an event in the History Log when they become active or go inactive.
Note that Diagnostic 3 will become active anytime when at least one (but not all) phase current is below a certain current threshold. The log entry includes the phase(s) that is below the threshold only if Diagnostic 3 is enabled in the Collection Engine (as shown in the figure below) and becomes active.
SiteScan System and Installation Diagnostic Checks The SiteScan on-site monitoring system has the ability to continuously monitor the site for metering installation or tampering problems through the system and installation diagnostic checks. The following programmable diagnostic checks can be enabled in the Collection Engine:
SiteScan Diagnostic #1 Cross-Phase, Polarity & Energy Flow Check—This diagnostic verifies that all meter elements are sensing and receiving the correct voltage and current angles for each phase of a specific polyphase electric service. The current tolerance is +/- 90 degrees.
SiteScan Diagnostic #2 Phase Voltage Deviation Check—This diagnostic verifies that each individual phase maintains an acceptable voltage level with respect to the other phases. Problems such as shorted potential transformer windings, incorrect phase voltage, and loss of phase potential among others may be indicated.The phase voltage deviation can be set to 1% - 25%.
SiteScan Diagnostic #3 Inactive Phase Current Check—This diagnostic verifies that each individual current phase maintains an acceptable current level. It may indicate problems such as current diversion and open or shorted circuits, among others. The inactive phase current can be set from 0.05 amps to 200.0 amps.
IT Department 126 Proprietary and Confidential

SiteScan On-Site Monitoring System
SiteScan Diagnostic #4 Phase Angle Displacement Check—Similar to Diagnostic 1, but this diagnostic allows the user to define an acceptable angle displacement between the phase voltage and current. An acceptable phase angle displacement is from 1 - 90 degrees. An acceptable current threshold is from 0.5 to 5% of class current.
This diagnostic may indicate problems such as poor load power factor conditions, poor system conditions, or malfunctioning system equipment.
It is very important to note that the meter will continue to operate normally while any of the diagnostic errors are being displayed. The system and installation diagnostic checks will only report that there may be a problem with the site. They have no effect on metering or on any operations performed by the meter.
If enabled, all the diagnostic checks will continually check for errors every five seconds. The meter will not check for diagnostic errors under any of the following conditions:
• When singlephase series conditions occur (Test Bench)
• When the meter is in Test Mode
• When the diagnostic(s) have been disabled through the configuration file
• When auto service sense is configured and the meter cannot determine the service type
The system reports diagnostic errors in several ways. If a diagnostic check is enabled and an error occurs, the system will always increment the corresponding diagnostic counter by one. The range for all diagnostic counters is from 0 to 255. When the counter reaches 255, it remains there until it is reset by the user. The diagnostic checks will continue to function and report any errors even after the diagnostic counter has reached 255. The Collection Engine and OpenWay Field-Pro can be used to reset the counters.
If more than one diagnostic error condition exists, the meter will display a combined error message. Diagnostic errors will not be shown if any fatal or non-fatal errors are displayed.
Each of the diagnostic checks can be independently programmed with one of the following display options:
Disable The diagnostic error will not be displayed on the meter display or increment the diagnostic counter.
Ignore The diagnostic error will not be displayed on the meter. However, the diagnostic error will still increment the diagnostic counter. This option can be used to determine the frequency of an error without reporting it on the display of the OpenWay CENTRON Advanced Polyphase meter.
Scroll The diagnostic error will be displayed during the “Off Time” between display items. When an error occurs, the meter will display the error during the next and all subsequent “Off Time” of the normal display mode.
IT Department 127 Proprietary and Confidential

SiteScan On-Site Monitoring System
The meter will check for all enabled diagnostic errors every five seconds. If three consecutive checks fail, the meter will flag the error. Therefore the meter takes approximately 15 seconds before an error is flagged. A diagnostic error may take longer to display on the meter depending on the display option chosen. Once the condition causing the error is corrected, the meter must pass two consecutive checks before the diagnostic error is cleared from the display.
Meter Services The form of the meter determines which of the service types is available for the meter. Diagrams showing possible meter forms, their associated service types, and unity PF SiteScan phasor diagrams are shown in the following figures.
3-Element Transformer Rated (Class 20): 9S 4-wire wye and 4-wire delta services
ABC VVV ==VB
VC
IB
IA IC
IT Department 128 Proprietary and Confidential
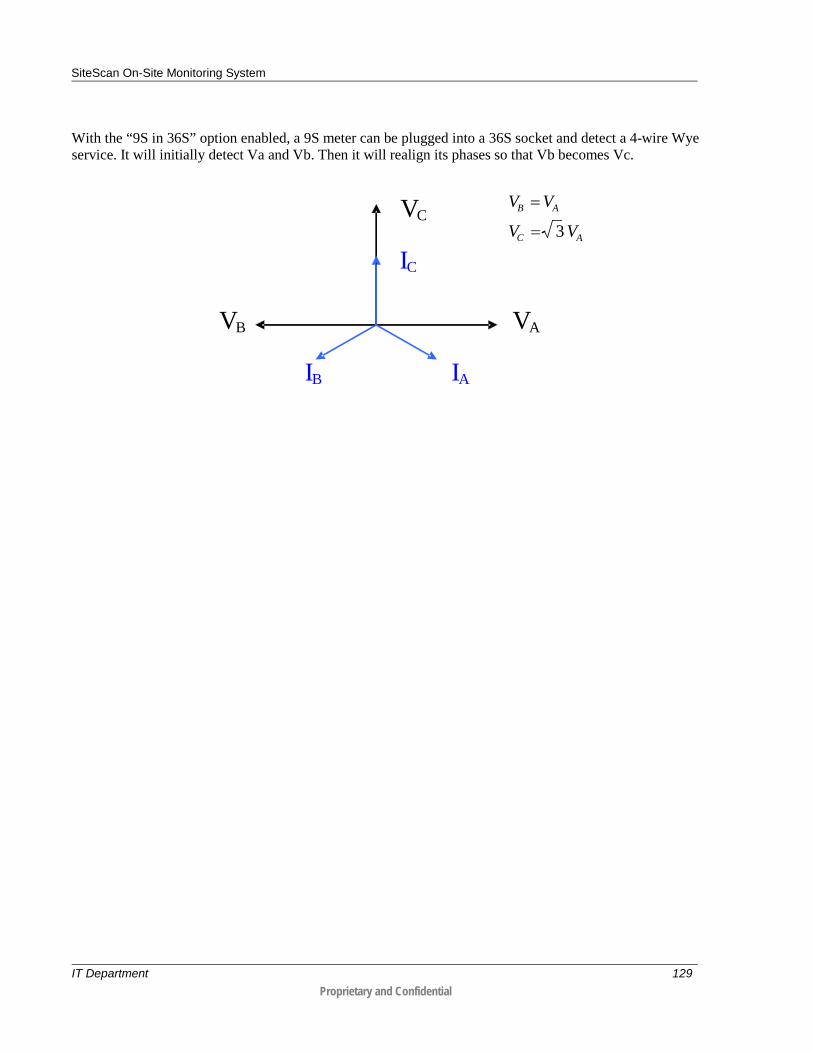
SiteScan On-Site Monitoring System
With the “9S in 36S” option enabled, a 9S meter can be plugged into a 36S socket and detect a 4-wire Wye service. It will initially detect Va and Vb. Then it will realign its phases so that Vb becomes Vc.
VAVB
VC
IB IA
IC AC
AB
VV
VV
3=
=
IT Department 129 Proprietary and Confidential

SiteScan On-Site Monitoring System
2-Element Self Contained (Class 200 and Class 320): 12S For the Transformer Rated, all five of the following services are a possibility, as far as SiteScan is concerned, but the Four Wire Wye and Four Wire Delta are not a possibility on the Self Contained meters.
VA
VC
IA
IC AC VV =
VA
VC
IA IC AC VV =
VA VC IA IC AC VV =
IT Department 130 Proprietary and Confidential

SiteScan On-Site Monitoring System
3-Element Self Contained (Class 200 and 320): 16S The 16S (Four Wire Wye and Four Wire Delta) includes the 14S, 15S, and 17S forms.
IT Department 131 Proprietary and Confidential

SiteScan On-Site Monitoring System
2-Element Transformer Rated (Class 20): 45S(5S) For the Transformer Rated, all five of the following services are a possibility.
VA
VC IA
IC AC VV =
VA
VC
IA IC
AC VV .23
=
AC VV .23
=
VA
VC
IA
IC AC VV =
VA
VC
IA IC AC VV =
IT Department 132 Proprietary and Confidential

SiteScan On-Site Monitoring System
VA VC IA IC AC VV =
1-Element Self Contained (Class 100): 1S Hardware 3.x only
IT Department 133 Proprietary and Confidential

SiteScan On-Site Monitoring System
1-Element Self Contained (Class 200 and Class 320): 2S Hardware 3.x only
IT Department 134 Proprietary and Confidential

SiteScan On-Site Monitoring System
1-Element Transformer Rated (Class 20): 3S Hardware 3.x only
IT Department 135 Proprietary and Confidential

SiteScan On-Site Monitoring System
1-Element Transformer Rated Contained (Class 20): 4S Hardware 3.x only
Phase Indicators Once a valid service type is found, the active phases are known. If a phase voltage is above the configured low phase voltage value, the indicator for that phase (VA in any case, VC and VB possibly) is lit on the LCD.
Before setting these indicators, the active phases are checked against the low voltage level. If they are above this level, they are set to ON. If they are below this level, they are set to OFF/BLINKING, depending on the meter configuration.
Every 5 seconds, after the SiteScan diagnostic tests are performed, whatever diagnostics are programmed, these phase indicators are updated with the current service type and the current phase voltages.
IT Department 136 Proprietary and Confidential

SiteScan On-Site Monitoring System
Voltage Service Indicator (120, 240, 277, 480) Only one of the four indicators can be turned on at one time (based on the nearest possible value for the voltage service). The voltage service, depending on the current meter service, is calculated with phase A voltage, the reference phase of the meter. If the phase A voltage is below 88 volts, then no voltage indicator will be turned on.
For the 3-element 4-wire Delta service and 2-element single-phase service, the voltage service is twice the phase A voltage. In any other meter service, the voltage service is equal to the phase A voltage.
The phase indicators are updated every 5 seconds, after the Site Scan diagnostics. The indicators will show any temporary fall in the phase A voltage (such as a normal value of 277V to 240V) every 5 seconds.
Diagnostic Error Triggering Mechanism (Diagnostics 1 - 4) Once the meter's service is determined, diagnostic checks can begin. The diagnostic checks are performed every 5 seconds. For Diagnostics 1-4, a check must fail three times in a row before a Diagnostic event is triggered. For Diagnostics 1-4, a check must pass twice in a row before a Diagnostic is cleared. Each Diagnostic has its own counter(s) for the number of events triggered.
SiteScan Diagnostic #1 (Cross-Phase, Polarity, and Energy Flow Check) The purpose of this diagnostic is to verify that all meter elements are sensing and receiving the correct voltage and current for each phase. This diagnostic may indicate one or more of the following problems:
• Cross-phasing of a voltage or current phasing
• Incorrect polarity of a voltage or current circuit
• Reverse energy flow of one or more phases
• Internal meter measurement malfunction
• Faulty site wiring
IT Department 137 Proprietary and Confidential

SiteScan On-Site Monitoring System
This error will not be reported when the meter is in a serial test configuration since this is considered as a “valid” 3-element 4-wire Y service.
The voltage and current angles are determined with respect to phase A voltage, and compared to a pre-established service diagram, according to the current meter service in use. A lag and lead tolerance is entered as a parameter for the current and voltage angles.
The SiteScan Current Angle Tolerance configurations in PC-PRO + Advanced are the lead and lag tolerances for current angles associated with Diagnostic #1. The range of adjustment is from 90 to 120 degrees both lag and lead direction.
Although the diagnostic checks occur every 5 seconds, once every second the meter determines the angle of each voltage and current phasor with respect to VA. The meter will not only display this information in the Toolbox Mode, but will determine each phasor angle for validity with respect to the meter’s form and service type. Diagnostic #1 will take the “typical” phasor diagram for a particular form number and service type and place an envelope around each phasor where the actual phasor must be found for the diagnostic check to pass. The envelope for the voltage vectors is fixed at ±10° and the envelope for the current vectors is user configurable. The meter will recognize ABC or CBA phase rotation and will adjust the SiteScan expected values.
For example, if a typical diagram has the B phase voltage angle at 120°, and the envelope around that phasor is ±10°, then the actual phasor must be between 110° to 130° from VA for the diagnostic check to pass. The system will check each phasor in a similar fashion. The system will define the phasor envelope for each phase.
The previous figures show the ideal phasor diagrams for all possible form numbers and service types. These vector relationships assume site wiring as shown and the special case of unity power factor with balanced phase loading.
A multitude of wiring conventions, phase loadings, and power factors can exist at metering sites. Therefore, the vector diagrams obtained from actual metering sites will most likely vary from those shown here. This should be expected and will cause no metering errors, but some unusual circumstances could necessitate reconfiguration of one or more of the diagnostics.
IT Department 138 Proprietary and Confidential

SiteScan On-Site Monitoring System
Diagnostic #1 Error Example This example is for a Form 9S meter wired for a 4-Wire Wye system with ABC phase rotation, but the site was wired with a voltage circuit having the incorrect polarity (reverse VT). The first step to diagnosing an error is to logon to Field-Pro and view the meter in Toolbox Mode and gather the information.
The following is the information from the SiteScan snapshot when the Diagnostic #1 error is triggered:
IT Department 139 Proprietary and Confidential

SiteScan On-Site Monitoring System
The next step is to graphically plot the above information into a phasor diagram as shown below.
0
90
270
180
VB
VA
VC
IA
IB
IC
By comparing the phasor diagram drawn from the information found in the snapshot with the typical phasor diagram, it becomes clear that the B phase voltage is incorrect. The correct phasor should be around 120°, not 300° where the phasor currently is. Since the phasor is approximately 180° off, this most likely represents a polarity problem with the B phase voltage circuit. Also note that diagnostic counter d1 has incremented to “1” and it is "Active".
IT Department 140 Proprietary and Confidential

SiteScan On-Site Monitoring System
SiteScan Diagnostic #2 (Phase Voltage Deviation Check) The purpose of this diagnostic is to verify that each individual phase maintains an acceptable voltage level with respect to phase A. Because Phase A is present in all the configurations, it is chosen as the reference level. This diagnostic check may indicate one or more of the following problems:
• Loss of phase voltage
• Incorrect voltage transformer ratio
• Shorted voltage transformer windings
• Incorrect phase voltage
• Internal meter measurement malfunction
• Faulty site wiring
The percentage of deviation tolerated from phase A voltage is the user-defined parameter used for this test. All other phases are compared to phase A, to see if it is within the defined voltage tolerance.
Once every five seconds, the phase A voltage is combined with a user-defined percentage tolerance (x) to determine the upper and lower bounds of the acceptable range for the other voltages. The range of values for the percent tolerance is 1 to 25.
For Diagnostic #2 to pass, the following equations must be satisfied:
ACAc
ABAB
VxVVxV
VxVVxV
•−≥•+≤
•−≥•+≤
%)1(lower and %)1(upper
%)1(lower and %)1(upper
If the above equations are not met for three consecutive checks, the diagnostic check will trigger. Although the meter is using VA as a reference voltage, it does not need to be correct for this check to be valid. The percentage difference is the determining factor.
IT Department 141 Proprietary and Confidential

SiteScan On-Site Monitoring System
Diagnostic #2 Error Example This example is for a Form 9S meter wired for a 277 Volt, 4-Wire Wye system, but the site has an incorrect voltage transformer ratio. The meter was also programmed with a percentage tolerance of 10%.
The following is the information from the SiteScan snapshot when the Diagnostic #2 error is triggered.
IT Department 142 Proprietary and Confidential
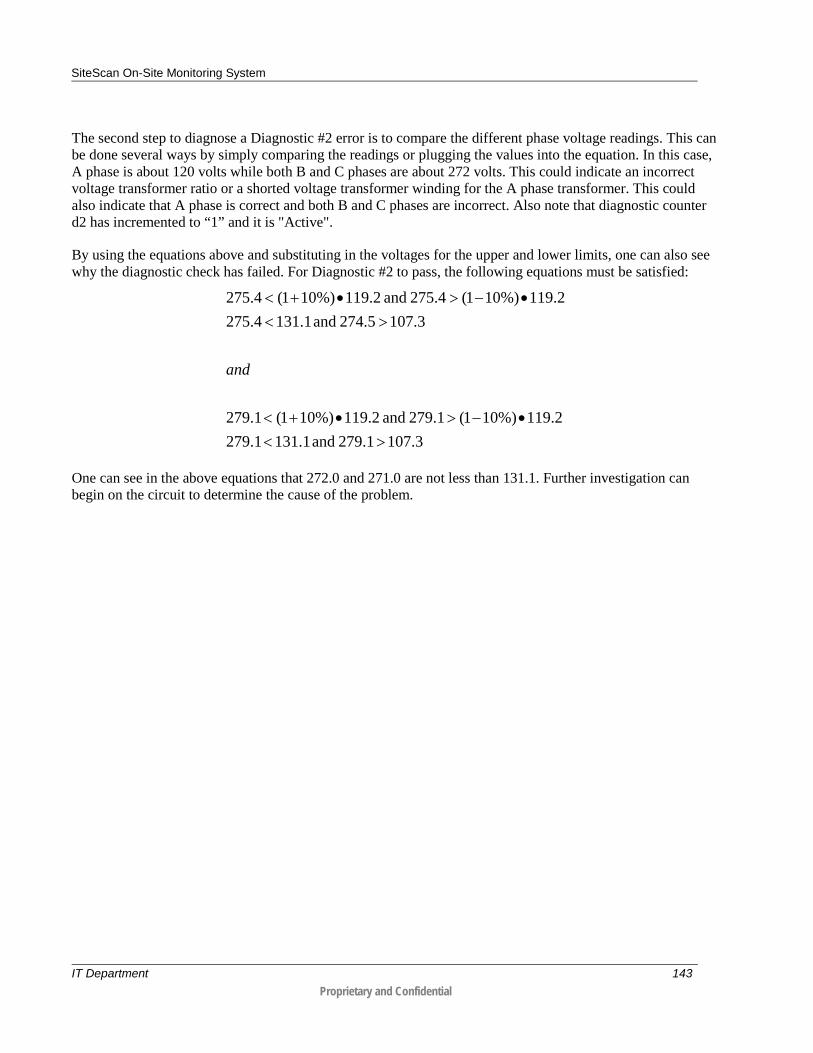
SiteScan On-Site Monitoring System
The second step to diagnose a Diagnostic #2 error is to compare the different phase voltage readings. This can be done several ways by simply comparing the readings or plugging the values into the equation. In this case, A phase is about 120 volts while both B and C phases are about 272 volts. This could indicate an incorrect voltage transformer ratio or a shorted voltage transformer winding for the A phase transformer. This could also indicate that A phase is correct and both B and C phases are incorrect. Also note that diagnostic counter d2 has incremented to “1” and it is "Active".
By using the equations above and substituting in the voltages for the upper and lower limits, one can also see why the diagnostic check has failed. For Diagnostic #2 to pass, the following equations must be satisfied:
3.107279.1 and 131.11.2792.119%)101(279.1 and 119.2%)101(1.279
3.107274.5 and 31.114.2752.119%)101(275.4 and 119.2%)101(4.275
><•−>•+<
><•−>•+<
and
One can see in the above equations that 272.0 and 271.0 are not less than 131.1. Further investigation can begin on the circuit to determine the cause of the problem.
IT Department 143 Proprietary and Confidential

SiteScan On-Site Monitoring System
SiteScan Diagnostic #3 (Inactive Phase Current Check) The purpose of this diagnostic is to verify that each individual phase current maintains an acceptable current level with respect to the others. This diagnostic check may indicate one or more of the following problems:
• Current diversion
• Open or shorted current transformer circuit
• Internal meter measurement malfunction
During the test, if one or more currents fall below the user defined “low current threshold”, and at least one current is above this level, then a diagnostic error is triggered.
SiteScan Diagnostic #3 checks every five seconds to verify that the meter is receiving a configured current level for each individual phase. If the meter fails three consecutive checks, the Diagnostic #3 check will trigger.
Once every five seconds, all phase currents are checked against a user-defined “low current value” to verify that the current value is above this value. If one or more currents fall below the low current value, and at least one current remains above this value for 3 consecutive checks, the OpenWay CENTRON meter will trigger the error. The error will not be triggered if all the currents fall below or above the user-defined value.
The starting current of:
• transformer rated meters, CL 20, is 5 mA.
• self-contained meters, CL 200, is 50 mA.
• the CL320 version is 80 mA.
Therefore, a selected “low current value” of 100 mA would require at least one phase above and below the starting current in order to activate the diagnostic.
IT Department 144 Proprietary and Confidential

SiteScan On-Site Monitoring System
Diagnostic #3 Error Example This example is for a Form 9S meter wired for a 277 volt, 4-Wire Wye system, but the site has a shorted current transformer. The “low current value” is set at 25 mA.
The following is the information from the SiteScan snapshot when the Diagnostic #3 error is triggered.
The second step to diagnose a Diagnostic #3 error is to compare the different phase current readings. In this case A and C phases both have current passing through the elements while B phase (center element) has no current or almost no current. Accurate measurement is considered to be 0.5% of class rating for the current:
• CL 20 = 10 mA
• CL 200 = 1 Amp
• CL 320 = 1.6 Amps
This could indicate an open or shorted current transformer or current diversion. Also note that diagnostic counter d3 has incremented to “1” and it is "Active".
It is possible to see 0.000 where the current information should be, but have no Diagnostic #3 error present. See the SiteScan Toolbox Mode for more information.
IT Department 145 Proprietary and Confidential

SiteScan On-Site Monitoring System
SiteScan Diagnostic #4 (Low End Threshold Current) The purpose of this diagnostic is to verify that the current elements are sensing and receiving the correct current for each phase. It is basically a power factor check diagnostic. This diagnostic check may indicate one or more of the following problems:
• Poor load power factor conditions
• Poor system conditions
• Malfunctioning system equipment
Diagnostic #1 must be enabled and passed for this diagnostic to be enabled, so that the system can assume all the phasors are in the relatively correct orientation. Each phase must also exceed a configured minimum current threshold in order for it to be tested. The user-defined phase angle displacement is the parameter used to check the phasors.
The low end threshold current for Diagnostic #4 is adjustable based upon the class of the meter from 0.5% of class to 5% of class.
IT Department 146 Proprietary and Confidential

SiteScan On-Site Monitoring System
Phase Angle Displacement Check Diagnostic #1 must be enabled and must pass for Diagnostic #4 to be enabled and check for a problem. This will allow the system to make the assumption that all the phasors are in the relatively correct orientation and that there are no wiring problems. Since the voltage angles passed Diagnostic #1, the meter will assign the voltage phasors to be constant at the typical phasor angle.
If Diagnostic #1 passes, the meter will then determine the angle of each current phasor with respect to VA for Diagnostic #4. The meter will monitor each current phasor angle for validity with respect to the meter’s form number and service type. Diagnostic #4 will take the “typical” phasor diagram at unity PF for a particular form number and service type and place a user-defined envelope around each current phasor, where the actual phasor must be found for the diagnostic check to pass.
An example would be if a typical diagram has the C phase current angle at 240° and the user has programmed an acceptable envelope of ±45° around that phasor, then the actual current phasor must be between 195° to 285° from VA for the diagnostic to pass that check. The system will check each current phasor in a similar fashion. Here, the current vector must be within ±45° of the voltage vector for Diagnostic #4 to pass.
IT Department 147 Proprietary and Confidential
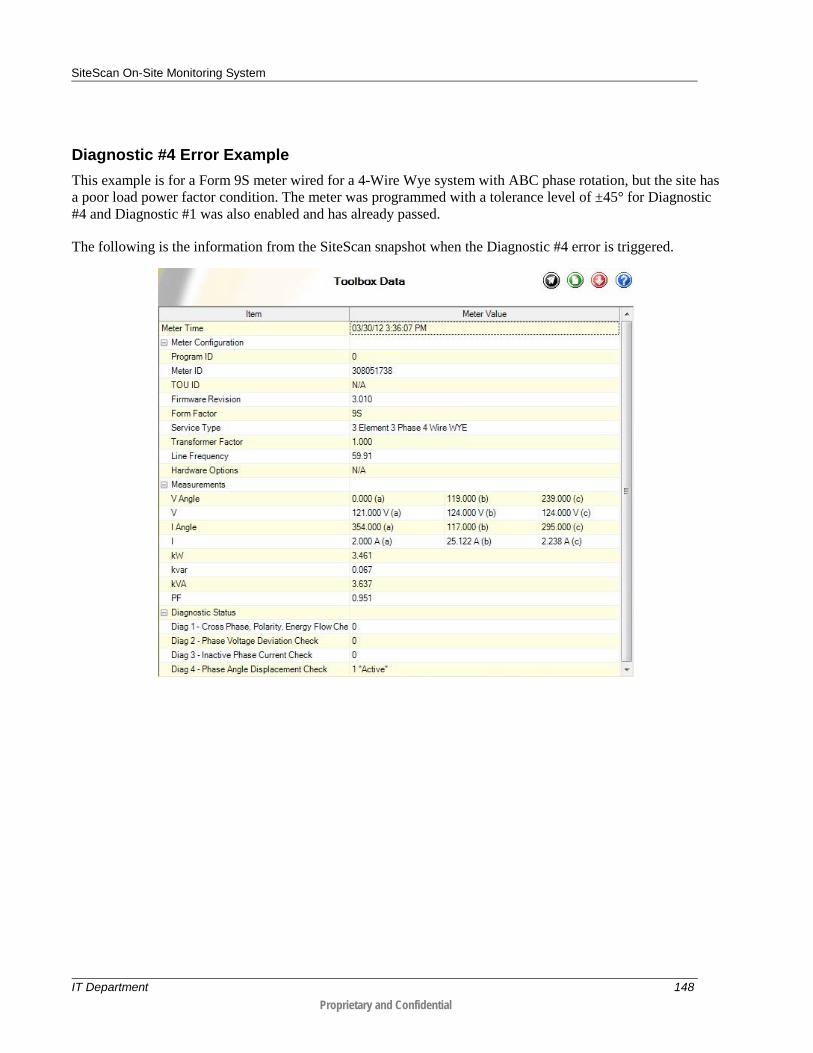
SiteScan On-Site Monitoring System
Diagnostic #4 Error Example This example is for a Form 9S meter wired for a 4-Wire Wye system with ABC phase rotation, but the site has a poor load power factor condition. The meter was programmed with a tolerance level of ±45° for Diagnostic #4 and Diagnostic #1 was also enabled and has already passed.
The following is the information from the SiteScan snapshot when the Diagnostic #4 error is triggered.
IT Department 148 Proprietary and Confidential

SiteScan On-Site Monitoring System
The next step is to graphically plot the above information into a phasor diagram as shown in the figure below.
By comparing the phasor diagram drawn from the information found in the snapshot versus the typical phasor diagram, it becomes clear that the C phase current is out of the user-defined envelope. The correct phasor should be around 240.0°, not the 295.0° where the phasor currently is. This is not a problem with the meter or a wiring problem at the site, but it does indicate a poor load power factor condition which may need to be corrected. Also note that diagnostic counter d4 has incremented to “1” and is "Active".
IT Department 149 Proprietary and Confidential

Overview Itron OpenWay CENTRON meters with Hardware 2.0 and 3.0 have been equipped with IEEE 802.15.4 compliant radios and firmware that support the use of Smart Energy Profile (SE) 1.x Home Area Network (HAN) devices. Smart Energy Profile is an industry standard that defines bi-directional communications between the meter and external devices to share information with electricity consumers and to provide control of large load devices such as HVAC systems, pool pumps, or personal electric vehicle charging stations.
Software Support OpenWay Field-Pro is available to help you see the status of currently attached HAN devices. You will be able to see the HAN communications states as well as the last measured signal quality between the meter radio and the HAN radio. Refer to the OpenWay Tools User Manual for specific information about how to use the OpenWay Field-Pro tool.
For more information on connecting HAN devices to a meter’s HAN and seeing diagnostic information refer to the user guides for the following Itron OpenWay products:
• OpenWay Field-Pro
• OpenWay Collection Engine
Supported HAN Devices SE 1.x certified devices
• In-Home Displays (IHD)
• Thermostats
• Load control devices
• Gateways
A P P E N D I X B
OpenWay HAN Communications
IT Department 150 Proprietary and Confidential

OpenWay HAN Communications
Joining HAN Devices Before devices are allowed to join the HAN, the meter must first commission the network. As network coordinator, the meter is responsible for management of the network, which also includes serving as the Trust Center (TC). Parameters which define how the network is to be created are retrieved from the CE. These settings include whether the network is to be formed dynamically or by using pre-determined values, and which security options to use.
There are two types of HAN devices:
• Automatic Devices—The only automatic devices that currently exist are the Itron gas modules. These devices will automatically join the HAN that it can most easily join; thus, it is possible for one or more gas modules to join a single meter’s HAN. In fact, it may be that a gas module joins a HAN other than that of the house it is monitoring due to the fact that a gas module may be located closer to another home’s meter than its own.
• Controlled Devices—All Smart Energy (SE) 1.0 HAN devices are controlled devices in that they may not automatically join a meter’s HAN without explicitly being granted permission to do so. The process of joining requires that the head-end system send a command to the meter through the collection engine to give it the MAC address and install code or link key of the specific HAN device that is to join and the meter then announces that it will allow HAN devices to join. However, even if there are other available HAN devices that wish to join the HAN, only the specified HAN device will be allowed to join the meter’s HAN.
When the joining process completes successfully, the device is fully commissioned on the meter and may begin communicating securely.
HAN Device Messaging The meter is only capable of storing one message. When the message is sent, it not only includes the message, but also has the activation time, duration, criticality, and a confirmation flag. When a message comes into the meter, it is immediately sent out to all HAN devices that are bound to the meter on the message cluster. HAN devices can query the meter at any time for the current message.
IT Department 151 Proprietary and Confidential

OpenWay HAN Communications
Demand Response and Load Control Demand Response Load Control (DRLC) functionality sends events to IHDs that can react to these events by controlling smart appliances within the home. This allows utilities to schedule DRLC events during peak usage times. DRLC events control these devices to turn off or go into a power saving mode for a defined period of time.
The meter acts as a DRLC server, storing DRLC events from the CE and then forwarding them to any device that is bound to it. The meter stores 10 DRLC events. If there are 10 DRLC messages in the meter and another event is added, then the meter compares the start time and duration of each event and keeps the next 10 events to occur. When the meter receives a new DRLC event, it publishes a new list of DRLC events to any HAN bound to it. The devices can also query the meter for the latest list of DRLC events.
An event can only be canceled by canceling the entire event. If the event is in progress when the cancel command is sent out, the device is told to cancel the event immediately. The event is also removed from the meter's list so that when devices query the meter for the current list of events, the canceled event will not be returned. If the event has not yet started when canceled, the device will never begin the event. The CE can also send a command to cancel all Load Control events. This will clear all of the events from the meter's queue and the message sent to the HAN devices will tell them to cancel all current and future Load Control events.
Securing HAN Communications Security certificates are used to secure communications between the meter and the HAN devices. These certificates are generated by Itron manufacturing and installed in the meter. The security certificates are valid for the life of the meter.
HAN Event Logs The HAN event logging functionality provides a record of events in the meter's HAN network and possibly provides troubleshooting information. HAN events are logged independently of other meter events. There are two HAN Event Logs:
• Outgoing/Downstream Message Log—messages sent from the CE to the meter. The Downstream Message Log is a circular log that stores the last 90 events.
• Incoming/Upstream Message Log—messages between specific HAN devices and the meter. These messages contain detailed data about a specific HAN device. The Upstream Message Log is a circular log that stores the last 880 events.
IT Department 152 Proprietary and Confidential

OpenWay HAN Communications
Outgoing/Downstream Message Log
Event Description HAN Message Published A new text message was written to the meter and sent out to
the HAN devices. HAN Pricing Data Published Pricing data was written to the meter and sent out to the HAN
devices. HAN DRLC Data Published A DRLC event was written to the meter's event queue and sent
out to the HAN devices. HAN Price Tier Changed The price tier has changed and the new price was published to
the bound HAN devices. HAN New DRLC Event Dropped A new DRLC event was dropped because the meter's DRLC
list is full. HAN Existing DRLC Event Dropped
An existing DRLC event was dropped because the meter's DRLC list is full.
HAN Meter Network Change There was a change in state for the HAN network on the meter. Security Profile Update Notification
The meter is not automatically changing the security settings because a gas module or HAN device is meter's registration table.
HAN Diagnostic Event • Channel change • PAN ID change • Zigbee halted due to reset limiting • Configuration change • Gas module told to leave • Management leave request forced network restart • Invalid
Critical Peak Pricing • Published CPP event to HAN device.
IT Department 153 Proprietary and Confidential

OpenWay HAN Communications
Incoming/Upstream Message Log
Event Description HAN Message Confirmation A user confirmed a text message. HAN Price Acknowledgment A device sent back an acknowledgment to a price message. HAN Load Control Opt Out A user has opted out of a DRLC event either or before the
event. This event is also available as an exception. HAN Load Control Status Event Status Values:
• Load Control Event Command Received • Event Started • Event Completed • User has chosen to "Opt-In" • The event has been canceled • The event has been superceded • Event partially completed with user "Opt-In" • Event completed, no user participation (Previous "Opt-
Out") • Rejected - Invalid Cancel Command (Default) • Rejected - Invalid Cancel Command (Invalid Effective
Time) • Rejected - event was received after it had expired • Rejected - Invalid Cancel Command (Undefined Event) • Load Control event Command Rejected
HAN Device Status Change Registration Status of a HAN device; supported statuses: • Not Registered • Registration Failed • Registration Success • Invalid Certificate • Pending • Network Up • Private Profile • Reg Fatal Error • Invalid
HAN Device Added HAN device has been provisioned to the meter. As of SR3.9 this event is no longer available as an exception.
HAN Device Removed HAN device successfully dropped from the meter or the meter heard a leave request from the device.
HAN Device Not Heard Meter has not heard from a HAN device after a defined/calculated threshold.
HAN Ping Result Ping operation result logged. HAN DRLC Delivery Failed A DRLC event delivery failed. HAN Message Delivery Failed A message event delivery failed. IT Department 154 Proprietary and Confidential

OpenWay HAN Communications
Event Description HAN Price Delivery Failed A price event delivery failed. HAN Sub-Metering Bubble-Up Data Missing
Part of the sub-metering devices internal data are missing at bubble-up.
HAN Device Utility Enrollment Group Update
The UEG number of the device was changed successfully.
HAN Device Joined HAN device successfully joined. This event is also available as an exception.
Dynamic Pricing Support OpenWay supports both TOU-based and non-TOU based dynamic pricing schemes for HAN presentment. The diagram below shows system-wide interaction required to deliver dynamic price information to the customer when the meter has a TOU configuration.
OpenWay Collection Engine OpenWay CENTRON In-Home Energy Display
Update TOU Schedule for each
TOU Season
Typical ‘day in the Life’ between
CENTRON and IHD
CPP Event
Program TOU schedule into Meter (seasonal)
Get scheduled prices (daily)
Return all price tiers for the day
Publish price (for each break point during the day)
Get consumption summation for register x
Return consumption for requested tier
Send CPP Event (few times per season)
Send CPP Event
Get consumption summation for CPP register
Return consumption for CPP register tier
Publish price for current price tier when CPP ends
IT Department 155 Proprietary and Confidential

OpenWay HAN Communications
Initially, the TOU configuration must be programmed into the meter; this typically happens 2-3 times per year. Each day, the IHD may request the scheduled prices, or alternatively the meter may publish price at the beginning of each day. This is necessary, since the meter’s TOU configuration may have different break points and tiers in effect for different types of days. The in-home display may support a summary screen that shows the customer the current day’s tiers and associated prices. Each time the meter passes a breakpoint into a new price tier, the meter will publish that price tier to the in-home display. If the in-home display presents consumption within the tier to the customer, it can also request consumption updates from the current price tier’s register tier.
When a CPP event occurs, the Collection Engine will send a price update to the CPP tier, which will include a price, start time, and duration. Once received by the meter, this event will be published to the in-home display. When the CPP event begins, the CPP price tier and register will be active in the meter, and consumption will be accumulated in the CPP register. At the end of the event, the meter will revert back to the active price tier at that time, and publish that price to the in-home display. Consumption accumulation will resume in the current price tier’s register.
The diagram below shows system-wide interaction required to deliver dynamic price information to the customer when the head-end system is providing regular updates to prices. Each day (or periodically), the head-end system pushes the current price information through the Collection Engine to a group of meters. Upon receipt, each meter will in turn publish these prices to in-home devices. Without a TOU schedule in the meter, each individual price must include a start time and duration to indicate when that particular price is active. Rather than updating a price from the head-end system to meters each time a current price is about to expire, a group of prices is sent down at a single time.
Each time the meter passes a breakpoint into a new price tier, the meter will publish that price to the in-home display. If the in-home display presents consumption within the current tier to the customer, it will regularly request whole-home consumption updates from the meter, and apply logic to calculate the consumption accumulated since the beginning of the current active price.
Among the price tiers maintained and communicated downstream to meters, is a CPP tier with no start time or duration. When a CPP event occurs, the head-end system sends a price update and activation time/duration to the affected meters’ CPP tier. After receipt by the meter, this event is published to the in-home display. When the CPP event begins, the CPP price tier and register will be active in the meter. At the end of the CPP event, the meter will revert back to whatever price tier is active at that time, and publish that price to the in-home display.
Simple Recurring Price Simple Recurring Price is a dynamic pricing structure as described above that repeats its daily price schedule until told to stop. CPP pricing is not supported with Simple Recurring Price.
IT Department 156 Proprietary and Confidential

accelerometer A microelectromechanical system (MEMS) used to detect and measure acceleration. Smart meters may contain accelerometers to facilitate tamper and theft detection. Utility industr y ter ms|
advanced meter An electric meter that is capable of measuring and recording usage data in time differentiated registers. This meter allows electric consumers, suppliers and service providers to participate in price-based demand response programs and provides data and functionality to address power quality issues.
advanced metering infrastructure (AMI) Utility metering and communications system that leverages two-way communication between a utility company and smart energy management devices, including smart meters, thermostats, and other energy management devices. AMI provides utility companies real-time consumption data, and provides customers detailed usage data. AMI systems support capabilities such as load control, time-of-use and critical-peak pricing, and outage and restoration reporting.
An AMI system consists of the following components:
• Smart meters that collect and store interval consumption data, interface with, and collect and store data from other devices, such as other meters. Smart meters can also initiate and respond to two-way communications with the utility.
• Home gateway devices that communicate with and control energy-using appliances throughout the home, and can communicate with the utility.
• A network over which smart meters, home gateway devices, and other AMI components execute two-way communications to transmit data and commands between the utility and the home.
• A meter data management (MDM) system to which the collected data is delivered. MDM systems can interface with other utility systems, such as customer information systems (CISs), outage management systems (OMSs), and workforce management systems (WMSs).
Utility industr y ter ms|
AMR automated meter reading The collection of utility meter data through the use of ERT modules that are connected to the meters, eliminating the need for field service representatives to physically inspect and read the meters. Additionally, ERT modules monitor and record related information such as meter tampering data.
Also called remote meter reading. Utility industr y ter ms|OpenWay|Fi xed N etwor k|Mobile Coll ecti ons System|Abbrevi ations|
annunciator A label or symbol on the meter display that identifies particular quantities displayed for a register. The OpenWay CENTRON meter, for example, uses LCD annunciators to indicate phase-voltage for each phase (VA, VB, VC), nominal voltage (120 and 240), and load/direction. Utility meter ter msOpenWay|CENTR ON|SENTIN EL|
Glossary
IT Department 157 Proprietary and Confidential
Glossary
ANSI C12.22 An application protocol designed to carry ANSI C12.19 table data over a network.
automated meter reading (AMR) The collection of utility meter data through the use of ERT modules that are connected to the meters, eliminating the need for field service representatives to physically inspect and read the meters. Additionally, ERT modules monitor and record related information such as meter tampering data.
Also called remote meter reading. Utility industr y ter ms|OpenWay|Fi xed N etwor k|Mobile Coll ecti ons System|
baud rate In digital communications, the data transmission rate in symbols per second. When measuring the line code transmission speed, the baud rate is measured in pulses per second. Communication ter ms|
block interval demand Demand based on intervals from 1 to 60 minutes. All calculations of demand are based on rolling demand. To calculate block interval demand, you must program the meter register to have one subinterval of the same length as the demand interval. Utility industr y ter ms|OpenWay|ChoiceC onnect|
Broadcast Message A message destined for all nodes in the network.
calendar schedule A schedule that determines items such as seasonal changes, holidays, or daily patterns. Utility meter ter ms
cell relay An OpenWay communication device that routes messages between the smart meters that make up its cell and the OpenWay Collection Engine (CE). OpenWay|
ChoiceConnect® Itron’s comprehensive suite of ERT module-based automated meter reading (AMR) systems. ChoiceConnect includes walk-by, drive-by, and fixed network meter data collection solutions, all using Itron’s 900-MHz endpoint technology. Itron produc t names|
cold load pickup (CLPU) The increased currents that occur during the re-energization of a circuit or substation after an extended power outage during which there was a loss of load diversity. CLPU can also refer to the delay between the end of a power outage (cold load) and the moment when a meter’s register resumes (picks-up) calculation of demand. Utility industr y ter ms|Distribution D esign Studio|
IT Department 158 Proprietary and Confidential

Glossary
Continuous Cumulative Demand Value (CCUM) The sum of the maximum demand and the cumulative demand on a meter at any point in time. At the end of each demand interval, if a new maximum demand is reached, continuous cumulative demand is adjusted to reflect the new maximum demand value. A demand reset clears the maximum demand value, but does not affect the continuous cumulative demand. Continuous cumulative demand may be used for block, rolling, and thermal demand types. Itron company-specific terms|
critical peak pricing (CPP) A temporary rate structure imposed by electric utilities to curb usage when power system emergency conditions are anticipated and additional sources of electricity may be necessary to meet demand. Utility industr y ter ms| Itron Enter prise Edition|OpenWay|
CT ratio current transformer ratio The ratio of the incoming current to the stepped-down current to the meter. In North America, the CT ratio is generally chosen so that the nominal secondary current is 5 to 10 amps, regardless of the primary current. Utility industr y ter ms|Distribution D esign Studio|OpenWay|Abbr eviations|
Cumulative Demand Value (CUM) The sum of all previous maximum demand values on a meter after a demand reset condition. When a demand reset occurs, the maximum demand values are added to the existing corresponding cumulative demand values, and the sums are saved as the new cumulative demand values. These values do not increase until the next demand reset condition. Cumulative demand may be used for block, rolling, and thermal demand types. Itron company-specific terms|Abbrevi ations|
current season A season schedule, programmed into a meter, that defines the present rate schedule. Utility meter ter ms
daylight saving time (DST) The practice of temporarily advancing clocks by one hour in the spring so afternoons have more daylight and mornings have less. Communication ter ms| Itron Enter prise Edition|OpenWay|
demand The rate at which electric energy is delivered or used at a given time or over a designated period of time. Demand is expressed as kilowatts (kW), kilovolt-amperes (kVA), kilovars (kvar), and so forth. There are different types of demand such as maximum demand, block demand, and rolling demand. Utility industr y ter ms| Itron Enter prise Edition|OpenWay|
demand delay The programmable amount of time required before demand calculations are restarted after a power outage.
demand interval The specified time over which demand is calculated. Utility industr y ter ms|OpenWay|
IT Department 159 Proprietary and Confidential

Glossary
demand reset The function that sets demand registers in the meter to zero.
demand response A customer-side reduction in electricity consumption, used to modify the timing and/or quantity of demand on the power grid during peak usage times. Examples of demand response (DR) range from time-of-use (TOU) price rates for residential customers, to on-site power generation for those commercial & industrial (C&I) customers whom have the ability. Some uses of DR include, but are not limited to: avoiding brownouts; balancing a power grid's electricity consumption/production relationship; and lowering electricity prices during peak demand. Utility industr y ter ms| Itron Enter prise Edition|
demand subinterval The smaller blocks of time that are used in rolling demand calculations. Utility industr y ter ms|
Demand Threshold A configured value that, when exceeded by calculated demand, initiates a contact closure, a log entry, or a phone home event.
display Provides a visual indication of the data accumulated by the register. PC-Pro+
Electronic Detent An electronic method for preventing received energy from accumulating in the delivered energy register. When detent is enabled, the received energy is accumulated in a separate register.
Error Code An enumerated message that corresponds to a fault in the operation of a meter. Error codes are categorized by severity as either non-fatal or fatal and are useful for troubleshooting meter faults.
firmware A set of program instructions stored in a device’s EPROM (erasable programmable read-only memory). The firmware version identifies device functionality and compatibility with other devices or applications.
Flash Memory an electronic non-volatile computer storage medium that can be electrically erased and reprogrammed.
head end/head-end system (HES) A software application that receives the stream of meter data brought back to the utility by an AMR/AMI system. Head-end systems may perform a limited amount of data validation before either making the data available for other systems to request or before pushing the data out to other systems. Head-end systems may also perform a limited set of data management functions for such activities as route management, outage detection, and on-demand reads. Utility industr y ter ms| Itron Enter prise Edition|OpenWay|
IT Department 160 Proprietary and Confidential

Glossary
History Log Log used to record historical events that occur in the meter. The events to be logged must be configured via the Configuration Editor software.
home area network (HAN) A residential local area network (LAN) used for communication among digital devices in the home, such as personal computers, printers, and mobile computing devices. Gener al computi ng terms|
IDM interval data message A message sent by some ERT modules to Itron fixed networks at programmed intervals, in addition to the standard consumption message (SCM). The IDM contains kWh read, tamper, and interval recording data from which the network can calculate such things as demand, time-of-use (TOU), peak energy consumption periods, and load profiling information. Itron company-specific terms|Abbrevi ations|
in-home display The functionality of a HAN Device that receives and displays data. This functionality may reside in a separate display device or be integrated into another device with greater functionality.
Internet Protocol (IP) The rules or standards by which data is sent from one computer to another on the Internet. Communication ter ms|Fixed N etwork|
interval data message (IDM) A message sent by some ERT modules to Itron fixed networks at programmed intervals, in addition to the standard consumption message (SCM). The IDM contains kWh read, tamper, and interval recording data from which the network can calculate such things as demand, time-of-use (TOU), peak energy consumption periods, and load profiling information. Itron company-specific terms|
Itron Security Manager (ISM) A component of Itron Security Manager suite. Utilities use ISM to facilitate encryption, authentication, decryption, and validation of meter reading data and commands to and from Itron ChoiceConnect endpoints. ISM also manages the key exchanges and security state for endpoints and repeaters. Itron produc t names|
LAN local area network A data communications system in a limited geographic area and that has a specific user group. A LAN is restricted to a relatively small areas, such as a room, building, or small neighborhood.
Last Season The season immediately preceding the current season.
IT Department 161 Proprietary and Confidential

Glossary
LCD liquid crystal display
LED Light-emitting diode.
Line of Sight (LOS) Communications through free-air with no obstacles.
Load (Service) Limiting Load (service) limiting is triggered by the present demand threshold value. When the load exceeds the programmed value for demand threshold, the customer will be disconnected. The meter will remain disconnected for a programmed number of minutes up 65535. A programmable setting specifies if the homeowner can override their disconnected service by pressing the switch on the face of the meter.
load profile The profile of a customer’s electricity load or usage pattern over a period of time, sometimes shown as a graph. Itron Enter prise Edi tion|OpenWay|Utility industr y ter ms| Itron C ellul ar Sol utions|
local area network (LAN) A data communications system in a limited geographic area and that has a specific user group. A LAN is restricted to a relatively small areas, such as a room, building, or small neighborhood.
Magnetic Switch A solid-state or mechanical switch which is closed by an external magnetic field.
maximum demand In a load curve or a load duration profile, the highest demand of energy usage calculated or measured during any interval over a selected period of time. Utility industr y ter ms| Itron C ellul ar Solutions|
Mode Timeout The amount of time the meter will remain in Alternate Mode, before automatically returning to Normal Mode. This time is configurable.
non-volatile memory Data memory that is not dependent on electrical voltage for persistence.
normal mode A meter operation and display mode which includes all routine meter operations. PC-Pro+
IT Department 162 Proprietary and Confidential
Glossary
optical port Port located on the front face of the meter through which the meter can be programmed and communicated with.
Power Outage Notification The Itron Power Outage and Restoration solution provides utilities with the most reliable, precise and easily managed AMR/AMI-based outage detection and restoration notification system available in the industry.
When deployed as an integral component of Itron Fixed Network 2.0 meter reading technology, outage and restoration alerts based on programmable parameters are transmitted immediately from CENTRON Solid-State R300 meters and processed by the network to quickly pinpoint the location and determine the extent of a power outage. That report can then be passed immediately to the utility’s Outage Management System (OMS) to expedite response and optimize dispatch of restoration resources.
The Power Outage and Restoration solution helps utilities reduce outage duration, increase system reliability and improve overall customer satisfaction.
real-time pricing Electricity rates that reflect the actual moment-by-moment cost of providing electricity. Utility industr y ter ms|
register multiplier A programmable value used by a meter to calculate the energy and demand readings it displays or uses as a custom multiplier for special billing system requirements. For the OpenWay CENTRON, the register multiplier is set to 1.00 and cannot be edited in the Collection Engine. OpenWay|CENTRON|
Remote Disconnect/Connect See Service Disconnect Switch Control.
RF2Net An Itron technology research project, completed in 2004, to develop a two-way communications network that is self-forming, self-healing, and scalable. Itron company-specific terms|
RFLAN radio-frequency local area network An Itron-proprietary local area network (LAN) consisting of an OpenWay cell relay and the CENTRON meters that communicate with it through radio frequency connections. Each cell relay can support up to 2000 meters. Connectivity between a meter and a cell relay can be direct, through another smart meter, or through multiple layers of smart meters. The RFLAN network is dynamic and self-healing. If the connection between a meter and a cell relay is broken or blocked, the meter locates another connection path through the network mesh to the cell relay. OpenWay|CENTRON|
IT Department 163 Proprietary and Confidential

Glossary
RFLAN Protocol An implementation of Itron proprietary wireless mesh network protocol based on the LinkNet2 specification.
rolling demand interval A method of measuring power or other quantities by taking measurements within fixed intervals of the demand period. Utility industr y ter ms|CENTRON|ChoiceConnec t|OpenWay|
RS-232 Recommended Standard 232 A series of telecommunications standards for the electrical characteristics of data terminal equipment connectors, such as computers; and remote devices such as modems, printers, and display screens. Characteristics defined in the standards include serial binary single-ended data and control signal timing, connector pinout meaning and signal direction, and the number of pinouts and their physical size and arrangement on the connector.
RS-232/RS-485 Accepted industry standards for serial communications connections. This Recommended Standard (RS) defines the specific lines and signal characteristics used by serial communications controllers to standardize the transmission of serial data between devices.
SCM/SCM+ standard consumption message A message containing the current meter reading and tamper/status indicators that is sent by an Itron ERT module to a meter data collection device. Itron company-specific terms|Abbrevi ations|
Season A configurable amount of time that a rate schedule is in effect. Season start dates are configured in the format MM/DD (Month/Day).
Self-reading Registers Register data that is captured in the meter at a configured interval of time and is stored in non-volatile memory.
Service Disconnect Switch Control A device that provides the ability to remotely disconnect and reconnect power to residential electric meters.
Service Limiting See Load (Service) Limiting
Sliding Window Demand A calculation of maximum demand derived from the moving average of the smaller consecutive subintervals.
IT Department 164 Proprietary and Confidential

Glossary
smart meter An electric meter that is capable of measuring and recording usage data in time differentiated registers. The meter allows electric consumers, suppliers, and service providers to participate in price-based demand response (DR) programs and provides data and functionality to address power quality issues. Also known as an advanced meter. Utility industr y ter ms|Utility meter ter msOpenWay|
test mode A meter operation and display mode which allows testing of the register without altering billing data. PC-Pro+
time-of-use (TOU) A rate structure with different unit prices for electricity use over a 24-hour time frame. Daily TOU patterns can be assigned to different days of the week, seasons, and holidays. Utility industr y ter ms| Itron Enter prise Edition|OpenWay| Itron C ellul ar Sol utions|Abbr eviations|
time-of-use (TOU) block In a time-of-use (TOU) rate structure, a period of time during which a particular unit price rate for electricity applies. For example, a TOU block might be from 8:00 AM to 5:00 PM. Itron Enter prise Edi tion|Utility industr y ter ms|
time-of-use (TOU) rate A rate with different unit prices for usage during different blocks of time, usually for a 24-hour period. TOU rates reflect the average cost of generating and delivering power during those time periods. Daily pricing blocks might include an on-peak, mid-peak, and off-peak price. In a time-of-use rate structure, higher prices are charged during utility peak-load times. Such rates can provide an incentive for consumers to curb power use during peak times.
VT ratio Voltage transformer ratio.
Valid entries are 1.0 through 1024.0 in increments of 0.1. The values available in the selection list are determined by the default settings defined in the System Manager application.
wide area network (WAN) A geographically dispersed communications network with a specific user group; that is, any network that links across metropolitan, regional, or national boundaries. A WAN may be privately owned or rented, but the term usually implies the inclusion of public (shared user) networks. Communication ter ms|General computing ter ms|
ZigBee® A communications network specification created by an alliance of sensor manufacturers, semiconductor manufacturers, and end users. For Itron metering purposes, it is the application chosen to run home area networks (HANs). Each OpenWay CENTRON meter comes factory-equipped with a ZigBee radio chip to enable in-home communication for purposes of customer communication, data presentment, load control, and demand response. Utility industr y ter ms|OpenWay|Third- par ty produc ts|
IT Department 165 Proprietary and Confidential

Symbols & Numbers
A Access Groups
security • 14 annunciator • 32
voltage indicator • 102 ANSI C12.1 • 24, 29 ANSI C12.18 • 29 ANSI C12.19 • 29 ANSI C12.20 • 29 ANSI C12.22 • 29 ANSI C62.45 • 29 Application Level Security • 11
B battery • 24, 31, 49, 64, 108, 112
storage • 31 baud • 48 bidirectional measurement • 38 billing data • 64 block demand • 40 board-to-board connector • 111 button • 32
test mode • 32
C C12.22 exception • 84 Cell Relay • 18, 23 characteristic data • 24 coincident demand • 54 cold load pickup (CLPU) time • 49 Collection Engine (CE) • 23 cover • 31 Critical Peak Pricing (CPP) • 63 Crystal Time synchronization • 32 current season register • 62 current/potential terminals • 32
D daily patterns • 61 day types • 61 demand reset • 56 demand
calculation • 40
demand quantities • 51, 64 interval • 41, 49, 103 register • 62
diagnostic 1 problem indications • 137
E electrical specifications • 24 electronic serial number (ESN) • 23 energy
quantities • 37, 51 register • 62
envelope example • 148 error code • 59 Event Log • 84 exception
alarms • 84 C12.22 • 84
F fatal errors • 106, 108 Field-Pro • 65, 97 Form 9S/36S • 35
G Gas Module
configuration • 11 firmware download • 12
H Hall Effect • 19, 33 HAN • 11, 14
device Mirroring • 11 disable • 12 events • 11 HAN devices • 11 HAN joining • 12 multiplier • 13 security • 14 tiered pricing • 13
Harmonic Data • 37
I IEC 61000-4-2 • 29 IEC 61000-4-4 • 29 IEEE C62.45 • 29
Index
IT Department 166 Proprietary and Confidential

Index
Infrared Test Light Emitting Diode (LED) • 102, 105
interval length • 64, 64
K key
network level • 11 KY outputs • 21, 43 KYZ outputs • 21, 43
L LCD • 31, 102
LCD display • 32, 62 LED • 49 line frequency • 32 liquid crystal display • 46 lithium battery
shelf life • 31 load emulator • 102 load profile • 49
load profile data • 65 status codes • 65
log History log • 84
M Metal Oxide Varistor (MOV) • 36 meter
base • 31, 32 cover • 31 storage • 31
MeterKey • 35 metrological quantities • 37 metrology
board • 19 multiple self reads • 42
N Network
network level key • 11 traffic handling • 8
non-volatile memory • 41, 49, 65 normal display mode • 59 Normal Mode • 55
O OpenWay Network • 2 OpenWay Tools • 56
operating environment • 24 operating temperature range • 32 optical connector • 31 optical port • 48, 97, 98, 99 outer cover • v
P polyphase meter
advanced • 45 basic • 45
power factor • 41, 102 power outage • 64 Power Outage Notification (PON) • 83 power restoration • 64 Power Restoration Notification (PRN) • 83 preventive maintenance • 112 pulse adapter • 105 pulse count • 103
Q quantities • 37
R range extender • 7 rate
annunciators • 62 schedule • 62
remote disconnect • 84, 98 repair • 113 reset
mechanism • 31 RFLAN • 10, 99
range extender • 7 rolling demand • 40
S season • 62 security model
C12.22 • 84 Security
Application Level • 11 ZigBee Network Level • 11
segment check • 32 Self Read • 42 self-read
multiple self reads • 42 Shop Manager • 56 SiteScan • 125
diagnostics • 125 IT Department 167 Proprietary and Confidential

Index
specifications characteristic data • 24 electrical specifications • 24 operating environment • 24 technical data • 29 type codes • 29
storage • 31 meter • 31
surge protection • 36
T technical data • 29 test mode • 55, 56 thermal demand • 40 threshold • 38 time synchronization • 60 TOU • 49, 62
annunciator • 62 rate • 57 rate indicators • 62 TOU operation • 62
traffic handling • 8 type codes • 29
W watt disk emulator • 46, 103
Z ZigBee Device Manager • 56 ZigBee Network Level Security • 11
IT Department 168 Proprietary and Confidential


