Page 1
Operating Room Version of Safety
Attitudes Questionnaire – An Analysis
Using Structural Equation Models
Liying Zheng
Supervisor: Fan Yang-Wallentin
Department of Statistics, Uppsala University
June, 2012
Page 2
Abstract
Assessing the safety attitude of caregivers in hospital is important for improving patients’ safety.
Safety Attitudes Questionnaire (SAQ) is widely used to investigate this. SAQ has six dimensions:
Job Satisfaction (JS), Teamwork Climate (TC), Working Condition (WC), Safety Climate (SC),
Perception of Management (PM) and Stress Recognition (SR). A SAQ survey in three Swedish
hospitals’ Operating Room has been analyzed in this paper. The aim of the study is one to verify
the validity of SAQ; two to explore the relationships between these different factors; three to
identity there are relations between Job Satisfaction and the rest five factors. The results suggests
all the measurements are valid and reliable for the SAQ. By using Structural Equation Modeling,
we found that Job Satisfaction was strongly associated with TC, WC, SC and PM. In addition,
the relationship between JS and SR is relatively weak compared to the others.
Keyword: safety attitude questionnaire, measurement model, structural equation models
Page 3
Acknowledgments
First I would like to give my sincerest gratitude to my supervisor Prof. Fan Yang-Wallentin in
Uppsala University. Thank you for leading me to the world of Structural Equation Modeling and
always be patient to answer my questions. Your well organized working process and scientific
attitude will be a great treasure for my whole life. I was also very pleased that Camilla Göras
provided the data for my study.
Special thanks for my dear family and the people who love me and support me always.
Page 4
Contents
1. Introduction ........................................................................................................................................... 1
1.1 Safety Attitudes Questionnaire ...................................................................................................... 1
1.2 Early Work Review ....................................................................................................................... 2
2. Motivation ............................................................................................................................................. 3
3. Research Questions ............................................................................................................................... 4
4. Data ....................................................................................................................................................... 5
4.1 Data Collection .............................................................................................................................. 5
4.2 Variable Selection and Description ............................................................................................... 6
4.3 Treatment of Missing Values ......................................................................................................... 8
5. Model .................................................................................................................................................... 9
5.1 Model Specification ....................................................................................................................... 9
5.2 Model Implied Covariance Matrix .............................................................................................. 14
5.3 Model Identification .................................................................................................................... 15
5.4 Model Estimation ......................................................................................................................... 15
5.4.1 Maximum Likelihood (ML) ................................................................................................. 15
5.4.2 Robust Maximum Likelihood (RML) .................................................................................. 16
6. Results ................................................................................................................................................. 17
6.1 Model Assessment ....................................................................................................................... 17
6.2 Model Modification ..................................................................................................................... 19
6.3 Results of Modified Model .......................................................................................................... 19
7. Conclusion .......................................................................................................................................... 22
References ................................................................................................................................................... 24
Appendix ..................................................................................................................................................... 26
Page 5
1
1. Introduction
How to improve the patients’ safety from harm is a common interest for the hospitals. One of the
most common used definitions is ―patient safety is a new healthcare discipline that emphasizes
the reporting, analysis, and prevention of medical error that often leads to adverse healthcare
events.‖ There are many factors that influence the patient safety, for instance: human factors,
medical complexity and so on. From previous researches, the climate of workplace, attitudes and
knowledge among health professionals also affects the patients’ safety in practice. In this paper,
we focus on Safety Attitudes Questionnaire (SAQ) which is a widely used tool to measure safety
climate in Operating Room. The following questions are of interest: What is the structure of
Safety Attitudes Questionnaire (SAQ) and how it can be used in practice? Are all the
measurements for SAQ reliable? Since there are six dimensions (Job Satisfaction, Teamwork
Climate, Safety Climate, Working Conditions, Perception of Management and Stress
Recognition) exiting in SAQ, are there any relationships between them? How they relate to each
other.
1.1 Safety Attitudes Questionnaire Safety Attitudes Questionnaire (SAQ) is one of the most popular tools to measure safety culture
which is an important concept in health care environment. SAQ has been developed over 18
years. SAQ is a refined instrument of the Intensive Care Unit Management Attitudes
Questionnaire (ICUMAQ) (Sexton, Thomas & Helmreich, 2000) which was derived from the
Flight Management Attitudes Questionnaire (FMAQ) (Helmreich, Meritt, Sherman, Gregorich &
Wiener, 1993). The brief description of SAQ is shown in table 1. The items of SAQ were
evaluated through pilot testing and exploratory factor analysis which led to identification of the
following six factors: Teamwork Climate (TC), Safety Climate (SC), Perception of Management
(PM), Job Satisfaction (JS), Working Conditions (WC), and Stress Recognition (SR) (Ellen T
Deilkås, 2008).
Normally, a short version SAQ has 30 items and all the items belong to six dimensions. A full
SAQ is with 60 items and other questions are related to demographics information (i.e. age, sex,
experience, and nationality). The answer alternatives of all 60 items are in five-point Likert scale,
i.e., Disagree Strongly, Disagree Slightly, Neutral, Agree Slightly and Agree Strongly.
Page 6
2
Factor definitions Example of items
Teamwork climate: perceived quality of
collaboration between personnel
–Disagreements in the OR s here are
resolved appropriately (i.e., what is best for
the patient)
–The physicians and nurses here work
together as a well- coordinated team
Job satisfaction: positivity about the work
experience
–I like my job
–This hospital is a good place to work
Perceptions of management: approval of
managerial action
–Hospital administration supports my daily
efforts
–Hospital management is doing a good job
Safety climate: perceptions of a strong and
proactive organizational commitment to
safety
–I would feel perfectly safe being treated
here as a patient
–Personnel frequently disregard rules or
guidelines that are established for the OR
Working conditions: perceived quality of
the OR`s work environment and logistical
support (staffing, equipment etc.)
–Our levels of staffing are sufficient to
handle the number of patients
–Medical equipment in the OR s here is
adequate
Stress recognition: acknowledgement of
how performance is influenced by stressors
–I am less effective at work when fatigued
–When my workload becomes excessive, my
performance is impaired
Table 1 SAQ Factor Definitions and Example Items (Sexton 2006)
1.2 Early Work Review
Safety Culture describes the way how safety is managed in the workplace, and often reflects "the
attitudes, beliefs, perceptions and values that employees share in relation to safety" (Cox and
Cox, 1991). Vincent et al. (1998) suggested that an organization's safety culture is a fundamental
factor that influences system safety.
In a project ―Improving Safety Culture and Outcomes in Healthcare‖ which is sponsored by
Agency for Healthcare Research and Quality (AHRQ) in USA from 2003 to 2007, investigators
compared climate data to statewide Patient Safety Indicator (PSI) rates, to examine the predicted
relationship between patient safety outcomes and hospital culture/climate.
Page 7
3
A few psychometric instruments have been developed to measure organizational patient safety
culture, and their superiorities and limitations have been reviewed. All the existing instruments
use Likert scales. The strengths of these tools varies, but only the Safety Attitudes Questionnaire
(SAQ) showed links to patient outcomes (Colla JB, 2005): favorable scores of the SAQ were
associated with fewer medication errors; lower ventilator associated pneumonia, fewer
bloodstream infection, and shorter intensive care unit lengths of stay (Sexton, 2006).
Furthermore, the validity and reliability of the SAQ has been documented in United States
(English version) (Sexton, 2006), United Kingdom (English version, 2006), Turkey (Turkish
version, 2010), China (Chinese version, 2010) and Norway (Norwegian version, 2008). The
original version of SAQ is English, the other language version is translating English version into
the native language of the caregivers. The SAQ has been used in different health care
organizations such as intensive care units (ICUs), operating rooms (ORs), ambulatory clinics,
pharmacies and so on.
In June 2010 the Swedish Parliament adopted a new act named the Patient Safety act (SFS
2010:659), which is focus on improving patient safety and supervision of the caregivers
performance. The act defines healthcare injury as suffering, bodily mental harm illness and
deaths which could have been avoided if adequate actions were taken with the patient s contact
with health care. In October 2010, Annika Norden-Hägg from the department of pharmacy in
Uppsala University did a research to assessing safety culture in pharmacies of Sweden. They
concluded that ―The Swedish translation of the SAQ demonstrates acceptable construct validity,
for capturing the frontline perspective of safety culture of community pharmacy stuff.‖
2. Motivation
In early study, Cronbach’s Alpha was used to determine the reliability of the instruments for
SAQ and confirmatory factor analysis (CFA) was used for its validation. In sexton’s paper (2006,
BMC Health Service Research), he stated: ―multilevel factor analyses yielded results at the
clinical area level and the respondent nested within clinical area level.‖ For our research, we not
only focus on the reliability and validity of the SAQ - Operating Room version, but also try to
find the relationships between those six factors we mentioned in section 1. Since SAQ can be
used as a base to improve the satisfaction of the working staff in hospitals, it is important to
clarify the connection between different factors.
Structural Equation Modeling (SEM) is a statistical technique for testing and estimating causal
relations using a combination of statistical data and qualitative causal assumptions (From
Wikipedia’s definition). Factor analysis and path analysis are two sources for SEM. In the last of
few decades, SEM is becoming more and more popular as an objective method and many
application of SEM can be found in social science fields. In SEM, the focus is on latent
Page 8
4
(theoretical construct) variables rather than on the observed variables which used to measure
these constructs. It allows multiple measures to be associated with a single latent variable. A
structural equation model is different from other statistical models. It chooses a structure of the
covariance matrix of the measures to substitute raw data for analyzing. There are some
advantages of SEM compared to other statistical models, for example: 1) SEM allows different
depend variables in one model. 2) SEM allows independent and dependent variables contain
measurement error. 3) It emphasis on the measurement of latent variables which is very
important for measuring the abstract concepts in social science. 4) Estimate all the parameters of
the whole model and calculate the fit index.
In the study of SAQ, none of the six dimensions (factor) can be directly measured. In SEM, they
are all latent variables. The Operating Room version of SAQ for Swedish hospital is a unique
version (57 items and personal information). In this version, there are 30 questions used to
measure the six latent variables.
3. Research Questions
As we mentioned above: Job Satisfaction, Teamwork Climate, Safety Climate, Working
Condition, Perceptions of Management and Stress Recognition are the six factors in SAQ. The
goal is to find the relationships among them. The following research questions are of interest:
1. By Wikipedia’s definition: ―Job satisfaction describes how content an individual is with
his or her job.‖ It is common sense that the happier people are within their job, the more
satisfied they are said to be. Job Satisfaction is a general description to inflect the feeling
of working stuff towards their working place. The first question is that we assume there
are relationships between Job Satisfaction and the other factors.
2. Teamwork Climate, Safety Climate, Working Condition, Perception of Management
measured the specific field in Operating Room. Since these factors are all from positive
angle to measure the Safety Attitude. The second question: Dose Job Satisfaction take
positive influences on Teamwork Climate, Safety Climate, Working Condition, and
Perceptions of Management?
3. Stress can be caused by internal or external factors to the workplace. From the definition
in Sexton research ―Stress recognition is acknowledgement of how performance is
influenced by stressors.‖ Therefore, Stress Recognition is the only factor measured from
the negative side in SAQ. Based on the above information, our third question is: Dose
Job Satisfaction influence Stress Recognition negatively?
Page 9
5
4. Data
4.1 Data Collection Our study is based on a survey of SAQ for nurses in the operating room (OR) of three Swedish
hospitals. The whole data set1 contains 237 cases with 64 questions.
In our research, unlike the other SAQ versions, the OR version of SAQ has 57 items. Only 30
out of 57 items belong to six factors (table 1). Therefore, the other 27 items are not considered in
this study. In this OR version, the items are not only answered on a five-point Likert scale as
mentioned before, they have an extra choice: ―Not applicable‖. Seven questions are relative to
demographics information.
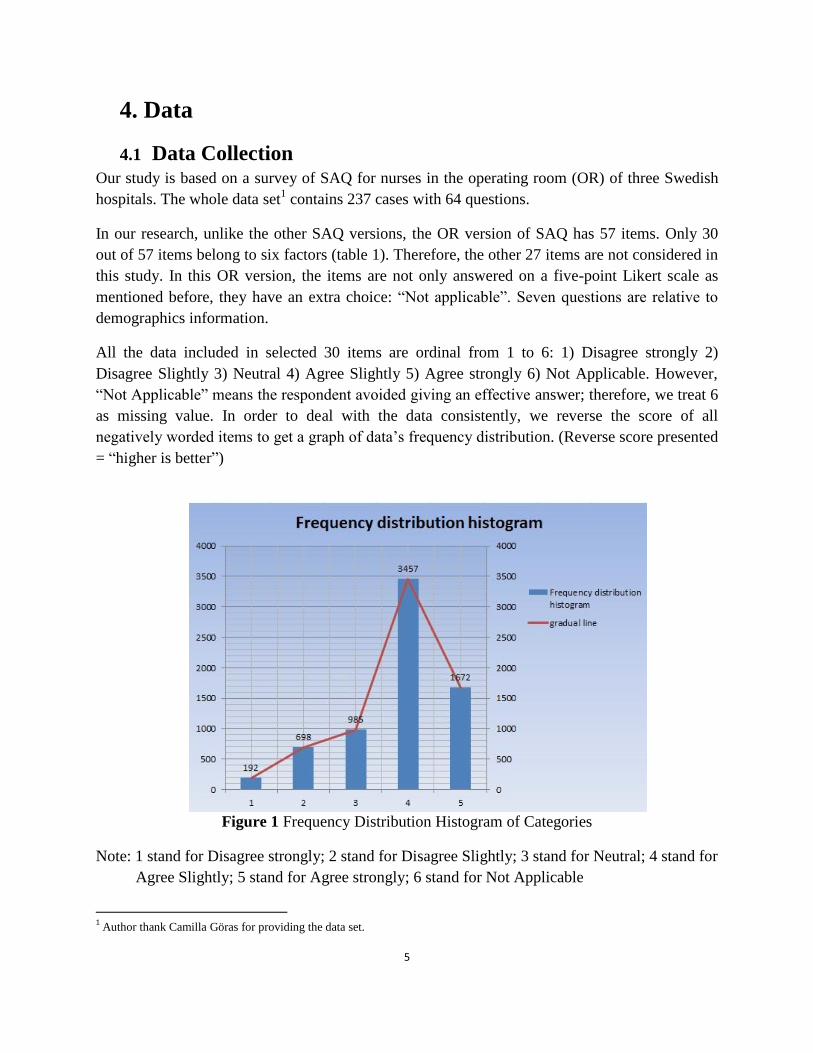
All the data included in selected 30 items are ordinal from 1 to 6: 1) Disagree strongly 2)
Disagree Slightly 3) Neutral 4) Agree Slightly 5) Agree strongly 6) Not Applicable. However,
―Not Applicable‖ means the respondent avoided giving an effective answer; therefore, we treat 6
as missing value. In order to deal with the data consistently, we reverse the score of all
negatively worded items to get a graph of data’s frequency distribution. (Reverse score presented
= ―higher is better‖)
Figure 1 Frequency Distribution Histogram of Categories
Note: 1 stand for Disagree strongly; 2 stand for Disagree Slightly; 3 stand for Neutral; 4 stand for
Agree Slightly; 5 stand for Agree strongly; 6 stand for Not Applicable
1 Author thank Camilla Göras for providing the data set.
Page 10
6
From Figure 1, we can find that people working in these OR are satisfied with the safety culture
in working place in general.
For this survey, 374 questionnaires were distributed with 237 respondents. The response rate is
about 63% which qualified to the standard. For SAQ, to ensure the validity of the data collected,
a minimum of 60% and preferably 80% response rate is necessary (From Johns Hopkins Center,
2010). The average age in three hospitals is around 46. 36 respondents don’t give their age in this
survey (see Table 2). According to the demographics questions, we can get a graph of personal
information in three hospitals.
Figure 2 Pie Chart of Sample Size of three Hospitals and the Gender Comparison Column
Falun Gävle Örebro Total
Gender 77 (4)
45 (2)
108 (1) 230 (7)
Age 59 (22)
42 (5) 100 (9) 201 (36)
Table 2 Number of Responses and Non-responses for the Hospitals
Note: Number in brackets is non-response for each variable.
From Figure 1, female takes the great part in this survey. It is common phenomenon that more
female work as nurse in hospital. Only seven stuffs don’t want or forget to tell their gender.
4.2 Variable Selection and Description As mentioned above, there are only 30 questions should be considered into our model. The
names and their abbreviation of the variables involved in the model are listed as follows :
Observed Variable:
1x : I like my job. [JS1]
2x : Working at the surgical department is like being part of a community. [JS2]
3x : This hospital is a good place to work. [JS3]
4x : I am proud to be working on this operation department. [JS4]
5x : Work morale is high here at the surgery department. [JS5]
Page 11
7
1y : Nurse’s views and proposals on patient care is well received in the operating department.
[TC1]
2y : It is different to speak up if I find problems in patient care in operating theater. [TC2]
3y : We solve differences in a proper manner in surgery department (e.g. by building on what is
best for the patient rather than who is right). [TC3]
4y : I have the support I need from other team members to care for patients. [TC4]
5y : It is easy for the staff to ask questions when there is something they do not understand. [TC5]
6y : In my workplace stuff work as a well-coordinated team. [TC6]
7y : I would feel safe if I was treated here as a patient. [SC1]
8y : Medical anomalies are dealt with properly in operating department. [SC2]
9y : I receive constructive feedback on my work. [SC3]
10y : It’s different to discuss the discrepancies at the operating theater. [SC4]
11y : I am encouraged by my colleagues to take up all the thoughts I have on patient safety. [SC5]
12y : It is easy to learn from each other’s differences in the culture that exits in the surgery
department. [SC6]
13y : I know how I should proceed to submit questions about patient safety at this operating room.
[SC7]
14y : Orientation of new employees is implemented well in operating department. [WC1]
15y : All necessary information regarding the patient is available before starting operation. [WC2]
16y : Employers handle problematic employees in a constructive way. [WC3]
17y : Trainees in my disciplines are adequately supervised. [WC4]
18y : Management supports my daily efforts. [PM1]
19y : Management does not knowingly compromise the safety of patients. [PM2]
20y : The levels of staffing in this clinical area are sufficient to handle the number of patients.
[PM3]
21y : I get adequate, timely information about events that might affect my work, from hospital
management. [PM4]
22y : Fatigue impairs my performance during emergency situation. [SR1]
23y : When my workload becomes excessive, my performance is impaired. [SR2]
Page 12
8
24y : I am less effective at work when fatigued. [SR3]
25y : I am more likely to make errors in tense or hostile situations. [SR4]
Latent Variable:
: Job Satisfaction [JS]
: Teamwork Climate [TC]
: Safety Climate [SC]
: Working Condition [WC]
: Perception of Management [PM]
: Stress Recognition [SR]
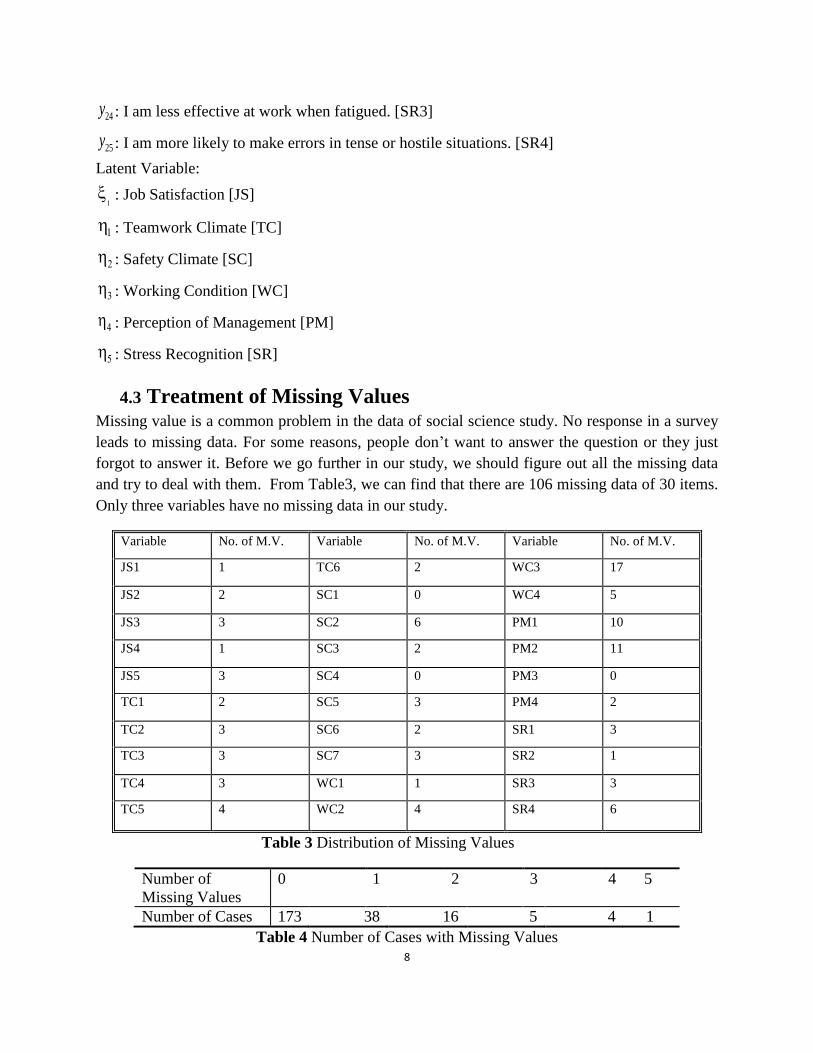
4.3 Treatment of Missing Values Missing value is a common problem in the data of social science study. No response in a survey
leads to missing data. For some reasons, people don’t want to answer the question or they just
forgot to answer it. Before we go further in our study, we should figure out all the missing data
and try to deal with them. From Table3, we can find that there are 106 missing data of 30 items.
Only three variables have no missing data in our study.
Variable No. of M.V. Variable No. of M.V. Variable No. of M.V.
JS1 1 TC6 2 WC3 17
JS2 2 SC1 0 WC4 5
JS3 3 SC2 6 PM1 10
JS4 1 SC3 2 PM2 11
JS5 3 SC4 0 PM3 0
TC1 2 SC5 3 PM4 2
TC2 3 SC6 2 SR1 3
TC3 3 SC7 3 SR2 1
TC4 3 WC1 1 SR3 3
TC5 4 WC2 4 SR4 6
Table 3 Distribution of Missing Values
Number of
Missing Values
0 1 2 3 4 5
Number of Cases 173 38 16 5 4 1
Table 4 Number of Cases with Missing Values
Page 13
9
From Table 4, it appears 173 cases have no missing values, 38 cases have 1 missing values, 16
cases have 2 missing values, 5 cases have 3 missing values, 4 cases have 4 missing values and
only one case has five missing values. There are several methods to deal with the missing values
in practice, such as Listwise Deletion, Pairwise Deletion, Multiple Imputation. In our study,
since our data set is not large, delete data might cause losing some useful information, we choose
EM algorithm to do the Multiple Imputation.
Expectation–Maximization (EM) algorithm is an iterative method for finding maximum
likelihood estimates of parameters (Robin, 1977). Using this method, we assume that our missing
values are missing at random in data set. The EM iteration alternates between expectation (E)
step and maximization (M) step. We use E step to computes the expectation of the log-likelihood
evaluated using the current estimate for the parameter θ. θ is unknown parameters in our data set.
Then we use M step to computes parameters maximizing the expected log-likelihood found on
the E step. Then assuming the estimation of parameters is correct and uses them in the next E
step. In our study, define Z is the date set contains the missing value. Z = (Z0bs|Zmis), where Z0bs
stand for observed values and Zmis denotes missing values. (Song Yang, 2011)
We let θ(t) be the current estimate of θ. The E step of EM is calculate the expect of the complete-
data log-likelihood, t stand for iteration times.
Q ( ) = ∫ (1)
The M step of EM looks for θ(t+1) by maximizing this expect of complete-data log-likelihood:
Q( ) ≥ Q( ), for all (2)
In LISREL, we do the multiple imputations easily. All missing values have been imputated. The
imputed data file is saved for the further research. Then we will test the multi-normal distribution
of these imputated data in following section.
5. Model
5.1 Model Specification As we mentioned before, some previous research on SAQ focus on the Confirmatory Factor
Analysis (CFA). In this paper, we have also extended the analysis to SEM. The procedure is, we
first adapt a CFA model to study the measurement validation and reliability. A SEM model is
used to investigate the causal relations among the latent variables.
We start with confirmatory factor analysis are measured with reliable measurements. This is the
foundation for our further study. A typical CFA model has the form
Page 14
10
xx (3)
The results show that the CFA model fits the data reasonably well. All the factor loadings are in
range between 0.17 and 0.88. This indicates that the most of measurements are reliable. The
goodness of fit measures is showing in table 5. It is clear that our CFA is reasonable, which
means all the measurements are valid. We can see the path diagram of CFA model in appendix.
Index Suggested Limit Value
χ2 As small as possible 515.16
Df 390
RMSEA < 0.08 0.037
NFI >0.90 0.96
CFI >0.90 0.99
Table 5 Goodness of Fit Indices of the CFA of the SAQ model
The SEM model for the Safety Attitude Questionnaire is set to explore the relationships between
latent variables. The SEM model including two parts: the structural model and the measurement
model. The structures of the two models are defined as follows:
Structural Model
(4)
Where:
1
2
3
4
5
, 1 ,
1
2
3
4
5
,
1
2
3
4
5
Page 15
11
11cov( ) ,
11
22
33
44
55
0 0 0 0
0 0 0 0
cov( ) 0 0 0 0
0 0 0 0
0 0 0 0
.
1 , 2 , 3 , 4 , 5 , represent the independent latent variable TC, SC, WC, PM, SR,
respectively, 1 represents the dependent latent variables JS at the same time.
For this structural model, we assume that:
1. ( ) 0, ( ) 0, ( ) 0,E E E
2. ( , ) 0.Corr
Measurement Model
xx , (5)yy
Where
1
2
3
4
5
x
x
x x
x
x
,
1
2
3
4
5
x
x
x
x
x
x
,
1
2
3
4
5
, 1 5var( ), , var( )diag .
Page 16
12
6
7
10
11
12
13
1
18
2
19
3
20
4
22
25
23
24
26
27
28
0 0 0 0
0 0 0 0
0 0 0 0
0 0 0 0
0
0
0 0 0 0
0 0 0 0
,
0 0 0 0 0
0 0 0 0
0 0 0 0
0
0 0 0
y
y
y
y
y
y
y
y
y
y
y
y
y
y
y
y
y
y
y
y y
y
1
2
3
4
25
30
,
0
0 0 0 0 y
1 2 25var , var , , vardiag .
The latent variables are unobserved. They have no origin and scale of measurement. In order to
scale the latent variables, we choose the first observed variable of each latent variable as the
reference variable namely: 1 6 12 19 23 271, 1x y y y y y .
For the measurement model, we assume that:
1. 0, 0, 0, 0,E E E E
2. ( , ) 0, ( , ) 0, ( , ) 0,Corr Corr Corr
3. ( , ) 0, ( , ) 0.Corr Corr
To sum up the free parameters in the model,
Page 17
13
' [ , , , , , ].x y
The path diagram of our SAQ model is shown in figure 3:
Figure 3 Path Diagram of SAQ model
Page 18
14
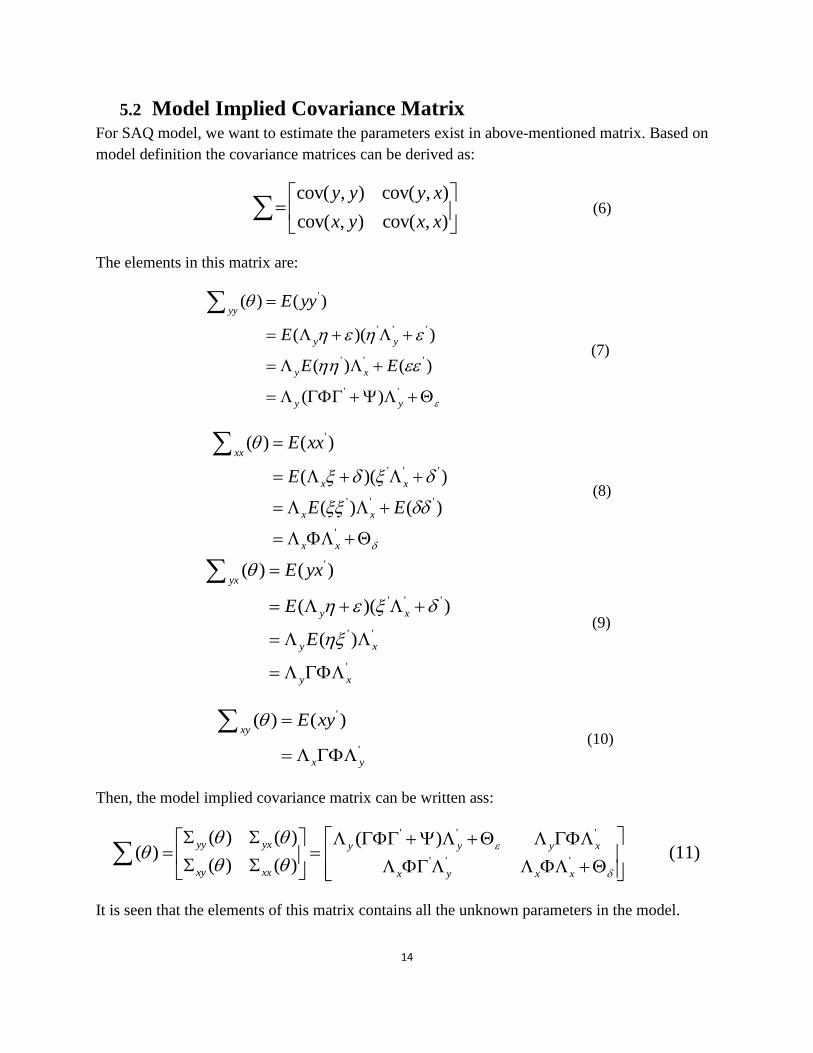
5.2 Model Implied Covariance Matrix For SAQ model, we want to estimate the parameters exist in above-mentioned matrix. Based on
model definition the covariance matrices can be derived as:
cov( , ) cov( , )
cov( , ) cov( , )
y y y x
x y x x
(6)
The elements in this matrix are:
'
' ' '
' ' '
' '
( ) ( )
( )( )
( ) ( )
( )
yy
y y
y x
y y
E yy
E
E E
(7)
'
' ' '
' ' '
'
( ) ( )
( )( )
( ) ( )
xx
x x
x x
x x
E xx
E
E E
(8)
'
' ' '
' '
'
( ) ( )
( )( )
( )
yx
y x
y x
y x
E yx
E
E
(9)
'
'
( ) ( )xy
x y
E xy
(10)
Then, the model implied covariance matrix can be written ass:
' ' '
' ' '
( ) ( ) ( )( ) (11)
( ) ( )
yy yx y y y x
xy xx x y x x
It is seen that the elements of this matrix contains all the unknown parameters in the model.
Page 19
15
5.3 Model Identification In order to estimate the parameters model, the model should be identified. To judge the
identification of a model, there are several rules we can follow: t-Rule, Two-step Rule, Recursive
Rule, Order and Rank Conditions. In our study, we choose t-Rule.
: (1/ 2)( )( 1). (12)T rule t p q p q
Identification is demonstrated by showing the unknown parameters are functions only of
identified parameters and these functions lead to unique solutions. More specifically, Suppose
is known. The identification problem is whether is uniquely determined from . If all
parameters in are identified, we say that the model is identified. Let p and q be the number of
y-variables and x-variables respectively, let t be the number of free parameter in .
In our model, p is 25, q is 5 and t is 75. It is satisfied with t-Rule, so our model is identified.
Model identification is a complex problem in SEM. Many scholars explored into this field and
tried to find a uniform method to identify a model in general way. However, there is no
consensus now. Different reasons caused the model not satisfied with identification. When we
use LISREL to analyze, if the model cannot be fitted, we would back to see why it is not
identified.
5.4 Model Estimation
5.4.1 Maximum Likelihood (ML)
After we assure the identification of our model, we should estimate the unknown parameters in
the model. The basis hypothesis for the model estimation is:
( ) (13)
However, we can’t get the implied covariance matrix in real case so the sample covariance
matrix S is treated as the estimation of it. ( ) is based on the different parameter. Our purpose
is minimizing the difference between ( ) and S. We define a fit function F(S, ( ) ) to
measure the difference between ( ) and S. Parameter estimation is finding a solution for , to
minimize the fit function:
1log | ( ) | [ ( )] log | | ( ) (14)MLF tr S S p q
ML method is for estimation in this study. It assumes that the observed variables have multi-
normal distribution. Our data are ordinal, and these data with many categories, such as 5-point
Likert-type scales of agreement, are usually treated as ―continuous.‖ If they are non-normal, then
Page 20
16
data analytic techniques for non-normal continuous variables should be used. (Newsom, SEM,
2005) In our study, we checked the normality of all the observed variables (see Figure 4), if P-
Value > 0.05, the variable has normal distribution. It is clear that not all of the observed variables
satisfied with normal distribution. As seen in Figure 4, 23 observed variables satisfied with
normal distribution. Therefore, even ML is widely used in SEM, it is not suitable for our study.
If we adapt the ML estimation, the standard errors and chi squares will be wrongly estimated.
Therefore we should find another method to estimate the parameters
Figure4 Test of Univariate Normality for Observed Variables
5.4.2 Robust Maximum Likelihood (RML)
To adjust the estimation to non-normality, RML can be employed. Browne (1987) formulated a
Robust Maximum Likelihood (RML) method for related models. This method is available in
LISREL, the associated formula is provided in Jöreskog et al (2001). To implement this method,
Page 21
17
we need to calculate the Asymptotic Covariance Matrix (ACM) of the sample variance and
covariance.
The RML fit function is as:
-1 -1
ML (15)ˆ ˆF = (s -σ) D (Σ Σ )D(s -σ)
Where s is a vector of order s 1 consists of which are non-duplicated elements in S, D is the
duplication matrix which transfer s to vec(S), stands for Kronecker product. This equation
could be explained as Maximum Likelihood estimated by means of iteratively reweighted least
squares in which is updated in each iteration. Both of these fit functions have a minimum at the
same point in the parameter space, so called ML estimates. However, the minimum value of the
functions is not the same.
6. Results
6.1 Model Assessment
Assessment of fit is a basic part in SEM, forming the basis for accepting or rejecting models,
more usual speaking; it is about accepting one competing model over another. The output of
LISREL includes matrices of the estimated relationships between variables in the model.
Assessment of fit essentially calculates how similar the predicted data are to matrices containing
the relationships in the actual data.
Formal statistical tests and fit indices have been developed for these purposes. Individual
parameters of the model can also be examined within the estimated model in order to see how
well the proposed model fits the data and theory.
The most common goodness of fit indices is RMSEA (Root Mean Square Error of
Approximation). From the definition,
RMSEA =
2
max( ,0)1
x df
N
df
, (16)
If RESEA > 0.8, we will not consider the model fits the data at all, if 0.05<RESEA <0.08, the
result is acceptable and reasonable, if RESEA<0.05, the model indicates a good fit.
There are also other indices could be considered to access SEM
Chi-square:2 1 1ˆ ˆ ( 1)( ) ( ) ( )c c c c
dN s V s
h , (17)
Page 22
18
Where d is the degree of freedom, 1 1[( ) ( )]c c c ch tr V W , here c is an orthogonal
complement to such that 0c , and / . 1 1 1ˆ ˆ2( ) ( ) ( )V D D D D D D and
W is the weight matrix under the non-normal condition which will compute by LISREL if we got
the asymptotic covariance matrix. (Yang-Wallentin, 2010 )
Normed Fit Index: NFI 1 i
F
F , (18)
Where, F is the minimum value of the fit function for the estimated model.
Comparative Fit Index: CFA=1 , (19)i
Where, max( ,0)nF df , max( , ,0)i i inF df nF df
As we discussed in Section 5, the model fits the data reasonably is a basement for analysis of
structural model. Therefore, we explore the relationship between the six factors using structural
model. In the full model we hypothesis Job Satisfaction could influence other five factors, and
the hypothesis of the model is ( ) = Σ θ Σ . RML method is used to estimate unknown parameters
in the model.
Index Suggested Limit Value
χ2 As small as possible 573.88
Df 400
RMSEA < 0.08 0.055
NFI >0.90 0.96
CFI >0.90 0.99
Table 6 Goodness of Fit Indices of the Initial Model
We check the significant of all parameters and find there is one path of the structural model is
non-significant. From Table 6, RMSEA = 0.055, which means our model is reasonable but not
good. Therefore, we could improve the initial model.
Page 23
19
6.2 Model Modification
From the output of LISREL, we find a suggestion that a few error correlations should be set free.
Adding these correlations could have impact on the model improvement. Error correlation is as
an unanalyzed association, which means that the specific nature of the shared "something" is
unknown. Correlated error terms in measurement models represent the hypothesis that the unique
variances of the associated indicators overlap; that means, they measure something in common
other than the latent constructs that are represented in the model. The variables have related
errors are:
―SC6‖ and ―SC4‖, ―WC1‖ and ―SC1‖, ―WC2‖ and ―SC2‖, ―PM3‖ and ―TC6‖, ―JS2‖ and ―JS1‖,
―JS3‖ and ―JS1‖, ―JS4‖ and ―JS1‖, ―JS4‖ and ―JS3‖.
Back to the SAQ, those pairs indeed have relationships in reality SC4 and SC6 reflect a same
problem that whether atmosphere of discussion is free in Operating Room, SC4 is from the
negative side otherwise SC6 is from the positive. SC2 and WC2 have strong causal relationship.
If all the necessary information for diagnostic and therapeutic decisions is routinely available to
working stuff (WC2), the medical errors would be handled appropriately in this clinical area. For
SC1 and WC1, there is also causal relationship between them. As a work stuff in an operating
room, if he/she find trainees are not adequately supervised, he/she would not feel safe being
treated as a patient. TC6 is a description that the physicians and nurses here work together like as
a well-coordinated team, and it leads to the levels of staffing in this clinical area are sufficient to
handle the number of patient (PM3).
The rest pairs all belong to Job Satisfaction. JS1 has relationships with JS2, JS3 and JS4, JS4 has
connection with JS3. JS1: I like my job. JS2, JS3, JS4 explain why I like my job sufficiently. For
JS4, I am proud to be working on this operation department is the result according to JS3.
6.3 Results of Modified Model
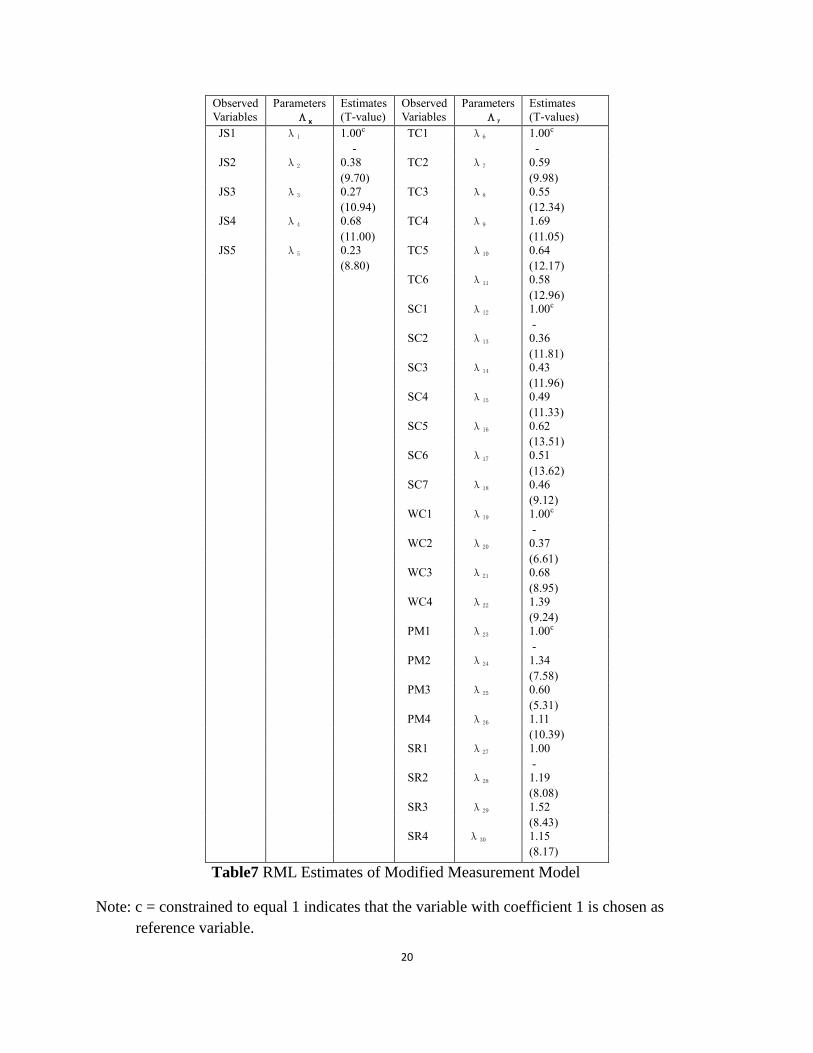
From Table 7, we can find that all the coefficients in our model with the absolute value of T > 2
which means all the coefficients are significant. All the estimated parameters and T values for
measurement model are listed in Table7.
Page 24
20
Observed
Variables
Parameters
Λx
Estimates
(T-value)
Observed
Variables
Parameters
Λy
Estimates
(T-values)
JS1 λ1 1.00c TC1 λ6 1.00c
- -
JS2 λ2 0.38 TC2 λ7 0.59
(9.70) (9.98)
JS3 λ3 0.27 TC3 λ8 0.55
(10.94) (12.34)
JS4 λ4 0.68 TC4 λ9 1.69
(11.00) (11.05)
JS5 λ5 0.23 TC5 λ10 0.64
(8.80) (12.17)
TC6 λ11 0.58
(12.96)
SC1 λ12 1.00c
-
SC2 λ13 0.36
(11.81)
SC3 λ14 0.43
(11.96)
SC4 λ15 0.49
(11.33)
SC5 λ16 0.62
(13.51)
SC6 λ17 0.51
(13.62)
SC7 λ18 0.46
(9.12)
WC1 λ19 1.00c
-
WC2 λ20 0.37
(6.61)
WC3 λ21 0.68
(8.95)
WC4 λ22 1.39
(9.24)
PM1 λ23 1.00c
-
PM2 λ24 1.34
(7.58)
PM3 λ25 0.60
(5.31)
PM4 λ26 1.11
(10.39)
SR1 λ27 1.00
-
SR2 λ28 1.19
(8.08)
SR3 λ29 1.52
(8.43)
SR4 λ30 1.15
(8.17)
Table7 RML Estimates of Modified Measurement Model
Note: c = constrained to equal 1 indicates that the variable with coefficient 1 is chosen as
reference variable.
Page 25
21
For Job Satisfaction, JS4 was the most significants, then JS2, JS3, JS5, JS1.
For Teamwork Climate, TC4 is much more effective than other measurements.
For Safety Climate, SC1 to SC6 value the largest influence. SC7 is less effective comparatively.
For Working Condition, WC1 is most effective. So people think orientation of new employees in
operating department is an important index to measure the Working Condition. WC4, WC2,
WC3 follows.
For Perception of Management, PM1 has the largest impact on PM. PM4, PM2, PM3 follows.
For Stress Recognition, SR3 is most influence, when the working stuffs feel less effective at
work when they fatigued, they may more recognize the Stress. The following measurements are
SR2, SR4 and SR1.
JS
TC 0.49
(T - value) (8.13)
SC 0.62
(T - value) (8.04)
WC 0.36
(T - value) (7.84)
PM 0.24
(T - value) (7.34)
SR -0.036
(T - value) (-1.35)
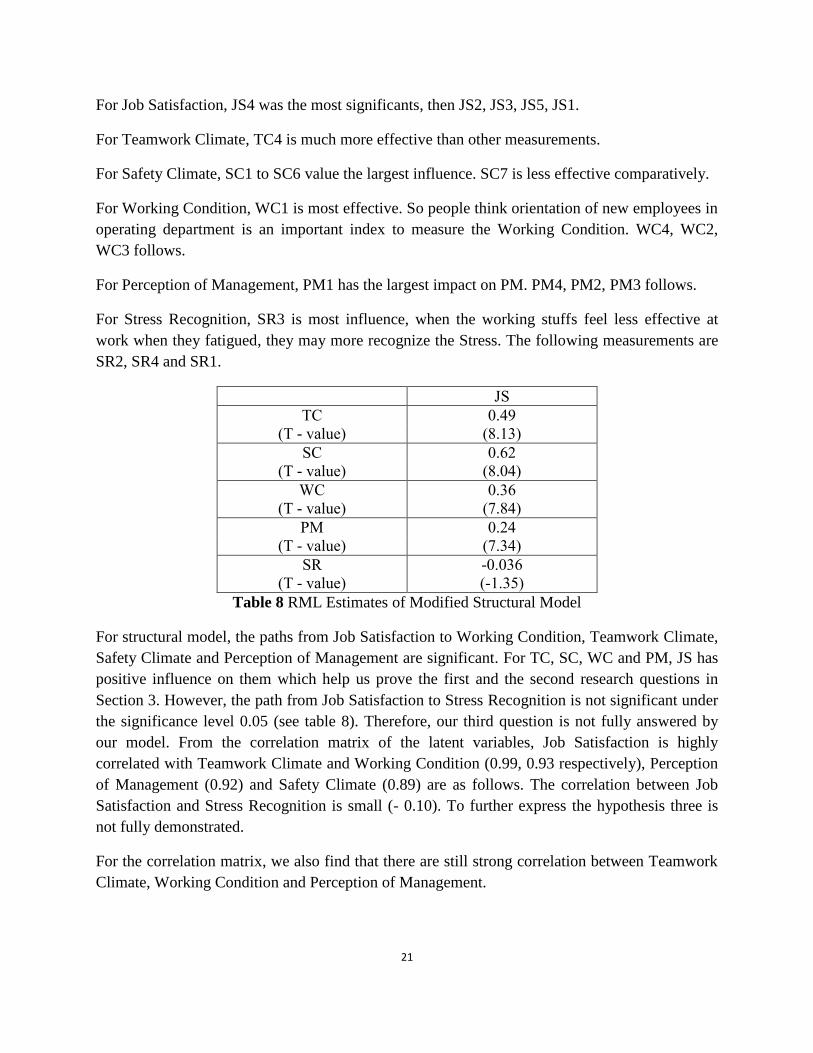
Table 8 RML Estimates of Modified Structural Model
For structural model, the paths from Job Satisfaction to Working Condition, Teamwork Climate,
Safety Climate and Perception of Management are significant. For TC, SC, WC and PM, JS has
positive influence on them which help us prove the first and the second research questions in
Section 3. However, the path from Job Satisfaction to Stress Recognition is not significant under
the significance level 0.05 (see table 8). Therefore, our third question is not fully answered by
our model. From the correlation matrix of the latent variables, Job Satisfaction is highly
correlated with Teamwork Climate and Working Condition (0.99, 0.93 respectively), Perception
of Management (0.92) and Safety Climate (0.89) are as follows. The correlation between Job
Satisfaction and Stress Recognition is small (- 0.10). To further express the hypothesis three is
not fully demonstrated.
For the correlation matrix, we also find that there are still strong correlation between Teamwork
Climate, Working Condition and Perception of Management.
Page 26
22
Figure 5 Correlation Matrix of Latent Variables
Index Suggested Limit Value
χ2 As small as possible 498.86
Df 392
RMSEA < 0.08 0.034
NFI >0.90 0.96
CFI >0.90 0.99
Table 9 Goodness of Fit Indices of the Modified Full Model of SAQ
From Table 9, we can find the modified model is better than the intimal one. The chi-square is
much smaller; RMSEA is 0.034 which means the model is pretty good. GFI, NFI and CFI are all
increased in the new model.
7. Conclusion Based on the result of SEM model we discussed above, we find some conclusions. Firstly, all the
measurements within SAQ—operating room version are valid and reliable. Secondly, Job
Satisfaction is strongly associated with Teamwork Climate, Safety Climate, Working Conditions
and Perception of Management but less associated with Stress Recognition.
For our model, RMSEA, NFI, CFI are almost satisfied with the critical values from Table 9,
although the measurement models are reasonable, the structural model does not fit the data very
well. There is one main coefficient not significant (from JS to SR). There are some possible
reasons as follows:
1. The sample size is small. Although our research is based on 283 respondents, compared to
empirical study, it is not enough. With larger sample set, we may reach more satisfactory
results.
Page 27
23
2. Our model is under the hypothesis that Job Satisfaction could influence the other five factors.
Since social phenomenon are complex and resulted in many uncertain elements and SAQ is
not perfect enough and safety culture is a complex concept, other variables such as staff
turnover, length of stay should be considered. What’s more there are only 30 items scaled the
latent variables in SAQ, even these factor loadings are reliable, some of them might not
explain the latent variable sufficiently.
From our study, the Operating Room version of SAQ is a valid and reliable instrument for
measuring the safety attitudes of working stuff in Sweden. Identifying factors influencing the
safety culture in Operating Room is vital, since it can be supportive when making decisions to
improve the safety climate at Operating Room. In our model, Job Satisfaction is a very important
factor in this questionnaire, it take positive influence on Teamwork Climate, Working Condition,
Safety Climate, Perception of Management. However, it seems not work on Stress Recognition.
According to the feedback of the questionnaire, the SAQ of Operating Room has not fully
developed and there is still considerable room for improvement. Some of the items need to be
redesigned which is another future work for this paper.
Page 28
24
References Annika Norden-Hägg, J B. Sexton, et al. Assessing Safety Culture in Pharmacies: The
psychometric validation of the Safety Attitudes Questionnaire (SAQ) in a national sample of
community pharmacies in Sweden. BMC Clinical Pharmacology 2010, 10:8
Bollen, K.A. (1989). Structural Equations with Latent Variables. New York: Wiley.
Browne, M.W. (1984). Asymptotically distribution-free methods for the analysis of covariance
structures. British Journal of Mathematical & Statistical Psychology, 37:62-63
Camilla Göras. Swedish translation, cultural adaption and psychometric testing of the Safety
Attitudes Questionnaire
Colla JB, Bracken AC, Kinney LM, Weeks WB. Measuring patient safety climate: a review of
surveys. Qual Saf Health Care. 2005;14:364–6. doi: 10.1136/qshc.2005.014217.
Deikås E, Hofoss D: Psychometric properties of the Norwegian version of the Safety Attitudes
Questionnaire (SAQ), Generic version (short form 2006). BMC Health Services Research 2008,
8:191
Fan Yang-Wallentin et al. Confirmatory Factor Analysis of Ordinal Variables with Misspecified
Models. Structural Equation Modeling, 17:392-423, 2010
Frankel A, Neppl C. et al. Patient safety leadership walkrounds. Jt Comm J Qual Saf 2003;
29:16-26.
Hutchinson A, Cooper KL, et al.: Use of a safety climate questionnaire in UK health care: factor
structure, reliability and usability. Qual Saf Health Care 2006, 15:347-53
Jöreskog, K.G and Sörbom, D.(1996a). LISREL 8: User’s Reference Guild. Chicago: Scientific
Software International.
Jöreskog, K.G and Sörbom, D., du Toit, S. et al. (2003) LISREL 8: New Statistical Features.
Chicago: Scientific Software International.
Jöreskog, K.G. Structural Equation Modeling with Ordinal Variables Using LISREL. Scientific
Software International, Inc. (SSI), 26 April 2002
Marsh HW, Balla JR, McDonald RP: Goodness-of-fit indexes in confirmatory factor analysis:
The effect of sample size. Psychological Bulletin 1988,103:391-410
Maruyama,G. Basics of Structural Equation Modeling. Sage Publication Inc, 1998
Meng,X.L. and Pedlow,S. (1992). EM: A bibliographic review with missing articles. Proc.
Statistical Computing Section, American Statistical Association, 86:899-909
Page 29
25
Modak I, Sexton B, Lux T, et al. Measuring safety culture in the ambulatory setting: the safety
attitudes questionnaire ambulatory version. Journal of perinatology 2006, 26:463-470
P. Daniel Patterson, David T. Huang, et al. The Emergency Medical Services Safety Attitudes
Questionnaire. American Journal of Medical Quality, 2010 25:109
Peter J.Pronovost, Sean M. Berenholtz, et al. Improving patient safety in intensive care units in
Michigan. Journal of Critical Care (2008) 23, 207-221
Raftery, A. E. Statistics in Sociological, 1950-2000: A Selective Review. Sociological
Methodology. 2001, 31:1-45
Rothenberg, T.J. Identification in Parametric Models. Econometrica. 1971, 39 (3): 577-591
Sexton JB, Paine LA, et al.: A Culture check-up for safety in ―My patient cara area‖. Joint
Commission Journal on Quality and Patient Safety 2007, 33(11):699-703
Sexton JB, Thomas EJ. The Safety Attitude Questionnaire (SAQ) Guildlines for Administration.
Technical Report 03-02. The University of Texas Centre of Excellence for Patient Safety
Research and Practice, June 11 2003.
Sexton JB, Helreich RL, Neillands TB, et al. The Safety Attitude Questionnaire: psychometric
properties, benchmarking data, and emerging research. BMC Health Serv Res 2006;6:44
Sidika Kaya, Serkan Barsbay, Erdem Karabulut. The Turkish Version of the safety attitude
questionnaire: psychometric properties and baseline data. Qual Saf Health Care 2010; 19:572-
577
Song Yang. A Livable City Study in China Using Structural Equation Models. Master Thesis in
Uppsala University June 2011
Vincent C, Taylor-Adams S, Stanhope N. Framework for analyzing risk and safety in clinical
medicine. BMJ. 1998;316:1154–7
Wang Weidong. Theory and Application of Structural Equation Model. Renmin University of
China Press. ISBN: 978-7-300-10602-1
Wui-Chiang Lee, Hwei-Ying Wung, et al. Hospital Safety Culture in Taiwan: A Nationwide
Survey Using Chinese Version Safety Attitude Questionnaire. BMC Health Serv Res 2010,
10:234
Practical Approaches to Dealing with Non-normal and Categorical Variables, Newsom SEM
Winter 2005
Page 30
26
Appendix
Estimating and Testing a CFA Model on SAQ
Observed Variables: JS1 JS2 JS3 JS4 JS5 TC1
TC2 TC3 TC4 TC5 TC6 SC1
SC2 SC3 SC4 SC5 SC6 SC7
WC1 WC2 WC3 WC4 PM1 PM2
PM3 PM4 SR1 SR2 SR3 SR4
Covariance Matrix from File 0515.cov
Asymptotic Covariance Matrix from File 0515.acm
Sample Size: 237
Latent Variables: JS TC SC WC PM SR
Relationships:
JS1 = 1*JS
JS2 JS3 JS4 JS5 = JS
TC1 = 1*TC
TC2 TC3 TC4 TC5 TC6 = TC
SC1 = 1*SC
SC2 SC3 SC4 SC5 SC6 SC7 = SC
WC1 = 1*WC
WC2 WC3 WC4 = WC
PM1 = 1*PM
PM2 PM3 PM4 = PM
SR1 = 1*SR
SR2 SR3 SR4 = SR
Options: AD=OFF SS
Method: Robust Maximum Likelihood
Page 31
27
Path Diagram
End of Problem
Estimating and Testing modified a Full Model on SAQ
Observed Variables: JS1 JS2 JS3 JS4 JS5 TC1
TC2 TC3 TC4 TC5 TC6 SC1
SC2 SC3 SC4 SC5 SC6 SC7
WC1 WC2 WC3 WC4 PM1 PM2
PM3 PM4 SR1 SR2 SR3 SR4
Covariance Matrix from File 0515.cov
Asymptotic Covariance Matrix from File 0515.acm
Sample Size: 237
Latent Variables: JS TC SC WC PM SR
Relationships:
JS1 = 1*JS
JS2 JS3 JS4 JS5 = JS
TC1 = 1*TC
TC2 TC3 TC4 TC5 TC6 = TC
SC1 = 1*SC
SC2 SC3 SC4 SC5 SC6 SC7 = SC
WC1 = 1*WC
WC2 WC3 WC4 = WC
PM1 = 1*PM
PM2 PM3 PM4 = PM
SR1 = 1*SR
SR2 SR3 SR4 = SR
TC SC WC PM SR = JS
Page 32
28
set the error of covariance of SC6 and SC4 free
set the error of covariance of WC1 and SC1 free
set the error of covariance of WC2 and SC2 free
set the error of covariance of PM3 and TC6 free
set the error of covariance of JS2 and JS1 free
set the error of covariance of JS3 and JS1 free
set the error of covariance of JS4 and JS1 free
set the error of covariance of JS4 and JS3 free
Options: AD=OFF SS
Method: Robust Maximum Likelihood
Path Diagram
End of Problem
Page 33
29
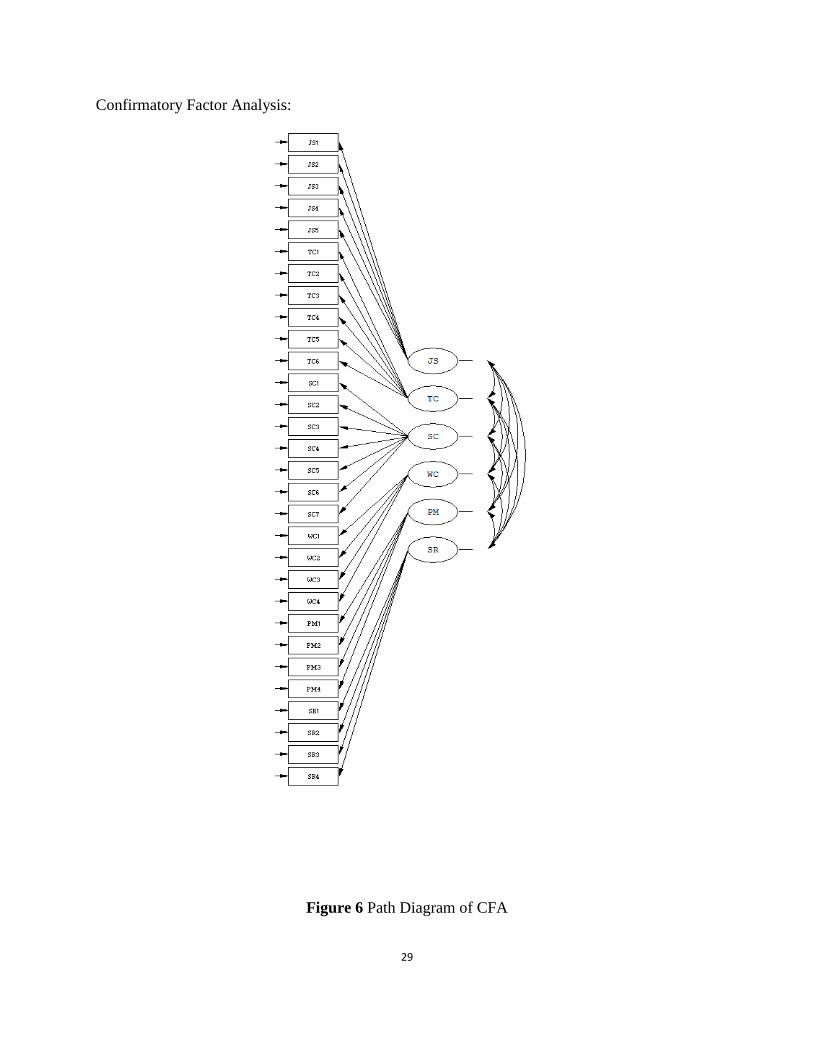
Confirmatory Factor Analysis:
Figure 6 Path Diagram of CFA