he concept of adaptive optics was suggested in theid 1950s for high-resolution imaging through the
tmosphere in astronomy. The classic adaptive op-ics system uses a wave-front sensor to measure ran-om phase deformations induced by a distortingedium and a wave-front corrector to compensate for
he deformations in real time.1,2 During the pastecade, owing to the development of low-cost compo-ents this technology has been successfully imple-ented in a number of industrial and medical
pplications.3 One type of such component is liquid-rystal �LC� phase modulators, a low-cost alternativeo the segmented and deformable mirrors that areraditionally used as wave-front correctors.
The operation of LC phase modulators is based onchange in the birefringence of a thin LC layer undern applied electric field. The use of a pixelatedtructure of actuators permits a pistonlike phase cor-ection to be made that is similar to that of a piston-ype segmented mirror. Piston LC devices based ontandard nematic4 or dual-frequency LCs with im-
M. Loktev �[email protected]� and G. Vdovin are with thelectronic Instrumentation Laboratory, Delft University of Tech-ology, Mekelweg 4, P.O. Box 5031, 2600 GA Delft, The Nether-
ands. I. Guralnik is with the Department of Physics, Samaratate University, Ac. Pavlova 1, 443011 Samara, Russia.Received 4 September 2003; revised manuscript received 20 Jan-
roved dynamic characteristics are commerciallyvailable.5 Several adaptive optical systems basedn LC modulators have been reported.5–7
It is a well-known fact that modal wave-front cor-ectors, such as deformable mirrors with continuousace plates, provide much better correction qualityhan piston correctors with the same number of ac-uators.8 An ingenious way to implement modalontrol in a multichannel LC corrector was suggestedy Naumov9 and by Naumov and Vdovin.10 A spe-ial resistive layer was introduced into the design ofhe LC phase modulator to provide spatially contin-ous phase modulation. Based on this principle, 37-hannel LC modal wave-front correctors �MWCs� of0- and 70-mm diameter were manufactured and ex-erimentally investigated.11
A LC MWC is controlled by a set of ac voltagespplied to the control contacts. Each of the drivingoltages is characterized by several parameters,amely, amplitude, frequency, phase, and harmonictructure of the wave. It was shown11 that variationf any of these parameters for a given contacthanges either the electro-optic response of the con-act or the result of its interaction with neighboringontacts.
Thus the LC MWC is unique among modal correc-ors in that it can be operated with several degrees ofreedom per actuator. On the one hand, this is anmportant advantage because it allows more flexibil-ty in the control of the device. On the other hand,he nonlinear dependency of the corrector’s electro-ptical response on the control signal’s parametersnd the large number of these parameters turn the
evelopment of an effective control algorithm intouite a challenge. In particular, it is necessary tonow which set of control parameters provides theaximum flexibility of the device and the best cor-
ection quality.The effect of amplitude and frequency of the control
ignal on a single contact response was studied therevious experiments of the present authors and oth-rs.11 In this paper we pay special attention to thenterference of various contact responses and the for-
ation of required phase shapes by use of additionalontrol of frequencies and phase shifts. We empha-ize two important kinds of control, i.e., single-requency control �SFC�, which means that allontacts are driven with ac voltages of the same fre-uency, and frequency-multiplexed control �FMC�,or which all working frequencies are different forifferent contacts, and we study the two kinds ofontrol in detail. The influence of the control unit’sesistance was studied for both cases. Our investi-ation was based mostly on an analytic approach andumerical simulation, but major theoretical conclu-ions have been verified experimentally.In Section 2 we describe the operation of the LCWC and introduce the basic equations, assump-
ions, and terms that we use throughout the paper.ection 3 is dedicated to a discussion of contact influ-nce functions �CIFs� and their dependence on pa-ameters of the driving signal and resistance of theontrol unit; it also contains analytical expressionsor CIFs, a description of the numerical procedure forheir calculation, and experimental results. The in-estigation of two techniques of SFC—amplitude-nly control and simultaneous control of voltagemplitudes and phase shifts—and their use for ap-roximation of phase aberrations expressed by therst Zernike polynomials is presented in Section 4.n analysis of FMC with emphasis on cross-channel
nterference and the restriction on driving voltageshat results from it is given in Section 5; the appli-ability of FMC for correction of phase aberration islso studied there. The generalization of the resultsbtained for SFC in the case of a nonharmonic controlignal is discussed in Section 6. Finally, we drawonclusions in Section 7.
. General Formulation of the Problem
modal LC device can be implemented by the intro-uction of a high-resistance layer into the design of atandard sandwich-type LC cell �Fig. 1�a��. Thisayer plays an essential part in the formation of theocal voltage profile that controls the phase distribu-ion across the corrector’s aperture. We refer to thisayer as the control electrode �CE�. The corrector isriven by ac voltages applied through a set of point-ike contacts connected to a CE, which ensures amooth voltage variation across the aperture. Theielectric mirror covers the high-resistance electrode,mproving the LC corrector’s reflectivity. The LCayer is sandwiched between the dielectric mirror andtransparent low-resistance electrode made from in-ium tin oxide �ITO�, which is placed on the top sub-
trate. Aligning coatings deposited on the dielectricirror and the ITO electrode determine the initialomogeneous alignment of the LC molecules. TheC layer’s thickness is preset by calibrated dielectricpacers. Because of the electro-optic S effect �re-lignment of LC molecules under the influence ofpplied voltage�, a distributed electric potential in-uces variation of birefringence of the LC layer acrosshe aperture.
The modal control is accomplished because of theesistivity of the CE and the conductive and reactiveroperties of the LC layer. A mathematical model ofhe LC MWC is based on a function u�r, t� that rep-esents the potential difference between a given pointn the CE, described by position vector r in the ap-rture plane, and any point of the ITO layer. Volt-ge distribution u�r, t� satisfies the time-dependentquation that was derived in the theory of LC lens-s12:
�2u�r, t� � �c�u�r, t�
�t� �gu�r, t�, (1)
here �2 is the Laplacian acting on the coordinates ofector r, � is the sheet resistance �sometimes calledhe surface resistance� of the control electrode, and cnd g denote the capacitance and the conductance ofhe LC layer per unit area, respectively.
Then parameters c and g depend on the orientationf the LC director with respect to the electrodes; thushey change with the magnitude and frequency of thepplied voltage. Several mechanisms, including thereedericksz transition, conduction of ionic impurities,
ig. 1. �a� Cross section and �b� contacts layout of the LC MWC.
aofcftecafp
ut
wrcktoute
tcdliatrthmtb
wctc
witEf
�Es
wtsd
trtpkvsucuaCettbmdtsao
�ste�gtu
Fc
nd Debye relaxation, are involved in the reorientationf the LC director.13,14 As a result, both voltage andrequency dependencies of c and g are quite compli-ated. This makes use of Eq. �1� extremely difficultor any theoretical analysis except numerical simula-ions. Fortunately, in the frequency range from sev-ral tens of hertz to�1 kHz both c and g remain almostonstant with frequency variation.13 Though c and gre still voltage dependent, this property is a goodoundation for the so-called constant-impedance ap-roximation �see below�.In the case of purely harmonic voltage u�r, t� �r�exp�it�, the distribution of the complex ampli-ude of the voltage is described by the equation
�2u�r� � �2u�r�, (2)
here �2 ��g�� � ic� is the so-called modal pa-ameter that is inherent in a theory of a modal LCorrector of any type. Mathematically, Eq. �2� isnown as a Helmholtz equation, and the inverse ofhe modal parameter is the characteristic lengthf the spatial nonuniformity of u�r�. For high val-es of � the voltage is tightly localized about con-acts. In the opposite case of small �, the voltagexpands far into interstitial regions.The influence of the contact voltages on distribu-
ion u�r, t� is accounted for through the boundaryondition formulated for each of the contacts. Toetermine the boundary condition for the kth contact,et us consider an equivalent electric circuit, whichncludes both the corrector and the control unit �CU�,s shown in Fig. 2. Previously11 we assumed the CUo be a voltage source, thus neglecting its output se-ies resistance; the present model is designed to takehis parameter into account. According to Kirch-off ’s rule, the voltage at the kth contact is deter-ined by the CU’s output series resistance, R, and by
he value of electromotive force �EMF� εk generatedy the CU:
u�r, t�L � εk � Ik R, (3)
ig. 2. Equivalent electrical circuits of the LC MWC and theontrol unit.
k
here Ik is the current through the kth contact thatan be obtained by integration of surface currents inhe CE about the contour Lk surrounding the kthontact, as shown in the inset of Fig. 1�b�:
Ik � �Lk
�i, Nk�dl � 1� �
Lk
��u�r, t�, Nk�dl,
(4)
here i is the density of surface current in the CE, Nks the outer normal vector to the contour Lk, and � ishe gradient along the aperture plane. Combiningqs. �3� and �4�, we arrive at the boundary condition
or the voltage in the general form
u�r, t��Lk�
R� �
Lk
��u�r, t�, Nk�dl� � εk,
k � 1 . . . N. (5)
MFs εk in a general case can be written as sums ofeveral harmonics of independent frequencies �:
εk�t� ���1
M
Ek� exp�i�t�, (6)
here Ek� is the amplitude of the �th harmonic onhe kth contact. Here and below, we use Latin sub-cripts to denote contacts and Greek subscripts toenote harmonics.To facilitate interpretation it is useful to introduce
wo parameters. The first one, Zc, is equal to theatio of the voltage on the kth contact to the currenthrough the contact when other contacts are un-lugged. It can be called contact impedance for theth contact. Ratio Zc��Zc � R� characterizes theoltage drop on the contact relative to EMF εk. Theecond parameter is the intercontact impedance Zic
kl�Ikl, where Ikl is the current between two adjacentontacts �the kth and the lth contacts� when voltagekl is applied between them, whereas other contactsnd the ground electrodes are not connected to theU. The ratio R�Zic will determine the interinflu-nce of these two contacts. Both Zc and Zic are func-ions of parameters �, c, and g; they also depend onhe size and the geometry of the modulator and cane evaluated in the framework of our numericalodel. Strictly speaking, the two parameters are
ifferent for each contact and for each pair of con-acts; however, for qualitative evaluation we can as-ume that Zc is determined for the central contact;nd Zic, for two adjacent contacts in the central partf the aperture.We can highlight two extreme cases to simplify Eq.
5�. These cases are also important for practical rea-ons. When R is much less than both Zc and Zic,hen uk � εk and the CU operates as a voltage gen-rator; this case is the more important one. When R� Zc and R �� Zic, the CU operates as a currentenerator, εk is proportional to the current flowinghrough the contact, and uk �� εk. Thus, high val-es of R require much higher values of the genera-
or’s EMF to produce sufficient contact voltage.espite this drawback, consideration of this case isseful for analysis of the frequency-multiplexed con-rol.
The dependencies of phase delay �� introduced byhe LC layer into the reflected light wave and ofarameters c and g on applied voltages can be mea-ured in experiment or calculated in the framework ofhe Ericksen–Leslie theory; some useful formulas cane found in Ref. 13. Earlier, we developed a numer-cal model for the calculation of these dependencesrom microscopic parameters of nematic LCs.15 Inhis paper, however, we use mostly experimental de-endencies. Note that the LC director can follownly relatively slow voltage oscillations whose periods approximately equal to or greater than the LCwitching time. For voltage oscillations whose pe-iod is much smaller �frequency �1 kHz�, the orien-ation of the LC director depends only on the rmsoltage; thus, electrical and optical parameters of theC also depend only on rms voltage.In general, the problem of calculation of the phase
istribution in the LC MWC includes solving the sys-em of Eqs. �1�, boundary conditions �5� and �6�, andhenomenological dependencies �� ���urms�, c �urms�, and g g�urms, �, where is the voltagerequency. The most important of the three func-ions is the first one, the so-called phase-voltage char-cteristic �PVC�. In this paper we pay specialttention to two essentially different methods of con-rol, i.e., a SFC, which means that all ac voltagesriving different contacts have the same frequency,nd a FMC, for which all working frequencies areifferent for different contacts.Earlier we developed a simple but effective approx-
mation, assuming constant values for g and c, forolving Eq. �1� for the voltage distribution.12 Thisssumption means that LC impedance Z �S�g c�� 1, where S is the LC layer’s area, remainsonstant as well, so we call this approach theonstant-impedance approximation �CIA�. For a LCens we compared the CIA results with those ob-ained when we took into account the variation of cnd g with voltage16 and found that the CIA is goodnough to provide a qualitative description of theehavior of the modal correctors. We use this ap-roximation for theoretical analysis throughout theaper.
. Influence Functions
e start with a notion of active contact of a LC MWC.e call a contact active if it is connected to a gener-
tor terminal, as opposed to a passive contact that iseft unconnected �floating�. We note that a contactan be considered approximately passive if the totalurrent through it can be ignored, e.g., if the internalesistance in the corresponding channel is infinite.
It can be readily understood from both generalhysical reasoning and a mathematical description ofhe LC MWC that the local voltage distribution at aiven point is affected by all active contacts, resultingn a rather complicated overall picture. Therefore it
eems advisable to decompose the total voltage intoontributions produced by individual contacts. Fol-owing this idea, we arrive at the concept of influenceunctions of individual contacts. We represent theocal voltage as a sum of voltages somehow producedy individual active contacts, i.e.,
u�r, t� ��k1
N
uk�r, t�, (7)
here function uk�r, t� is called the CIF of the kthontact at point r. For distribution u�r, t� to satisfyens equation �1�, it is sufficient to require that eachf uk�r, t� �a� also satisfy this equation and �b� beubject to the boundary conditions expressed by Eqs.5� and �6�. Because the time dependence in thesequations is produced by EMFs, we further decom-ose functions uk�r, t� into harmonics according to Eq.6�:
uk�r, t� ���1
M
uk��r�exp�i�t�. (8)
nlike uk�r, t�, CIF harmonics uk��r� are time inde-endent. We require that these functions satisfyq. �2� with �2 ��
2 ��g��� � i�c�, i.e.,
�uk��r� � ��2uk��r�, (9)
nd that they satisfy the following boundary condi-ions for each of N contacts:
um��r��Lm�
R� �
Lm
��um��r�, Nm�dl� � Ek��mk,
m � 1 . . . N, (10)
here �mk is the Kronecker delta function. Then,ecause of the linearity of Eqs. �1�, �5�, and �6�, volt-ge u�r, t� introduced by Eqs. �7� and �8� satisfies theoundary problem for the LC MWC. According toq. �10�, the CIF harmonic for the kth contact and theth frequency is the voltage distribution across theperture generated by supplying EMF Ek� of fre-uency � to the kth channel and zero EMFs to allther channels.The boundary-value problem described by Eqs. �9�
nd �10� in a general case is rather complicated andan be solved only numerically. However, for illus-ration we present here a closed analytical form for aIF in the special case that we term one contact, onearmonic; that is, Ek� Ek�k�. Then the boundaryroblem for CIFs is simplified and can be written as
2uk�r� � �k2uk�r�, (11)
�um�r��Lm�
R� �
Lm
��um�r�, Nm�dl� � Ek�mk,
m � 1 . . . N. (12)
wc�tndfaatgi
fcramgctl�
t
iga
i
oae
wls
she56FZenttrstpiifrf5
Fsd
Ftasptpf
Its solution has the form
uk�r� �Ek
� �m1
N
YmkH0�i�k�r � rm��, (13)
here � and Ymk denote the determinant and theofactors �algebraic adjuncts� of influence matrix Hsee Eq. �A4� below�, respectively; rk is the position ofhe center of the kth contact �see Fig. 3�; and N is theumber of contacts. The derivation of Eq. �13� and aiscussion of the necessary assumptions used can beound in Appendix A. The most essential of thesessumptions are the following two: that the radii ofll contacts are small relative to intercontact separa-ion l and that the circular aperture’s radius is muchreater than 3l �and so the periphery boundary isgnored�.
The numerical model described in Ref. 11 is freerom both of these limitations; moreover, it is appli-able for two types of boundary condition at the pe-iphery, i.e., for the presence and the absence of annnular peripheral contact. In its initial version theodel was limited by restrictions of the voltage-
enerator regime, but later it was generalized to thease of arbitrary R. This was achieved by applica-ion of the following iterative procedure to the calcu-ation of every harmonic component of the voltage u�� 1 . . . M�:
�1� We assume that all currents through the con-acts are zero: Ik� 0 for k 1. . .N.�2� Using the finite-differential method described
n Ref. 11, we calculate the voltage distribution for aiven set of contact voltages. The contact voltagesre calculated from the Kirchhoff rule
u��r��Lk� Ek� � Ik�R, k � 1 . . . N. (14)
�3� We evaluate currents through the contacts byntegration of surface currents:
Ik� �1� �
L
��u�(r),Nk�dl.
ig. 3. Vector layout: O, origin; P, observation point. Vectorstarting at O are denoted r; those that originate at the contacts areenoted R.
k
�4� Steps �2� and �3� are repeated with new valuesf Ik� until the required accuracy �0.0001 V� ischieved. The accuracy achieved at each step can bevaluated by use of the Lipschitz condition17
� ��1
2
�0 � �1, (15)
here �1 is the maximum change of voltage for theatest iteration step, and �0 is that for the previoustep.This method was applied to the calculation of re-
ponse functions of the 37-channel LC MWC with theexagonal arrangement of contacts and no peripherallectrode. The results are presented in Figs. 4 and. Calculated values of impedances Zc and Zic were90 and 878 k�, respectively. It can be seen fromig. 4�a� that, if the CU’s resistance is much less thanc and Zic �voltage-generator mode�, then the influ-nce function is localized in the area bordered by theearest active contacts. Therefore the nearest con-acts effectively screen out the voltage produced byhe given contact from penetration to the outeregion. With the increase of CU resistance thecreening effect gets weaker �Fig. 4�b��, and forhe current-generator mode �R �� Zc, Zic� it disap-ears completely, resulting in a smooth nonlocalizednfluence function of a given contact. The latter facts clearly seen from a comparison of the influenceunctions for many active contacts and various CUesistances on one hand, with the influence functionor only one active contact, on the other �Figs. 4�c� and�. It is necessary to note, however, that if R �� Z
ig. 4. �a�–�c� Calculated influence functions of the central con-act in a 37-channel LC MWC for various CU resistances and allctive contacts. �d� Influence function for a single active contact,hown for comparison. Corrector parameters: diameter ofointlike contacts, 0.5 mm; aperture diameter, 30 mm; intercon-act distance, 3.3 mm; sheet resistance, �s 500 k�; contact im-edance, Zc 691 k�; intercontact impedance, Zic 878 k�;requency, 500 Hz.
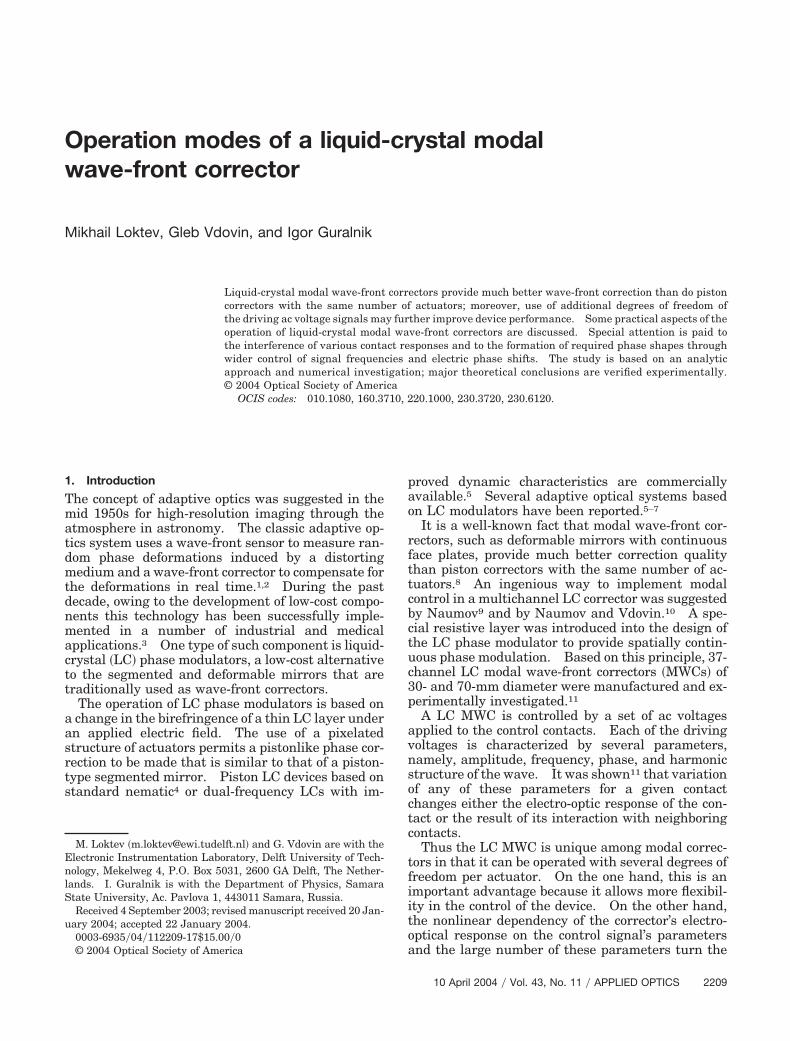
hen the voltage at the contact is much smaller thanhe EMF driving this contact; this means that oneeeds to use a high-voltage CU in this mode. This isdefinite drawback of this control mode.We investigated the screening effect experimen-
ally in the 38-channel 80-mm LC MWC with hexag-nal arrangement of contacts and an annulareripheral electrode. To drive the modulator wesed two different PC-based control units with out-ut resistances of 0.15 � and 53 k�, respectively.e also implemented configurations with higher out-
ut resistances by connecting the modulator in seriesith 200- and 400-k� resistors. Thus we had four
onfigurations of the control unit: with R 0.15 �nd R 53, 253, 453 k�; the last-named value ispproximately 16.5 times higher than Zc and 9.93imes higher than Zic. Contact impedance Zc mea-ured for u1 7.07 V and f 500 Hz was 27.4 k�;ntercontact impedance Zic measured for u12 7.07 Vnd f 500 Hz was 45.6 k�.To investigate the screening effect we connected
wo adjacent contacts in the central part of the aper-
ig. 5. Cross section of the influence functions of the centralontact for various CU resistances and all active contacts; inter-ontact distance, 3.3 mm; other corrector parameters identical tohose for Fig. 4. The influence function for a single active contacts shown for comparison.
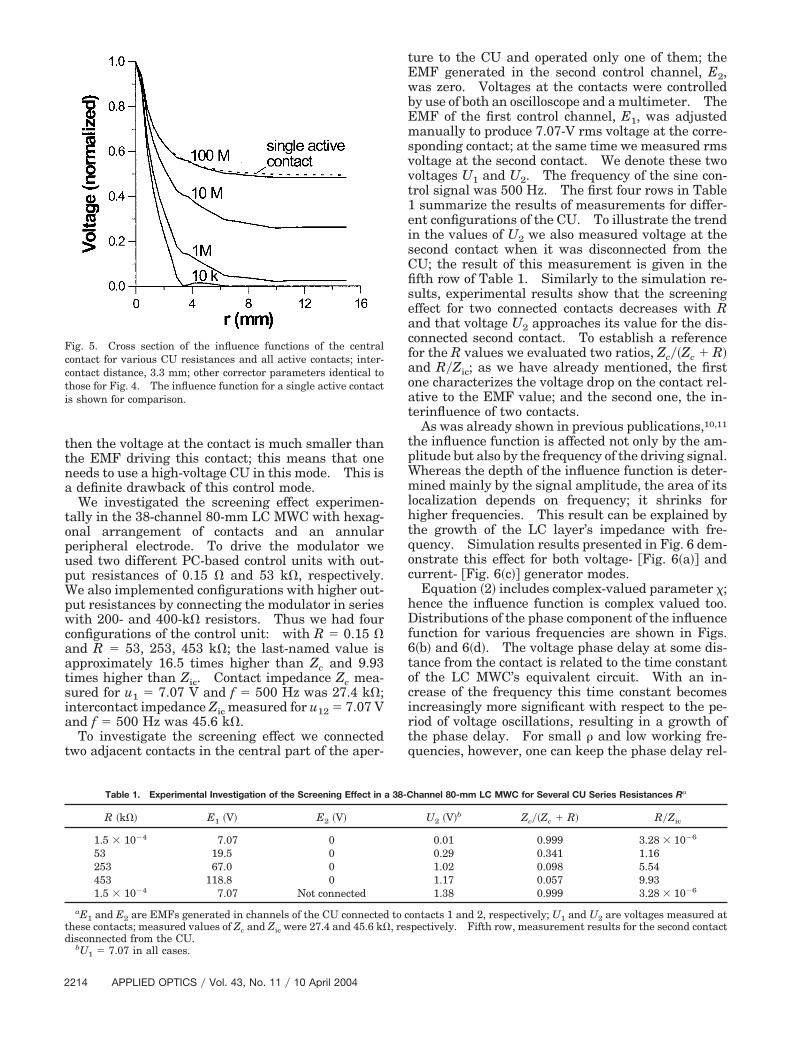
Table 1. Experimental Investigation of the Screening Effect in a
aE1 and E2 are EMFs generated in channels of the CU connectedhese contacts; measured values of Zc and Zic were 27.4 and 45.6 k�isconnected from the CU.
ure to the CU and operated only one of them; theMF generated in the second control channel, E2,as zero. Voltages at the contacts were controlledy use of both an oscilloscope and a multimeter. TheMF of the first control channel, E1, was adjustedanually to produce 7.07-V rms voltage at the corre-
ponding contact; at the same time we measured rmsoltage at the second contact. We denote these twooltages U1 and U2. The frequency of the sine con-rol signal was 500 Hz. The first four rows in Tablesummarize the results of measurements for differ-
nt configurations of the CU. To illustrate the trendn the values of U2 we also measured voltage at theecond contact when it was disconnected from theU; the result of this measurement is given in thefth row of Table 1. Similarly to the simulation re-ults, experimental results show that the screeningffect for two connected contacts decreases with Rnd that voltage U2 approaches its value for the dis-onnected second contact. To establish a referenceor the R values we evaluated two ratios, Zc��Zc � R�nd R�Zic; as we have already mentioned, the firstne characterizes the voltage drop on the contact rel-tive to the EMF value; and the second one, the in-erinfluence of two contacts.
As was already shown in previous publications,10,11
he influence function is affected not only by the am-litude but also by the frequency of the driving signal.hereas the depth of the influence function is deter-ined mainly by the signal amplitude, the area of its
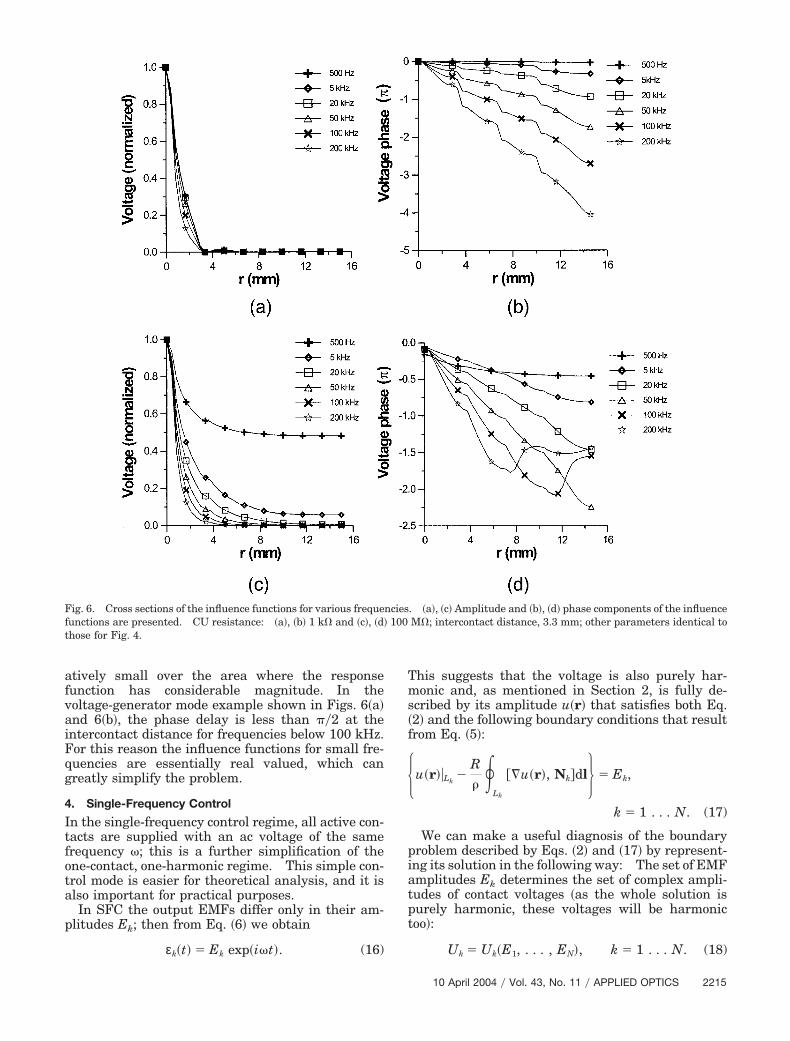
ocalization depends on frequency; it shrinks forigher frequencies. This result can be explained byhe growth of the LC layer’s impedance with fre-uency. Simulation results presented in Fig. 6 dem-nstrate this effect for both voltage- �Fig. 6�a�� andurrent- �Fig. 6�c�� generator modes.
Equation �2� includes complex-valued parameter �;ence the influence function is complex valued too.istributions of the phase component of the influence
unction for various frequencies are shown in Figs.�b� and 6�d�. The voltage phase delay at some dis-ance from the contact is related to the time constantf the LC MWC’s equivalent circuit. With an in-rease of the frequency this time constant becomesncreasingly more significant with respect to the pe-iod of voltage oscillations, resulting in a growth ofhe phase delay. For small � and low working fre-uencies, however, one can keep the phase delay rel-
hannel 80-mm LC MWC for Several CU Series Resistances Ra
ontacts 1 and 2, respectively; U1 and U2 are voltages measured atpectively. Fifth row, measurement results for the second contact
38-C
to c, res
afvaiFqg
4
Itfota
p
Tms�f
�piatpt
Fft
tively small over the area where the responseunction has considerable magnitude. In theoltage-generator mode example shown in Figs. 6�a�nd 6�b�, the phase delay is less than ��2 at thentercontact distance for frequencies below 100 kHz.or this reason the influence functions for small fre-uencies are essentially real valued, which canreatly simplify the problem.
. Single-Frequency Control
n the single-frequency control regime, all active con-acts are supplied with an ac voltage of the samerequency ; this is a further simplification of thene-contact, one-harmonic regime. This simple con-rol mode is easier for theoretical analysis, and it islso important for practical purposes.In SFC the output EMFs differ only in their am-
litudes Ek; then from Eq. �6� we obtain
ε �t� � E exp�it�. (16)
ig. 6. Cross sections of the influence functions for various frequeunctions are presented. CU resistance: �a�, �b� 1 k� and �c�, �d�hose for Fig. 4.
k k
his suggests that the voltage is also purely har-onic and, as mentioned in Section 2, is fully de-
cribed by its amplitude u�r� that satisfies both Eq.2� and the following boundary conditions that resultrom Eq. �5�:
u�r��Lk�
R� �
Lk
��u�r�, Nk�dl� � Ek,
k � 1 . . . N. (17)
We can make a useful diagnosis of the boundaryroblem described by Eqs. �2� and �17� by represent-ng its solution in the following way: The set of EMFmplitudes Ek determines the set of complex ampli-udes of contact voltages �as the whole solution isurely harmonic, these voltages will be harmonicoo�:
U � U �E , . . . , E �, k � 1 . . . N. (18)
. �a�, �c� Amplitude and �b�, �d� phase components of the influenceM�; intercontact distance, 3.3 mm; other parameters identical to
he voltage distribution in the LC MWC satisfies Eq.2� and the boundary conditions
u�r��Lk� Uk, k � 1 . . . N. (19)
he range of variation of complex amplitudes Uk de-ermines the class of voltage distributions that can beroduced in a LC MWC. In voltage-generator mode,ependency �18� becomes simple and straightfor-ard: Uk Ek; thus, arbitrary values of Uk can beenerated by a simple adjustment of the amplitudend the initial phase of Ek. We see that the voltage-enerator mode permits realization of any voltageistribution that can be obtained by use of SFC.onsidering the importance of the voltage-generatorode, we shall assume it throughout the rest of this
ection that this is the mode used.Using our numerical model, we investigated the
apability of the LC MWC to generate phase aberra-ions expressed by the first Zernike terms. We usedormalized Zernike polynomials with unitary ampli-ude on a circle of unitary radius.18 The amplitudesf the phase aberrations were expressed in waves forhe wavelength of a He–Ne laser �0.63 �m�. As arst step we used the middle part of an experimentalVC to calculate the rms voltage distribution thatorresponds to the target phase aberration �we call itarget voltage�. We used the experimental PVC,hich was measured for the 25-�m-thick BL006 LCaterial �Merck, Germany�. Then we calculated the
nfluence functions of all contacts and used them topproximate the target voltage. Finally, we evalu-ted the resultant phase distribution and compared itith the target aberration.It has already been noted that the LC phase re-
ponse is determined by rms voltage and is not sen-itive to the voltage phase; however, the phaseomponents of the response functions and the adjust-ent of phase shifts between them affect the net rms
oltage distribution. Besides, the choice of theorking range of voltages affects the result of anpproximation that is due to nonlinear dependency� ���urms�. Thus in the general case the prob-
em of formation of the required phase aberration isuite ambiguous.
aCorrector parameters: diameter of pointlike contacts, 0.5 mmnological characteristics of a 25-�m layer of Merck’s BL006 LC aesult for each aberration is indicated by boldface type.
As was shown in Section 3, for low frequencies wean consider influence functions as being real valued.f we assume that the initial phases of all contactoltages are zero, the net voltage distribution will beeal valued too; therefore the target voltage can betted by influence functions by use of an ordinary
inear approximation method. It provides us with aseful operation mode that can be characterized byuasi-linear behavior. We call this mode single-requency voltage amplitude control �SF-VAC� be-ause voltage amplitudes are used as controlarameters. One advantage of this method is that ainear algorithm similar to those used for deformable
irrors can be implemented; it has already beenroved to work in the experimental adaptive opticalystem.19
Even in situations when SF-VAC is not applicable,.g., for higher frequencies, it allows a first approxi-ation to be obtained that can be used for further
ptimization. We applied this method for fittinghase surfaces in a wide range of frequencies �up to50 kHz; Table 2�. We used the first Zernike poly-omials as target functions, fitting them individuallynd evaluating rms residual aberration with respecto the target wave front in each case. Although,trictly speaking, this method is not applicable to allhese frequencies, the evaluation of residual errorsas correct because it involved complex-valued rep-
esentation of influence functions.Examples of the fit shown in Fig. 7 feature specific
ontact aberrations, spikes or bumps, about the con-acts. The presence of these aberrations can be ex-lained by the specific shape of the influence function,hich is characterized by the sharp recession of theoltage in the small vicinity of a contact, even for zerorequency. Just imagine that any voltage distribu-ion that can be generated in a LC MWC is a compo-ition of pointed influence functions similar to thosehown in Fig. 4�a�. In this case the distribution ofhe modulus of the residual wave-front fitting errorcross the aperture will have pronounced local max-ma that coincide with the positions of contacts. Forberrations produced by this residual error we usehe term contact aberrations.
rture diameter, 30 mm; sheet resistance, � 100 k�. Phenom-ed. rms residual aberrations are expressed as waves. The best
a 38
1
0.00.00.30.10.30.20.80.5
; apere us
sdisffpctt7ntwa
ac
fomwdcvismna
Fa
trongly dependent on the wave front shape and isifferent for each type of aberration. The compar-son of fitting results for different frequencieshown in Fig. 7 indicates that the adjustment ofrequency affects the local curvature of the waveront in the vicinity of a contact. In some cases �inarticular, for converging wave fronts� this localurvature can be adjusted to match the curvature ofhe target wave front, and the corresponding con-act aberration will be largely compensated for �Fig.�b��. However, the adjustment of frequency doesot allow for compensating for the contact aberra-ions in a diverging wave front �Fig. 7�d��. That ishy in practical operation of the device it is desir-ble to avoid a large positive defocus component of
wave front, which one can do by introducing a biasurvature.As we said above, the conversion of target wave
ront to target voltage distribution was made by usef the middle part of the experimental PVC. Thiseans that the average of a target phase aberrationas adjusted to be in the middle of the total phaseelay variation range; for the PVC that we used itorresponds to 2.1-V rms voltage. Further, we in-estigated how correction error changes if we shiftnto higher and lower operating voltages. The re-ults show that for most aberrations, i.e., tilt, astig-atism, negative defocus, coma, and trifoil andegative spherical aberration, lower operating volt-ges provide better approximations, whereas for pos-
ig. 7. Approximation of �a�, �b� negative and �c�, �d� positive defocus in a 38-channel modal LC corrector; optimization by voltagemplitudes for frequencies �a�, �c� 1 kHz and �b�, �d� 100 kHz.
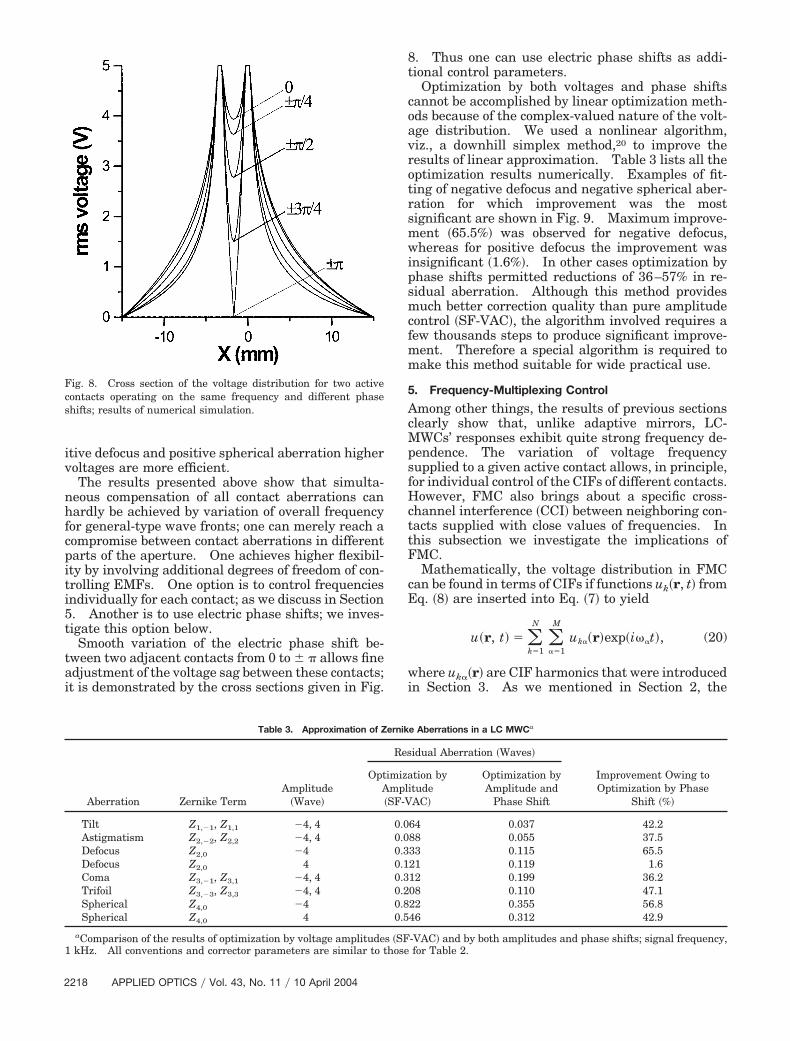
tive defocus and positive spherical aberration higheroltages are more efficient.The results presented above show that simulta-
eous compensation of all contact aberrations canardly be achieved by variation of overall frequency
or general-type wave fronts; one can merely reach aompromise between contact aberrations in differentarts of the aperture. One achieves higher flexibil-ty by involving additional degrees of freedom of con-rolling EMFs. One option is to control frequenciesndividually for each contact; as we discuss in Section. Another is to use electric phase shifts; we inves-igate this option below.
Smooth variation of the electric phase shift be-ween two adjacent contacts from 0 to � � allows finedjustment of the voltage sag between these contacts;t is demonstrated by the cross sections given in Fig.
ig. 8. Cross section of the voltage distribution for two activeontacts operating on the same frequency and different phasehifts; results of numerical simulation.
. Thus one can use electric phase shifts as addi-ional control parameters.
Optimization by both voltages and phase shiftsannot be accomplished by linear optimization meth-ds because of the complex-valued nature of the volt-ge distribution. We used a nonlinear algorithm,iz., a downhill simplex method,20 to improve theesults of linear approximation. Table 3 lists all theptimization results numerically. Examples of fit-ing of negative defocus and negative spherical aber-ation for which improvement was the mostignificant are shown in Fig. 9. Maximum improve-ent �65.5%� was observed for negative defocus,hereas for positive defocus the improvement was
nsignificant �1.6%�. In other cases optimization byhase shifts permitted reductions of 36–57% in re-idual aberration. Although this method providesuch better correction quality than pure amplitude
ontrol �SF-VAC�, the algorithm involved requires aew thousands steps to produce significant improve-ent. Therefore a special algorithm is required toake this method suitable for wide practical use.
. Frequency-Multiplexing Control
mong other things, the results of previous sectionslearly show that, unlike adaptive mirrors, LC-WCs’ responses exhibit quite strong frequency de-
endence. The variation of voltage frequencyupplied to a given active contact allows, in principle,or individual control of the CIFs of different contacts.owever, FMC also brings about a specific cross-
hannel interference �CCI� between neighboring con-acts supplied with close values of frequencies. Inhis subsection we investigate the implications ofMC.Mathematically, the voltage distribution in FMC
an be found in terms of CIFs if functions uk�r, t� fromq. �8� are inserted into Eq. �7� to yield
u�r, t� ��k1
N
��1
M
uk��r�exp�i�t�, (20)
here uk��r� are CIF harmonics that were introducedn Section 3. As we mentioned in Section 2, the
-VAC� and by both amplitudes and phase shifts; signal frequency,for Table 2.
ernik
Res
imizampliSF-V
0.00.00.30.10.30.20.80.5
s �SFhose
pttiras
wrLov�rvw
Sg
ws
isimfqcoofefbtSppSswf1
ifitdo
ft
F�cT
hase response of a LC MWC is determined by theime average of the voltage rather than by the instan-aneous values of the voltage given by Eq. �20�. Thiss so because LC director variations can follow onlyelatively slow voltage oscillations whose periods arepproximately equal to or greater than the LCwitching time21:
� ��d2
�2K11, (21)
here � and K11 are the viscosity and the elasticity,espectively, of the LC and d is the thickness of theC layer. In a simple model we assume that theptical phase delay of a LC MWC will depend only onoltage modulus �u�r, t��2 averaged over time interval. For the SFC regime this leads to a well-knownesult that the phase delay depends only on the rmsoltage. To carry out the averaging in FMC, werite
urms2�r� � ��u�r, t��2� �
1� �
t
t��
u�r, t�u*�r, t�dt.
(22)
ubstituting voltage from Eq. �20�, performing inte-ration, and separating steady-state terms, we obtain
urms2�r� � �
k,m1
N
��1
M
uk�um�* � �k,m1
N
��, 1
M
� uk��r�um *�r�F�� �exp�i� �t � ��2��,(23)
ig. 9. Approximation of �a�–�c� negative defocus and �d�–�f � negd� by voltage amplitudes and �b�, �e� by both amplitudes and phaomparison. Corrector parameters are similar to those given inable 3.
here F�� � �2�� ��sin�� ��2� and � �
is the frequency mismatch between the corre-ponding contacts.It can be seen from Eq. �23� that in FMC the voltage
s time dependent as a result of the second doubleum. The structure of the sum suggests that theres CCI because each term of the sum describes the
utual influence of a pair of contacts. The CCI termor contacts � and oscillates with mismatch fre-uency � for these contacts, and the period of os-illations is equal to 2��� . The amplitude of thesescillations, according to Eq. �23�, is defined by theverlap of CIFs for this couple of contacts and byunction F�� � plotted in Fig. 10. Both factors areasily understood from a physical standpoint. First,or CCI to be sited at a given point of the aperture,oth contacts involved must contribute significantlyo the voltage at that point. As we explained inection 3, CIFs are usually well localized about theirarent contacts, so considerable overlap can be ex-ected to take place only between adjacent contacts.econd, driving frequencies for contacts � and hould be sufficiently close; otherwise the CCI signalill oscillate so fast that the LC molecules will not
ollow its time variation. As can be seen from Fig.0, function F�� � rapidly decreases for � �� 1��.We should note here that the calculation that we
mplemented when we time-averaged the voltagerst and then used a steady-state PVC is just one wayo avoid the insurmountable difficulties of solving theynamic Ericksen–Leslie equation. As we shall see,ur approach brings physically meaningful results.To investigate CCI experimentally, we measured
unction F�� � for a special case of two active con-acts and small oscillations. For two active contacts
spherical aberration in a LC MWC. Results of optimization �a�,ifts. �c� Ideal defocus and �f � spherical aberration are shown forle 2; signal frequency, 1 kHz; residual aberrations are given in
here !12�r� !1�r� !2�r� is the spatial distributionf electric phase differences between u1 and u2. Inhis experiment, a laser beam reflected from theodal LC corrector, which was placed between two
rossed polarizers, fell onto a photodiode. The sig-al from the photodiode was observed with an oscil-
oscope and analyzed with a lock-in amplifierPrinceton Applied Research Model 186A�. We mea-ured the amplitude of the first harmonic in oscilla-ions of the photodiode output, which wasroportional to the light’s intensity. The frequencyf the first harmonic was set equal to frequency mis-atch 12, which was clearly seen at the oscilloscope.For correct interpretation of experimental results
he following should be noted: If the amplitude ofoltage oscillations is small relative to the averageoltage level, oscillations of phase delay in the LCayer can be approximated by a linear dependency�t� �0 ��1 cos 12t. As a result, the intensity at
he photodiode oscillates as
I�t� � �I0�2��1 � cos��0 � �1 cos 12t��. (25)
he amplitudes of the first two harmonics of I�t�, C1nd C2, can be obtained by its decomposition intoourier series:
C1 � �a1 � b1 � I0�sin �0 J1��1��, (26)
C2 � �a2 � b2 � I0�cos �0�2J1��1�
�1� J0��1�� ,
(27)
ig. 10. Function f that describes the mismatch frequency depen-ence on voltage.
here J0 and J1 are Bessel functions; a1, b1, a2, and2 are coefficients of Fourier series decomposition of�t� that correspond to the first two harmonics.
It can be seen that the amplitude of the first har-onic changes linearly with �1 at approximately one
alf of the full range of its variation. To control �0nd �1 more or less independently, the laser beamas reflected from the LC MWC at aperture point r0,hich was very close to the first of the two active
ontacts. As we used the voltage-generator mode,he influence of the first contact in this point wasuch stronger than that of the second contact:
1�r0� �� u2�r0�; in this situation the value of u1 de-ermines �0, whereas u2 determines �1. In its turn,1 is proportional to the amplitude of the voltagepplied to the first contact u10, whereas u2 is propor-ional to u20.
To determine the range in which the photodiodeutput is linearly dependent on the amplitude ofhase oscillations we measured the full variation ofhe first harmonic of the photodiode output. In thiseasurement we minimized the second harmonic rel-
tive to the first harmonic by adjusting the averagehase level. The sine signal with amplitude u10 0 V and frequency f1 500 Hz was applied to therst contact; the frequency of the second contact was
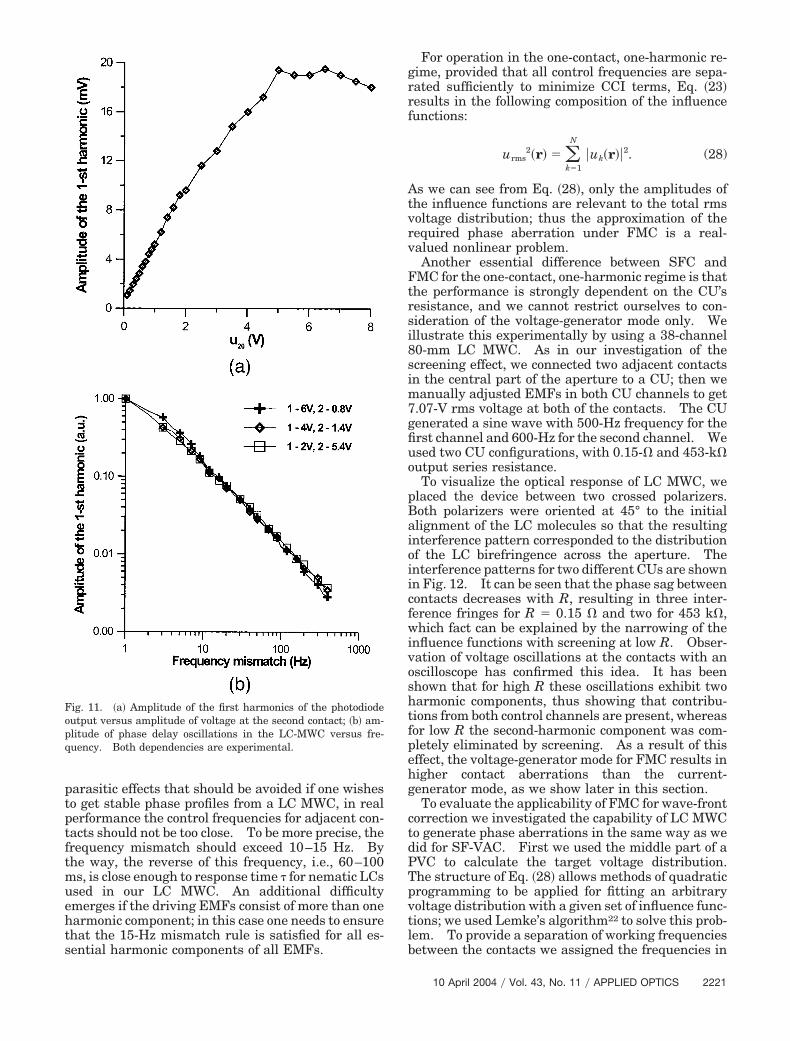
2 520 Hz, and amplitude u20 was varied from 0 toV.As can be seen from Fig. 11�b�, the amplitude of the
rst harmonic reaches its maximum at 20 mV, andp to 10 mV the dependency is approximately linear,hich is, in agreement with the theoretical predic-
ions, approximately one half of its maximum. Fur-her measurements of the first harmonic were maden the range 0–6 mV to ensure linearity.
The measurements were made for a frequency mis-atch that varied from 1 to 400 Hz in three areas of
he PVC. The value of parameter u10 �6, 4, or 2 V�etermined the position at the PVC, and we adjustedarameter u20 �by increasing it from zero� to get 6-mVmplitude of the first harmonic, corresponding to arequency mismatch of 1 Hz. After that we madehe measurements in the whole frequency range; cor-esponding plots are given in Fig. 11�b�. It can beeen that, as a result of the adjustment, all curves areelatively close to one another.
One important characteristic of Fig. 11 is that theog–log frequency dependencies are essentially lin-ar, with the slope close to a unit. This is a clearndication of the inverse proportionality of the outputersus frequency, in accordance with the pre-sine fac-or in function F�� from Eqs. �23� and �24�. Themplitude of oscillations decreases 10 times at a fre-uency mismatch of 15 Hz and 100 times at a 140-Hzismatch. However, oscillations of the first-armonic amplitude predicted by the sine in F�� areot present in the experimental results. We ascribehis setback of the theory to the time-averagingethod adopted.Based on the results above, we can formulate a
ractical restriction on the driving voltages underMC. As CCI and oscillations produced thereby are
ptptftmuehts
grrf
Atvrv
Ftrsi8sim7gfiuo
pBaioiicfwivoshtfpehg
ctdPTpvtlb
Fopq
arasitic effects that should be avoided if one wisheso get stable phase profiles from a LC MWC, in realerformance the control frequencies for adjacent con-acts should not be too close. To be more precise, therequency mismatch should exceed 10–15 Hz. Byhe way, the reverse of this frequency, i.e., 60–100s, is close enough to response time � for nematic LCs
sed in our LC MWC. An additional difficultymerges if the driving EMFs consist of more than onearmonic component; in this case one needs to ensurehat the 15-Hz mismatch rule is satisfied for all es-ential harmonic components of all EMFs.
ig. 11. �a� Amplitude of the first harmonics of the photodiodeutput versus amplitude of voltage at the second contact; �b� am-litude of phase delay oscillations in the LC-MWC versus fre-uency. Both dependencies are experimental.
For operation in the one-contact, one-harmonic re-ime, provided that all control frequencies are sepa-ated sufficiently to minimize CCI terms, Eq. �23�esults in the following composition of the influenceunctions:
urms2�r� ��
k1
N
�uk�r��2. (28)
s we can see from Eq. �28�, only the amplitudes ofhe influence functions are relevant to the total rmsoltage distribution; thus the approximation of theequired phase aberration under FMC is a real-alued nonlinear problem.Another essential difference between SFC and
MC for the one-contact, one-harmonic regime is thathe performance is strongly dependent on the CU’sesistance, and we cannot restrict ourselves to con-ideration of the voltage-generator mode only. Wellustrate this experimentally by using a 38-channel0-mm LC MWC. As in our investigation of thecreening effect, we connected two adjacent contactsn the central part of the aperture to a CU; then we
anually adjusted EMFs in both CU channels to get.07-V rms voltage at both of the contacts. The CUenerated a sine wave with 500-Hz frequency for therst channel and 600-Hz for the second channel. Wesed two CU configurations, with 0.15-� and 453-k�utput series resistance.To visualize the optical response of LC MWC, we
laced the device between two crossed polarizers.oth polarizers were oriented at 45° to the initiallignment of the LC molecules so that the resultingnterference pattern corresponded to the distributionf the LC birefringence across the aperture. Thenterference patterns for two different CUs are shownn Fig. 12. It can be seen that the phase sag betweenontacts decreases with R, resulting in three inter-erence fringes for R 0.15 � and two for 453 k�,hich fact can be explained by the narrowing of the
nfluence functions with screening at low R. Obser-ation of voltage oscillations at the contacts with anscilloscope has confirmed this idea. It has beenhown that for high R these oscillations exhibit twoarmonic components, thus showing that contribu-ions from both control channels are present, whereasor low R the second-harmonic component was com-letely eliminated by screening. As a result of thisffect, the voltage-generator mode for FMC results inigher contact aberrations than the current-enerator mode, as we show later in this section.To evaluate the applicability of FMC for wave-front
orrection we investigated the capability of LC MWCo generate phase aberrations in the same way as weid for SF-VAC. First we used the middle part of aVC to calculate the target voltage distribution.he structure of Eq. �28� allows methods of quadraticrogramming to be applied for fitting an arbitraryoltage distribution with a given set of influence func-ions; we used Lemke’s algorithm22 to solve this prob-em. To provide a separation of working frequenciesetween the contacts we assigned the frequencies in
he following way: fk fbase � �k 1� � 20 Hz forhe kth contact, where fbase is a base frequency; therder of contacts’ numbering is shown in Fig. 1�b�.e assumed two control unit options, i.e., voltage and
urrent generator modes.Because of extremely high contact aberrations we
id not manage to get any proper approximation ofernike terms for the voltage-generator mode,
ig. 12. Two-contact response of a 38-channel 80-mm LC-MWCor �a� 0.15 � and �b� 453 k� CU series resistance. EMF values ofoth control channels were adjusted to yield 7.07-V rms voltages athe corresponding contacts. CU-generated sine wave with 500 Hzrequency for the first channel and 600 Hz for the second channel.
hereas for the current-generator mode we got muchetter results, as shown for example in Fig. 13�b�.he figures given in Table 4 show the feasibility ofsing FMC with the current generator mode forave-front correction; however, a comparison of data
rom Tables 2 and 4 reveals that FMC generally re-ults in a higher level of residual aberrations.A practical algorithm for fitting an arbitrary wave
ront in the framework of FMC should permit inde-endent adjustment of amplitudes and frequenciesor all contacts to minimize fitting error. However,he fact that the influence functions depend on fre-uency makes it necessary either to evaluate �or mea-ure� them at each step of the algorithm or to performreliminary calibration of the corrector in a wideange of frequencies. Additionally, the algorithmhould deal with the separation of working frequen-ies, provided that they are not too close. From aractical point of view it seems to be a good idea totilize the correlation between the operating fre-uency of a contact and the local wave-front curva-ure in its vicinity; this may allow a LC MWC coupledith a curvature-type wave-front sensor1 to be used
n an adaptive optical system.
. Frequency-Multiplexed Control with the Samearmonic Composition of Signals Applied to Differentontacts
ost of the results of Section 4 were obtained for thene-contact, one-harmonic regime, which means thathe CU should provide for generation of sine waveshrough multiple channels. However, from a tech-ical point of view it is much easier to construct a CUs a generator of square waves; moreover, the dual-requency technique, which can be used to improveynamic characteristics of the LC MWC, also re-uires that a control signal consist of at least twoarmonic components. Thus, it is of practical im-ortance to make some evaluations of the applicabil-ty of the results obtained for SFC to a multiharmonicontrol signal.
A generalization of SFC to a multiharmonic con-rol signal can be made if we assume that all con-acts are supplied with ac voltages that have theame frequency and spectrum but different ampli-
ig. 13. �c� Approximation of target voltage distribution for astigmatism under FMC by use of �a� voltage-addressing and �b� current-ddressing modes; base frequency, f 1 kHz.
tr
wATci
�Ttbv
�wafhbIcwvhcMwu
otttaa
pm
7
WeTcvoc
auiwmegac
phsltipifspua
Lcspwacvd
for T
udes. The CU’s output EMFs in this case can beepresented as
εk�t� � Ek ��1
M
A� exp�i�t� ���1
M
Ek� exp�i�t�, (29)
here Ek� EkA� and frequencies� and coefficients� of the harmonics are the same for all channels.he voltage distribution for every �th harmonic u��r�an be found in a way similar to that for SFC, assum-ng boundary conditions
ua�r��Lk�
R� �
Lk
��u��r�, Nk�dl� � Ek�,
k � 1 . . . N. (30)
he evaluation of the total rms distribution accordingo Eq. �22�, provided that the frequency mismatchetween any two harmonics is large enough to pre-ent intercontact interference in the LC, results in
urms2�r� ��
�1
K
�u��r��2. (31)
We have carried out calculations according to Eq.31� for square-wave control, approximating squareaves with 20 harmonics. In general, the contactberrations for square waves were higher than thoseor a single harmonic because of the presence ofigher frequencies, but this effect can be minimizedy proper reduction of the sheet resistance of the CE.f � is small enough for the voltage distributions thatorrespond to all significant harmonics to be identicalith precision up to a constant factor, the total rmsoltage distribution will be the same as for the single-armonic case. If this condition is satisfied, voltageontrol by use of a multiharmonic signal in the LCWC can be performed in exactly the same way asith sine waves; i.e., a linear approximation can besed for fitting the desired phase aberrations.Corresponding calculations show that a variation
f the phase shift between square waves applied towo adjacent contacts affects the voltage sag betweenwo adjacent contacts in a way that is quite similar tohat for the sine wave �Fig. 8�; this means that anpproximation by phase shifts for square waves maylso be used to improve correction quality.
Table 4. Approximation of Zernike Aberrations in a
aAll conventions and corrector parameters are similar to those
Thus, major results obtained for SFC can be ap-lied, under certain circumstances, to the multihar-onic control.
. Conclusions
e have discussed some practical aspects of the op-ration of a liquid-crystal modal wave-front corrector.wo important operation modes, single-frequencyontrol and frequency-multiplexed control, were in-estigated; the influence of a control unit’s resistancen the device’s performance was studied in bothases.
Under SFC the maximum flexibility is achieved forvoltage-addressing mode; it allows the CU to be
sed with the lowest possible series resistance, keep-ng the range of internal voltages in CU below 10 V,hich is compatible with many bipolar and comple-entary metal-oxide semiconductor processes. It is
specially important for the development of an inte-rated device combining the backplane of a LC MWCnd a part of its control electronics on the samehip.19
A special case of SFC, single-frequency voltage am-litude control, is characterized by a quasi-linear be-avior. In this mode the LC MWC operates in a wayimilar to that of deformable mirrors, and existinginear control algorithms can be applied. However,he performance of a LC MWC under SF-VAC is lim-ted because of specific contact aberrations. To com-ensate for these aberrations for each contactndividually, additional degrees of freedom, namely,requencies and phase shifts of control ac voltages,hould be involved. In particular, optimization byhase shifts under SFC leads to a reduction of resid-al aberrations of as much as 65% compared withmplitude-only control.The use of FMC imposes some restrictions on the
C MWC’s performance, however. In the first place,ontrol frequencies for any pair of adjacent contactshould be separated by at least 10–15 Hz to preventarasitic phase oscillations. In the second place, itas stated that feasible wave-front correction can bechieved under FMC only for a CU working inurrent-addressing mode. But this requires a high-oltage CU �hundreds of volts internally�, which isifficult to implement in an integrated device.
In our opinion, SFC is more suitable than FMC forractical use. First, it is free from both limitationsf FMC. Also, optimization under SFC can be ac-omplished in two stages. Optimization by ampli-udes by use of a linear algorithm allows the firstpproximation to be obtained in a short time; further,hese results can be improved by use of an optimiza-ion by both voltages and phase shifts. And, as washown, both methods of optimization can be applied ifhe LC MWC is driven by multiharmonic ac voltages,uch as square waves; then inexpensive and mostlyigital control electronics can be used.
ppendix A. Point-Contact Approximation: Analyticalolution and Contact Influence Function
e use the following assumptions to find an approx-mate solution to the boundary-valued problem de-cribed by Eqs. �9� and �10�: �a� a CIA �see the end ofection 2�; �b� a voltage-generator regime, i.e., Rk 0;
c� a circular aperture radius that is much greaterhan 3l such that the periphery boundary can begnored; and �d� equal radii of all contacts a and a ��, where l is the intercontact separation.
The most important of these assumptions is theourth. This requirement is easily met in real cor-ectors. For example, the first experimental LCWC, with a 0.25 mm and l 3.3 mm, had the
atio a�l 0.076; the second one, with a 0.25 mmnd l 9.9 mm, had the ratio a�l 0.025. Assump-ion �c�means that we consider a remote outer bound-ry. In other words, we subject the total voltageistribution to zero boundary conditions at infinity.his is the most stringent condition, and it makes theolution incorrect at the periphery of the corrector’sperture.We proceed by noting that under these assump-
ions partial solutions of Eq. �1� can be presented inerms of the Hankel functions of the first kind of zerorder H0�i�kr�exp�ikt�. H0 are Bessel functions,hich satisfy zero boundary conditions at infinity.hen we represent the general solution as a combi-ation of the partial solutions related to the corre-ponding active contacts:
V�r� ��k1
N
Xk H0�i�k�r � rk��, (A1)
here rk is the position of the center of the kth con-act �Fig. 3� and N is the number of contacts. Equa-ion �A1� clearly presents the total voltage as the sumf contributions of individual contacts. Now, theentral point of point-contact approximation is that,s contacts are small, we can ignore a small voltagerop over the kth contact’s diameter induced by allther contacts, thereby greatly simplifying the solu-ion. We find the unknown coefficients Xk by sub-ecting the solution to the boundary conditionsxpressed by Eq. �10�, which for zero internal resis-ance leads to the following linear system:
here dkm �rk rk� is the matrix of the intercontactistances that is readily calculated for a given contactayout. Figure 3 shows different position vectorsver a part of the aperture.Thus the problem is reduced to a comparatively
imple set of linear equations �A2�. Solving this sys-em for coefficients Xk and substituting those in Eq.A1� yield the required voltage distribution.
However, we can go further and derive explicit for-ulas for CIFs. For zero internal resistance Rk,IFs should satisfy the following boundary condi-
e obtain Eq. �13�, where � and Ymk denote the de-erminant and the cofactors �algebraic adjuncts� ofnfluence matrix H, respectively. Equation �13� cane directly checked to satisfy conditions �A3� ifaplace decomposition of determinants23 is taken
nto account.Comparison with the numerically calculated influ-
nce functions shows that, even for contacts substan-ially distanced from the center, point-contactpproximation leads to quite satisfactorily accurateesults.
This study was supported by the Dutch Technicaloundation STW, project DOE.5490, and partially byhe European Union INTAS-ESA program, project9-00523. We thank Alexander Naumov and Svet-ana Kotova of the P. N. Lebedev Physics Institute,amara, for their contribution to the developmentnd manufacture of the LC MWC.
eferences1. R. K. Tyson, Principles of Adaptive Optics, 2nd ed. �Academic,
Boston, Mass., 1998�.2. M. A. Vorontsov and V. I. Shmal’gauzen, Principles of Adaptive
Optics �Nauka, Moscow, 1985�.3. S. R. Restaino and S. W. Teare, eds., Proceedings of the 3rd
International Workshop on Adaptive Optics for Industry andMedicine �Starline Printing, Albuquerque, N. Mex., 2002�.
5. D. Dayton, S. Browne, J. Gonglewski, and S. Restaino, “Char-acterization and control of a multielement dual-frequencyliquid-crystal device for high-speed adaptive optical wave-frontcorrection,” Appl. Opt. 40, 2345–2355 �2001�.
6. D. C. Dayton, S. L. Browne, S. P. Sandven, J. D. Gonglewski,and A. V. Kudryashov, “Theory and laboratory demonstrationson the use of a nematic liquid-crystal phase modulator forcontrolled turbulence generation and adaptive optics,” Appl.Opt. 37, 5579–5589 �1998�.
1
1
1
1
1
1
1
1
1
1
2
2
2
2
7. F. Vargas-Martin, P. Prieto, and P. Artal, “Correction of theaberrations in the human eye with liquid crystal spatial lightmodulators: limits to the performance,” J. Opt. Soc. Am. A15, 2552–2562 �1998�.
8. M. Loktev, D. W. De Lima Monteiro, and G. Vdovin, “Compar-ison study of the performance of piston, thin plate and mem-brane mirrors for correction of turbulence-induced phasedistortions,” Opt. Commun. 192, 91–99 �2001�.
9. A. F. Naumov, “Modal wavefront correctors,” Proc. P. N. Leb-edev Phys. Inst. 217, 177–182 �1993�.
0. A. F. Naumov and G. V. Vdovin, “Multichannel liquid-crystal-based wave-front corrector with modal influence functions,”Opt. Lett. 23, 1550–1552 �1998�.
1. S. P. Kotova, M. Y. Kvashnin, M. A. Rakhmatulin, O. A. Zay-akin, I. R. Guralnik, N. A. Klimov, P. Clark, G. D. Love, A. F.Naumov, C. D. Saunter, M. Y. Loktev, G. V. Vdovin, and L. V.Toporkova, “Modal liquid crystal wavefront corrector,” Opt.Express 10, 1258–1272 �2002�, http:��www.opticsexpress.org�abstract.cfm?URIOPEX-10-22-1258.
2. G. V. Vdovin, I. R. Guralnik, S. P. Kotova, M. Yu. Loktev, andA. F. Naumov, “Liquid crystal lenses with programmable focaldistance. I. Theory; II. Experiment,” Quantum Electron.29, 256–264 �1999�.
3. I. R. Guralnik, V. N. Belopukhov, G. D. Love, and A. F. Nau-mov, “Interdependence of the electrical and optical propertiesof liquid crystals for phase modulation applications,” J. Appl.Phys. 87, 4069–4074 �2000�.
4. I. R. Guralnik and S. A. Samagin, “Electrophysics of the modalmulti-channel liquid-crystal wavefront corrector,” QuantumElectron. 32, 362–366 �2002�.
5. M. Y. Loktev, A. F. Naumov, and I. R. Guralnik, “Static anddynamic models of liquid crystal wavefront correctors,” in La-ser Optics 2000, Control of Laser Beam Characteristics andNonlinear Methods for Wavefront Control, L. N. Soms andV. E. Sherstobitov, eds., Proc. SPIE 4353, 9–16 �2000�.
6. I. R. Guralnik, M. Y. Loktev, and A. F. Naumov, “Electrophys-ics of adaptive LC lenses,” in International Conference onAtomic and Molecular Pulsed Lasers III, V. F. Tarasenko, G. V.Mayer, and G. G. Petrash, eds., Proc. SPIE 4071, 209–218�2000�.
7. M. B. Allen and E. I. Isaacson, Numerical Analysis for AppliedScience �Wiley, New York, 1998�.
8. M. Born and E. Wolf, Principles of Optics �Pergamon, Oxford,1965�.
9. M. Y. Loktev, G. V. Vdovin, and P. M. Sarro, “Modal correctorintegrated in silicon: possibilities for implementation,” in Op-tics in Atmospheric Propagation and Adaptive Systems V, A.Kohnle and J. D. Gonglewski, eds., Proc. SPIE 4884, 196–205�2003�.
0. W. H. Press, S. A. Teukolsky, W. T. Vetterling, and B. P.Flannery, Numerical Recipes in C��, 2nd ed. �Cambridge U.Press, Cambridge, 2002�, pp. 413–417.
1. L. M. Blinov and V. G. Chigrinov, Electrooptic Effects in LiquidCrystal Materials �Springer, New York, 1996�.
2. M. S. Bazaraa, H. D. Sherali, and C. M. Shetty, NonlinearProgramming: Theory and Algorithms �Wiley, New York,1993�.
3. G. A. Korn and T. M. Korn, Mathematical Handbook for Sci-entists and Engineers �McGraw-Hill, New York, 1968�.