Page 1
December 2013, IDC #245217
WHITE PAPER
Operational Analytics: The Role of Integrated Systems
Sponsored by: IBM
Greg Girard Sven Lohse
Henry D. Morris Courtney Munroe
Michael Versace
December 2013
IDC OPINION
Analytic systems for operations are designed to provide visibility, insight, and recommendations for
intelligent decisions within ever-shrinking time windows — in up to near real time. At the limit, this type
of workload seeks to identify potential fraud before a transaction is committed. Analytics for operations
also includes assessment of ongoing risk in meeting commitments and complying with policies — both
in a short time frame and in the longer term — as part of planning processes and strategy formation.
Operational analytics is a bet-the-business activity. Yet the technological support of analytics for
operations involves significant challenges in the following areas:
Scalability. Operational analytics requires continuous ingestion of a variety of raw, granular
data, which results in ever-growing data volumes. This poses challenges to managing,
integrating, and assessing the quality of diverse data sets.
Optimization. Rapid, in-database processing of analytical models at the point of decision can
yield an optimized response. Traditionally, this has meant a highly custom approach to
integrate multiple technology components in support of this demanding workload.
Expertise. Beyond the technology itself, the biggest issue faced by organizations embarking
on big data and analytics projects is the lack of skills to configure the appropriate technology to
meet the business demand.
Among the latest solutions available to organizations to address these challenges are workload-
optimized systems that support a wide range of analytics workloads on big data. One of the vendors
providing such solutions is IBM, whose IBM PureData System for Operational Analytics solution is an
effective technology solution to address many of the critical requirements of operational analytics.
Page 2
©2013 IDC #245217 2
IN THIS WHITE PAPER
This white paper outlines the latest operational analytics opportunities and challenges facing decision
makers responsible for managing risk and identifying fraud. It draws on IDC's research into big data
and analytics business and technology trends and provides recommendations for organizations
looking to improve their operational analytics initiatives. The paper also considers the role of workload-
optimized systems as a technology platform to enable operational analytics and describes the IBM
PureData System for Operational Analytics as one of the leading workload-optimized systems in the
market today.
SITUATION OVERVIEW
The convergence of intelligent devices, social networking, pervasive broadband networking, and
analytics is ushering in a new economic reality that is redefining relationships among producers,
distributors, and consumers of goods and services.
In the enterprise, these trends have resulted in a significant decrease in the ability of managers to rely
effectively on only experience or intuition to make decisions. The old cause-and-effect models are
becoming less relevant, while the demand to respond faster and with greater insight to ongoing
internal and external events based on facts is increasing.
In this environment, not only access to information but also the ability to analyze and act upon
information creates competitive advantage in business-to-business and business-to-consumer
commerce, enables sustainable management of communities, and promotes appropriate distribution of
social, healthcare, and educational services.
The newly available information opens unprecedented opportunities and challenges for organizations
to unlock its value. In 2012, $95 billion was spent worldwide on a range of business analytics software,
hardware, and services. New use cases, case studies, and market research have confirmed the value
of analytics. For example, a recent IDC study shows that 88% of organizations that have widely
deployed business analytics have recognized tangible benefits from these projects. In addition:
For 90% of these organizations, the benefits met or exceeded expectations.
For 82% of these organizations, the time to achieve quantified benefits met expectations or
was shorter than expected.
Analytical systems are being deployed across all industries and all key processes and activities of the
business. Organizations use analytics to examine the business and all its aspects — its people, its
customers, its finances, and its operations. Clearly, the drivers of big data and analytics solutions
range across business processes. But as shown in Figure 1, one of the top initiatives is "process and
operations optimization and control," the heart of operational analytics. And "product, service, or
program improvement and innovation" — the top initiative — is the goal of corporate initiatives to better
operations.
Page 3
©2013 IDC #245217 3
FIGURE 1
Significant Drivers of Big Data and Analytics Initiatives
Q. Which of the following areas have been identified as significant drivers of your organization's
big data and analytics initiatives over the next 12 to 24 months?
n = 700
Note: Remaining six drivers are not shown.
Source: IDC's Big Data and Analytics Maturity Model Survey, July 2013
Operational Analytics: Goals and Objectives
Organizations implement operational analytics to improve key operational processes. What do we
mean by "operations"? Operations includes all processes and activities involved in the design, build,
and delivery of a firm's products or services. As the nature of the products or services provided defines
an industry, the specific operational activities and processes vary from one industry to another. Yet the
common thread is that no organization can stay in business without ensuring reliable, efficient, and
cost-effective operations. Operational analytics is truly a bet-the-business activity.
What are the key decisions supported by operational analytics? An organization must ensure that its
operations can be executed in a predictable, reliable fashion. To achieve this goal, organizations must
be able to:
Assess risks of non-completion of a specific operation within the enterprise (i.e., operational risk) in
a time frame that can be as short as the time required to complete a transaction such as a credit
card approval or distributed across a supply chain network spanning suppliers and retail stores.
Monitor events to predict and detect a specific type of operational risk (e.g., the commission of
fraud by a stakeholder of value to the business, whether an employee, a customer, or a
supplier; the breakdown of mission-critical plant and equipment; or late or incomplete delivery
of goods and services promised to a customer).
0 10 20 30 40 50
Customer acquisition and/or retention
Process and operations optimization and control
Market and competitive intelligence
Pricing strategies and programs
Customer service and support
Product, service, or program improvement and innovation
(% of respondents)
Page 4
©2013 IDC #245217 4
Provide a view that aggregates and combines risks associated with a set of key activities
across functions or products (i.e., portfolio risk) or across the enterprise (i.e., enterprise risk).
The review of risk exposure may result in changes to operational policies and may be
mandated by government statute (i.e., regulatory compliance).
In today's fast-paced economic, social, and political environments, risk assessment and fraud detection
require continuous monitoring and analysis as well as the capability to act in near real time. This puts
stress on the technology infrastructure required to support these business requirements. Continuous
availability and scalability (large volumes of data, large volumes of repeatable decisions) must be ensured.
Operational Analytics: The Impact of Big Data
Operational decisions such as approving a credit card transaction, settling a vendor invoice, adjudicating a
claim, or identifying potential fraud are made repeatedly in an organization, up to millions of times a day.
The ability to leverage big data information assets is changing approaches to risk and fraud analytics.
What is big data, and how is it impacting risk and fraud analytics? Big data technologies describe a
new generation of technologies and architectures designed to economically extract value from very
large volumes of a wide variety of data by enabling high-velocity capture, discovery, and/or analysis.
Volume. Now it's possible to access data down to the most granular detail, such as every call
for a telco customer, every trade made for a specific security on behalf of each customer, or
product-level detail of every retail sale. This enables the analysis of how an individual tends to
behave (rather than general patterns across a group), and deviations from the established
patterns for that specific individual could signal fraud or operational risk. This granularity of
analysis requires a granularity of data only now possible via big data methods.
Variety. All forms of structured and unstructured data can be accessed, such as every tweet
referring to a company or product or every click on a Web commerce site. The unstructured
data helps provide context and confirmation related to the structured transactional data.
Unstructured data (e.g., comments by a customer or by a customer service agent about a
customer) can be monitored as an early indicator that precedes a change to a fraud risk
profile, attempt to commit fraud, or defection of a high-value customer. This type of analysis of
structured transactions with unstructured comments pertaining to or anticipating transactions
is now possible via big data methods.
Velocity: Live streams of data can be brought in and analyzed on the fly in support of
commercial fraud or operational, portfolio, and enterprise risk assessment within tight time
windows. The reduction in latency for data being analyzed (near real time) is now possible via
big data methods.
Value. Additional fraud and risk assessment algorithms run against detailed, varied, and/or
high-velocity data sets can predict potential fraudulent activities with greater accuracy,
reducing the number of false positives that can adversely impact customer relationships and
operational failure, reducing false negatives that can increase process costs. Such big data
approaches can be added to the portfolio of models currently being run. The lift in fraud
detection rates via big data methods over traditional techniques run against summarized or
sample data can demonstrate incremental value to the business.
Page 5
©2013 IDC #245217 5
Operational analytics can be tightly integrated with the transactions that run the business. Moreover,
the ongoing monitoring of events and decisions, as well as their outcomes, provides a broader view of
risk exposure across a portfolio or across a business. Business users can consume this information on
visual dashboards and explore underlying data in queries and reports. This ongoing review can lead to
recommended changes in operational policies such as credit approvals, claims adjudication, or
standard time-to-complete and labor assignments to execute activities in processes. This can be part
of a continuing effort seeking to optimize resource allocations, balancing risk-reward scenarios.
Big Data/Analytics Challenges
But organizations that are looking to optimize their use of big data and analytics technology are facing
several challenges. Table 1 highlights that only a minority of respondents indicated that their
organizations' big data and analytics technology capabilities meet their requirements. For example,
among all respondents, only 15% said that the scalability capabilities of their big data and analytics
technology meet requirements. Table 1 also shows the responses from organizations that identified
themselves as having achieved quantified results that exceeded expectations. For each big data and
analytics technology capabilities category shown in Table 1, the high achievers experience better
compliance with their big data and analytics requirements than the overall sample.
TABLE 1
Meeting Big Data and Analytics Technology Requirements (% of Respondents)
Q. To what extent do your organization's big data and analytics technology capabilities meet
its requirements?
To the fullest extent needed
Total High Achievers
Scalability (ease of expanding and contracting as needed) 15 29
Performance (speed of query response or data loading) 17 32
Reliability/availability 19 37
Manageability (tuning, upgrading, etc.) 14 27
Security 34 47
n = 700
Source: IDC's Big Data and Analytics Maturity Model Survey, July 2013
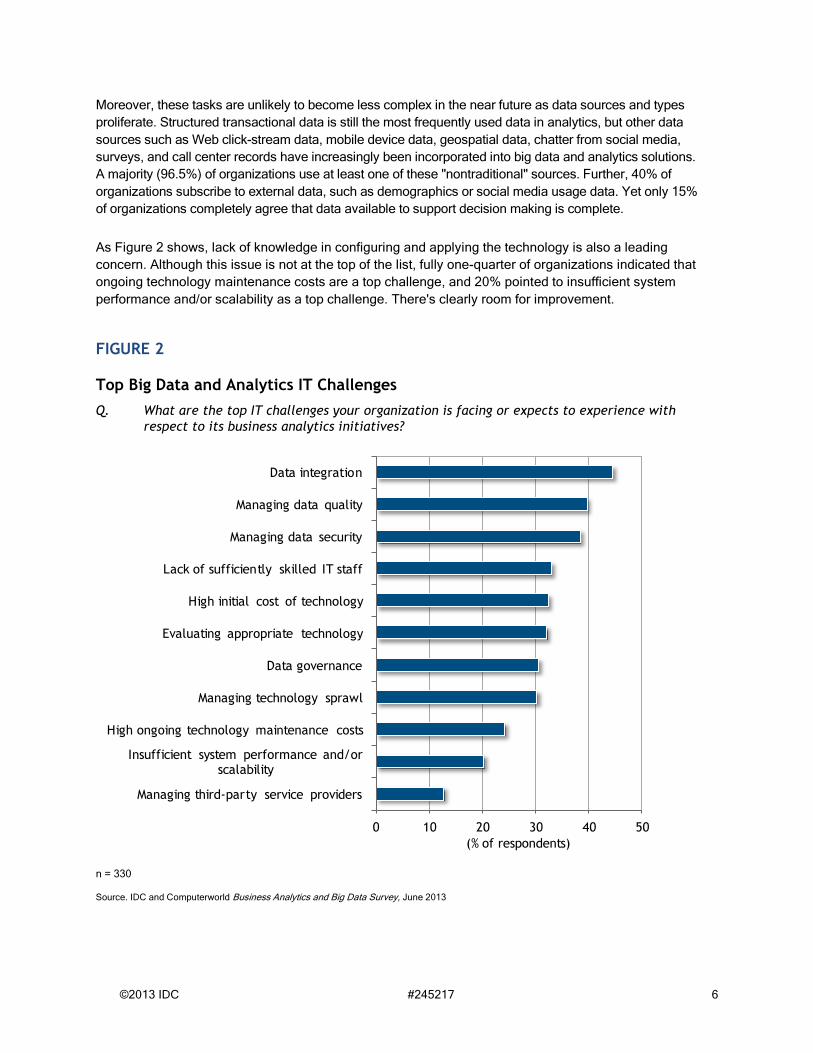
Figure 2 further highlights the challenges organizations face when trying to configure systems to run
an operational analytics workload. Given that about 80% of the effort in any analytics project is
managing and integrating data, it's worth noting that the leading issues are data preparation and
management-related tasks — data integration, managing data quality, and managing data security.
These continue to be the most challenging issues for most organizations.
Page 6
©2013 IDC #245217 6
Moreover, these tasks are unlikely to become less complex in the near future as data sources and types
proliferate. Structured transactional data is still the most frequently used data in analytics, but other data
sources such as Web click-stream data, mobile device data, geospatial data, chatter from social media,
surveys, and call center records have increasingly been incorporated into big data and analytics solutions.
A majority (96.5%) of organizations use at least one of these "nontraditional" sources. Further, 40% of
organizations subscribe to external data, such as demographics or social media usage data. Yet only 15%
of organizations completely agree that data available to support decision making is complete.
As Figure 2 shows, lack of knowledge in configuring and applying the technology is also a leading
concern. Although this issue is not at the top of the list, fully one-quarter of organizations indicated that
ongoing technology maintenance costs are a top challenge, and 20% pointed to insufficient system
performance and/or scalability as a top challenge. There's clearly room for improvement.
FIGURE 2
Top Big Data and Analytics IT Challenges
Q. What are the top IT challenges your organization is facing or expects to experience with
respect to its business analytics initiatives?
n = 330
Source. IDC and Computerworld Business Analytics and Big Data Survey, June 2013
0 10 20 30 40 50
Managing third-party service providers
Insufficient system performance and/or scalability
High ongoing technology maintenance costs
Managing technology sprawl
Data governance
Evaluating appropriate technology
High initial cost of technology
Lack of sufficiently skilled IT staff
Managing data security
Managing data quality
Data integration
(% of respondents)
Page 7
©2013 IDC #245217 7
Address New Requirements
Technology management expertise is clearly needed, as are analytics expertise and the ability to address
frequently changing requirements. In today's environment, operational analytics are run by analysts and
data scientists and involve a significant amount of experimentation and ad hoc discovery. 45% of
organizations indicated that they lack the sufficient number of staff with appropriate analytics skills. 35%
indicated that defining business requirements is a top big data and analytics business challenge.
There is an opportunity to use new metrics, new analytics, and new data to derive the most value from
big data and analytics solutions, and IT and business managers need to collaborate to make this
happen. Best-in-class organizations don't use their data just to ask who, what, and when. They utilize a
combination of descriptive, predictive, and prescriptive analytics to delve into questions of why, where,
in what mood, what's next, and why now.
Table 2 highlights the impact of breaking away from the status quo and using new metrics, new analytics
techniques, and new data in various combinations. When we looked at responses from organizations
where quantified benefits from big data and analytics projects exceed expectations, we found that of those
who do nothing new, only 6% fall into this high achievers group. This research suggests that using all
three new parameters (metrics, analytics, and data) is most effective (26% of this group indicated their big
data and analytics benefits exceeded expectations). Barring the resources, time, or ability to do all three,
the next best option is to focus on new analytic techniques and new data.
TABLE 2
Impact of New Approaches to Big Data and Analytics
Q. How has the type of data analysis performed in your organization changed in the past
12–24 months?
Q. In aggregate, what type of benefits has your organization achieved from recent big data
and analytics projects?
Scenarios
1 2 3 4 5 6 7 8
New metrics
or KPIs
Y Y Y Y
New analytic
techniques
Y Y Y Y
New data Y Y Y Y
None Y
Quantified
benefits
exceeded
expectations
26% 23% 21% 10% 15% 19% 15% 6%
n = 700
Source: IDC's Big Data and Analytics Maturity Model Survey, July 2013
Page 8
©2013 IDC #245217 8
Operational Risk and Fraud Analytics in Retail
Retail presents myriad opportunities for reducing organized crime fraud and operation and portfolio risk
through operational analytics. It is among the topmost industries where the volume, velocity, and variety of
enterprise, social, and external data present nettlesome big data and analytics challenges —and
opportunities if these three Vs are managed. As retailers run more of their operations with real-time data
and with new types of data (e.g., streaming store video), there are more opportunities to apply big data and
analytics to real-time decision making. Real-time retail data and the development of real-time operational
control practices are increasing the types of use cases for — and value from — fraud and risk analytics.
Table 3 provides examples of retail applications of operational fraud and risk analytics.
TABLE 3
Retail Applications of Operational Fraud and Risk Analytics
Use case Product freshness and
quality assurance
Organized retail crime (ORC) Social media monitoring
Business
issue example
Grocers and other sellers of chilled
and frozen food running large and
complex cold chain networks are
exposed to risk from product
spoilage when temperatures in
trucks, warehouses, and store
freezer cases exceed maximum
tolerance. Risks include increased
spoilage and handling costs, lost
sales, and customer health and
safety concerns.
Real-time monitoring of thermostat
data across the cold chain network
can spot cold chain breakdowns
and the responsible party. Real-
time analysis of equipment data
(condition monitoring) can predict
failure to prevent spoilage and its
risks.
Conducted by regional or national
criminal enterprises, ORC costs
U.S. retailers $30 billion,
representing 1.5% of sales and
$300 per household. ORC cases
are complex and costly to crack
and outstrip means and resources
of traditional loss prevention
organizations.
Defeating ORC requires a big
data and analytics approach:
collection and analysis of
streaming video, incident reports,
criminal complaints, arrest
records, photos, credit card and
ecommerce transactions, RFID
data, and product lot codes and
serial numbers.
It's not enough to spot upset vocal,
influential customers posting and
tweeting their displeasure with a
brand experience. Managing
brand integrity requires quickly
deciding the right approach to
each instance of customer
dissatisfaction and discovering
and correcting the root cause of
customer dissatisfaction.
Crafting an optimal response
requires analyzing the customers'
latest transactions, value as a
customer, shopping behaviors and
preferences, social influence, and
the root cause of the
dissatisfaction and predicting the
customers' response to alternative
replies.
Potential
benefits
Reduced spoilage, recall,
handling, and maintenance
costs
Increased sales
Reduced customer health claims
Supplier compliance
Reduced shrink (theft) and
product handling cost
Increased sales
Lower investigation and
prosecution costs
Reclaimed voice-of-brand
influence
Customer satisfaction
Detection and correction of
dissatisfaction factors
Source: IDC, 2013
Operational Risk and Fraud Analytics in Banking
Regulatory pressure and oversight resulting from the financial and economic upheavals of the past decade
and the first three years of the current decade have been prime motivators for operational risk management
investments. Risk IT strategies and investments remain critical as policymakers around the globe stay
focused on capital buffers, trade transparency, accounting and reporting improvements, internal control and
IT system continuity, third-party risk, financial crime and fraud, and the impact of cyber-threats on the safety
Page 9
©2013 IDC #245217 9
and soundness of the banking market and the financial marketplace overall. Worldwide, of the $71.2 billion
projected to be spent by the financial services industry on technologies and services for risk management in
2014, $49 billion will be spent on managing operational risks — $26 billion specifically by bankers.
Fraud management in banking, as well as the associated analytic solutions, data, IT infrastructure, and
business process, is just one form of operational risk management. The increased sophistication of fraud
actors, the complexity of the threats, and the possible scalability of fraud attacks and losses have place
advanced, predictive analytic solutions at the center of fraud defenses and mitigation strategies for many
institutions. These new capabilities allow institutions to get beyond the small percentage of transactions
(real-time or otherwise) discovered and analyzed today to a much larger number with ample time to take
appropriate actions.
Table 4 provides examples of banking applications of operational fraud and risk analytics.
TABLE 4
Banking Applications of Operational Fraud and Risk Analytics
Use case Know your customer/
anti–money laundering (KYC/AML)
Predictable cyber-defenses (PCDs) Integrated risk management (IRM)
Business
issue
example
The operational risk regimes
surrounding AML fraud and KYC
requirements continue to evolve and
expand across multiple dimensions.
Each year, AML compliance covers
more geography, more business
entities, more relationships, more
transaction types, and more
processes across the financial
supply chain.
To fulfill the increasing
requirements, bankers require
solutions to monitor and analyze
transactions in real-time across
multiple channels and identities to
predict fraudulent interactions and,
at the very least, spot suspicious
activities in process. In real time,
banks require the ability to identify
entities and transactions of a
suspicious nature and accurately
assess the level of threat, potential
loss, and compliance requirement.
Bank defenses against cyber-
attacks are evolving at a slower
pace than the attacks themselves,
resulting in ever-increasing
frequency and scale of attack and
the probability of success over
time. Advanced threats are
increasingly targeting the digital
channels of financial institutions,
with an evolving set of motivations.
Banks require a shift in thinking in
how to defend against cyber-
threats. Today's "react and
remediate" approaches are
becoming less effective and must
be enhanced with predictive
analytic solutions that enable an
institution to get ahead of the
attack, assessing the risk before
the attack occurs.
Integrated risk management is the
goal of all bank CEOs as their
institutions face financial harm or
exposure as a result of failures in
operational business processes,
breakdowns in internal control,
system failures, as well as credit
and market events driven by
internal or external forces. To date,
traditional GRC solutions have
been only partially effective in
managing these risks primarily
because of the offline, point-in-time
nature of these platforms.
Banks require analytic solutions for
IRM that can simplify and
streamline access to structured and
unstructured data in real time,
govern risk analytics models, and
provide personalized visualization
of metrics and events, with a
centrally managed repository of
trusted financial risk data.
Potential
benefits
Improved insight into money
movement
Early warning of the potential
of bad actors and necessary
reporting requirements
Reduced false positives,
missed negatives, and
compliance failures
Risk data management
Foresight into criminal
elements and motivations
Reduced impact of service
attacks
Reduced likelihood of
productivity, brand, and
monetary losses
Correlation of risk events
across disparate operational
data stores and systems
Holistic views of risk events and
metrics that can be personalized
to line-of-business, staff, or
executive levels
Single source of defensible
operational risk data
Source: IDC, 2013
Page 10
©2013 IDC #245217 10
Operational Risk and Fraud Analytics in Healthcare
Fraud, waste, and abuse are estimated to constitute 30% of the U.S. healthcare industry's spending.
This is a massive figure given that America's National Health Expenditure is projected to exceed
$3 trillion in 2014 (according to the Centers for Medicare & Medicaid Services). While definitions vary,
it is clear that the greatest leakage is not from intentional fraud; rather, it is from waste and abuse.
Outright fraud constitutes between 3% and 10% of total healthcare spend. Across all three categories
of leakage, healthcare payers have traditionally relied on labor-intensive, manual "pay and chase"
recovery processes with limited return on investment (ROI). The healthcare payer industry consensus
is that pressure to reduce medical costs and administrative costs and improve service to and
satisfaction among members is only increasing, which has cast a spotlight on analytics solutions that
offer health plans opportunities to reap greater benefits from pre-pay prevention and education.
Payers are increasingly adopting analytics tools in the claims pre-adjudication, adjudication, and
payment processes. Rapidly evolving analytics tools and techniques include decision trees, network
analysis, clustering, and anomaly detection. These solutions are particularly valuable for payers in
managing their provider contracts and individual providers. Analytics engines are being supported by
expanding libraries of business rules, which integrate the lessons learned from hard experience into
pre-pay prevention techniques. These solutions are being integrated into case management tools that
support and automate workflows by the resources that payers employ to manage claims processing
and special investigations. Armed with better tools to prevent leakage, health plans can limit the
impact of fraudulent providers, new fraud schemes, market disruptions, common claims errors, and
ineffective medical procedures. Healthcare payers then can move with greater aggressiveness into
participation with state and federal health exchanges, modification of provider networks,
implementation of ICD-10, and investments in accountable care initiatives.
Page 11
©2013 IDC #245217 11
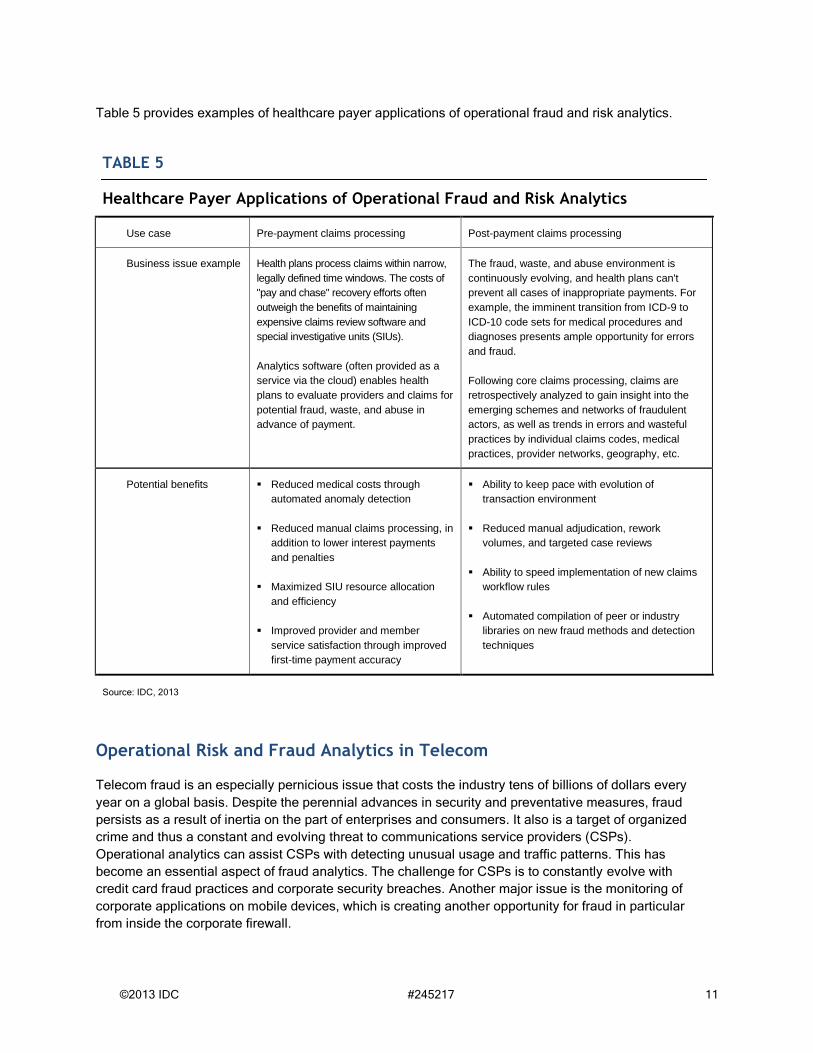
Table 5 provides examples of healthcare payer applications of operational fraud and risk analytics.
TABLE 5
Healthcare Payer Applications of Operational Fraud and Risk Analytics
Use case Pre-payment claims processing Post-payment claims processing
Business issue example Health plans process claims within narrow,
legally defined time windows. The costs of
"pay and chase" recovery efforts often
outweigh the benefits of maintaining
expensive claims review software and
special investigative units (SIUs).
Analytics software (often provided as a
service via the cloud) enables health
plans to evaluate providers and claims for
potential fraud, waste, and abuse in
advance of payment.
The fraud, waste, and abuse environment is
continuously evolving, and health plans can't
prevent all cases of inappropriate payments. For
example, the imminent transition from ICD-9 to
ICD-10 code sets for medical procedures and
diagnoses presents ample opportunity for errors
and fraud.
Following core claims processing, claims are
retrospectively analyzed to gain insight into the
emerging schemes and networks of fraudulent
actors, as well as trends in errors and wasteful
practices by individual claims codes, medical
practices, provider networks, geography, etc.
Potential benefits Reduced medical costs through
automated anomaly detection
Reduced manual claims processing, in
addition to lower interest payments
and penalties
Maximized SIU resource allocation
and efficiency
Improved provider and member
service satisfaction through improved
first-time payment accuracy
Ability to keep pace with evolution of
transaction environment
Reduced manual adjudication, rework
volumes, and targeted case reviews
Ability to speed implementation of new claims
workflow rules
Automated compilation of peer or industry
libraries on new fraud methods and detection
techniques
Source: IDC, 2013
Operational Risk and Fraud Analytics in Telecom
Telecom fraud is an especially pernicious issue that costs the industry tens of billions of dollars every
year on a global basis. Despite the perennial advances in security and preventative measures, fraud
persists as a result of inertia on the part of enterprises and consumers. It also is a target of organized
crime and thus a constant and evolving threat to communications service providers (CSPs).
Operational analytics can assist CSPs with detecting unusual usage and traffic patterns. This has
become an essential aspect of fraud analytics. The challenge for CSPs is to constantly evolve with
credit card fraud practices and corporate security breaches. Another major issue is the monitoring of
corporate applications on mobile devices, which is creating another opportunity for fraud in particular
from inside the corporate firewall.
Page 12
©2013 IDC #245217 12
Table 6 provides examples of telecom applications of operational fraud and risk analytics.
TABLE 6
Telecom Applications of Operational Fraud and Risk Analytics
Use case PBX hacking/international
call fraud
Identity theft Unauthorized account access
Business issue example Two of the most prevalent
forms of telecom fraud
involve breaking into
enterprise PBX or IP CPE.
This type of telecom fraud
can be used to compromise
employee mailboxes but is
mostly used to gain access to
international calling utilizing
the company's billing system.
The intruders not only can
use the company for costly
international calls but also
can resell access to the PBX
and rack up huge bills.
Regular monitoring of call
patterns and maintenance of
the PBX access procedures
are essential. Regular
updates to the PBX software
or modernization, regular
password management, and
deactivation of unused
accounts are essential.
The use of false or stolen
credit card information is a
major and ongoing fraud
issue. Organized crime
syndicates will buy prepaid
cards in high volume for
resale.
Resale of access codes for
costly international calls is
another major use of
corporate calling cards that
can go undetected for
months or even years.
Regular monitoring of call
patterns and automated
alerts will curb fraud and flag
unauthorized usage.
Unauthorized access to
various programs and call
detail records is a violation of
privacy and can be costly to
the end user if a change is
made to the account.
Hacking of SIM cards such
as creating WiFi hotspots
and access to the network for
multiple devices is a costly
drain to CSPs.
Hacking of IP voice networks
for international call fraud via
unauthorized apps can be
costly to enterprises.
Potential benefits Reduced risk of the loss of
confidential information
via voicemail hacking
Reduced cost of
expensive international
calls by blocking
unauthorized use
Regular CPE monitoring
that leads to reduced opex
costs by modernizing
outdated equipment
Automated alerts that are
essential to reducing long-
term fraud
Regular consulting with
users to detect unusual
call patterns and provide
optimal usage plans
Automated monitoring or
regular audits of usage
plans, mobile devices, and
corporate applications to
reduce unauthorized
access
Demographic profiles and
predictive analysis to
identify and curb unusual
usage patterns
Source: IDC, 2013
Page 13
©2013 IDC #245217 13
Addressing the Issues via Workload-Specific Integrated Systems
Historically, teams deploying analytic applications have relied on manual, fragmented management
processes and tools that often slow time to market, result in lost revenue and unexpected downtime,
and create employee productivity problems. Customers indicate that integrated systems can radically
simplify deployment by taking time, cost, and complexity out of this process. Technology must enable
rapid time to market, support for a range of workload-specific use cases, and optimal use of limited
human resources.
Manufacturers in the technology industry are responding by delivering workload-specific pre-integrated
systems. With an integrated system, the expertise is built in, easing installation and deployment at the
customer site.
Integrated systems that incorporate processors as well as storage, networking, and software
components are engineered by the manufacturer for specific workloads. An analytic workload, for
example, requires ingestion of, integration with, and access to large amounts of data in order to
identify trends that have occurred or predict or assess the likelihood of future events. By contrast, a
transactional workload requires the creation/insertion of a data record or access to an existing record
via an index for update or deletion. These differences are significant in terms of the type of
configuration required, including the level of scalability and availability needed.
Technology suppliers that put together and deliver such purpose-built systems incorporate expertise
on usage patterns into the design and manufacture of the system. Integrated systems can become
even more specialized as patterns for application usage can be built in, differentiating customer
analytics from operational analytics, for example. In addition, substituting pre-built integration for
do-it-yourself approaches can lead to potential productivity gains for the buyer, resulting in fast
installation, easy operations, and the opportunity to leverage existing human resources elsewhere in
the organization. Additional savings can result from optimized configurations that make the best use of
the available system resources.
Further, for any integrated system, a key advantage is a single point of support by the IT vendor,
replacing multiple suppliers where there can be no real clarity with regard to who is responsible for
addressing system failures or malfunctions. The reliance on a single vendor for support when a
problem arises results in faster remediation of system issues and the reduction of downtimes.
One of the workload-optimized solutions to support and enable operational analytics is IBM PureData
System for Operational Analytics. This solution, along with other IBM PureData System models and
related information management and analytics technology, forms the core of IBM's Big Data Platform.
IBM PureData System for Operational Analytics
IBM supplies workload-optimized converged systems — PureData Systems — that are part of the
PureSystems family of expert integrated systems. One of the PureData Systems is specifically
designed for operational analytics, such as risk and fraud analysis and investigation.
Page 14
©2013 IDC #245217 14
IBM describes the PureData System for Operational Analytics pre-configured system as "a data
warehouse system for delivering insights into business operations for real-time decision making." It is
designed for the continuous ingestion of operational data, even streaming data for near-real-time data
access — simplifying operations for such a demanding workload. Given the need to access the system
during operations, even within a transaction, system availability is a design point with integrated
backup/restore provided for recoverability. Performance on analytics is enhanced by in-database
processing of analytical models, based on the approach that bringing the models to the data is more
efficient than bringing the data to the models. Moreover, the use of compression and columnar access
designed for analytics results in the ability to store much more data per storage array — a significant
cost consideration.
Further specialization is enabled through the definition of patterns at the infrastructure level and the
application level. These patterns can be specified by IBM or its partners or customers. The patterns
provide a means to capture the learning from projects in a manner that can be replicated at other sites.
The result is the reduction of specialized expertise required and the shortening of time for configuration
and installation, resulting in faster time to benefit.
CHALLENGES/OPPORTUNITIES
There is a significant opportunity in meeting demand for operational analytics workloads, especially
because they differ from industry to industry. Therefore, a purpose-built system for operational
analytics is valuable; layering application patterns on top would make it even more valuable.
But there are challenges. The PureData System for Operational Analytics is designed to handle "big data"
sets (high volume, variety, velocity), and that's important. But we are still in early days for fraud and risk
analytics with big data. Companies will need references in their industry. They will also seek ROI
benchmarks to help them make a business case for this investment. In the case of big data implementations,
the ROI must be incremental — that is, what is the added benefit over conventional approaches, taking into
account any added costs for managing, storing, and maintaining much larger and more diverse data sets?
This challenge represents an opportunity. As IBM supports more installations, it can build up a library of
patterns for operational analytics within specific industries that can provide a closer fit with a customer's
specific requirements, reducing the amount of tailoring required for a specific implementation.
IBM is leveraging the experience of more than 500 clients and more than 10 years of development to
provide a usable blueprint for both business and IT communities to accelerate analytics solutions. It
packaged this expertise and industry knowledge in the form of logical data models for specific
industries (IBM Industry Models) and physical data models for specific use cases, which can be
leveraged by PureData System for Operational Analytics.
For more information about IBM's industry and data models, please explore the following Web pages:
http://www-01.ibm.com/software/data/industry-models/
http://www-01.ibm.com/software/data/infosphere/warehouse/packs/
Page 15
©2013 IDC #245217 15
CONCLUSION
Increasingly, the decision to acquire and utilize the appropriate technology will be influenced by
line-of-business (LOB) managers. The latest IDC research indicates that just over 50% of new IT
investments in 2013 will involve the direct participation of LOB executives; by 2016, that number will
rise to 80%, with LOBs taking the lead decision-maker role in half or more of those investments. This
trend puts new pressure on already stretched IT resources. In today's highly demanding environment
for self-service operational analytics, IT needs to be able to react quickly and be ready to address
evolving requirements.
To do so, IT leaders need to:
Assess and evaluate the typical operational analytics use cases and resulting workloads.
There's a difference among tactical, operational, and strategic decision-making patterns.
Understand the unique requirements of the various decision-maker groups: executives,
managers, analysts, data scientists, customer-facing employees, and customers. Each has
different preferences for technology tools, data, velocity (currency) of data, patterns of
interaction with the data, and scope of decision freedom.
Recommend the most appropriate big data and analytics technology. This should be done
after workloads and use cases are defined based on variables such as data types and
sources, concurrent users, query complexity, expected scalability requirements, and security
needs.
Consider workload-optimized integrated systems as a viable option in the broader technology
portfolio to support operational analytics needs. Adoption of integrated systems, or appliances,
is growing. IDC research shows that 14% of organizations today have deployed an integrated
system for BDA and another 15% plan to do so within the next 12 months. Importantly, the rate
of adoption of integrated systems among organizations that achieve BDA ROI within 6 months
is 33% — twice the rate of the total sample size.
Consider factors such as power consumption, capacity, scan rates, availability, performance
(both query and load speeds), and maintenance and administration costs when evaluating
integrated systems.
RELATED RESEARCH
IDC Predictions 2013: Competing on the 3rd Platform (IDC #238044, November 2012)
IDC and Computerworld Business Analytics and Big Data Survey, June 2013
IDC's Big Data and Analytics Maturity Model Survey, July 2013
Delivering OLTP Database Technology Aimed at Optimal Business Outcomes: IBM PureData
for Transactions (IDC #242818, September 2013)
Page 16
About IDC
International Data Corporation (IDC) is the premier global provider of market intelligence, advisory
services, and events for the information technology, telecommunications and consumer technology
markets. IDC helps IT professionals, business executives, and the investment community make fact-
based decisions on technology purchases and business strategy. More than 1000 IDC analysts
provide global, regional, and local expertise on technology and industry opportunities and trends in
over 110 countries worldwide. For more than 48 years, IDC has provided strategic insights to help our
clients achieve their key business objectives. IDC is a subsidiary of IDG, the world's leading
technology media, research, and events company.
Global Headquarters
5 Speen Street
Framingham, MA 01701
USA
508.872.8200
Twitter: @IDC
idc-insights-community.com
www.idc.com
Copyright Notice
External Publication of IDC Information and Data — Any IDC information that is to be used in advertising, press
releases, or promotional materials requires prior written approval from the appropriate IDC Vice President or
Country Manager. A draft of the proposed document should accompany any such request. IDC reserves the right
to deny approval of external usage for any reason.
Copyright 2013 IDC. Reproduction without written permission is completely forbidden.
dgarven
Typewritten Text
WAL12413-USEN-00