OPERATIONAL PERFORMANCE
ANALYSIS OF SELECTED PUBLIC
SECTOR BANKS - A STUDY Dr B Parashuramulu1
Dr D Harikanth2 Abstract
The operational performance in commercial banks can be evaluated by using a
measure, i.e., operating profit, spread, burden, net profit, and average and growth rate is taken
for the present study. The information on operational performance is useful to the
management for planning, decision making and control. This will enable the management to
exercise control over the day to day operations with a view to ensuring maximum efficiency
and adherence to the plans of management. Operating profit is the excess of operating income
over operating cost. This paper an attempts to analyze the operational performance analysis
of selected public sector banks a study during the period from 2008-09 to 2017-2018. The
study is diagnostic and exploratory in nature and makes use of secondary data.
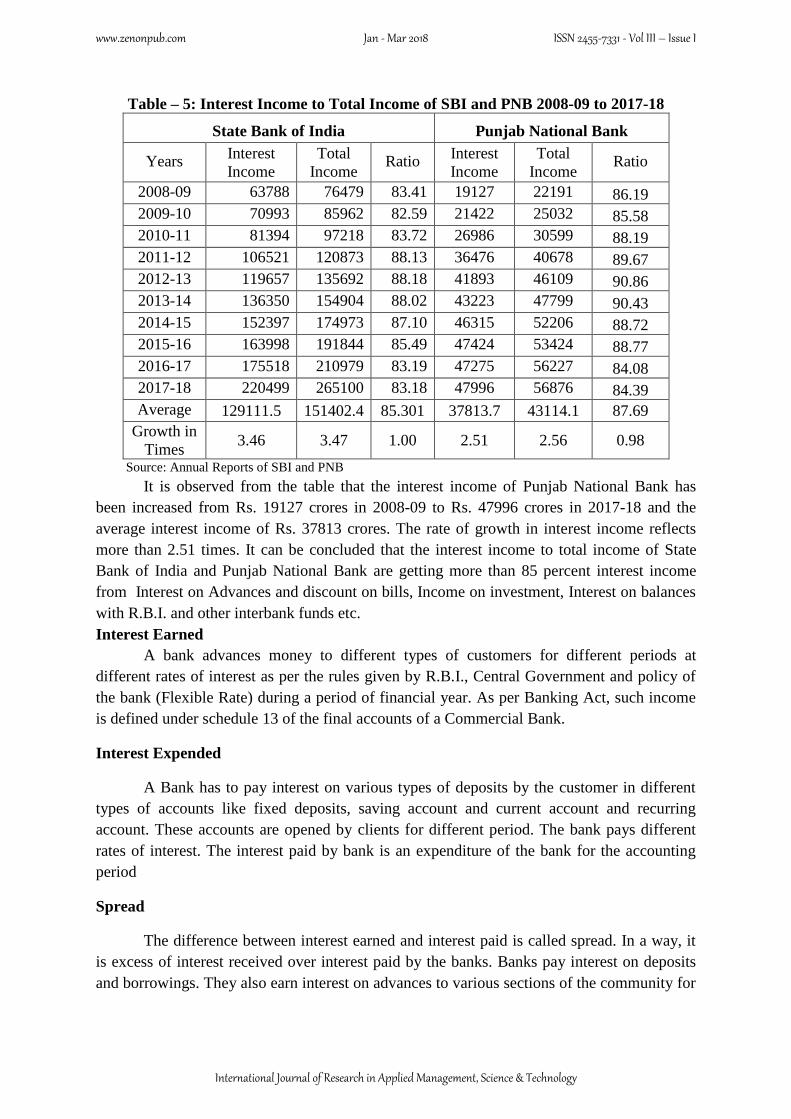
The study finds and concludes that the operating profit, Total income, Interest income
and other income of State Bank of India is improved when compare to Punjab National Bank.
It can be concluded that both the banks are more depend on interest income. Hence, banks are
need put efforts more to increase other income like commission, Exchange services, etc.
Keywords: Operating Expenses, Operating Profit, Total Income, Spread and Burden.
Introduction
The Indian banking system is most popular and secular due to its structure and
functions. The banking system consist a major portion in Indian financial system. Financial
crisis, devaluation of money etc does not affect our banking system so badly as compared to
other countries. It is also a reason for increase the operation of foreign banks in India. India is
considered as best platform for banking operation. In present situation there are many
commercial banks, co operative banks, rural banks operating in India.
The general health of a bank is determined by health of its earnings. Earnings are
considered the most sensitive of all financial indicators to change in a firm's financial health.
Banks are generally considered different from general profit making enterprises.The
operational performance in commercial banks can be evaluated by using a measure, i.e.,
1 Assistant Professor, Department of Commerce, Satavahana University, Karimnagar, India 2 Head, Department of Commerce, Satavahana University, Karimnagar, India
www.zenonpub.com Jan - Mar 2018 ISSN 2455-7331 - Vol III – Issue I
International Journal of Research in Applied Management, Science & Technology
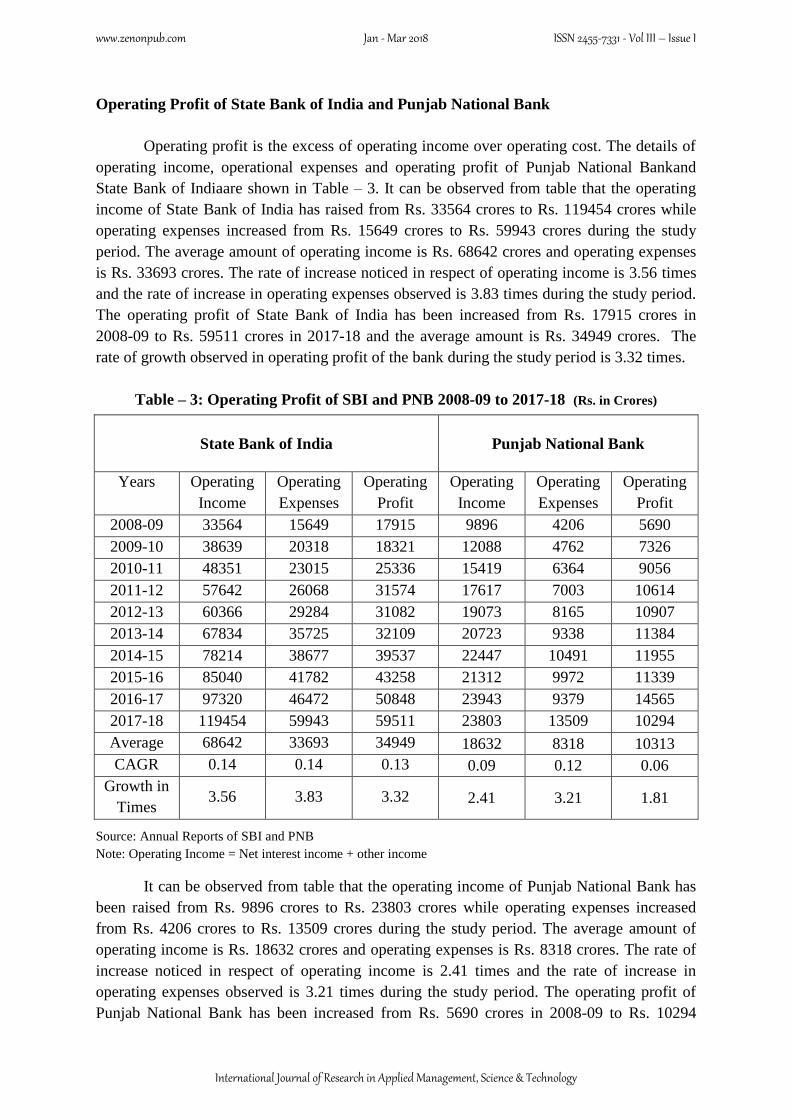
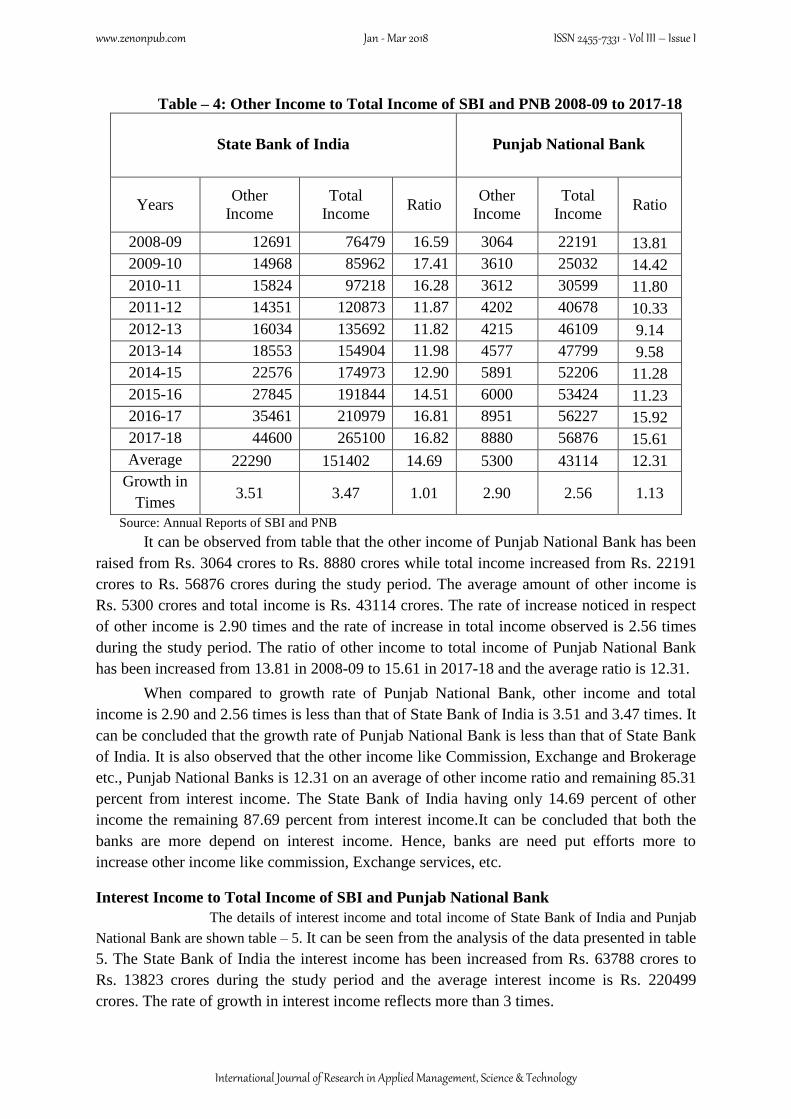
operating profit. To study the efficiency of the banks, Financial Statements - Balance Sheet
and Profit and Loss Account –are the basis. The financial statements are indicators of two
important factors of the bank which are profitability and financial soundness. The operational
performance of banking sector has long been at the center of academic research and has
received a substantial amount of attention. The evaluation of operational performance has
always been a major concern in banking sector. It also focused on operational efficiency in
terms of cost analysis.
Review of Literature
As the present study is concerned with the “Operational Performance Analysisof
SelectedPublic Sector Banks– A Study”, an attempt is made to review in brief the earlier
studies relating to banking activities so as to gain greater insight into the subject. Some of the
relevant studies which are concerned with the Performance of Public Sector Banks - A Study
of Select banks are presented briefly.
GurpreetKaur (2015)1written an article entitled “Performance Analysis: A Study Of
Public Sector &Private Sector Banks In India”, The main objective of this article is to make
an evaluation of the financial performance of Indian Banks .The financial performance of a
bank is measured by a number of key indicators with reference to Deposits, Advances, Total
Income, Investment and Net Profit etc. Recommendations and suggestions have been given
for improving the performance of Banks in India.
CA. Ruchi Gupta (2014)2, written an article entitled “An Analysis of Indian Public
Sector Banks Using Camel Approach”, In this paper an attempt is made to discuss the
progression of an economy is significantly dependent upon deployment as well as optimum
utilization of resources and most importantly operational efficiency of the various sectors, of
which banking sector plays a very vital role. Banking sector helps in stimulation of capital
formation, innovation and monetization in addition to facilitation of monetary policy. It is
imperative to carefully evaluate and analyses the performance of banks to ensure a healthy
financial system and an efficient economy.
Shobhana (2010)3examined “Operational Efficiency of Public Sector Banks in
India”. The study revealed that out of 27 public sector banks in India, only 9 banks have
1GurpreetKaur, “Performance Analysis: A Study Of Public Sector &Private Sector Banks In India”,
ISSN No 2349-3402 Vol 2 (1) 2015
2CA. Ruchi Gupta “An Analysis of Indian Public Sector Banks Using Camel Approach” ISOR Journal of Business Management, e –ISSN: 2278-487X, p-ISSN: 2319-7668,Volume 16, Issue 1,pp 94- 102.
3. V. K. Shobhana, “Operational Efficiency of Public Sector Banks in India – A Non – Parametric Model”, Journal of Accounting and Finance, 24 (2), April-Sep 2010, p. 85-96
www.zenonpub.com Jan - Mar 2018 ISSN 2455-7331 - Vol III – Issue I
International Journal of Research in Applied Management, Science & Technology
achieved high level of efficiency in its operations with the oriental bank of commerce at the
top. It is found that factors such as size of assets, network of branches and staff strength do
not have significant influence over operational efficiency of banks
Objectives of the Study
To evaluate the operating expenses and operating profit of selected banks
To analyze the spread and burden of selected banks
Data Collection and Methodology
The study is based on secondary data collected mainly from annual reports of Punjab
National Bank and State Bank of India. The data has been suitably arranged, classified,
analysed and tabulated according to the requirements of the study. For analyzing the data
using with MS – Excel the techniques like trends, ratios, compound annual growth rate, and
averages have been used.
Period of the Study
The relevant data of the selected banks for the purpose of the study was collected for a
period of ten years from 2008-09 to 2017-18.
Scope of the Study
The present study is confined to the operational performance of selected banks only. The
study covered important operational aspects of selected banks in relation to funds, expenses,
income and profit of selected banks.
Limitation of the Study
The study used the secondary data for analysis and interpretation which is collected
from the published annual reports of the banks. Therefore, the accuracy of the data depends
on the accuracy ensured in the data presented in the annual reports.
Components of Operational Expenses
The expenses in banking operations are varying from item to item. Most of the
operating expenses in the commercial banks are fixed in nature. To know the importance of
expenditure items, an attempt has been made to examine the various components in the
operating expenses of selected banks. Broadly, the components of operating expenses in
commercial banks include compensation to employees, administration expenses, management
expenses, business promotion expenses and depreciation on assets. Compensation to
employees is composed of salaries and allowances paid to employees and also other
expenditure related to employees. The administration expenses include rent, taxes on
buildings, postage and telegrams, repairs and maintenance, printing and stationary, insurance
and other expenses. Management expenses consist of director’s fees and allowances,
www.zenonpub.com Jan - Mar 2018 ISSN 2455-7331 - Vol III – Issue I
International Journal of Research in Applied Management, Science & Technology
auditor’s fees and expenses, and legal charges. Business promotion expenses comprised of
advertisement about the banking operations, and then the depreciation on the assets consists
of the expired cost of bank’s furniture and other fixed assets of the bank.
Components of Operating Expenses of State Bank of India
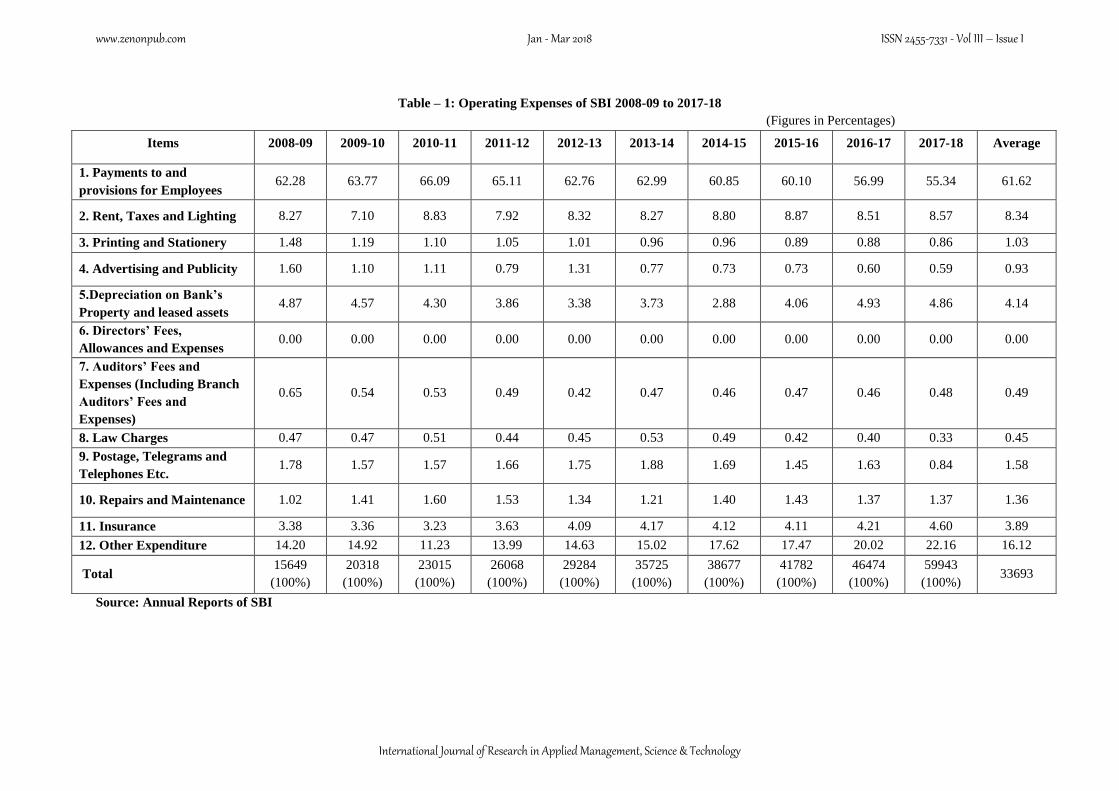
It can be observed from the Table – 1 that the major component of operating
expenses is compensation to employees. Its percentage ranged from 62.28 to 55.34 during the
study period and the average percentage is 61.62. This shows out of the total operating
expenses of the bank, more than 60% are relating to employees’ cost. It is observed that total
operating expenses of the bank has been raised from Rs. 15649 crores in 2008-09 to Rs.
59943 crores in 2017 -18 and the rate of increase noticed is 3.81 times. During the same
period the percentage of administrative expenses raised from 30.13 in 2008-09 to 38.40 in
2017-18 and the average percentage is 32.25. The analysis of operating expenses reveals that
the employees’ cost and administration expenses are constituted a 93.75% of the operating
expenses of the bank. The management expenses, business promotion expenses and
depreciation on assets of the bank during the study period, on an average, are 6.25% of the
operating expenses.
Components of Operating Expenses of Punjab National Bank
The details of component wise operating expenses of Punjab National Banks shown in
Table – 2 reveals that almost all the components of the operational expenses have more or
less the same proportion in the operating expenses during the study period. It is observed that
total operating expenses of Punjab National Bank has been raised from Rs. 4206 crores in
2008-09 to Rs. 13509 crores in 2017-18 and the rate of increase noticed is 3.21 times. It can
also be observed from table that the major component of operating expenses is compensation
to employees. Its percentage ranged from 57.79 to 70.09 during the study period and the
average percentage is 67.18. This shows out of the total operating expenses of the bank more
than 67% are relating to employees cost. During the same period the percentage of
administrative expenses increased from 23.95 in 2008-09 to 26.35 in 2017-18 and the average
percentage are 26.92. The management expenses, business promotion expenses and
depreciation on assets of the bank during the study period, on an average, are 6.89% of the
operating expenses. The analysis of operating expenses reveals that the employees’ cost and
administration expenses are constituted 93.11% of the operating expenses of the bank.
Out of the total operating expenses of both the banks are more than 60 percent
relating to employee cost. Banks are concentrated to reduce the employees cost,
administrative and other expenses and improve the technological development.
www.zenonpub.com Jan - Mar 2018 ISSN 2455-7331 - Vol III – Issue I
International Journal of Research in Applied Management, Science & Technology
Table – 1: Operating Expenses of SBI 2008-09 to 2017-18
(Figures in Percentages)
Items 2008-09 2009-10 2010-11 2011-12 2012-13 2013-14 2014-15 2015-16 2016-17 2017-18 Average
1. Payments to and
provisions for Employees 62.28 63.77 66.09 65.11 62.76 62.99 60.85 60.10 56.99 55.34 61.62
2. Rent, Taxes and Lighting 8.27 7.10 8.83 7.92 8.32 8.27 8.80 8.87 8.51 8.57 8.34
3. Printing and Stationery 1.48 1.19 1.10 1.05 1.01 0.96 0.96 0.89 0.88 0.86 1.03
4. Advertising and Publicity 1.60 1.10 1.11 0.79 1.31 0.77 0.73 0.73 0.60 0.59 0.93
5.Depreciation on Bank’s
Property and leased assets 4.87 4.57 4.30 3.86 3.38 3.73 2.88 4.06 4.93 4.86 4.14
6. Directors’ Fees,
Allowances and Expenses 0.00 0.00 0.00 0.00 0.00 0.00 0.00 0.00 0.00 0.00 0.00
7. Auditors’ Fees and
Expenses (Including Branch
Auditors’ Fees and
Expenses)
0.65 0.54 0.53 0.49 0.42 0.47 0.46 0.47 0.46 0.48 0.49
8. Law Charges 0.47 0.47 0.51 0.44 0.45 0.53 0.49 0.42 0.40 0.33 0.45
9. Postage, Telegrams and
Telephones Etc. 1.78 1.57 1.57 1.66 1.75 1.88 1.69 1.45 1.63 0.84 1.58
10. Repairs and Maintenance 1.02 1.41 1.60 1.53 1.34 1.21 1.40 1.43 1.37 1.37 1.36
11. Insurance 3.38 3.36 3.23 3.63 4.09 4.17 4.12 4.11 4.21 4.60 3.89
12. Other Expenditure 14.20 14.92 11.23 13.99 14.63 15.02 17.62 17.47 20.02 22.16 16.12
Total 15649
(100%)
20318
(100%)
23015
(100%)
26068
(100%)
29284
(100%)
35725
(100%)
38677
(100%)
41782
(100%)
46474
(100%)
59943
(100%) 33693
Source: Annual Reports of SBI
www.zenonpub.com Jan - Mar 2018 ISSN 2455-7331 - Vol III – Issue I
International Journal of Research in Applied Management, Science & Technology
Table – 2: Operating Expenses of Punjab National Bank 2008-09 to 2017-18
(Figures in Percentages)
Items 2008-09 2009-10 2010-11 2011-12 2012-13 2013-14 2014-15 2015-16 2016-17 2017-18 Average
1. Payments to and provisions for
Employees 69.51 65.55 70.09 67.45 69.49 69.71 69.93 64.43 57.79 67.86 67.18
2. Rent, Taxes and Lighting 5.37 5.46 4.82 5.18 5.22 5.17 5.20 6.27 7.37 5.46 5.55
3. Printing and Stationery 1.06 0.98 0.78 0.84 0.83 0.79 0.76 0.84 1.02 0.66 0.85
4. Advertising and Publicity 0.73 0.84 0.61 0.52 0.37 0.31 0.34 0.54 0.58 0.34 0.51
5.Depreciation on Bank’s Property 4.54 4.66 4.00 4.17 3.89 3.76 3.52 3.96 4.53 4.46 4.14
6. Directors’ Fees, Allowances and
Expenses 0.02 0.02 0.01 0.01 0.01 0.00 0.00 0.01 0.01 0.00 0.00
7. Auditors’ Fees and Expenses
(Including Branch Auditors’ Fees
and Expenses)
0.73 0.81 0.75 0.74 0.40 0.48 0.50 0.69 0.71 0.54 0.63
8. Law Charges 0.35 0.33 0.25 0.29 0.30 0.38 0.40 0.61 0.68 0.54 0.41
9. Postage, Telegrams and
Telephones Etc. 1.80 2.12 1.61 1.49 1.39 1.33 1.16 1.42 1.86 1.25 1.54
10. Repairs and Maintenance 1.56 1.61 1.31 1.42 1.59 1.61 1.86 2.19 2.49 1.93 1.75
11. Insurance 4.01 4.62 4.10 4.49 4.36 4.39 4.31 5.14 6.05 4.74 4.62
12. Other Expenditure 10.15 12.87 11.50 13.26 12.03 11.96 11.93 13.81 16.83 12.31 12.66
Total 4206
(100%)
4762
(100%)
6364
(100%)
7003
(100%)
8165
(100%)
9338
(100%)
10491
(100%)
9972
(100%)
9379
(100%)
13509
(100%)
8318
Source: Annual Reports of PNB
www.zenonpub.com Jan - Mar 2018 ISSN 2455-7331 - Vol III – Issue I
International Journal of Research in Applied Management, Science & Technology
Operating Profit of State Bank of India and Punjab National Bank
Operating profit is the excess of operating income over operating cost. The details of
operating income, operational expenses and operating profit of Punjab National Bankand
State Bank of Indiaare shown in Table – 3. It can be observed from table that the operating
income of State Bank of India has raised from Rs. 33564 crores to Rs. 119454 crores while
operating expenses increased from Rs. 15649 crores to Rs. 59943 crores during the study
period. The average amount of operating income is Rs. 68642 crores and operating expenses
is Rs. 33693 crores. The rate of increase noticed in respect of operating income is 3.56 times
and the rate of increase in operating expenses observed is 3.83 times during the study period.
The operating profit of State Bank of India has been increased from Rs. 17915 crores in
2008-09 to Rs. 59511 crores in 2017-18 and the average amount is Rs. 34949 crores. The
rate of growth observed in operating profit of the bank during the study period is 3.32 times.
Table – 3: Operating Profit of SBI and PNB 2008-09 to 2017-18 (Rs. in Crores)
State Bank of India
Punjab National Bank
Years Operating
Income
Operating
Expenses
Operating
Profit
Operating
Income
Operating
Expenses
Operating
Profit
2008-09 33564 15649 17915 9896 4206 5690
2009-10 38639 20318 18321 12088 4762 7326
2010-11 48351 23015 25336 15419 6364 9056
2011-12 57642 26068 31574 17617 7003 10614
2012-13 60366 29284 31082 19073 8165 10907
2013-14 67834 35725 32109 20723 9338 11384
2014-15 78214 38677 39537 22447 10491 11955
2015-16 85040 41782 43258 21312 9972 11339
2016-17 97320 46472 50848 23943 9379 14565
2017-18 119454 59943 59511 23803 13509 10294
Average 68642 33693 34949 18632 8318 10313
CAGR 0.14 0.14 0.13 0.09 0.12 0.06
Growth in
Times 3.56 3.83 3.32 2.41 3.21 1.81
Source: Annual Reports of SBI and PNB
Note: Operating Income = Net interest income + other income
It can be observed from table that the operating income of Punjab National Bank has
been raised from Rs. 9896 crores to Rs. 23803 crores while operating expenses increased
from Rs. 4206 crores to Rs. 13509 crores during the study period. The average amount of
operating income is Rs. 18632 crores and operating expenses is Rs. 8318 crores. The rate of
increase noticed in respect of operating income is 2.41 times and the rate of increase in
operating expenses observed is 3.21 times during the study period. The operating profit of
Punjab National Bank has been increased from Rs. 5690 crores in 2008-09 to Rs. 10294
www.zenonpub.com Jan - Mar 2018 ISSN 2455-7331 - Vol III – Issue I
International Journal of Research in Applied Management, Science & Technology
crores in 2017-18 and the average amount is Rs. 10313 crores. The rate of growth observed
in operating profit of the bank during the study period is 1.81 times. The compound annual
growth of operating expenses is 12 percent of Punjab National Bank is less than that of State
Bank of India is 14 percent. This indicates that the operating expenses of Punjab National
Bank somewhat reduced compare to State Bank of India.
Sources of Income
As State Bank of India and Punjab National Bank both perform mainly banking
activities, hence, Interest is the major source of income of these banks. The amount of interest
earned by State Bank of India and Punjab National Bank comprises mainly of Interest and
Discount on Advances of Bills, Income from investment, Interest on Balance with RBI &
Other Inter- Bank Funds and Others. However, other source of income of State Bank of India
and Punjab National Bank consist of Commission, Exchange & Brokerage, Profit/(Loss) on
sale of building and other assets, Profit/(loss) on Foreign Exchange Transactions,
Profit/(Loss) on revaluation of investment and Miscellaneous Income. Item-wise analysis of
sources of income of these two banks has been discussed here as under.
Other Income to total Income
Fee based income account for a major portion of the bank’s other income. The bank
generates higher fee income through innovative products and adapting the technology for
sustained service levels. This stream of revenues is not depended on the bank’s capital
adequacy and consequently, potential to generate the income is immense. The higher ratio
indicates increasing proportion of fee-based income. The ratio is also influenced by gains on
government securities, which fluctuates depending on interest rate movement in the
economy.
Other Income to Total Income of SBI and Punjab National Bank
The details of other income to total income of Punjab National Bank and State Bank
of India are shown in Table – 4. It can be observed from table that the other income of State
Bank of India has raised from Rs. 12691 crores to Rs. 44600 crores while total income
increased from Rs. 76479 crores to Rs. 265100 crores during the study period. The average
amount of other income is Rs. 22290 crores and total income is Rs. 151402 crores. The rate
of increase noticed in respect of other income is 3.51 times and the rate of increase in total
income observed is 3.47 times during the study period. The ratio of other income to total
income of State Bank of India has been fluctuating from 16.59 in 2008-09, 11.82. in 2012-13
and to 16.82 in 2017-18 and the average ratio is 14.69.
www.zenonpub.com Jan - Mar 2018 ISSN 2455-7331 - Vol III – Issue I
International Journal of Research in Applied Management, Science & Technology
Table – 4: Other Income to Total Income of SBI and PNB 2008-09 to 2017-18
State Bank of India
Punjab National Bank
Years Other
Income
Total
Income Ratio
Other
Income
Total
Income Ratio
2008-09 12691 76479 16.59 3064 22191 13.81
2009-10 14968 85962 17.41 3610 25032 14.42
2010-11 15824 97218 16.28 3612 30599 11.80
2011-12 14351 120873 11.87 4202 40678 10.33
2012-13 16034 135692 11.82 4215 46109 9.14
2013-14 18553 154904 11.98 4577 47799 9.58
2014-15 22576 174973 12.90 5891 52206 11.28
2015-16 27845 191844 14.51 6000 53424 11.23
2016-17 35461 210979 16.81 8951 56227 15.92
2017-18 44600 265100 16.82 8880 56876 15.61
Average 22290 151402 14.69 5300 43114 12.31
Growth in
Times 3.51 3.47 1.01 2.90 2.56 1.13
Source: Annual Reports of SBI and PNB
It can be observed from table that the other income of Punjab National Bank has been
raised from Rs. 3064 crores to Rs. 8880 crores while total income increased from Rs. 22191
crores to Rs. 56876 crores during the study period. The average amount of other income is
Rs. 5300 crores and total income is Rs. 43114 crores. The rate of increase noticed in respect
of other income is 2.90 times and the rate of increase in total income observed is 2.56 times
during the study period. The ratio of other income to total income of Punjab National Bank
has been increased from 13.81 in 2008-09 to 15.61 in 2017-18 and the average ratio is 12.31.
When compared to growth rate of Punjab National Bank, other income and total
income is 2.90 and 2.56 times is less than that of State Bank of India is 3.51 and 3.47 times. It
can be concluded that the growth rate of Punjab National Bank is less than that of State Bank
of India. It is also observed that the other income like Commission, Exchange and Brokerage
etc., Punjab National Banks is 12.31 on an average of other income ratio and remaining 85.31
percent from interest income. The State Bank of India having only 14.69 percent of other
income the remaining 87.69 percent from interest income.It can be concluded that both the
banks are more depend on interest income. Hence, banks are need put efforts more to
increase other income like commission, Exchange services, etc.
Interest Income to Total Income of SBI and Punjab National Bank
The details of interest income and total income of State Bank of India and Punjab
National Bank are shown table – 5. It can be seen from the analysis of the data presented in table
5. The State Bank of India the interest income has been increased from Rs. 63788 crores to
Rs. 13823 crores during the study period and the average interest income is Rs. 220499
crores. The rate of growth in interest income reflects more than 3 times.
www.zenonpub.com Jan - Mar 2018 ISSN 2455-7331 - Vol III – Issue I
International Journal of Research in Applied Management, Science & Technology
Table – 5: Interest Income to Total Income of SBI and PNB 2008-09 to 2017-18
State Bank of India Punjab National Bank
Years Interest
Income
Total
Income Ratio
Interest
Income
Total
Income Ratio
2008-09 63788 76479 83.41 19127 22191 86.19
2009-10 70993 85962 82.59 21422 25032 85.58
2010-11 81394 97218 83.72 26986 30599 88.19
2011-12 106521 120873 88.13 36476 40678 89.67
2012-13 119657 135692 88.18 41893 46109 90.86
2013-14 136350 154904 88.02 43223 47799 90.43
2014-15 152397 174973 87.10 46315 52206 88.72
2015-16 163998 191844 85.49 47424 53424 88.77
2016-17 175518 210979 83.19 47275 56227 84.08
2017-18 220499 265100 83.18 47996 56876 84.39
Average 129111.5 151402.4 85.301 37813.7 43114.1 87.69
Growth in
Times 3.46 3.47 1.00 2.51 2.56 0.98
Source: Annual Reports of SBI and PNB
It is observed from the table that the interest income of Punjab National Bank has
been increased from Rs. 19127 crores in 2008-09 to Rs. 47996 crores in 2017-18 and the
average interest income of Rs. 37813 crores. The rate of growth in interest income reflects
more than 2.51 times. It can be concluded that the interest income to total income of State
Bank of India and Punjab National Bank are getting more than 85 percent interest income
from Interest on Advances and discount on bills, Income on investment, Interest on balances
with R.B.I. and other interbank funds etc.
Interest Earned
A bank advances money to different types of customers for different periods at
different rates of interest as per the rules given by R.B.I., Central Government and policy of
the bank (Flexible Rate) during a period of financial year. As per Banking Act, such income
is defined under schedule 13 of the final accounts of a Commercial Bank.
Interest Expended
A Bank has to pay interest on various types of deposits by the customer in different
types of accounts like fixed deposits, saving account and current account and recurring
account. These accounts are opened by clients for different period. The bank pays different
rates of interest. The interest paid by bank is an expenditure of the bank for the accounting
period
Spread
The difference between interest earned and interest paid is called spread. In a way, it
is excess of interest received over interest paid by the banks. Banks pay interest on deposits
and borrowings. They also earn interest on advances to various sections of the community for
www.zenonpub.com Jan - Mar 2018 ISSN 2455-7331 - Vol III – Issue I
International Journal of Research in Applied Management, Science & Technology
various purposes. These two interest items are considered having variable cost and variable
income. The spread can be equated with contribution for the purpose of planning.
The comparative position of Spread of State Bank of India and Punjab National Bank
during the study period from 2008-09 to 2017-18 is shown in Table – 6. It can be observed
from the table that the Spread of State Bank of India increased from Rs. 20873 crores in
2008-09 to Rs. 73897 crores in 2017-18 and the average spread is Rs. 46194 crores during
the study period. In case of spread of Punjab National Bank increased from Rs. 6832 crores in
2008-09 to Rs. 14923 crores in 2017-18 and the average spread of Punjab National Bank is
Rs. 13331 crores during the study period. The growth rate of spread of State Bank of India is
more than that of Punjab National Bank. It can be observed from the table -6 that the
compound annual growth rate of Spread of the State Bank of India is 13 percent while
compare to the Punjab National Bank is 8 percent only. The growth rate in time also 3.54
time of State Bank of India compare to Punjab National Bank is only 2.18 times.
It can be concluded that the interest earned is more than the interest expended in State
Bank of India while compare to Punjab National Bank having more or less same in the
interest earned and interest expended based on compound annual growth.
Table – 6: Spread of SBI and PNB 2007-08 to 2017-18
State Bank of India Punjab National Bank
Years Interest
Earned
Interest
Expended Spread
Interest
Earned
Interest
Expended Spread
2008-09 63788 42915 20873 19127 12295 6832
2009-10 70993 47322 23671 21422 12944 8478
2010-11 81394 48867 32527 26986 15179 11807
2011-12 106521 63230 43291 36476 23061 13415
2012-13 119657 75325 44332 41893 27036 14857
2013-14 136350 87068 49282 43223 27077 16146
2014-15 152397 97381 55016 46315 29759 16556
2015-16 163998 106803 57195 47424 32112 15312
2016-17 175518 113658 61860 47275 32283 14992
2017-18 220499 146602 73897 47996 33073 14923
Average 129111 82917 46194 37813 24481 13331
CAGR 0.13 0.13 0.13 0.10 0.10 0.08
Growth in
Times 3.46 3.42 3.54 2.51 2.69 2.18
Source: Annual Reports of SBI and PNB
Burden
The difference between non-interest cost and non-interest income is defined as
burden. It is the excess of operating expenditure over operating income excluding interest
income. In other words, excess of non-interest cost over non-interest revenue is called
burden. These computations are important for the purpose of measuring net income and
www.zenonpub.com Jan - Mar 2018 ISSN 2455-7331 - Vol III – Issue I
International Journal of Research in Applied Management, Science & Technology
productivity of staff as well as the capital employed. Non interest cost also includes fixed
cost incurred by the banks such as staff salaries, rent of premises, etc.
Table – 7: Burden of SBI and PNB 2008-09 to 2017-18
State Bank of India Punjab National Bank
Years Non – Interest
Expenditure
Non –
Interest
Income
Burden
Non –
Interest
Expenditure
Non –
Interest
Income
Burden
2008-09 15649 12691 2958 6805 3064 3741
2009-10 20318 14968 5350 8182 3610 4572
2010-11 23015 15824 7191 10986 3612 7374
2011-12 26068 14351 11717 12733 4202 8531
2012-13 29284 16034 13250 14324 4215 10109
2013-14 35725 18553 17172 17380 4577 12803
2014-15 38677 22576 16101 19384 5891 13493
2015-16 41782 27845 13937 25286 6000 19286
2016-17 46472 35461 11011 22619 8951 13668
2017-18 59943 44600 15343 36086 8880 27206
Average 33693 22290 11403 17378 5300 12078
CAGR 0.14 0.13 0.18 0.18 0.11 0.22
Growth in
Times 3.83 3.51 5.19 5.30 2.90 7.27
Source: Annual Reports of SBI and PNB
The comparative position of Burden of State Bank of India and Punjab National Bank
during the study period from 2008-09 to 2017-18 is shown in Table – 7. It can be observed
from the table that the Burden of State Bank of India increased from Rs. 2958 crores in 2008-
09 to Rs. 15343 crores in 2017-18 and the average Burden is Rs. 11403 crores during the
study period. In case of Burden of Punjab National Bank increased from Rs. 3741 crores in
2008-09 to Rs. 27206 crores in 2017-18 and the average Burden of Punjab National Bank is
Rs. 12078 crores during the study period. The growth rate of Burden of Punjab National
Bank is 7.27 times in case of State Bank of India is 5.19 times. It can be concluded Burden
of Punjab National Bank is more than that the State Bank of India.
Conclusion
The analysis of operating expenses reveals that the employees’ cost and
administration expenses of State Bank of India are constituted a 93.75% on an average of the
operating expenses of the bank. The management expenses, business promotion expenses and
depreciation on assets of the bank during the study period, on an average, are 6.25% of the
operating expenses and the operating expenses of Punjab National Bankreveal that the
employees’ cost and administration expenses are constituted 93.11% on an average of the
operating expenses of the bank. The management expenses, business promotion expenses and
www.zenonpub.com Jan - Mar 2018 ISSN 2455-7331 - Vol III – Issue I
International Journal of Research in Applied Management, Science & Technology
depreciation on assets of the State Bank of India during the study period, on an average, are
6.89% of the operating expenses. It can be concluded that the interest income to total income
of State Bank of India and Punjab National Bank are getting more than 85 percent interest
income from may be Interest on Advances and discount on bills, Income on investment,
Interest on balances with R.B.I. and other interbank funds etc. only 15 percent interest
income from services like Commission, Exchange and Brokerage etc.
It can observed that the interest earned is more than the interest expended in State
Bank of India while compare to Punjab National Bank having more or less same in the
interest earned and interest expended based on compound annual growth.
It can be concluded that both the banks are more depend on interest income. Hence,
banks are need put efforts more to increase other income like commission, Exchange
services, technology development etc.
References:
1. Annual reports of Punjab National Bank
2. Annual reports of State Bank of India
3. Angadi, V.V. and Devraj, V.J., “Profitability and Productivity of Banks in India,”
Economic and Political Weekly, Nov.26, 1983.
4. K. Senthikumar, “Efficiency and Profitability of Nationalised banks in India” A Paper
Presented in National conference on Emerging Challenges for Sustainable Business
2012
5. Ramakrishnaiah, K. and Chengalrayulu., “Profitability Management of Punjab
National Bank and ICICI bank” Osmaniya Journal of International Business Bi-
Annual, July-Dec, 2013.
www.zenonpub.com Jan - Mar 2018 ISSN 2455-7331 - Vol III – Issue I
International Journal of Research in Applied Management, Science & Technology