38
Operational Plan 2013-14 Corporate Performance Report Fourth Quarter 1 April – 30 June 2014 iSpot reference #43955678
| Date post: | 16-Feb-2019 |
| Category: |
Documents |
| Upload: | hoanghuong |
| View: | 213 times |
| Download: | 0 times |

Operational Plan 2013-14 Corporate Performance Report
Fourth Quarter
1 April – 30 June 2014
iSpot reference #43955678

Table of Contents 1 ABOUT THIS REPORT ................................................................................... 3
1.1 Context ..................................................................................................................... 3
1.2 Measuring the progress of the portfolio .................................................................... 3
2 PORTFOLIO OVERVIEW ................................................................................ 5 3 PROGRESS OF THE PORTFOLIO ................................................................. 5
3.1 Initiatives ................................................................................................................... 5
3.2 Services .................................................................................................................... 6
3.3 Performance measures ............................................................................................ 8
3.3.1 Internal Performance ................................................................................................ 8
3.3.2 Customer Satisfaction ............................................................................................... 9
4 SUMMARY OF PORTFOLIO PROGRESS 2013-14 ..................................... 10 APPENDIX1 – OPERATIONAL PLAN 2013-14 CORPORATE PERFORMANCE REPORT Q4 SERVICE SUMMARY
1 ABOUT THIS REPORT 1.1 Context
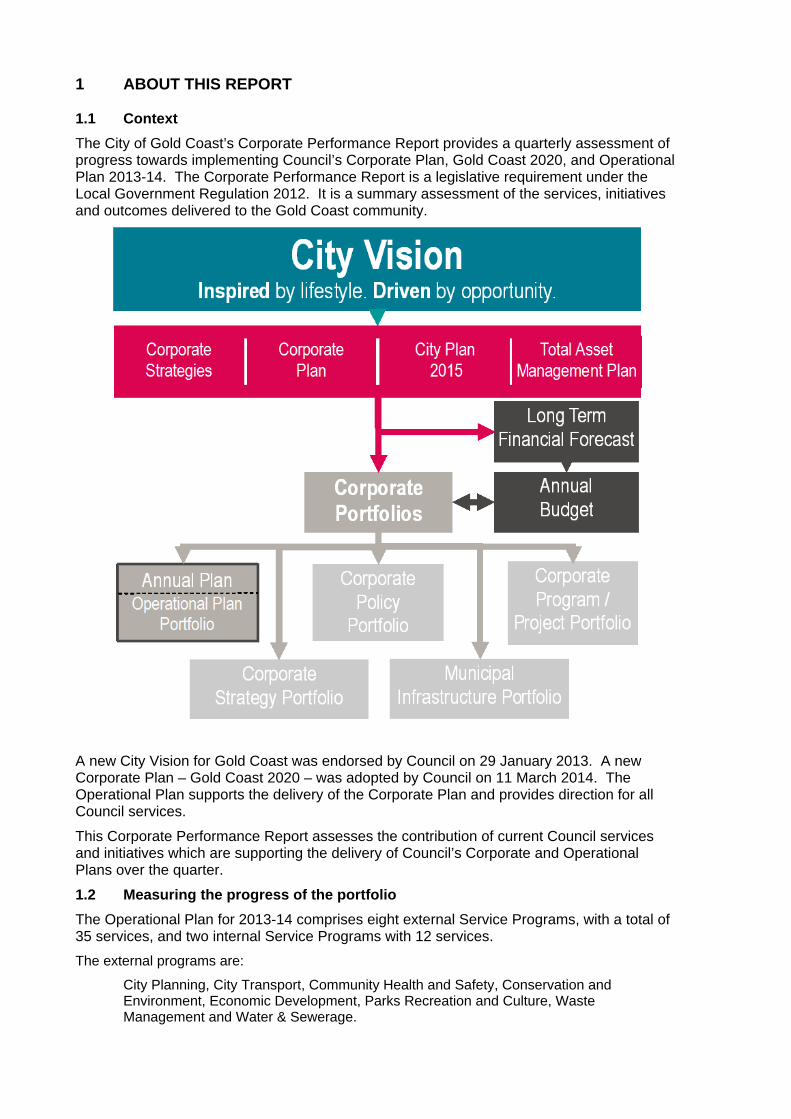
The City of Gold Coast’s Corporate Performance Report provides a quarterly assessment of progress towards implementing Council’s Corporate Plan, Gold Coast 2020, and Operational Plan 2013-14. The Corporate Performance Report is a legislative requirement under the Local Government Regulation 2012. It is a summary assessment of the services, initiatives and outcomes delivered to the Gold Coast community.
A new City Vision for Gold Coast was endorsed by Council on 29 January 2013. A new Corporate Plan – Gold Coast 2020 – was adopted by Council on 11 March 2014. The Operational Plan supports the delivery of the Corporate Plan and provides direction for all Council services.
This Corporate Performance Report assesses the contribution of current Council services and initiatives which are supporting the delivery of Council’s Corporate and Operational Plans over the quarter.
1.2 Measuring the progress of the portfolio
The Operational Plan for 2013-14 comprises eight external Service Programs, with a total of 35 services, and two internal Service Programs with 12 services.
The external programs are:
City Planning, City Transport, Community Health and Safety, Conservation and Environment, Economic Development, Parks Recreation and Culture, Waste Management and Water & Sewerage.

The internal programs which focus on how the organisation will support the delivery of the programs and services above are:
Organisational Capability and Internal Services.
The performance of the Operational Plan Portfolio will be monitored through review of the following:
The Corporate Performance Report (CPR) is based on exception reporting where significant deviations from expected progress are reported, focussing on those initiatives that require attention.
Initiative Status
The progress of initiatives within each Service have been assessed and given a status indicator. The status criteria and indicators are explained in the following table labelled ‘Initiative Status Indicators and Criteria’.
Overall indicator
Status Indicator meaning
Completed Initiative has been completed
On track Initiative is proceeding to plan with no indication of future impediments to progress / project has been completed.
Closely monitor
Progress is not as expected however, action is being/has been undertaken and it is expected to be back on track prior to the end of the next reporting period / spend is not as expected but the budget will be reviewed e.g. via a review within Budget Centre, Cost Plan Review, Cost Journals, or reprovisions / formal Budget review by Council.
Action required Progress is significantly behind schedule or is rated as ‘closely monitor’ for three consecutive quarters and decisive action is required to get back on track and requires a committee decision.
Not reported this quarter
Information was expected but is not available at the time of publication / data not reported this quarter / on hold
Portfolio progress
What will be measured Reporting
Progress of initiatives Q1, Q2, Q3 and Q4
Progress of services Q2 and Q4
Progress against internal performance outcomes
Q4 only
Review of community satisfaction with external services
Q4 only, via a community survey

2 PORTFOLIO OVERVIEW
This Quarterly Corporate Performance Report contributes to the assessment of progress against the Corporate Plan and the Operational Plan 2013-14 as at 30 June 2014, Quarter 4.
As at Q4, the portfolio consisted of 194 initiatives with a total value of $172,078,532 (financials were updated on 28 July 2014).
3 PROGRESS OF THE PORTFOLIO 3.1 Initiatives Overall initiative progress
Status Quarter 1 Quarter 2 Quarter 3 Quarter 4
On track/completed / 164 131 / 12 116 / 18 63/79
Closely monitor 43 41 41 37
Action required 2 1 1 0
Not reported this quarter/on hold 5 14 22 15
Total 214 199 198 194
Initiative progress by program
Key issues identified
City Transport Program has the lowest percentage, 55.10% of initiatives either on track or completed, with the majority of those not on track requesting reprovision of funds to a value of $3,318,485. However, a substantially higher percentage (75.79%) of the program budget has been spent as a result of reallocation of funds during the year to those projects that could be completed by the end of Quarter four. One project was delayed due to adjacent Light Rail works and one project was cancelled as the State

government could not provide the funding expected. There are two large projects, Guanaba Creek Road Bridge Replacement and Upgrade to Helensvale Road, with a current, combined value of $8,978,863, that are multi-year projects. Reprovisions are being requested as the end of year spend (actuals plus commitments) was $1,551,394.
While City Planning shows 60% of initiatives on track, there are only five initiatives currently reported for this service with two being delayed by the Cooly Rocks On Festival which was held 30 May to 9 June. These initiatives will commence in Q1 of 2014-15.
Parks, Recreation and Culture have three of their nine initiatives as closely monitor. All three, with a total value of $620,000, are in relation to South Stradbroke/Tipplers improvements with one being delayed by the alteration of the start date for a major project by the Gold Coast Waterways Authority.
Economic Development has 75% of initiatives either on track or completed but only 37% of the budget, total of $12,326,239, spent. The budget spend has been significantly impacted by one project, the Relocation of the fishing club and boat ramp at Broadwater Parklands, with a value of $5,299,083 being delayed by lengthy State approval processes. This will require reprovision.
In relation to Catchment Management, there was an issue with staff resourcing during the first quarter of the year, resulting in eight initiatives being closely monitor. All initiatives were reviewed leading to six being placed on hold/deferred and resources being allocated to the remaining 10. At the end of Quarter 4, nine of these projects have now been completed and one initiative is on track for completion during 2014-15.
Internal Services have 100% of initiatives either on track or completed even though less than 60% of the $32,107,223 budget has been expended. $10,916,401 allocated to Fleet and Plant was not spent, as an asset review deferred the replacement of some vehicles. The project schedule was reviewed in Quarter 3 and is now back on track with reprovisions requested.
Initiative overview
Of the 194 initiatives in the portfolio:
a. Initiatives - Action required
No initiatives are marked as action required for this quarter.
b. Initiatives - Closely monitor
Of the 37 initiatives rated as closely monitor:
18 of these, with a value of $4,046,396, are from the City Transport Program, with the next highest group being five, from the Organisational Capability Program, with a value of $23,000.
c. Initiatives - On hold
Of the 15 initiatives on hold:
six initiatives are from the Conservation and Environment Program – refer to Catchment Management comment above
four initiatives sit within the City Transport Program with two having resources allocated to higher priority projects, one awaiting the State government and one pending consideration by the Mayor and Director Engineering Services.
3.2 Services
Progress report on services Council provides a total of 47 services, 35 externally facing and 12 relating to Organisational Capability or Internal support services. Progress on the delivery of these services is reported in Quarter 2 and Quarter 4.

A frequently highlighted issue amongst services was the ability to maintain current levels of service within existing resources. Some of the key highlights and challenges that have been identified by services include:
Program – City Transport Service – Parking Facilities and Regulation – Services were delivered as specified
except complaint response time has increased up to seven days (dependent upon risk) and the on call facility has been cancelled with recurrent on call matters being dealt with in routine after hours patrols. This was an operational decision to focus resources on high volume parking areas. Although the complaint response time has been pushed out, they are still prioritised based on risk and attended to accordingly. This process is being monitored and it is subject to review as necessary.
Service – Traffic Management and Safety – A key challenge is the integration of traffic signals associated with the implementation of the light rail, which will be closely monitored to ensure optimisation of traffic flow and operations.
Program - Community Health and Safety Service – Animal Management – Intervention practices with respect to cats will be
adjusted with Council no longer requiring registration of cats for 2014-15. This will result in a minor decrease in revenue and expenditure. The pounds are frequently at capacity requiring the suboptimal practice of doubling animals in pens. Demand for impounding facilities is anticipated to increase over time.
Service – Public and Environmental Health – The late onset of typical winter weather conditions resulted in tidal inundations in May and June which led to significant populations of the saltmarsh mosquito (Aedes vigilax). Two further aerial treatments were required during this period.
Service – Social Planning and Research - Following extensive community consultation, the City launched its inaugural Accessible and Inclusive City Action Plan 2014-19 (AICAP) in June 2014 and lodged it with the Australian Human Rights Commission. The Plan contains 170 actions to progressively improve community access to the City's facilities, services and information. The AICAP will be monitored and reviewed every 12 months.
Program - Parks, Recreation and Culture Service – Library Services – Almost 40,000 new members joined the library over the
year with the largest intake occurring at Southport and the two new libraries at Helensvale and Upper Coomera. 48.3% of residents (2013 Estimated Resident Population) are library members.
Service – Parks, Sport and Recreation – The popularity of nature based recreation continues to grow. The capacity of some tenants (local sports and community groups) to maintain leased assets will be a challenge as these assets reach a condition where significant investment to repair, renovate or replace infrastructure arises.
Program – Conservation and Environment Service – Catchment Management – Loss of, or reduced funding for Healthy
Waterways membership will impact the City’s ability to report on the health and safety of water environments to the community and may impact on the ability to report against targets for water environments (including for the Corporate Plan).
Program - Waste Management Service – Waste Collection – Construction of the Light Rail caused major disruptions to
waste collection services along the corridor during 2013-14 and required extra resourcing to manage.
Program - Water and sewerage Service – Recycled Water – A Project Control Group has been formed within Gold
Coast Water to oversee the transition to decommission the Class A+ recycled water product and the switching over to potable water use via the dual reticulation infrastructure.

Program – Internal services
Service – Property and Facilities Management - The second half of the year saw a significant number of competing demands placed on the accommodation team to achieve additional unplanned staff moves. These were all achieved within client expectations although resulted in some delays to the delivery of the overall accommodation program, seeing the delivery of floors now extending to December 2014.
3.3 Performance measures 3.3.1 Internal Performance
A suite of performance measures was developed and incorporated into the Operational Plan to assess the internal, operational efficiency of the organisation. Two measures, Greenhouse Gas Emissions and Requisition to Purchase Order in two days, cannot now be reported as the data is no longer collected. Performance measures are continually being reviewed and refined to improve the ability to assess the organisation’s performance.
Of the reported measures, 22 were on track, three were closely monitor and two were reported for the first time, providing a baseline for future reporting.
Progress against internal performance outcomes Organisational Management Progress
Corporate Reputation Percentage positive media coverage
Complaints
Internal Audit – Implementation of Recommendations Financial Management Sustainability Ratios
Asset consumption ratio
Debt ratio
Debt servicing ratio
Interest coverage ratio
Rates revenue ratio
Working capital ratio Investment Return
Operating Expenditure – Budget vs Actual *
Capital Expenditure – Budget vs Actual *
Grants and Subsidies Received from Federal and State Governments
Risk Management Reported Work Health and Safety Incidents Workers Compensation Cost of Claims People Management Workforce Composition Profile
Excess Accrued Leave Whole of Organisation Staff Turnover Additional Employee Hours Expenditure
Operational Management
Customer Contact Channel Split by Volume Enquiries by Type and Timings IT Services Percentage of Time Business Critical Applications Unavailable # Baseline
Incident Response Time Not Meeting Target Percentage Downtime of Council Internet BaselineProcurement Services Procurement Savings Revenue Services Unpaid Rates and Charges Property Services Operating Cost per m2
*Figures are produced from data available in July following the end of the relevant financial year, may be subject to subsequent adjustment and are from figures not yet audited. #This measure has been adjusted to report the number of incidents of applications failing the 99% availability target.

Measures assessed as closely monitor: Capital Expenditure – Budget vs Actual - Key issues contributing to this end of year position include: The provision of the complete budget for multi-year initiatives within one financial year
impacted the capital budget spend. These include but were not limited to Guanaba Bridge (surplus $4,225,358), Helensvale Road Upgrade (surplus $3,202,111) and the Palm Beach Shoreline Strategy (surplus $921,455). These three projects alone total in excess of $8 million.
Some projects were delayed during the year as a result of requiring State and/or Federal government approvals e.g. Relocation of Fishing Shed and Boat Ramp (Broadwater Parklands), Earthworks to expand Carrara Sports Precinct.
Fleet and Plant service–GCW and Construction Services have put on hold or deferred all truck replacements until configurations have been agreed following the light vehicle fleet review. Additionally, a compactor fire this year, which was not fully covered by insurance, requires capital funds reserved this year for the replacement, to be rolled over into next year.
ICT – the Computer Room Move was delayed pending the endorsement of the ICT Roadmap with this initiative now included in the Roadmap program.
Grants and Subsidies Received from Federal and State Governments - Current State and Federal Government fiscal policies have limited councils’ funding opportunities, although success was achieved this year in obtaining a number of grants and subsidies. Opportunities to maximise future funding will continue to be explored. Reported Work Health and Safety Incidents - There has been a slight decrease in the numbers of incidents reported and notifiable incidents over the year. This should be balanced though with the transition to HandS from RMIS as the collection of incident data such as this has potentially elevated the numbers of incidents reported. This will level out as users become more familiar with the reporting system. As a result, there is no indication to suggest that this drop in reported WHS incidents is reflective of a drop in the actual occurrence of WHS incidents but rather suggestive that either the ‘novelty’ of using the new HandS system has worn off or a culture of under reporting is present throughout the organisation. There has also been a push to ensure that contractor notifiable incidents are reported by the contractor and Council only reports their own to clarify clear responsibilities for the investigation, this had led to a significant reduction over time in the number of these incidents. This measure is rated closely monitor as the Corporate WHS Team will continue to monitor the trend of WHS incident data and continue to communicate to the organisation the importance of reporting all WHS incidents within HandS
The reduction in Health and Injury Management (H&IM) triage cases should be noted. Under the RMIS system, H&IM staff had to open every incident to determine the type (security, vehicle, injury etc.) before triage could begin. Using HandS, the records are grouped and displayed by type, so only the injury types are looked at. While the number of cases referred on from triage remains steady, the introduction of HandS has had a very positive impact in the reduction of time spent triaging cases, i.e. it is easier to discount incidents not requiring investigating. This equates to a 30% reduction in time spent by H&IM staff.
3.3.2 Customer Satisfaction
The Operational Plan 2013-14 identified Customer Satisfaction as a set of key measures for the portfolio. A budget submission to undertake a customer satisfaction survey was included

with the 2014-15 budget process, but was not approved. There is no available report for customer satisfaction. 4 SUMMARY OF PORTFOLIO PROGRESS 2013-14
The Corporate Performance Report contributes to the assessment of progress against the Corporate Plan and the Operational Plan. As at Q4 2013-14, the portfolio consisted of 194 initiatives with a total value of $172,078,532.
Overall, the portfolio is performing well and key results include:
YTD actual expenses were $132,829,508 with commitments of $179,194 giving a total YTD spend plus commitments against initiatives of $133,008,702 or 77.30% of budget (note - some initiatives included multi-year funding commitments)
63 initiatives were on track and continuing into the 2014-15 financial year and 79 were completed, resulting in 73.2% of initiatives being either on track or completed by the end of the year (note - some initiatives were multi-year projects not scheduled for completion during 2013-14)
at Q4 only 37 initiatives required close monitoring with 15 others on hold
of the 27 internal performance measures, 22 (81%) were on track, three required close monitoring and 2 reported the first year’s baseline figures
With regard to Council’s service provision, key challenges during the year included service adjustments required to support the implementation of Light Rail; the ability to maintain current levels of service within existing resources and the implementation of a significant accommodation relocation program. APPENDIX1 – OPERATIONAL PLAN 2013-14 CORPORATE PERFORMANCE REPORT Q4 SERVICE SUMMARY

Operational Plan 2013-14 Corporate Performance ReportSummary CPR Report
Q4 2013-14
Service, Measure and Initiative Progress Report
Thursday, 28 August 2014
Appendix 1 to Q4 Corporate Performance Report
1

Initiative - Financial Initiative - Non Financial Measure
On Track Spend is as per Period Cost PlanorSavings to be or have been Declared
Initiative is proceeding as per the PMP:On ScheduleMeeting ScopeAnticipating Benefits
Results reflect the desired trend towards achieving target
Closely Monitor
Spend is not as estimated however will be back on track prior by the end of the next reporting period via:• Formal Budget Centre Review via Council decision• Reallocation of Funds within budget centre• Reprovision via Council decision• Cost Plan Review
Progress is not as expected however will be back on track prior to the end of the next reporting period.Review of the PMP will not require a Council resolution.
Results have not changed from previous period - there has been no improvement indicating that the target may not be achieved
Action Required If a Committee decision is required regarding funding
Progress is significantly behind schedule or is rated as ‘closely monitor’ for three consecutive quarters and decisive action is required. Review of the PMP will require a Council resolution.
Results do not reflect desired trend indicating target will not be achieved without remedial action/target has not been achieved
On Hold NA The initiative is formally On hold.Data was unavailable at the time of reporting
Completed NA Initiative work completed.Target has been achieved/exceeded for this period
PROGRESS STATUS LEGENDStatus Indicator
Appendix 1 to Q4 Corporate Performance Report
2

Status of each Service for the quarter, indicating the number of initatives within each Service that are on track, to be closely monitored, require action or are on hold.
Service Summary by Program
Total Program Expense inc Not Listed InitiativesRevised Budget
$51,738,500Commitments
$127,594.16
Program 1. City Planning
%YTD+Comm84.72%
YTD Spend$43,707,082
$6,742,523 $6,382,233 $127,594 96.55%Listed Initiatives - Program Expenditure for Initiatives5
Land Management & Development Control1.1Service: Listed Initiatives0
0
Land Use & Urban Planning1.2Service: Listed Initiatives1
12ProgressStatus
FinancialStatus
Overall Status
Q4 Q4 Q4 Service Initative Status Detail
11 0 0 0
Qtr Progress:
Strategic Land Use Planning activity in 2013/14 has focussed on the delivery of both the draft City Plan 2015 and the Southport Priority Development Area (PDA) Development Scheme for public consultation. The Southport PDA Development Scheme was publicly consulted in April-May 2014, with anticipated gazettal in September 2014. The draft City Plan 2015 was subject to the State Government’s Interest Review from late November 2013 to April 2014, with public consultation underway from 17 June – 29 July 2014. Anticipated gazettal is early 2015.
The Office of the City Architect has completed the Landscape Character Study Report which will inform the revision of Policy 12 Landscape Strategy, the Southport PDA Streetscape Design Guidelines, the Building Our City (Liveability Index) for the Light Rail Corridor, the maintenance of the Gold Coast Local Heritage Register, and the Heritage Open Days held at Mudgeeraba, Coolangatta, and Bundall.
Service Challenges for the Office of the City Architect Without appropriate funding and support for heritage matters there will be a loss of significant heritage places across the city – which will affect our city image, community identity and tourism. Without appropriate funding and support to instigate good urban design policy and outcomes, there will be poorly designed places across the city – which will affect our city image, liveability, economy and tourism.
Service Initiative Summary:
0
2.00 399.60 0.000 FundeDevelopment of New City Plan 2015 (Planning Scheme) Ref: 12
Appendix 1 to Q4 Corporate Performance Report
3

Service Summary by Program
Streetscape1.3Service: Listed Initiatives4
13ProgressStatus
FinancialStatus
Overall Status
Q4 Q4 Q4 Service Initative Status Detail
42 0 0 2
Qtr Progress:
The Directorate review of the CIP was presented to Council on 26 May 2014, providing documented evidence of the economic benefits provided by the program and total number of new jobs created.The review conducted a SWOT analysis of the service, some of which is outlined below.StrengthsDiverse skill base; Outcome focus; Placemaking knowledge and expertise; Knowledge of retail business drivers; Stakeholder engagement
WeaknessesFinancial constraints of the model; reliance on internal service providers (ISP)- review of some work practices is underway
OpportunitiesActivity centres desperate for renewal; showcase projects; master planning centres better steers need for capital project interventions; tactical urbanism; marketing and promotion of achievements
ThreatsBrisbane City spends seven times more on streetscaping; consideration of social and economic needs are not being prioritised; sensation focussed media; not all stakeholders focussed on the same outcomes; flow of correct information to stakeholders is an issue; changes in political priorities
The review recommended changes to the way streetscape services are undertaken, proposing a move to Place Making Master Planning. It recommended the introduction of Tactical Urbanism for small low cost amenity improvements to centres. Proposals adopted by Council in City Budget 2014-15. The changes include name change to City Place Making.
Service Initiative Summary:
0
0.00 $0.00 0.000 FundeExtension of Griffith St Coolangatta from McLean St to McDonald Rd Ref: 133
8.00 574.04 0.000 FundeStreetscaping of Davenport St Southport Ref: 134
0.00 $0.00 0.000 FundeStreetscaping of Griffith Street, Coolangatta Ref: 111
3.00 259.45 4.160 FundeStreetscaping of Young Street, Southport Ref: 112
Appendix 1 to Q4 Corporate Performance Report
4
Service Summary by Program
Total Program Expense inc Not Listed InitiativesRevised Budget
$199,965,678Commitments
$77,910.49
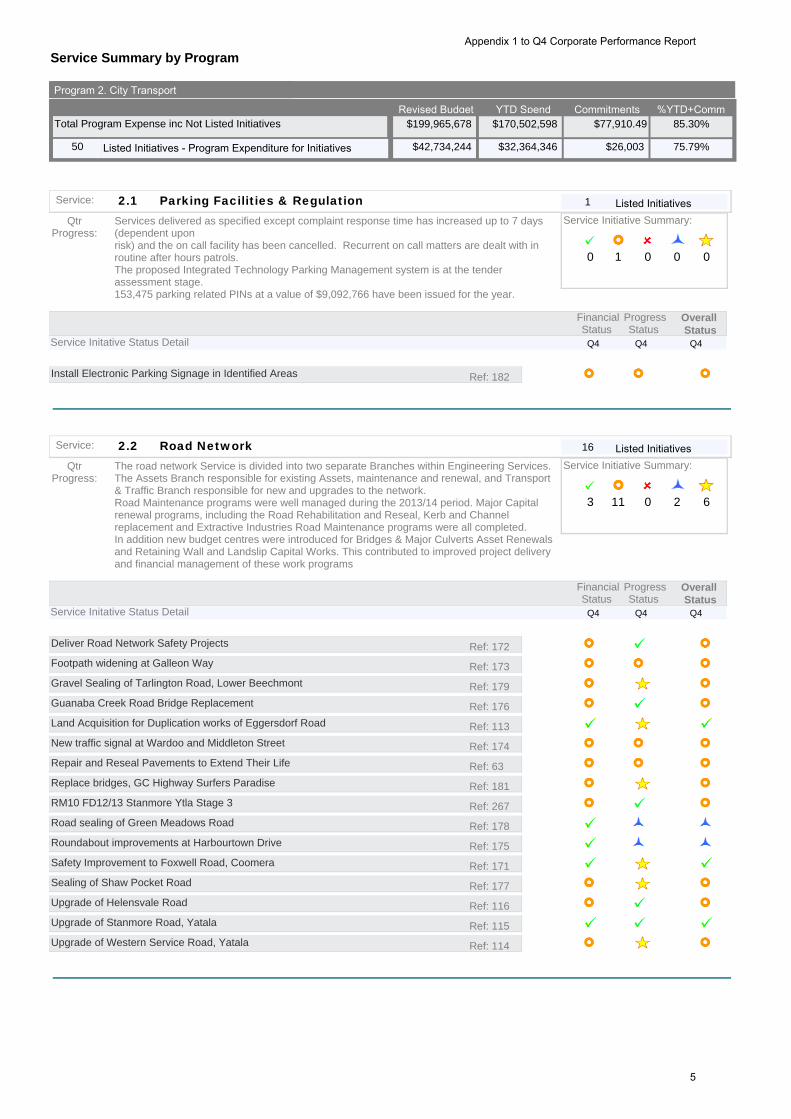
Program 2. City Transport
%YTD+Comm85.30%
YTD Spend$170,502,598
$42,734,244 $32,364,346 $26,003 75.79%Listed Initiatives - Program Expenditure for Initiatives50
Parking Facilities & Regulation2.1Service: Listed Initiatives1
21ProgressStatus
FinancialStatus
Overall Status
Q4 Q4 Q4 Service Initative Status Detail
10 1 0 0
Qtr Progress:
Services delivered as specified except complaint response time has increased up to 7 days (dependent uponrisk) and the on call facility has been cancelled. Recurrent on call matters are dealt with in routine after hours patrols.The proposed Integrated Technology Parking Management system is at the tender assessment stage.153,475 parking related PINs at a value of $9,092,766 have been issued for the year.
Service Initiative Summary:
0
0.00 088.51 0.000 FundeInstall Electronic Parking Signage in Identified Areas Ref: 182
Road Network2.2Service: Listed Initiatives16
22ProgressStatus
FinancialStatus
Overall Status
Q4 Q4 Q4 Service Initative Status Detail
163 11 0 2
Qtr Progress:
The road network Service is divided into two separate Branches within Engineering Services. The Assets Branch responsible for existing Assets, maintenance and renewal, and Transport & Traffic Branch responsible for new and upgrades to the network.Road Maintenance programs were well managed during the 2013/14 period. Major Capital renewal programs, including the Road Rehabilitation and Reseal, Kerb and Channel replacement and Extractive Industries Road Maintenance programs were all completed.In addition new budget centres were introduced for Bridges & Major Culverts Asset Renewals and Retaining Wall and Landslip Capital Works. This contributed to improved project delivery and financial management of these work programs
Service Initiative Summary:
6
0.00 873.89 0.000 FundeDeliver Road Network Safety Projects Ref: 172
0.00 199.08 0.000 FundeFootpath widening at Galleon Way Ref: 173
0.00 282.00 0.001 FundeGravel Sealing of Tarlington Road, Lower Beechmont Ref: 179
3.00 184.96 0.000 FundeGuanaba Creek Road Bridge Replacement Ref: 176
1.00 470.86 0.001 FundeLand Acquisition for Duplication works of Eggersdorf Road Ref: 113
0.00 994.61 0.000 FundeNew traffic signal at Wardoo and Middleton Street Ref: 174
0.00 $0.00 0.000 FundeRepair and Reseal Pavements to Extend Their Life Ref: 63
0.00 $0.00 0.001 FundeReplace bridges, GC Highway Surfers Paradise Ref: 181
0.00 180.29 0.140 FundeRM10 FD12/13 Stanmore Ytla Stage 3 Ref: 267
0.00 750.41 0.000 FundeRoad sealing of Green Meadows Road Ref: 178
0.00 $0.00 0.000 FundeRoundabout improvements at Harbourtown Drive Ref: 175
0.00 681.69 0.001 FundeSafety Improvement to Foxwell Road, Coomera Ref: 171
0.00 491.31 0.001 FundeSealing of Shaw Pocket Road Ref: 177
0.00 214.02 4.700 FundeUpgrade of Helensvale Road Ref: 116
0.00 $0.00 0.000 FundeUpgrade of Stanmore Road, Yatala Ref: 115
0.00 105.52 4.001 FundeUpgrade of Western Service Road, Yatala Ref: 114
Appendix 1 to Q4 Corporate Performance Report
5

Service Summary by Program
Traffic Management & Safety2.3Service: Listed Initiatives7
23ProgressStatus
FinancialStatus
Overall Status
Q4 Q4 Q4 Service Initative Status Detail
74 3 0 0
Qtr Progress:
Work is almost complete on the development of a Road Safety Plan for the city. Completion is expected in Q1 of 14-15, with launch of the Plan proposed in early December 2014.The monitoring and maintenance of traffic signals continues to be on track and on budget. A number of externalities (primarily relating to interactions with the State Department of Transport & Main Roads) have meant that there have been minor changes to commitments inQ4 (13-14), but the vast majority of proposed budget commitments have been undertaken as originally proposed.The new traffic signals maintenance contract, including the maintenance of the new light rail corridor, was approved in May 2014. A key challenge are the traffic signals associated with the implementation of the light rail. These will be closely monitored to ensure optimisation of traffic operation across the network to avoid delays to the G:Link and minimise delays to general traffic.
Service Initiative Summary:
3
0.00 160.84 0.000 FundeDelivery of an Integrated Traffic Management Centre Ref: 36
0.00 050.84 0.000 FundeInstall CCTV Traffic Management Cameras Ref: 188
0.00 995.56 0.000 FundeInstall communications conduit at Chevron Island Ref: 187
0.00 $0.00 0.000 FundeInstallation of LED Lights for Traffic Signals (City Wide) Ref: 190
2.00 922.74 0.001 FundeRefurbish traffic signals, Central Street Ref: 186
0.00 426.70 0.001 FundeRefurbish Traffic Signals, Kumbari Avenue Ref: 185
7.00 637.82 0.001 FundeReplace Alpha Traffic Signal Controllers Ref: 189
Appendix 1 to Q4 Corporate Performance Report
6

Service Summary by Program
Transport Improvement2.4Service: Listed Initiatives26
24ProgressStatus
FinancialStatus
Overall Status
Q4 Q4 Q4 Service Initative Status Detail
268 15 0 2
1
Qtr Progress:
Anabranch (waterways between Main Beach and Surfers Paradise) North Bridge Pile Remediation works have been completed.Work is progressing on Stanmore Road, Yatala, expected to be completed by December 2014.Eggersdorf Road duplication was completed.Yatala West Service Road project has been completed.Guanaba Bridge tender awarded, final works are expected to be completed during the financial year 2014-15. Key challenges for the delivery of transport improvements are the availability of funding within the transport portfolio to deliver the intended outcomes highlighted within the transport strategy.
Service Initiative Summary:
8
6.00 167.52 0.001 FundeActive School Travel Program Ref: 40
0.00 099.40 0.000 FundeActive Towns - Connect Robina TC to Glen Eagles Drive Ref: 130
2.00 801.20 0.000 FundeActive Towns - Link Robina Rail Stn to Town Centre Ref: 131
1.00 029.30 0.000 FundeActive Towns - Various Links, Robina Primary School Ref: 132
4.00 890.88 0.001 FundeActive Travel Communities and Workplaces. Ref: 22
0.00 073.32 0.000 FundeActive Travel Upgrade, Hedges Avenue Ref: 121
1.00 830.50 0.001 FundeBikeway Intersection Upgrades Ref: 117
0.00 $0.00 0.000 FundeBus Interchange at Metricon Stadium Ref: 180
4.00 631.27 0.001 FundeCommunity Transport Program Ref: 38
8.00 741.19 0.000 FundeConstruct Additional Bus Shelters Throughout the City Ref: 184
2.00 122.77 0.000 FundeGCRT Implementation Program Team Ref: 1
5.00 112.42 0.000 FundeHealthy & Active School Travel Program Ref: 41
0.00 645.98 0.000 FundeOn Road Bike Way at Mallawa Drive Ref: 183
0.00 798.71 0.000 FundeOn Road Bikeway - Mattocks Road, Varsity Ref: 125
8.00 422.20 4.590 FundeOn Road Bikeway Mallawa Drive / 19th Avenue Ref: 129
0.00 092.99 0.000 FundeOn Road Bikeway Waterways Drive Ref: 119
3.00 192.19 0.000 FundeOn Road Bikeway, Bayview / Hagen Ref: 124
0.00 169.12 0.001 FundePublic Transport Initiatives (eg. Increase Service Freq and Free Seniors) Ref: 39
8.00 520.84 0.000 FundePublic Transport Planning - Light Rail Ref: 37
9.00 334.09 0.001 FundeRifle Range Shared Path Ref: 120
0.00 $0.00 0.000 Interna Int LabRoad Reserve Management Policy Ref: 252
0.00 115.10 0.000 FundeSecure Bike Parking along Light Rail Ref: 118
0.00 851.68 0.000 FundeShared Use Path Hinterland Park, Mudgeeraba Ref: 128
6.00 433.93 0.001 FundeShared Use Path Norm Rix / Keith Hunt Park Ref: 123
0.00 813.54 0.000 FundeShared Use Path, Beattie Road Ref: 126
4.00 744.21 0.001 FundeShared Use Path, Robina Town Centre Drive Ref: 127
Appendix 1 to Q4 Corporate Performance Report
7
Service Summary by Program
Total Program Expense inc Not Listed InitiativesRevised Budget
$71,195,754Commitments
$3,363.04
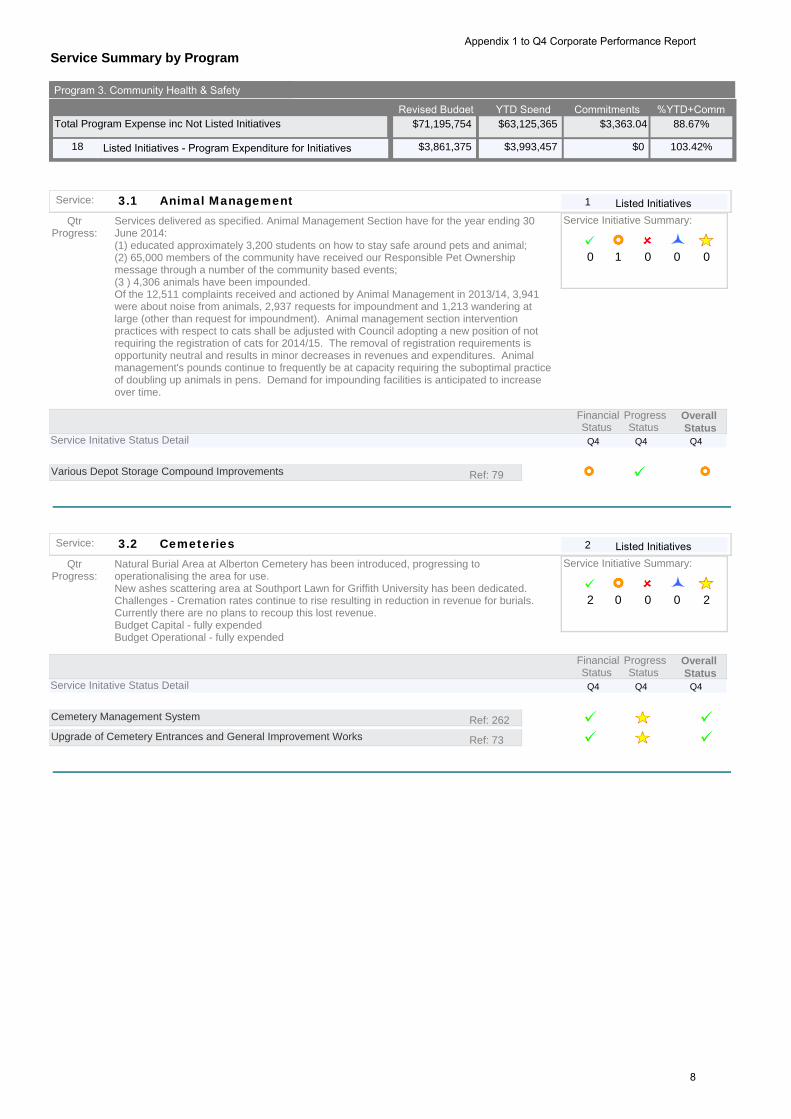
Program 3. Community Health & Safety
%YTD+Comm88.67%
YTD Spend$63,125,365
$3,861,375 $3,993,457 $0 103.42%Listed Initiatives - Program Expenditure for Initiatives18
Animal Management3.1Service: Listed Initiatives1
31ProgressStatus
FinancialStatus
Overall Status
Q4 Q4 Q4 Service Initative Status Detail
10 1 0 0
Qtr Progress:
Services delivered as specified. Animal Management Section have for the year ending 30 June 2014:(1) educated approximately 3,200 students on how to stay safe around pets and animal;(2) 65,000 members of the community have received our Responsible Pet Ownership message through a number of the community based events;(3 ) 4,306 animals have been impounded. Of the 12,511 complaints received and actioned by Animal Management in 2013/14, 3,941 were about noise from animals, 2,937 requests for impoundment and 1,213 wandering at large (other than request for impoundment). Animal management section intervention practices with respect to cats shall be adjusted with Council adopting a new position of not requiring the registration of cats for 2014/15. The removal of registration requirements is opportunity neutral and results in minor decreases in revenues and expenditures. Animal management's pounds continue to frequently be at capacity requiring the suboptimal practice of doubling up animals in pens. Demand for impounding facilities is anticipated to increase over time.
Service Initiative Summary:
0
0.00 986.95 0.000 FundeVarious Depot Storage Compound Improvements Ref: 79
Cemeteries3.2Service: Listed Initiatives2
32ProgressStatus
FinancialStatus
Overall Status
Q4 Q4 Q4 Service Initative Status Detail
22 0 0 0
Qtr Progress:
Natural Burial Area at Alberton Cemetery has been introduced, progressing to operationalising the area for use. New ashes scattering area at Southport Lawn for Griffith University has been dedicated.Challenges - Cremation rates continue to rise resulting in reduction in revenue for burials. Currently there are no plans to recoup this lost revenue.Budget Capital - fully expendedBudget Operational - fully expended
Service Initiative Summary:
2
2.00 774.20 0.001 FundeCemetery Management System Ref: 262
2.00 215.60 0.001 FundeUpgrade of Cemetery Entrances and General Improvement Works Ref: 73
Appendix 1 to Q4 Corporate Performance Report
8

Service Summary by Program
Emergency/Disaster Management3.3Service: Listed Initiatives1
33ProgressStatus
FinancialStatus
Overall Status
Q4 Q4 Q4 Service Initative Status Detail
11 0 0 0
Qtr Progress:
The Disaster Management Unit ensures that the City of Gold Coast is responsible for meeting its statutory obligations under the Disaster Management Act 2003 and for implementing Council's policy commitments with respect to disaster management. This includes: ensuring that the City is prepared for disasters through effective disaster planning and community education and awareness activities; maintaining the readiness of the City's Disaster Coordination Centre to respond to disaster events; and coordinating the City's recovery following disaster events.
During this current quarter, there were no disaster events which impacted the City; however the Disaster Management Unit continued to work with asset custodians to restore essential infrastructure damaged as a result of Tropical Cyclone Oswald in January 2013, under the Natural Disaster Relief and Recovery Arrangements (NDRRA). 6 community education and awareness activities and 12 disaster management training activities were delivered during the quarter to enhance community disaster resilience and the response capacity of Council and external agencies.
During the quarter the Unit's expense budget was revised upwards to reflect incoming NDRRA revenue for works-in-progress, which are due for completion under NDRRA by June 2015. A request will be made to Council to reprovide these budgets amounts in 2014-15 due to the on-going nature of the restoration works and their NDRRA grant funding source.
Service Initiative Summary:
1
0.00 090.00 0.001 FundeReplacement of Two SES Rescue Vehicles Ref: 62
Flooding & Drainage3.4Service: Listed Initiatives6
34ProgressStatus
FinancialStatus
Overall Status
Q4 Q4 Q4 Service Initative Status Detail
66 0 0 0
Qtr Progress:
A major drainage contract is underway at Mermaid Beach with committed funds to be reprovided into 2014/15. Crest capping works underway at Biggera Dam which will continue into 2014/15 with funding to be reprovided. Drainage operational maintenance program was well managed during 2013/14.
Service Initiative Summary:
2
0.00 728.76 0.001 FundeChannel Work - Baratta Street, Loders Creek Ref: 70
3.00 746.13 0.000 FundeDevelop Overland Flow Path Models and Maps for Gold Coast City Ref: 14
3.00 $0.00 0.000 FundeEmergent Stormwater Drainage Upgrades Ref: 56
0.00 216.95 0.000 FundeUpgrade Stormwater Drainage Dudley St, Mermaid Beach Ref: 58
2.00 681.15 0.000 FundeUpgrade Stormwater Drainage Markeri St, Mermaid Beach Ref: 67
0.00 222.71 0.001 FundeUpgrade Stormwater Drainage, Seagull Avenue, Mermaid Ref: 64
Appendix 1 to Q4 Corporate Performance Report
9
Service Summary by Program
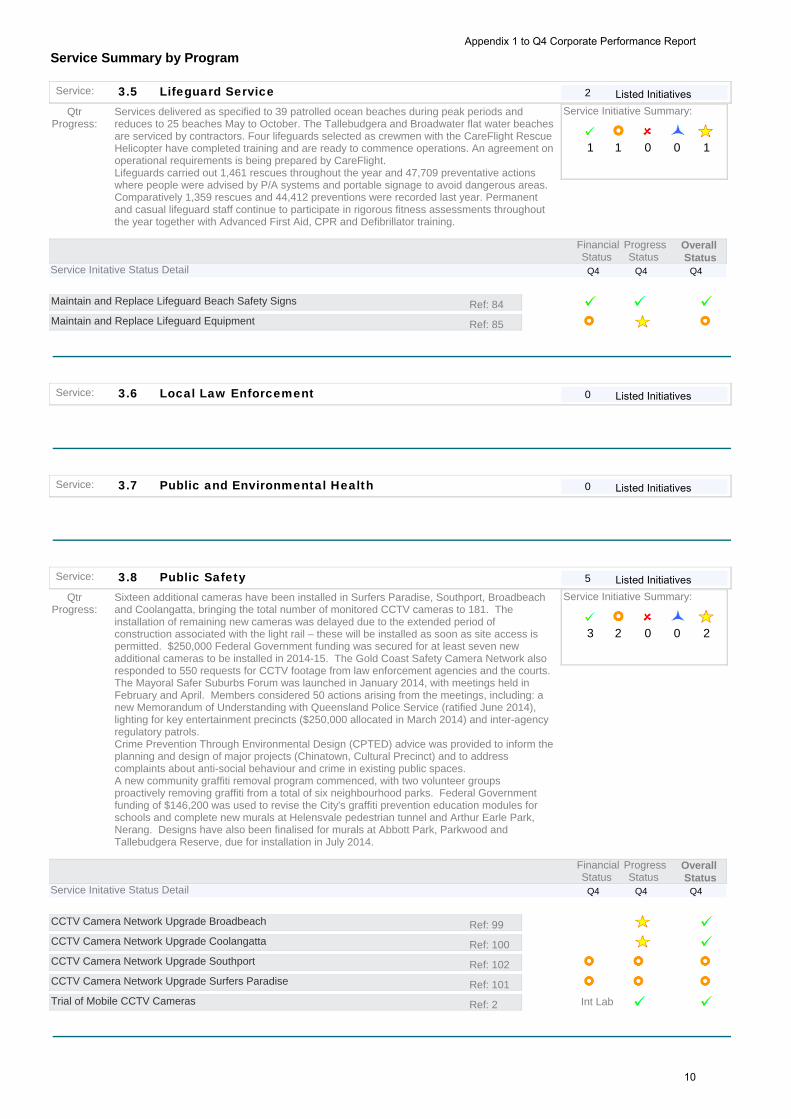
Lifeguard Service3.5Service: Listed Initiatives2
35ProgressStatus
FinancialStatus
Overall Status
Q4 Q4 Q4 Service Initative Status Detail
21 1 0 0
Qtr Progress:
Services delivered as specified to 39 patrolled ocean beaches during peak periods and reduces to 25 beaches May to October. The Tallebudgera and Broadwater flat water beaches are serviced by contractors. Four lifeguards selected as crewmen with the CareFlight Rescue Helicopter have completed training and are ready to commence operations. An agreement on operational requirements is being prepared by CareFlight.Lifeguards carried out 1,461 rescues throughout the year and 47,709 preventative actions where people were advised by P/A systems and portable signage to avoid dangerous areas. Comparatively 1,359 rescues and 44,412 preventions were recorded last year. Permanent and casual lifeguard staff continue to participate in rigorous fitness assessments throughout the year together with Advanced First Aid, CPR and Defibrillator training.
Service Initiative Summary:
1
2.00 851.56 0.000 FundeMaintain and Replace Lifeguard Beach Safety Signs Ref: 84
3.00 995.68 0.001 FundeMaintain and Replace Lifeguard Equipment Ref: 85
Local Law Enforcement3.6Service: Listed Initiatives0
0
Public and Environmental Health3.7Service: Listed Initiatives0
0
Public Safety3.8Service: Listed Initiatives5
38ProgressStatus
FinancialStatus
Overall Status
Q4 Q4 Q4 Service Initative Status Detail
53 2 0 0
Qtr Progress:
Sixteen additional cameras have been installed in Surfers Paradise, Southport, Broadbeach and Coolangatta, bringing the total number of monitored CCTV cameras to 181. The installation of remaining new cameras was delayed due to the extended period of construction associated with the light rail – these will be installed as soon as site access is permitted. $250,000 Federal Government funding was secured for at least seven new additional cameras to be installed in 2014-15. The Gold Coast Safety Camera Network also responded to 550 requests for CCTV footage from law enforcement agencies and the courts.The Mayoral Safer Suburbs Forum was launched in January 2014, with meetings held in February and April. Members considered 50 actions arising from the meetings, including: a new Memorandum of Understanding with Queensland Police Service (ratified June 2014), lighting for key entertainment precincts ($250,000 allocated in March 2014) and inter-agency regulatory patrols.Crime Prevention Through Environmental Design (CPTED) advice was provided to inform the planning and design of major projects (Chinatown, Cultural Precinct) and to address complaints about anti-social behaviour and crime in existing public spaces. A new community graffiti removal program commenced, with two volunteer groups proactively removing graffiti from a total of six neighbourhood parks. Federal Government funding of $146,200 was used to revise the City's graffiti prevention education modules for schools and complete new murals at Helensvale pedestrian tunnel and Arthur Earle Park, Nerang. Designs have also been finalised for murals at Abbott Park, Parkwood and Tallebudgera Reserve, due for installation in July 2014.
Service Initiative Summary:
2
8.00 145.77 0.001 FundeCCTV Camera Network Upgrade Broadbeach Ref: 99
6.00 883.49 0.001 FundeCCTV Camera Network Upgrade Coolangatta Ref: 100
7.00 651.95 0.000 FundeCCTV Camera Network Upgrade Southport Ref: 102
7.00 234.12 0.000 FundeCCTV Camera Network Upgrade Surfers Paradise Ref: 101
0.00 $0.00 0.000 Interna Int LabTrial of Mobile CCTV Cameras Ref: 2
Appendix 1 to Q4 Corporate Performance Report
10
Service Summary by Program
Social Planning & Research3.9Service: Listed Initiatives1
39ProgressStatus
FinancialStatus
Overall Status
Q4 Q4 Q4 Service Initative Status Detail
11 0 0 0
Qtr Progress:
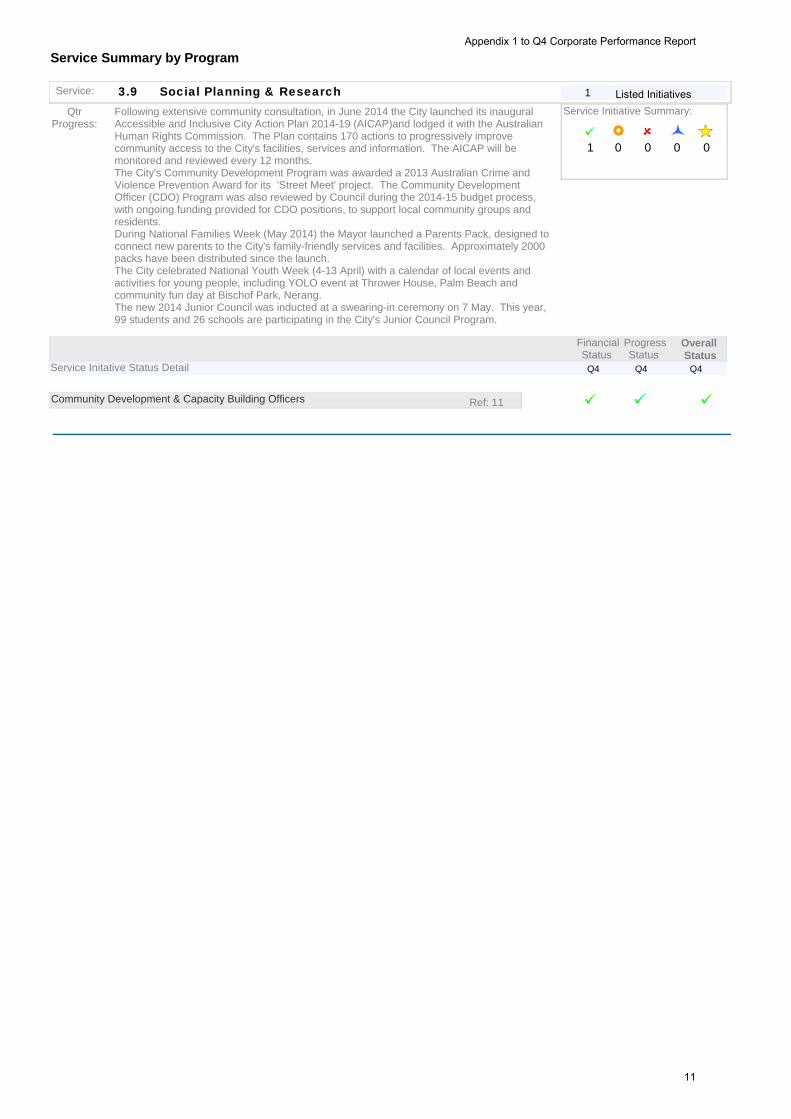
Following extensive community consultation, in June 2014 the City launched its inaugural Accessible and Inclusive City Action Plan 2014-19 (AICAP)and lodged it with the Australian Human Rights Commission. The Plan contains 170 actions to progressively improve community access to the City's facilities, services and information. The AICAP will be monitored and reviewed every 12 months.The City's Community Development Program was awarded a 2013 Australian Crime and Violence Prevention Award for its 'Street Meet' project. The Community Development Officer (CDO) Program was also reviewed by Council during the 2014-15 budget process, with ongoing funding provided for CDO positions, to support local community groups and residents.During National Families Week (May 2014) the Mayor launched a Parents Pack, designed to connect new parents to the City's family-friendly services and facilities. Approximately 2000 packs have been distributed since the launch. The City celebrated National Youth Week (4-13 April) with a calendar of local events and activities for young people, including YOLO event at Thrower House, Palm Beach and community fun day at Bischof Park, Nerang. The new 2014 Junior Council was inducted at a swearing-in ceremony on 7 May. This year, 99 students and 26 schools are participating in the City's Junior Council Program.
Service Initiative Summary:
0
0.00 031.77 0.000 FundeCommunity Development & Capacity Building Officers Ref: 11
Appendix 1 to Q4 Corporate Performance Report
11

Service Summary by Program
Total Program Expense inc Not Listed InitiativesRevised Budget
$48,142,680Commitments
$0.00
Program 4. Conservation & Environment
%YTD+Comm85.46%
YTD Spend$41,144,685
$9,669,143 $8,643,445 $0 89.39%Listed Initiatives - Program Expenditure for Initiatives29
Catchment Management4.1Service: Listed Initiatives16
41ProgressStatus
FinancialStatus
Overall Status
Q4 Q4 Q4 Service Initative Status Detail
1610 0 0 6
Qtr Progress:
CMU continues to improve the level of service delivery improving processes for planning, project management and operations. These process improvements provide adaptive prioritisation for project targeting and delivery, progress towards whole of organisation alignments and consistent and reliable delivery of operational services.
There are still areas for improving service levels and efficiency in the monitoring program and also in total water cycle planning (TWCM). The TWCM plan is due to be adopted in August and represents a great opportunity for the city to align and consolidate water management.
Loss of or reduced funding for healthy waterways membership will impact the City's ability to report on the health and safety of water environments to the community. This may also impact on ability to report against KPIs for water environments in the Corporate Plan.
Service Initiative Summary:
9
3.00 790.00 0.001 FundeAccurate Mapping of Lakes and Wetlands Ref: 83
3.00 529.88 0.001 FundeChannel Stability Ref: 97
0.00 $0.00 0.000 FundeCoolangatta Creek Ref: 75
0.00 $0.00 0.000 FundeFlat Rock Creek Ref: 81
0.00 753.98 0.001 FundeManagement Plan for Coomera River Ref: 76
0.00 160.00 0.001 FundeMcCoys Creek Ref: 87
0.00 064.40 0.001 FundeNerang River Ref: 89
9.00 400.18 0.001 FundePimpama River Ref: 91
8.00 124.36 0.001 FundeRehabilitation Works at Currumbin Creek Ref: 78
0.00 $0.00 0.000 FundeRehabilitation Works Hotham Creek Ref: 82
0.00 $0.00 0.000 FundeRehabilitation Works Loders / Biggera Creek Ref: 86
0.00 $0.00 0.000 FundeRehabilitation Works Tallebudgera Creek Ref: 108
0.00 190.77 0.001 FundeReplace and Upgrade Scientific Equipment Ref: 105
0.00 $0.00 0.000 FundeSaltwater Creek Ref: 103
0.00 249.47 0.001 FundeSandy Creek Ref: 104
0.00 $0.00 0.000 Interna Int LabWatercycle Management Plan Development Ref: 50
Lakes, Canals and Waterways4.2Service: Listed Initiatives2
42ProgressStatus
FinancialStatus
Overall Status
Q4 Q4 Q4 Service Initative Status Detail
22 0 0 0
Qtr Progress:
Funding for the Surfers Central River frontage has been allocated in partnership with the Gold Coast Water Authority and will be reprovided for works to proceed in 2014/15. Canal Maintenance program including planned and reactionary works was well delivered during 2013/14.
Service Initiative Summary:
1
3.00 129.33 0.000 FundeConstruction of Revetment Wall on James Cook Esp, Hollywell Ref: 60
5.00 244.02 0.001 FundeNorthern Canal Dredging and Maintenance Ref: 3
Appendix 1 to Q4 Corporate Performance Report
12

Service Summary by Program
Natural Environment Conservation4.3Service: Listed Initiatives1
43ProgressStatus
FinancialStatus
Overall Status
Q4 Q4 Q4 Service Initative Status Detail
11 0 0 0
Qtr Progress:
The Conservation Partnerships Program (CPP) continues to implement schemes to conserve natural values on private land, mainly through Land for Wildlife and Voluntary Conservation Agreements. In addition, the Nature Conservation Assistance Program (NCAP) funded fifteen new restoration projects on private land. All schemes are on track. Land for Wildlife currently has 490 registered properties containing 3731 hectares of retained habitat and 527 hectares under restoration. The focus on property revisits has intensified to strengthen the interest of existing members. More than 100 revisits were carried out this year. Another important focus for Land for Wildlife has been the training of members in bushland restoration techniques. Eight restoration workshops were run during the year. Two regional property open days were held in May to showcase outstanding Gold Coast properties to the SEQ region. The current number of VCAs is 18 (including 10 Higher VCAs with statutory covenant) taking in a total area is 587 hectares across the City.
Service Initiative Summary:
1
8.00 466.80 0.001 FundeEast Coomera Koala Conservations Project Ref: 13
Ocean Beach Management4.4Service: Listed Initiatives10
44ProgressStatus
FinancialStatus
Overall Status
Q4 Q4 Q4 Service Initative Status Detail
107 3 0 0
Qtr Progress:
Funding for the Palm Beach Shoreline Project will be reprovided for 2014/15 to allow additional time for community consultation. Major Seawall projects were completed at Miami Beach and Palm Beach. The Kirra Point Groyne has been extended. Council allocated additional funding for seawalls.
Service Initiative Summary:
8
0.00 $0.00 0.001 FundeBeach Fencing Ref: 71
6.00 437.40 0.001 FundeBeach Improvements Ref: 68
3.00 067.54 0.000 FundeDevelop the Palm Beach Shoreline Strategy Ref: 59
2.00 140.66 0.001 FundeDredging at Tallebudgera and Currumbin Ref: 57
3.00 035.83 0.001 FundeImprovements to Beach Access - North Ref: 53
1 FundeImprovements to Beach Access - South Ref: 54
2.00 543.38 0.001 FundeMiami Seawall Stage 2 Ref: 65
0.00 101.00 0.001 FundeRenewal of Beach Showers Ref: 55
8.00 016.16 0.001 FundeRestore Kirra Point Groyne Ref: 69
0.00 $0.00 0.000 FundeShoreline Management Forward Planning and Design Ref: 66
Appendix 1 to Q4 Corporate Performance Report
13

Service Summary by Program
Total Program Expense inc Not Listed InitiativesRevised Budget
$74,058,292Commitments
$112,250.00
Program 5. Economic Development
%YTD+Comm77.97%
YTD Spend$57,632,560
$12,326,239 $4,568,766 $0 37.07%Listed Initiatives - Program Expenditure for Initiatives16
Economic Development5.1Service: Listed Initiatives13
51ProgressStatus
FinancialStatus
Overall Status
Q4 Q4 Q4 Service Initative Status Detail
136 7 0 0
Qtr Progress:
The EDS has been actively implemented since endorsement in late 2013 including the development and activation of key delivery plans such as the International Plan and Sports Plan. The Competitive Business program has resulted in over 522 facilitated referrals being provided to local businesses which related to relevant funding, grants or growth related support. The total value of the opportunities that the program has generated during 2013/14 to local high growth businesses was $13,409,269 with $6,940,430 value in pipeline opportunities, the city’s export outcomes generated as a result of the city’s Growth and Trade program totalled $21.2 million. This significant outcome is attributed to the team’s engagement with over 92 existing or new exporters in the city through the Growth and Trade program including the Emerging Exporters Program (including Export Assistance Scheme), TradeStart, International Trade and Investment Program. The delivery of the International Plan has included a range of outbound and inbound missions focussed on the top tier markets of China, Middle East and India which have resulted in direct investment into the city, identification of future significant events and the increase in export opportunities realised by Gold Coast companies through identified supply chain linkages. The city’s investment attraction program has attracted a total of four projects to the city, creating 272 jobs and $51 million in direct capital investment in 2013/14. The performance of the Gold Coast economy has been measured through the identified EDS targets. In summary, along with national trends the city's performance has been mixed. People are moving here, the economy is growing, business confidence and productivity are up while employment creation and exports remain stable. Employment creation needs to keep pace with population growth as this has a downward pressure on GRP per capita (or standard of living). Uplift in worker productivity has been the primary driver of economic growth throughout 2013. Aside from a lack of employment growth, one of the underlining issues for the Gold Coast labour market has been a drop in worker participation throughout 2012 and 2013. The Gold Coast is not alone with this trend, with both Queensland and national worker participation levels trending down. Given the seasonal nature of the Gold Coast, workforce participation is always quite volatile. However, early 2014 figures are showing a positive reversal in the city’s labour market with improvements in worker participation and employment. Even though the performance of the Gold Coast economy has been mixed, the business community is optimistic about the outlook for the local economy, with anticipated stronger performance in general business conditions and sales and revenue. The key challenges facing Gold Coast businesses are a lack of jobs and skilled labour and rising cost of living. The key opportunities identified by businesses over the next 5 years are the Gold Coast 2018 Commonwealth Games™, improvements in tourism, and new infrastructure development.
Service Initiative Summary:
4
0.00 911.20 0.001 FundeArt in the Park Event Ref: 20
0.00 184.57 0.000 FundeBroadwater Marine Project Ref: 15
0.00 $0.00 0.000 FundeCelebrate Gold Coast Event Ref: 21
0.00 000.00 0.001 FundeCommonwealth Games Environmental Solutions Ref: 151
0.00 $0.00 0.001 FundeCommonwealth Games: Aquatic Centre Contribution Ref: 27
4.00 464.02 0.000 FundeCommonwealth Games: Consultancy for Venue Development Ref: 5
0.00 906.88 0.000 FundeCommonwealth Games: Cultural & Festival Program Ref: 7
0.00 729.75 0.001 FundeCommonwealth Games: Legacy Board Ref: 23
8.00 133.49 0.000 FundeCommonwealth Games: Resources to Deliver Host City Commitments Ref: 6
0.00 $0.00 0.000 FundeEarthworks to Expand Carrara Sports Precinct Ref: 150
0.00 000.00 0.000 FundeEducation and Marketing Capacity Program Ref: 43
5.00 337.40 0.000 FundeMaster Planning - Southport Chinatown Ref: 9
3.00 480.70 0.000 FundeRelocate Fishing Club and Boat Ramp, Broadwater Parklands Ref: 149
Appendix 1 to Q4 Corporate Performance Report
14

Service Summary by Program
Tourism Management and Marketing5.2Service: Listed Initiatives3
52ProgressStatus
FinancialStatus
Overall Status
Q4 Q4 Q4 Service Initative Status Detail
32 1 0 0
Qtr Progress:
Council in partnership with Gold Coast Tourism completed the Gold Coast Destination Tourism Management Plan in June, which identifies key priorities for tourism for the city. An implementation plan for 2014-2015 was endorsed by Council in May 2014. A request for Information (RFI) for the Gold Coast dive attraction was received with favourable market interest and capability in developing the purpose built dive attraction. Council now is in a position to undertake a tender to design, fabricate and install the dive attraction, once funding is sourced. The feasibility studying into an iconic Surf Museum on a beach location is complete and has identified a preferred location. The results will be presented to Council in August 2014. A study into a permanent visitor information service centre at Wunburra lookout, Springbrook has been undertaken with the findings currently been finalised. In alignment with the Adventure Tourism and Sports objectives, an assessment of a location for the national BMX headquarters to be located on the Gold Coast was undertaken and will be presented to Council in October 2014 The GIS mapping to identify future mountain biking trails is complete and will inform Council’s future development of adventure trails, as outlined in the DTMP.
Gold Coast Tourism is currently on track to achieve its Service Delivery Key Performance Indicators with the following outcomes so far (Q4 results) •Over 15 domestic Marketing Campaigns executed •Over 21 International Marketing Campaigns •GCT’s focus on the digital reach in China has resulted in an increase of 10 fold in unique
visitors to the Chinese website.
The inaugural Opera on the Beach event was conducted from 8-11 May 2014, and several other Council supported major events were successfully staged (eg: Armor All 600, Swell Sculpture Festival, Pan Pacific Masters Games, Gold Coast Marathon and Blues on Broadbeach). During 2013/2014 financial year one new major event was secured which was the Australian Open Bowls which will be held from 2015 to 2019. Council has resolved and is in the process of finalising a number of other contracts to retain major events in the City for several years and potential new events are being assessed. Council played a major role in the planning and delivery of the Gold Coast Schoolies Community Safety Response Plan.
Service Initiative Summary:
1
9.00 229.43 0.000 FundeCity Marketing and Promotion Ref: 42
0.00 000.00 0.001 FundeOpera on the Beach Ref: 25
0.00 388.88 0.000 FundeTourism Related Special Event Ref: 26
Appendix 1 to Q4 Corporate Performance Report
15
Service Summary by Program
Total Program Expense inc Not Listed InitiativesRevised Budget
$163,201,314Commitments
$575.63
Program 6. Parks, Recreation & Culture
%YTD+Comm92.93%
YTD Spend$151,658,957
$1,485,209 $956,764 $0 64.42%Listed Initiatives - Program Expenditure for Initiatives9
Community Centres6.1Service: Listed Initiatives0
0
Community Support6.2Service: Listed Initiatives0
0
Culture & Heritage6.3Service: Listed Initiatives1
63ProgressStatus
FinancialStatus
Overall Status
Q4 Q4 Q4 Service Initative Status Detail
11 0 0 0
Qtr Progress:
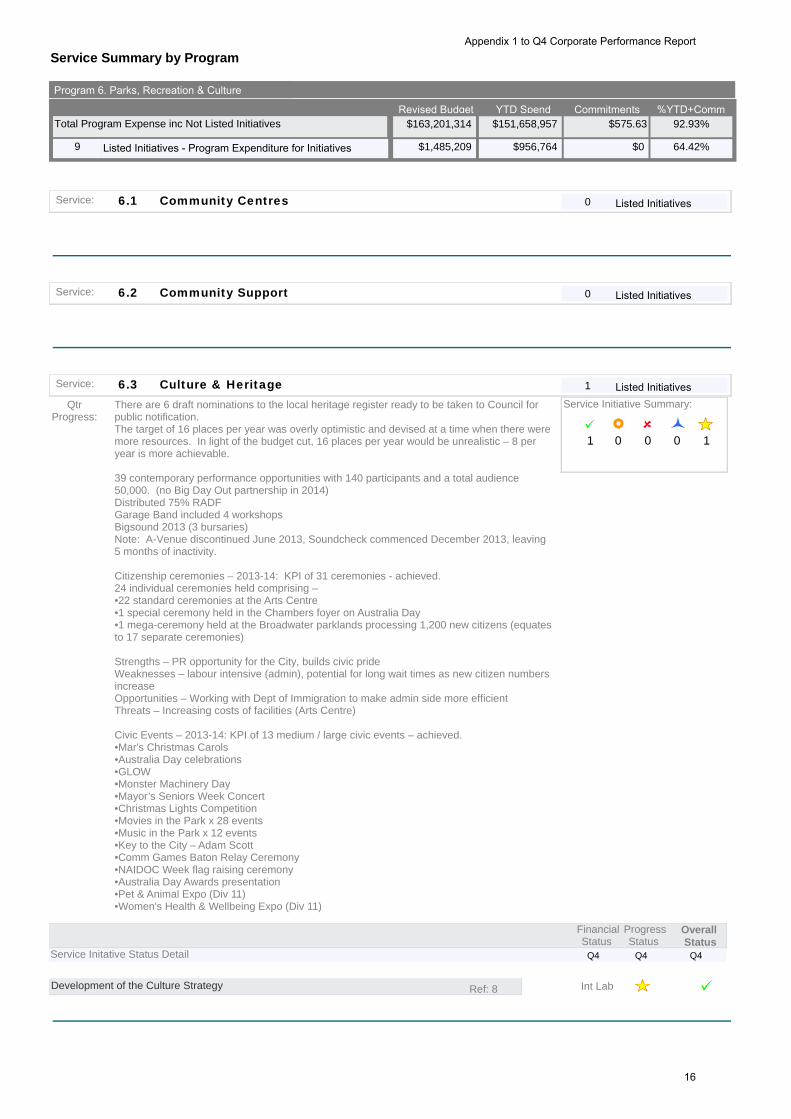
There are 6 draft nominations to the local heritage register ready to be taken to Council for public notification.The target of 16 places per year was overly optimistic and devised at a time when there were more resources. In light of the budget cut, 16 places per year would be unrealistic – 8 per year is more achievable.
39 contemporary performance opportunities with 140 participants and a total audience 50,000. (no Big Day Out partnership in 2014)Distributed 75% RADFGarage Band included 4 workshopsBigsound 2013 (3 bursaries)Note: A-Venue discontinued June 2013, Soundcheck commenced December 2013, leaving 5 months of inactivity.
Citizenship ceremonies – 2013-14: KPI of 31 ceremonies - achieved. 24 individual ceremonies held comprising – •22 standard ceremonies at the Arts Centre •1 special ceremony held in the Chambers foyer on Australia Day
•1 mega-ceremony held at the Broadwater parklands processing 1,200 new citizens (equates to 17 separate ceremonies)
Strengths – PR opportunity for the City, builds civic prideWeaknesses – labour intensive (admin), potential for long wait times as new citizen numbers increase Opportunities – Working with Dept of Immigration to make admin side more efficientThreats – Increasing costs of facilities (Arts Centre)
Civic Events – 2013-14: KPI of 13 medium / large civic events – achieved. •Mar's Christmas Carols •Australia Day celebrations •GLOW •Monster Machinery Day •Mayor’s Seniors Week Concert •Christmas Lights Competition •Movies in the Park x 28 events •Music in the Park x 12 events •Key to the City – Adam Scott •Comm Games Baton Relay Ceremony •NAIDOC Week flag raising ceremony •Australia Day Awards presentation •Pet & Animal Expo (Div 11) •Women's Health & Wellbeing Expo (Div 11)
Service Initiative Summary:
1
0.00 $0.00 0.001 Interna Int LabDevelopment of the Culture Strategy Ref: 8
Appendix 1 to Q4 Corporate Performance Report
16

Service Summary by Program
Library Services6.4Service: Listed Initiatives0
0
Parks, Sport & Recreation6.5Service: Listed Initiatives4
65ProgressStatus
FinancialStatus
Overall Status
Q4 Q4 Q4 Service Initative Status Detail
43 1 0 0
Qtr Progress:
Landscape assets along the light rail corridor are being assessed for handover to Council.Nature based recreation popularity continues to grow, Council facilitated programs such as Naturally GC and Beaches to Bushland are increasing in popularity.Hazard reduction burn program currently underway to reduce the risk of bushfire with the City's natural areas.The capacity of some tenants ( local sports and community groups) to maintain leased assets will be a challenge as these assets reach a condition where they require significant investment to repair, renovate and/or replace. Parks &Rec continue to explore efficiencies in delivering value for money services. Energy and water consumption, over-servicing, delivery methodology and other practices are being reviewed.
Service Initiative Summary:
2
0.00 292.39 0.000 FundeExtension of the Coplicks Sports Park Ref: 77
0.00 605.66 0.001 FundeImprovements to Sports Fields Ref: 98
0.00 436.53 0.001 FundeInstallation of fences, gates & signage at conservation sites Ref: 74
0.00 365.31 0.000 FundeUpgrade of Betty Diamond Sport Field Ref: 195
Tourist Parks & Campgrounds6.6Service: Listed Initiatives4
66ProgressStatus
FinancialStatus
Overall Status
Q4 Q4 Q4 Service Initative Status Detail
40 4 0 0
Qtr Progress:
Service News and highlightsOccupancy reflected a minor downturn on previous period. Whilst traditional busy and holiday periods are well occupied, less popular periods are affected by competitive tariff structures.Very positive customer feedback via Industry blogs and social media platforms.
Service challengesHigher operational costs than competitors, due to whole of city contracts. Excessive utilities costs requires monitoring as does sustainable infrastructure solutions.
Service Initiative Summary:
0
0.00 285.65 0.000 FundeConstruction of a Utilities Compound (South Stradbroke) Ref: 143
9.00 113.67 0.000 FundeNew and Renovated Accommodation at Tipplers Ref: 140
0.00 444.96 0.000 FundeRemediation of Contaminated Land at Tipplers Ref: 144
0.00 220.16 0.000 FundeRepair and Replace Jetties at Tipplers Ref: 139
Appendix 1 to Q4 Corporate Performance Report
17

Service Summary by Program
Total Program Expense inc Not Listed InitiativesRevised Budget
$108,336,257Commitments
$48,054.73
Program 7. Waste Management
%YTD+Comm90.31%
YTD Spend$97,789,897
$30,962,343 $27,200,896 $47,655 88.01%Listed Initiatives - Program Expenditure for Initiatives13
City Cleaning7.1Service: Listed Initiatives0
0
Recycling7.2Service: Listed Initiatives0
0
Waste Collection7.3Service: Listed Initiatives0
0
Appendix 1 to Q4 Corporate Performance Report
18
Service Summary by Program
Waste Disposal7.4Service: Listed Initiatives13
74ProgressStatus
FinancialStatus
Overall Status
Q4 Q4 Q4 Service Initative Status Detail
135 8 0 0
Qtr Progress:
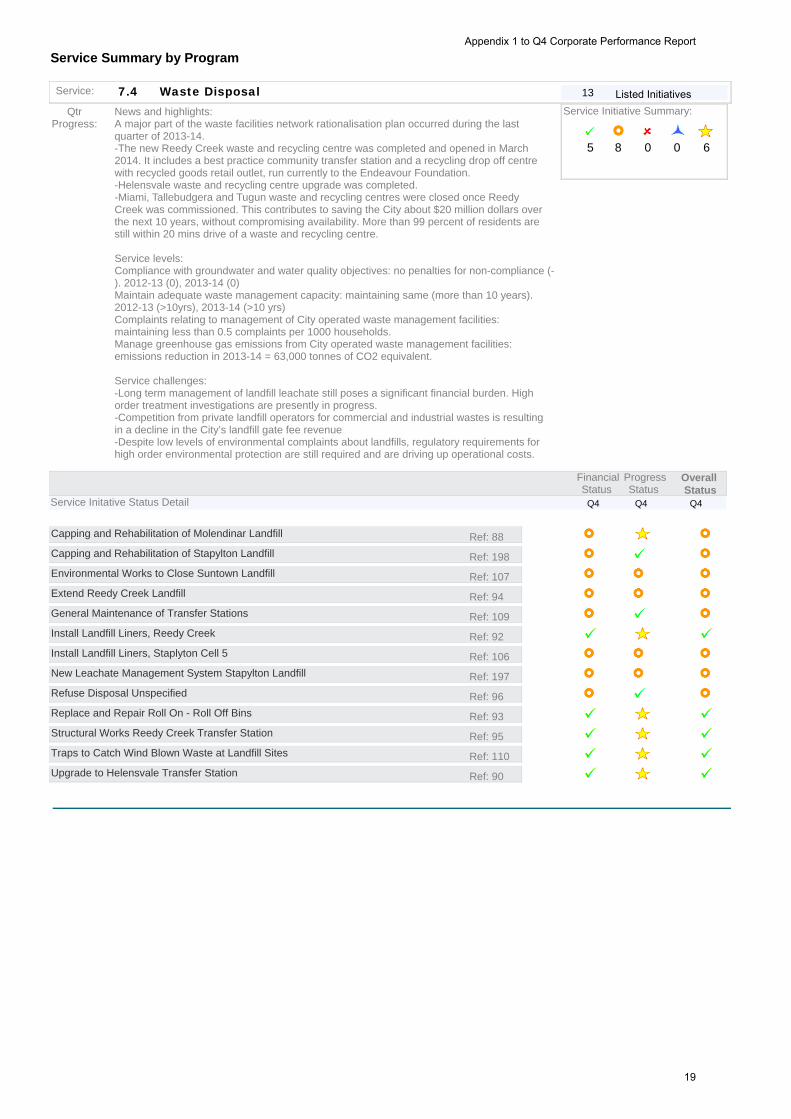
News and highlights:A major part of the waste facilities network rationalisation plan occurred during the last quarter of 2013-14. -The new Reedy Creek waste and recycling centre was completed and opened in March
2014. It includes a best practice community transfer station and a recycling drop off centre with recycled goods retail outlet, run currently to the Endeavour Foundation. -Helensvale waste and recycling centre upgrade was completed. -Miami, Tallebudgera and Tugun waste and recycling centres were closed once Reedy
Creek was commissioned. This contributes to saving the City about $20 million dollars over the next 10 years, without compromising availability. More than 99 percent of residents are still within 20 mins drive of a waste and recycling centre.
Service levels:Compliance with groundwater and water quality objectives: no penalties for non-compliance (-). 2012-13 (0), 2013-14 (0)Maintain adequate waste management capacity: maintaining same (more than 10 years). 2012-13 (>10yrs), 2013-14 (>10 yrs)Complaints relating to management of City operated waste management facilities: maintaining less than 0.5 complaints per 1000 households.Manage greenhouse gas emissions from City operated waste management facilities: emissions reduction in 2013-14 = 63,000 tonnes of CO2 equivalent.
Service challenges: -Long term management of landfill leachate still poses a significant financial burden. High
order treatment investigations are presently in progress. -Competition from private landfill operators for commercial and industrial wastes is resulting
in a decline in the City’s landfill gate fee revenue -Despite low levels of environmental complaints about landfills, regulatory requirements for
high order environmental protection are still required and are driving up operational costs.
Service Initiative Summary:
6
0.00 417.07 0.001 FundeCapping and Rehabilitation of Molendinar Landfill Ref: 88
0.00 172.13 0.000 FundeCapping and Rehabilitation of Stapylton Landfill Ref: 198
7.00 842.74 0.000 FundeEnvironmental Works to Close Suntown Landfill Ref: 107
2.00 420.12 0.000 FundeExtend Reedy Creek Landfill Ref: 94
0.00 826.33 0.000 FundeGeneral Maintenance of Transfer Stations Ref: 109
8.00 699.94 6.001 FundeInstall Landfill Liners, Reedy Creek Ref: 92
7.00 853.39 4.870 FundeInstall Landfill Liners, Staplyton Cell 5 Ref: 106
7.00 566.61 0.000 FundeNew Leachate Management System Stapylton Landfill Ref: 197
4.00 266.16 0.000 FundeRefuse Disposal Unspecified Ref: 96
0.00 466.75 0.001 FundeReplace and Repair Roll On - Roll Off Bins Ref: 93
0.00 772.53 3.861 FundeStructural Works Reedy Creek Transfer Station Ref: 95
0.00 081.90 0.001 FundeTraps to Catch Wind Blown Waste at Landfill Sites Ref: 110
8.00 510.61 0.001 FundeUpgrade to Helensvale Transfer Station Ref: 90
Appendix 1 to Q4 Corporate Performance Report
19

Service Summary by Program
Total Program Expense inc Not Listed InitiativesRevised Budget
$335,516,198Commitments
$25,638.50
Program 8. Water & Sewerage
%YTD+Comm99.19%
YTD Spend$332,765,193
$15,101,470 $15,130,497 $0 100.19%Listed Initiatives - Program Expenditure for Initiatives12
Recycled Water8.1Service: Listed Initiatives0
0
Sewerage8.2Service: Listed Initiatives8
82ProgressStatus
FinancialStatus
Overall Status
Q4 Q4 Q4 Service Initative Status Detail
86 0 0 1
1
Qtr Progress:
News and highlightsGCW continues to manage and maintain a reliable sewerage system ensuring high quality health and environmental outcomes for the city.
Service levels: (July 2013 to Jun 2014) •3 of 4 sewage treatment plants were compliant at all times •49527.74ML of sewage was collected in 2013/2014 •20.91% of recycled water was reused (excluding A+) •6 sewage overflows (notifiable overflows) were reported to the regulator (DEHP)
The service level below cannot be reported on as the data required to be able to provide this figure is unavailable for the period of Jan – Jun 2014. Therefore the total figure for the year cannot be calculated correctly. This is due to problems occurring with the transition of data from Hansen to SAP. •Sewerage main breaks and chokes – per 100km of sewer main
Key issuesThere has been continual monitoring and control to minimise HACCP excursions (breaches of standard) at sewage treatment plants.
Service Initiative Summary:
0
0.00 087.62 0.000 FundeCompletion of Merrimac East Network Upgrade Program Ref: 161
0.00 195.12 0.000 FundeConstruction of Mains at Burleigh Waters Ref: 159
0.00 $0.00 0.000 FundeDesign & Construct Mudgeeraba Sewerage Mains Diversion Ref: 162
0.00 485.57 0.000 FundeInstall a Third Pump at Benowa Sewerage Pump Station (SPS) Ref: 168
0.00 014.77 0.000 FundeMerrimac West Sewerage Network Augmentation Ref: 160
0.00 498.08 0.000 FundeProvide a Long Term Seaway Release Solution Ref: 163
0.00 006.74 0.000 FundeRefurbishment of process tanks at Elanora and Coombabah Sewage Treatment Plant (STP)Ref: 165
0.00 748.07 0.000 FundeUpgrade of Benowa Sewerage Pump Station (SPS) Ref: 169
Appendix 1 to Q4 Corporate Performance Report
20
Service Summary by Program
Water8.3Service: Listed Initiatives4
83ProgressStatus
FinancialStatus
Overall Status
Q4 Q4 Q4 Service Initative Status Detail
44 0 0 0
Qtr Progress:
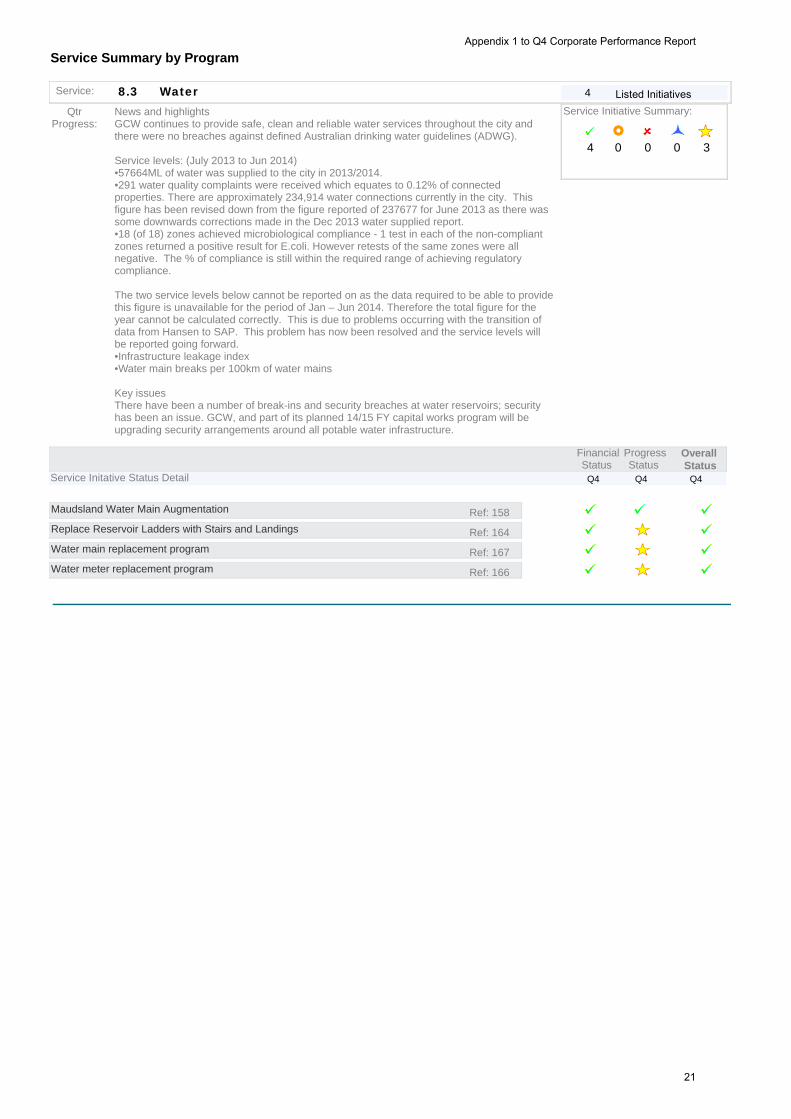
News and highlightsGCW continues to provide safe, clean and reliable water services throughout the city and there were no breaches against defined Australian drinking water guidelines (ADWG). Service levels: (July 2013 to Jun 2014) •57664ML of water was supplied to the city in 2013/2014. •291 water quality complaints were received which equates to 0.12% of connected
properties. There are approximately 234,914 water connections currently in the city. This figure has been revised down from the figure reported of 237677 for June 2013 as there was some downwards corrections made in the Dec 2013 water supplied report. •18 (of 18) zones achieved microbiological compliance - 1 test in each of the non-compliant zones returned a positive result for E.coli. However retests of the same zones were all negative. The % of compliance is still within the required range of achieving regulatory compliance.
The two service levels below cannot be reported on as the data required to be able to provide this figure is unavailable for the period of Jan – Jun 2014. Therefore the total figure for the year cannot be calculated correctly. This is due to problems occurring with the transition of data from Hansen to SAP. This problem has now been resolved and the service levels will be reported going forward. •Infrastructure leakage index •Water main breaks per 100km of water mains
Key issuesThere have been a number of break-ins and security breaches at water reservoirs; security has been an issue. GCW, and part of its planned 14/15 FY capital works program will be upgrading security arrangements around all potable water infrastructure.
Service Initiative Summary:
3
0.00 852.33 0.000 FundeMaudsland Water Main Augmentation Ref: 158
0.00 552.90 0.001 FundeReplace Reservoir Ladders with Stairs and Landings Ref: 164
0.00 631.71 0.001 FundeWater main replacement program Ref: 167
0.00 424.26 0.001 FundeWater meter replacement program Ref: 166
Appendix 1 to Q4 Corporate Performance Report
21

Service Summary by Program
Total Program Expense inc Not Listed InitiativesRevised Budget
$247,662,937Commitments
$100,044.97
Program 9. Organisational Capability
%YTD+Comm71.70%
YTD Spend$177,484,205
$17,088,763 $14,338,281 $0 83.90%Listed Initiatives - Program Expenditure for Initiatives33
Measures:Financial: Asset Consumption Ratio254
Financial: Budget vs Actual Capital Expenditure256
Financial: Budget vs Actual Operating Expenditure255
0Financial: Debt Ratio116
0Financial: Debt Servicing Ratio115
Financial: Interest Coverage Ratio253
0Financial: Rates Revenue Ratio117
0Financial: Return on Investment114
0Financial: State and Federal Government subsidies and Grants113
0Financial: Working capital ratio118
IT: Incident Response Time Meeting Target271
IT: Number of Business Critical Applications Unavailable270
IT: Percentage Council Internet Downtime272
0Procurement: Bankable savings achieved134
0Reputation: Complaints lodged vs number of cases of maladministration by Queensland Ombudsm138
Reputation: Implementation of Audit Recommendations250
0Revenue: Unpaid Rates and Charges179
Risk: WH&S: Reported Incidents257
0Risk: Workers Compensation Claims - medical expenses249
3 5Staff: Additional employee hours expenditure334
Staff: Excess Accrued Leave268
0Staff: Turnover Rate137
Staff: Workforce Composition Profile267
Corporate Planning & Performance9.1Service: Listed Initiatives7
Appendix 1 to Q4 Corporate Performance Report
22

Service Summary by Program
91ProgressStatus
FinancialStatus
Overall Status
Q4 Q4 Q4 Service Initative Status Detail
77 0 0 0
Qtr Progress:
During 2013-14, the Branch has supported the finalisation of key corporate strategies, including Economic Development and Culture; finalised the new Corporate Plan - Gold Coast 2020 ; produced the Annual Report 2012-13 (this report was recognised at the Australasian Reporting Awards 2014, receiving a Gold Award for the Report and being a finalist in the Governance Awards); produced the State of the Organisation Report 2012-13 and Q2 2013-14 ; supported the review / approval of 54 Corporate Policies; supported the development of 42 corporate programs / projects through the various stages of the Value Management process, including 31 new proposals; supported the planning & delivery of 21 community engagement initiatives across the business and produced the Quarterly Corporate Performance Report and a range of associated Infrastructure Portfolio Reports for 2013-14 (which review organisational progress against Strategies, Corporate and Operational Plans). The Branch has also coordinated the development and implementation of the planning and budget process for 2014-15 on behalf of the OCEO, including the continuing improvement of the forward planning of the corporate portfolios to support decision-making and culminating in the adoption of the Annual Plan 2014-15. Key challenges continue to include managing priorities and the peaks in workload; supporting a line of sight between strategic and operational planning and improving the timeliness of forward planning of activity across the business. A significant proportion of Branch work supports the organisation to meet core legislative requirements.
Advocacy and regional collaboration activities delivered through the Mayor's office, has included continued working with the State Government to identify and reduce cost shifting across a range of service delivery areas; developing communication protocols with the Commonwealth Games; engaging with and building community support in key policy areas such as senior transport benefits including free off peak travel; Boral Quarry, Broadwater Marine Project; community safety including crime reduction, wilful property damage including graffiti and successful application for partnership funding for increased cameras in key city precincts. Additional work has been undertaken negotiating with the State Government on the light rail extension, and other transport issues such as key arterials throughout the city and the City's Cultural Precinct development. Federal Government engagement has included meetings to discuss road infrastructure, communications, regional economic development, student visas and international university accreditation and an update on a number of City projects including FIFO and Digital Enterprise programs.
Service Initiative Summary:
2
0.00 $0.00 0.001 Interna Int LabDevelopment of the New Corporate Plan Ref: 32
0.00 $0.00 0.001 Interna Int LabDevelopment of the New Operational Plan Ref: 34
0.00 $0.00 0.000 Interna Int LabManagement of Corporate Activity Program and Project Portfolio Ref: 29
0.00 $0.00 0.000 Interna Int LabManagement of Corporate Policy Portfolio Ref: 31
0.00 $0.00 0.000 Interna Int LabManagement of Corporate Strategy Portfolio Ref: 30
0.00 $0.00 0.000 Interna Int LabManagement of Municipal Infrastructure Portfolio of Programs and Projects Ref: 28
0.00 $0.00 0.000 Interna Int LabReview of the Community Engagement Policy Ref: 33
Financial Management9.2Service: Listed Initiatives1
92ProgressStatus
FinancialStatus
Overall Status
Q4 Q4 Q4 Service Initative Status Detail
11 0 0 0
Qtr Progress:
The Annual Financial Statements were able to be delivered within the agreed timeframes and without qualification by the Queensland Audit Office. Indications are that there will be a favourable year end actual against budget result that will help underpin the 2014-15 budget. The 2014-15 budget was adopted on 18 June 2014 in accordance with the agreed timetable. Queensland Treasury Corporation have considered the issues relating to Council's financial sustainability ratios and have agreed to work with Council to develop a more suitable financial performance indicator.
Service Initiative Summary:
0
0.00 $0.00 0.000 Interna Int LabAsset Management Improvement Program Ref: 35
Appendix 1 to Q4 Corporate Performance Report
23
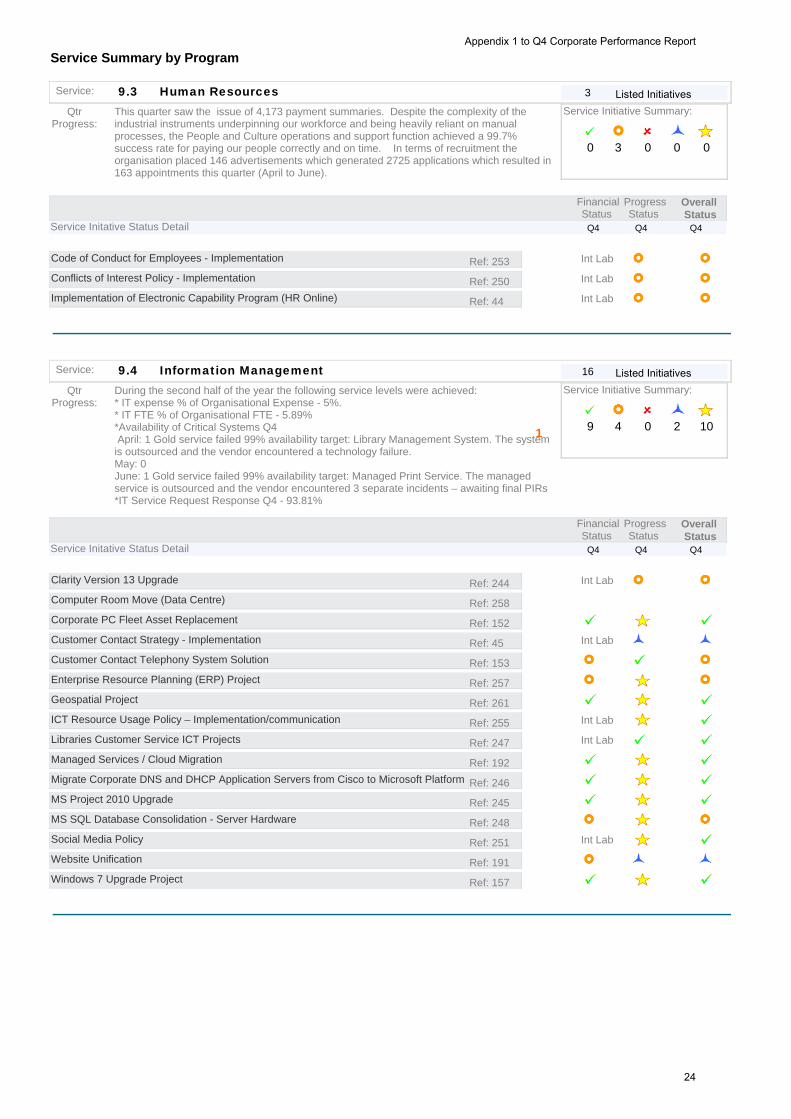
Service Summary by Program
Human Resources9.3Service: Listed Initiatives3
93ProgressStatus
FinancialStatus
Overall Status
Q4 Q4 Q4 Service Initative Status Detail
30 3 0 0
Qtr Progress:
This quarter saw the issue of 4,173 payment summaries. Despite the complexity of the industrial instruments underpinning our workforce and being heavily reliant on manual processes, the People and Culture operations and support function achieved a 99.7% success rate for paying our people correctly and on time. In terms of recruitment the organisation placed 146 advertisements which generated 2725 applications which resulted in 163 appointments this quarter (April to June).
Service Initiative Summary:
0
0.00 $0.00 0.000 Interna Int LabCode of Conduct for Employees - Implementation Ref: 253
0.00 $0.00 0.000 Interna Int LabConflicts of Interest Policy - Implementation Ref: 250
0.00 $0.00 0.000 Interna Int LabImplementation of Electronic Capability Program (HR Online) Ref: 44
Information Management9.4Service: Listed Initiatives16
94ProgressStatus
FinancialStatus
Overall Status
Q4 Q4 Q4 Service Initative Status Detail
169 4 0 2
1
Qtr Progress:
During the second half of the year the following service levels were achieved:* IT expense % of Organisational Expense - 5%. * IT FTE % of Organisational FTE - 5.89%*Availability of Critical Systems Q4 April: 1 Gold service failed 99% availability target: Library Management System. The system is outsourced and the vendor encountered a technology failure.May: 0June: 1 Gold service failed 99% availability target: Managed Print Service. The managed service is outsourced and the vendor encountered 3 separate incidents – awaiting final PIRs*IT Service Request Response Q4 - 93.81%
Service Initiative Summary:
10
0.00 $0.00 0.000 Interna Int LabClarity Version 13 Upgrade Ref: 244
0.00 $0.00 0.000 FundeComputer Room Move (Data Centre) Ref: 258
3.00 972.70 0.001 FundeCorporate PC Fleet Asset Replacement Ref: 152
0.00 $0.00 0.000 Interna Int LabCustomer Contact Strategy - Implementation Ref: 45
0.00 268.26 0.000 FundeCustomer Contact Telephony System Solution Ref: 153
9.00 168.98 0.001 FundeEnterprise Resource Planning (ERP) Project Ref: 257
0.00 454.18 0.001 FundeGeospatial Project Ref: 261
0.00 $0.00 0.001 Interna Int LabICT Resource Usage Policy – Implementation/communication Ref: 255
0.00 $0.00 0.000 Interna Int LabLibraries Customer Service ICT Projects Ref: 247
0.00 $0.00 0.001 FundeManaged Services / Cloud Migration Ref: 192
1.00 141.65 0.001 FundeMigrate Corporate DNS and DHCP Application Servers from Cisco to Microsoft Platform Ref: 246
9.00 193.17 0.001 FundeMS Project 2010 Upgrade Ref: 245
4.00 810.24 0.001 FundeMS SQL Database Consolidation - Server Hardware Ref: 248
0.00 $0.00 0.001 Interna Int LabSocial Media Policy Ref: 251
5.00 925.00 0.000 FundeWebsite Unification Ref: 191
9.00 048.19 0.001 FundeWindows 7 Upgrade Project Ref: 157
Appendix 1 to Q4 Corporate Performance Report
24

Service Summary by Program
Risk Management9.5Service: Listed Initiatives6
95ProgressStatus
FinancialStatus
Overall Status
Q4 Q4 Q4 Service Initative Status Detail
63 3 0 0
Qtr Progress:
Continuous improvement and increased maturity of Risk Management is evident across the organisation, the delivery of 2014-15 Corporate Risk Business Plan activities are on track. Key achievements include successful implementation of the Corporate WHS IT system and the legislative Corporate health monitoring program.The corporate Security Policy has been reviewed and rolled out, this Policy prescribes the standards for protection of Council asset. The Portable & Attractive Items Policy has also been reviewed and is current while the Cash & Negotiable Instruments Handling Policy is current but a review has commenced. and a Memorandum of Understanding.Other Major challenges have been the processing / management of Security incidents reports and CCTV information requests including the continual liaison with external agencies dealing with day to day criminal offences against Council.Regular consultation have been ongoing for Community Venues specifically surrounding the PanPac and Commonwealth games Physical Security /Asset Protection as well as other Council assets and include Security Risk Reviews conducted on GCW sites, Referable dams and job sites to ensure there is an adequate level of asset protection in place.Delivery of Internal Audit services continues to be on track and in accordance with the approved 2013-14 Internal Audit Plan. Early audit involvement in major IT and organisational change projects has delivered additional benefit and assurance to management and Council’s Audit Committee. Ensuring that internal audit services continuously evolve and improve to meet current and future organisational needs will remain the greatest challenge for the Internal Audit Service over the coming quarters.
Service Initiative Summary:
2
3.00 554.84 0.001 FundeCorporate Workplace Health and Safety System Ref: 18
8.00 850.82 0.001 FundeGCCC CCTV Licensing Upgrade Ref: 154
2.00 103.45 0.000 FundeGCCC Employees Health Monitoring Program Ref: 17
0.00 326.39 0.000 FundeGCCC Upgrade to Security System (Forcefield System) Ref: 156
0.00 $0.00 0.000 Interna Int LabGold Coast City Enterprise Risk Management Ref: 24
0.00 $0.00 0.000 Interna Int LabImprovements to Workplace Health and Safety Management Ref: 4
Appendix 1 to Q4 Corporate Performance Report
25

Service Summary by Program
Total Program Expense inc Not Listed InitiativesRevised Budget
$184,653,703Commitments
$120,876.88
Program 10. Internal Services
%YTD+Comm82.30%
YTD Spend$151,847,871
$32,107,223 $19,250,823 -$22,058 59.89%Listed Initiatives - Program Expenditure for Initiatives12
Measures:Customer Contact: Enquiries by Subject and Timing at Customer Contact Centre278
Customer Contact: Channel Split by Volume269
Property: Operating cost per m2277
Reputation: Positive media coverage of Gold Coast City214
Council Support10.1Service: Listed Initiatives0
0
Design Services10.2Service: Listed Initiatives0
0
Fleet & Plant10.3Service: Listed Initiatives1
103ProgressStatus
FinancialStatus
Overall Status
Q4 Q4 Q4 Service Initative Status Detail
10 1 0 0
Qtr Progress:
Services completed as per the following:Hire of plant, equipment and vehicles to council for internal service delivery providers. This is achieved by management of council's internal fleet and external plant and equipment ensuring the equipment complies with council's work health and safety policies and procedures and provides good value for money. Advice requested on issues/matters was provided within reasonable and acceptable timeframes. Made all arrangements for re-registration and de-registration as per Queensland Transport requirements. On-going replacement of vehicles/plant/equipment is based on the approved condition monitoring and assessment methodology. Fleet have deferred a number of trucks for Construction Services while they review their requirements.Business challenges/riskA comprehensive branch restructure has been developed and approved in principle, however, implementation has been put on hold due to the current review of the Engineering Services Directorate. Once the review is completed, the restructure proposal will be realigned to any recommendations adopted for changes to Branch operations, and implemented. It is anticipated that the review and implementation of any recommendations will take approximately twelve months. The associated risk is staff retention due to uncertainty and business continuity.Acquisitions Challenges:The time associated with the Corporate review of the light vehicle fleet coupled with a close review of business requirements has meant a delay in the replacement of some vehicles and trucks to 14/15.
Service Initiative Summary:
0
5.00 723.80 7.600 FundeRoutine Replacement of Fleet and Plant Ref: 61
Appendix 1 to Q4 Corporate Performance Report
26

Service Summary by Program
Internal Support Services10.4Service: Listed Initiatives6
104ProgressStatus
FinancialStatus
Overall Status
Q4 Q4 Q4 Service Initative Status Detail
66 0 0 0
Qtr Progress:
There was a 2% increase in overall satisfaction with the Customer service experience with the City in 2013-14.Total volume of customer interactions continues to increase with 2013-14 recording the highest volume of interactions across all channels. Telephone enquiries reduced for the last two quarters of 2013-14 by 10-12,000 telephone calls but remained higher overall than in 2012-13 due to the centralisation of Waste Management. The reduction can be attributed to the online self-service account balance functionality which was introduced in January 2014.Searches were 14% higher than in 2013, which can be seen as an indicator of people showing confidence in the City and purchasing property.Planning and Environment enquiries are up 30% on the previous year due to the Senior Travel initiative and increase in development and building applications.Maintenance services enquiries were 8% lower than the same period the previous year due to less storm activity (which generates significant peaks in service requests).Calls offered into the contact centre increased 18% in 2013-14 compared to the previous year as a whole due to the centralisation of City Development and Waste Management. Website traffic into the corporate website grew by 14% in 2014, with the top 5 pages remaining consistent across the year. The majority of visitors are from the Gold Coast, Brisbane and the rest of Australia before international traffic.
Service Initiative Summary:
2
0.00 940.08 0.001 FundeCentralisation of Open Windows Contract Ref: 264
0.00 $0.00 0.000 Interna Int LabCustomer Oriented Business Improvement Project (COBI) Ref: 260
0.00 145.95 0.001 FundeSeparation costs from Allconnex Water - Lease Costs Ref: 48
0.00 $0.00 0.000 FundeSeparation costs from Allconnex Water - Legal Costs Ref: 46
4.00 436.92 0.000 FundeSeparation costs from Allconnex Water - Logan / Redland Ref: 49
9.00 984.23 0.000 FundeSeparation costs from Allconnex Water - Staffing Costs Ref: 47
Marketing & Promotions10.5Service: Listed Initiatives2
105ProgressStatus
FinancialStatus
Overall Status
Q4 Q4 Q4 Service Initative Status Detail
22 0 0 0
Qtr Progress:
A 5 percent increase in City Reputation sentiment tracking has been recorded via iSENTIA post June 2013 (51% city favourability rating now at 56% June 2014). As at 30 June 2014, the City's Facebook page had 15,102 followers and there were 4800 active Twitter followers.
Service Initiative Summary:
2
0.00 $0.00 0.001 Interna Int LabCommunity Grants Policy – Communication of changes Ref: 256
0.00 $0.00 0.001 FundeMayors Christmas Carols at Broadwater Parklands Ref: 19
Nursery Operations10.6Service: Listed Initiatives0
0
Appendix 1 to Q4 Corporate Performance Report
27

Service Summary by Program
Property & Facilities Management10.7Service: Listed Initiatives3
107ProgressStatus
FinancialStatus
Overall Status
Q4 Q4 Q4 Service Initative Status Detail
32 1 0 0
Qtr Progress:
Service News and Highlights:Qs3&4 saw a significant number of competing demands placed on the accommodation team to achieve additional unplanned staff moves. These were all achieved within client expectations although resulted some delays to the delivery of the overall accommodation program seeing the delivery of floors now extending to December 2014This period has seen the completion of Levels 1 & 3 Waterside East, Level 4 Karp Court with staff relocated to these newly completed floors. Level 5 Waterside West was substantially completed with the due date for staff moves remaining at 22-24 July 2014. At Nerang, the relocation of the Transport Branch from Varsity was also completed and work commenced on the refurbishment of the basement and Ground floors in preparation for the relocation of Engineering Services between August and November 2014.Survey were moved from Varsity Lakes following the last minute requirement to vacate. This group was moved successfully to Nerang. Service levels:Q4 - 3432 service calls received across all service areas with 3321 closed during this period.Staff moves in this period - 364Q3 - Compliance reporting - occupant statements for all council sites were completed and returned to QF&RS for the year ending 30 June 2013 meeting Council's statutory obligations in this regard.Service ChallengesLast minute, unplanned requests or organisational structure changes continue to disrupt the delivery of the accommodation program and require constant reshuffling of resources to keep the program on track.Resignation of the Energy Management Officer has delayed the delivery of the program. Extended sick leave of the Coordinator Building Operations has further delayed activity in this area.
Service Initiative Summary:
0
0.00 $0.00 0.000 Interna Int LabCorporate Security Policy Ref: 254
5.00 252.90 0.000 FundeJN52 Evandale Cultural Precinct Ref: 201
0.00 338.75 0.000 FundeStaff Accommodation and Relocation Works Ref: 155
Listed Initiative Total
Summary
Count ofListed Initiatives:
197
Budget v Actual includes not listed initiatives
Listed Initiatives 197 $172,078,532 $132,829,509 $179,195 77.30%
Total for Programs
109 70 0 15
Service Initiative Summary:
79
Total CorporateRevised Budget Expense
Total CorporateYTD Actual Expense
Total CorporateCommitment Expense
%YTD+Comm:
$1,484,471,313 $1,287,658,957 $127,594.16 84.72%
Appendix 1 to Q4 Corporate Performance Report
28


