THE TECH MARKETER’S ROLE IN CREATING THE “MARKET - DRIVEN” FIRM Operational Relevance: A Mandate for High-Tech Marketers Mark W. Vigoroso SVP, Global Marketing & Alliances Servigistics, Inc.
Transcript
T H E T EC H M A R K E T E R ’ S R O L E I N C R EAT I N G T H E “ M A R K E T - D R I V E N ” F I R M
Operational Relevance: A Mandate for High-Tech Marketers
Mark W. VigorosoSVP, Global Marketing & Alliances
Servigistics, Inc.
Agenda2
What is “operational relevance”?
3 examples: Product Development, Sales, and Service Ops
Payoffs
Hypothesis3
Marketing needs to achieve operational relevance in order for the company to realize the strategic and financial benefits of being a “market-driven” firm.
Is Your Marketing Team Operationally Relevant?4
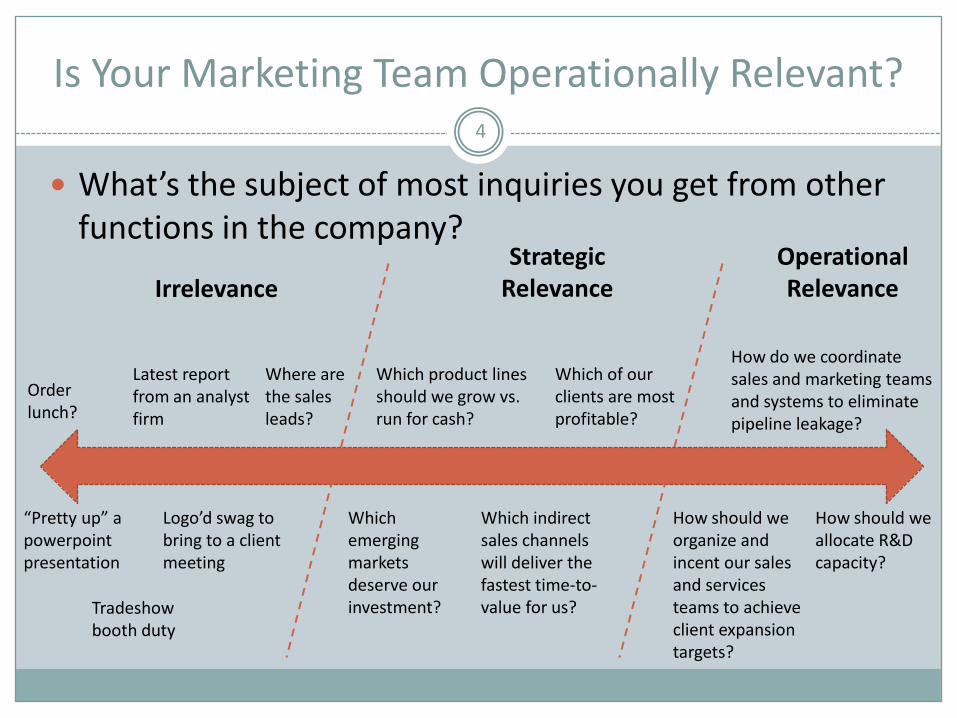
What’s the subject of most inquiries you get from other functions in the company?
“Pretty up” a powerpointpresentation
Logo’d swag to bring to a client meeting
Latest report from an analyst firm
Where are the sales leads?
Order lunch?
How should we allocate R&D capacity?
Which indirect sales channels will deliver the fastest time-to-value for us?
Which of our clients are most profitable?
Which emerging markets deserve our investment?
Which product lines should we grow vs. run for cash?
How should we organize and incent our sales and services teams to achieve client expansion targets?
How do we coordinate sales and marketing teams and systems to eliminate pipeline leakage?
IrrelevanceStrategic
RelevanceOperational Relevance
Tradeshow booth duty
What is “Market-driven”?5
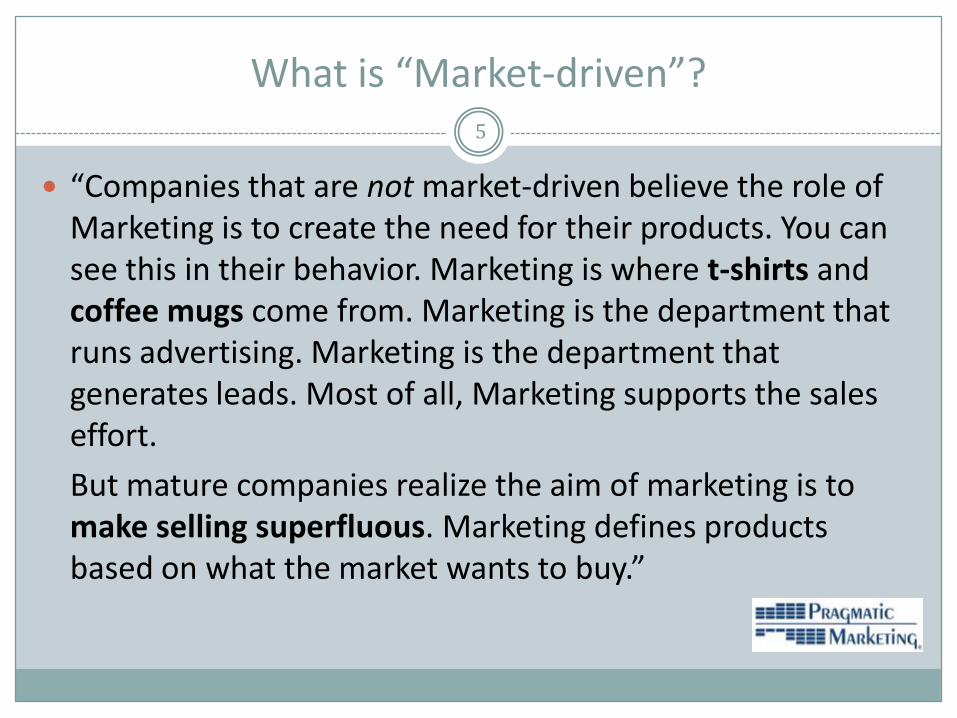
“Companies that are not market-driven believe the role of Marketing is to create the need for their products. You can see this in their behavior. Marketing is where t-shirts and coffee mugs come from. Marketing is the department that runs advertising. Marketing is the department that generates leads. Most of all, Marketing supports the sales effort.
But mature companies realize the aim of marketing is to make selling superfluous. Marketing defines products based on what the market wants to buy.”
Strategic Relevance…6
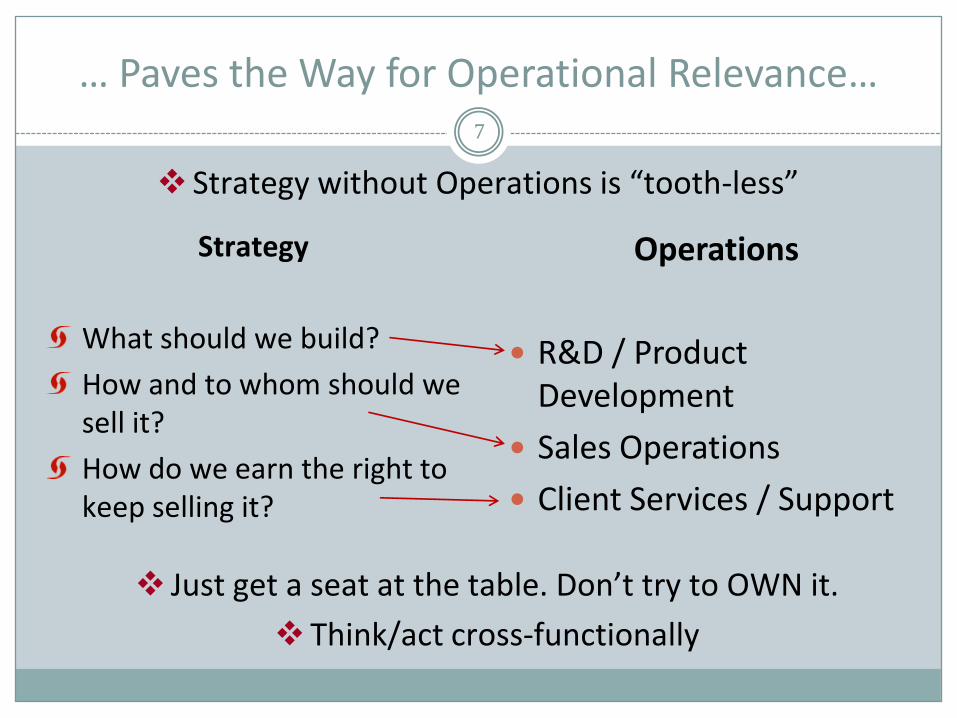
Strategy without Operations is “tooth-less”
… Paves the Way for Operational Relevance…7
Operations
R&D / Product Development
Sales Operations
Client Services / Support
Strategy
What should we build?
How and to whom should we sell it?
How do we earn the right to keep selling it?
Just get a seat at the table. Don’t try to OWN it.
Think/act cross-functionally
Agenda8
What is “operational relevance”?
3 examples: Product Development, Sales, and Service Ops
Payoffs
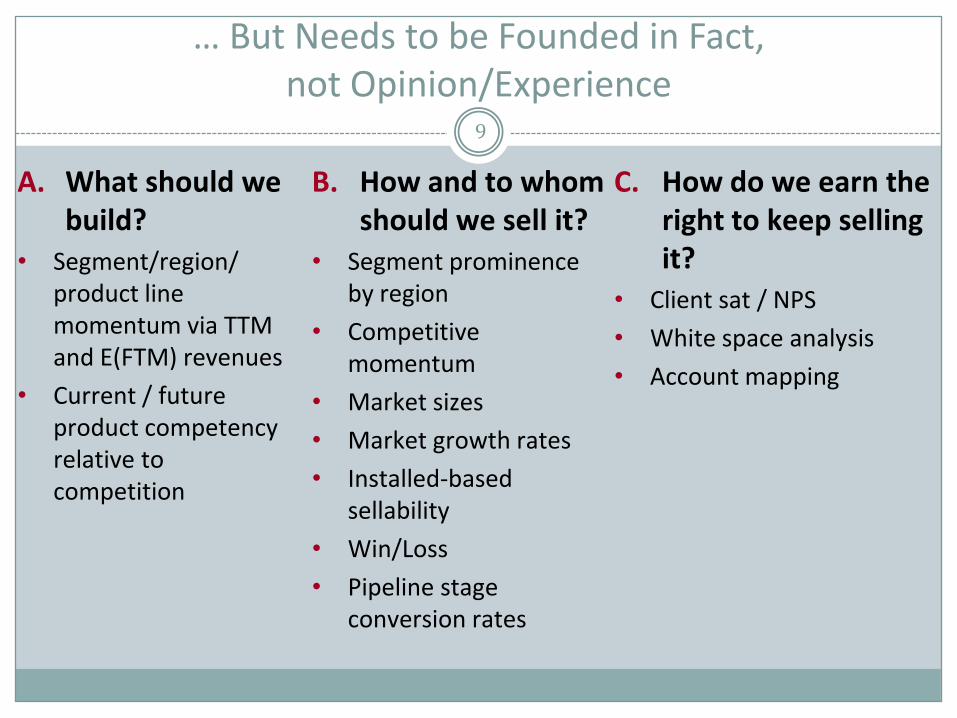
… But Needs to be Founded in Fact, not Opinion/Experience
9
A. What should we build?
• Segment/region/ product line momentum via TTM and E(FTM) revenues
• Current / future product competency relative to competition
B. How and to whom should we sell it?
• Segment prominence by region
• Competitive momentum
• Market sizes
• Market growth rates
• Installed-based sellability
• Win/Loss
• Pipeline stage conversion rates
C. How do we earn the right to keep selling it?
• Client sat / NPS
• White space analysis
• Account mapping
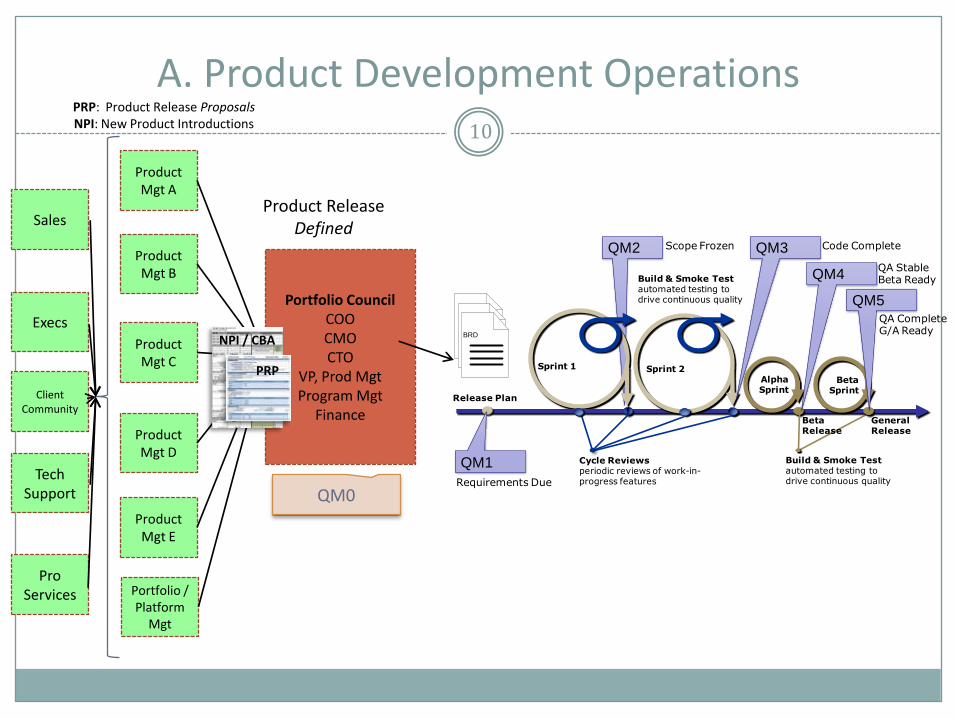
QM2
Build & Smoke Testautomated testing to drive continuous quality
General Release
Release Plan
Beta Release
Cycle Reviewsperiodic reviews of work-in-progress features
QM3
QM4
QM5
QM1
Code Complete
QA StableBeta Ready
QA CompleteG/A Ready
Requirements Due
Sprint 1 Sprint 2AlphaSprint
Beta Sprint
Scope Frozen
Build & Smoke Testautomated testing to drive continuous quality
Portfolio CouncilCOOCMOCTO
VP, Prod MgtProgram Mgt
Finance
Product Mgt A
Product Mgt C
Product Mgt B
Product Mgt D
Product Mgt E
PRP: Product Release ProposalsNPI: New Product Introductions
Product Release Defined
BRD
QM0
Portfolio / Platform
Mgt
Sales
Tech Support
Execs
Pro Services
PRP
NPI / CBA
Client Community
10
A. Product Development Operations
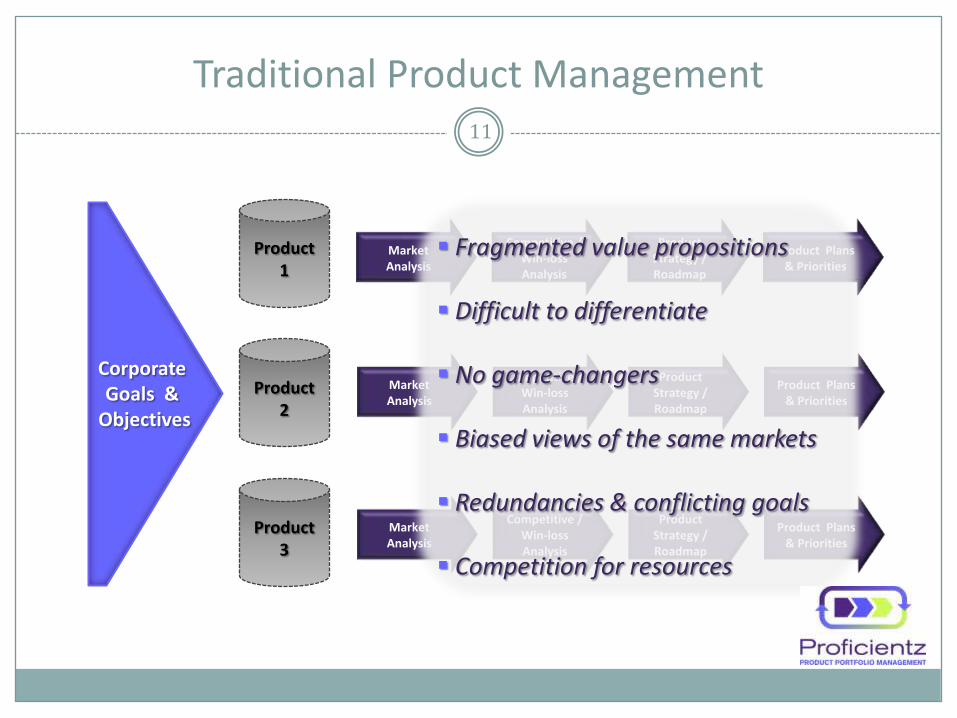
Traditional Product Management
Product 1
MarketAnalysis
Competitive / Win-lossAnalysis
Product Strategy / Roadmap
Product Plans & Priorities
Product 2
Product 3
MarketAnalysis
Competitive / Win-lossAnalysis
Product Strategy / Roadmap
Product Plans & Priorities
MarketAnalysis
Competitive / Win-lossAnalysis
Product Strategy / Roadmap
Product Plans & Priorities
Corporate Goals &
Objectives
Fragmented value propositions
Difficult to differentiate
No game-changers
Biased views of the same markets
Redundancies & conflicting goals
Competition for resources
11
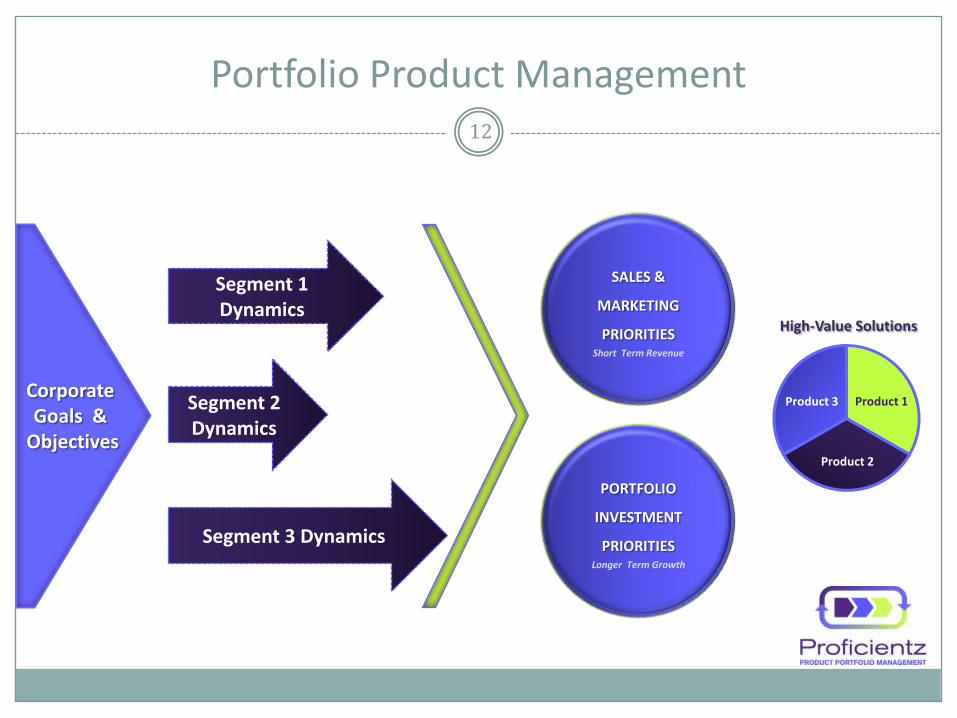
Portfolio Product Management
Segment 1 Dynamics
Segment 2 Dynamics
Segment 3 Dynamics
Corporate Goals &
Objectives
SALES &
MARKETING
PRIORITIESShort Term Revenue
PORTFOLIO
INVESTMENT
PRIORITIESLonger Term Growth
High-Value Solutions
Product 1
Product 2
Product 3
12
Scorecard for Marketing Relevance in Product Dev Ops
13
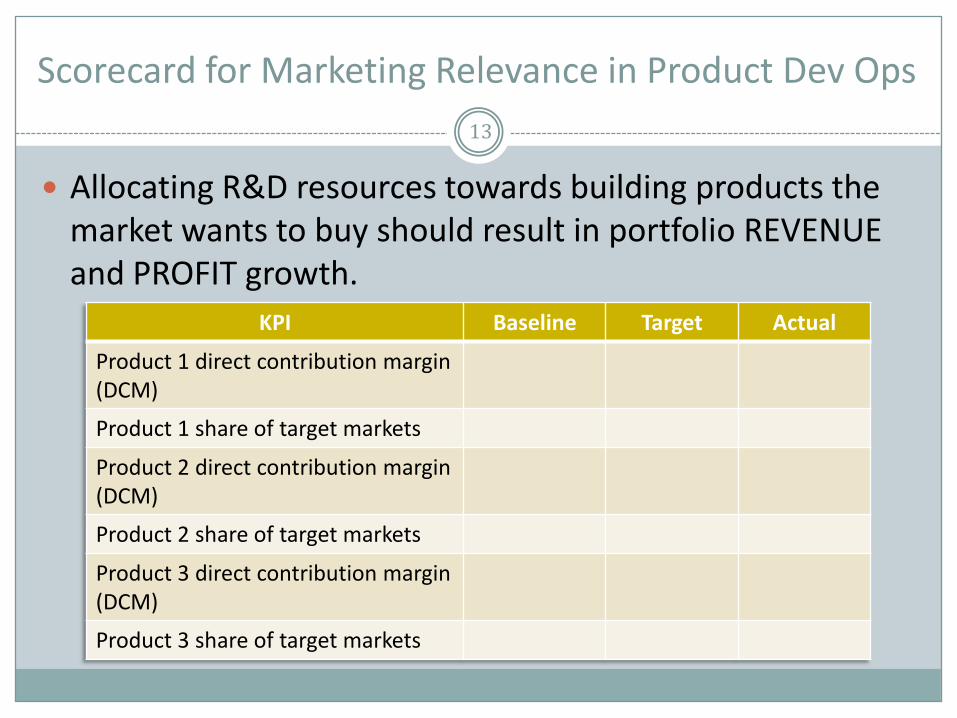
Allocating R&D resources towards building products the market wants to buy should result in portfolio REVENUE and PROFIT growth.
For 2012 planning, the Portfolio Prioritization tool contemplates the following inputs by product line…:• TTM Financials• E(FTM) Financials• Market sizes• Market growth rates• Competitive threats• Installed-based sellability
…And provides fact-based and market-driven guidance for industry segment, region, and product line bookings targets.
Translation?
Paths of least resistance to achieving top-line targets: • Shorter sales cycles• Higher win rates
14
Scorecard for Marketing Relevance in Sales Ops15
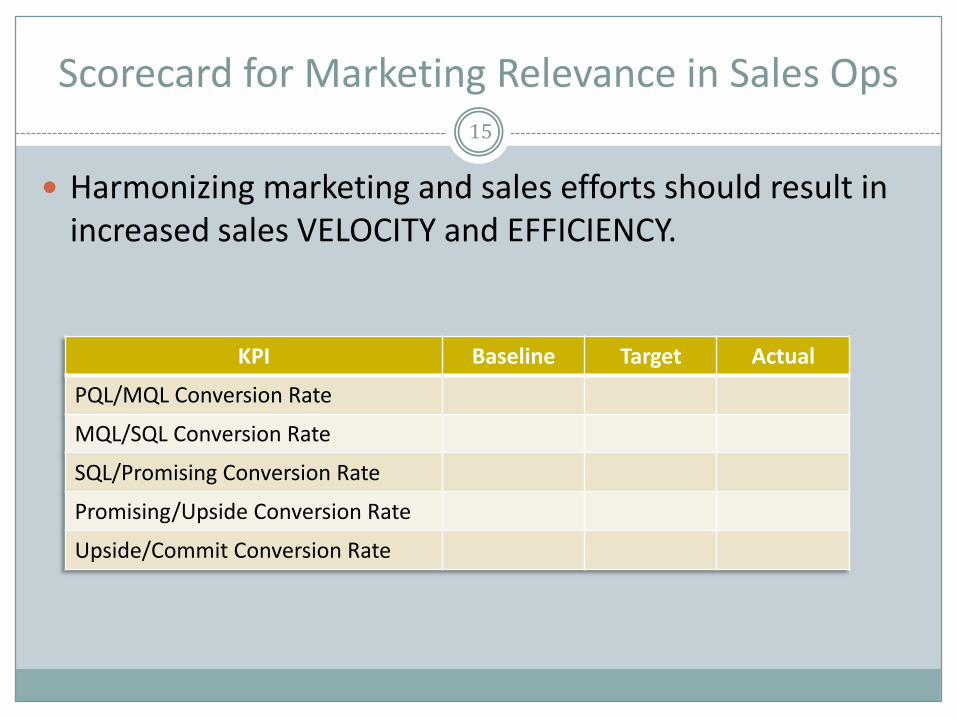
Harmonizing marketing and sales efforts should result in increased sales VELOCITY and EFFICIENCY.
KPI Baseline Target Actual
PQL/MQL Conversion Rate
MQL/SQL Conversion Rate
SQL/Promising Conversion Rate
Promising/Upside Conversion Rate
Upside/Commit Conversion Rate
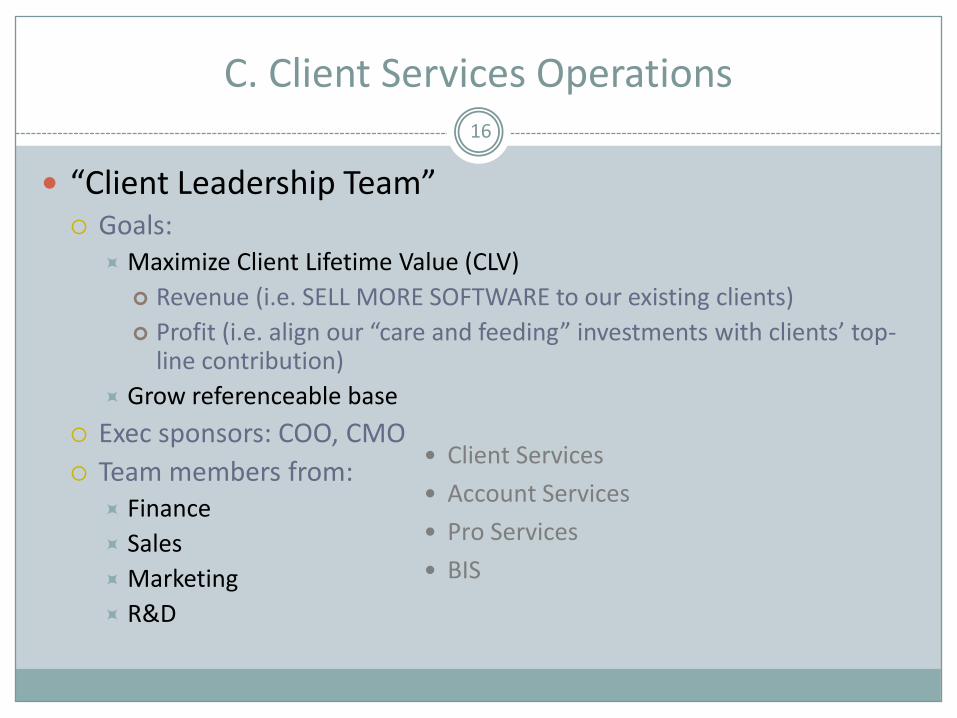
C. Client Services Operations16
“Client Leadership Team” Goals:
Maximize Client Lifetime Value (CLV)
Revenue (i.e. SELL MORE SOFTWARE to our existing clients)
Profit (i.e. align our “care and feeding” investments with clients’ top-line contribution)
Grow referenceable base
Exec sponsors: COO, CMO
Team members from: Finance
Sales
Marketing
R&D
• Client Services
• Account Services
• Pro Services
• BIS
Scorecard for Marketing Relevance in Client Service Ops
17
Sensitivity analysis on client sat data and prioritized plan for client expansion should result in highly profitable recurring revenue streams from “tier 1” clients.
Average Annual Client Value (ACV), Tier 1 accounts
Average Annual Client Value (ACV), Tier 2 accounts
Average Client Lifetime Value (CLV), Tier 1 accounts
Average Client Lifetime Value (CLV), Tier 2 accounts
Practice Sound Change Management18
Awareness
Desire
Knowledge
Ability
Reinforcement
Agenda19
What is “operational relevance”?
3 examples: Product Development, Sales, and Service Ops
Payoffs
Payoffs20
What matters most in company valuation? PROFIT (OPERATING)
PROFIT GROWTH
An operationally relevant marketing organization bridges the gap between the top-line-only incented sales organization and the often bottom-line-blind delivery and service organizations. Source of operational cost is often not the best source for driving
operational efficiency
Go-to-market strategy drives operational decisions and organizational structure
Operating profit is created and grown via selling the right product to the right companies in the right markets