32
Operational Risk Management: A Practical Approach and its Regulatory Implications Federal Reserve Bank of Boston November 2001

Operational Risk Management: APractical Approach and itsRegulatory Implications
Federal Reserve Bank of BostonNovember 2001
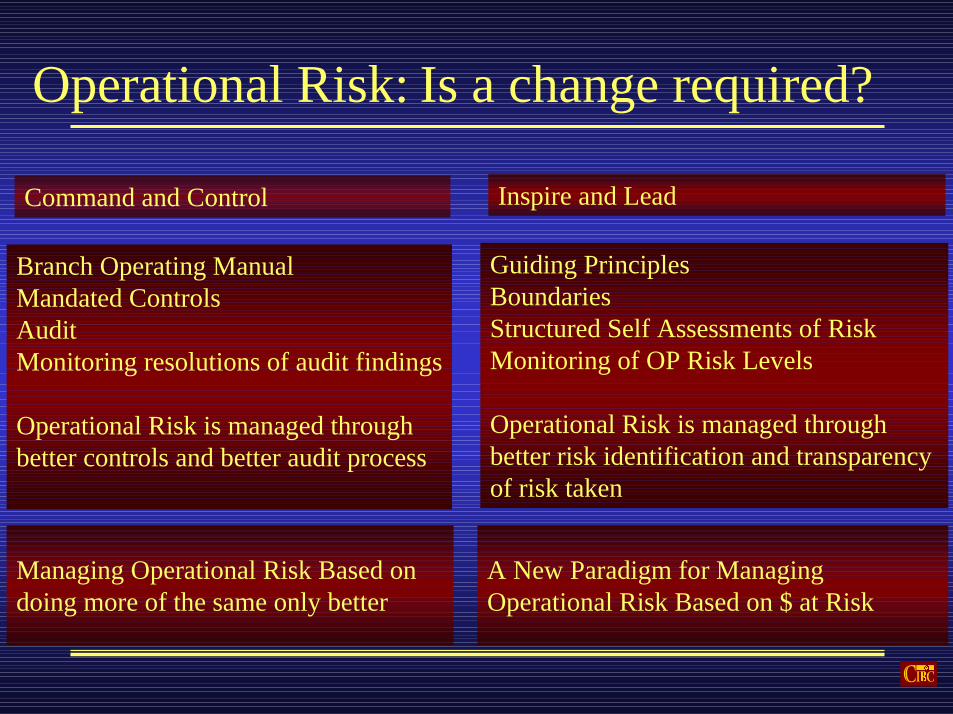
A New Paradigm for ManagingOperational Risk Based on $ at Risk
Branch Operating ManualMandated ControlsAudit Monitoring resolutions of audit findings
Operational Risk is managed through better controls and better audit process
Guiding Principles BoundariesStructured Self Assessments of RiskMonitoring of OP Risk Levels
Operational Risk is managed through better risk identification and transparency of risk taken
Operational Risk: Is a change required?
Managing Operational Risk Based ondoing more of the same only better
Command and Control Inspire and Lead
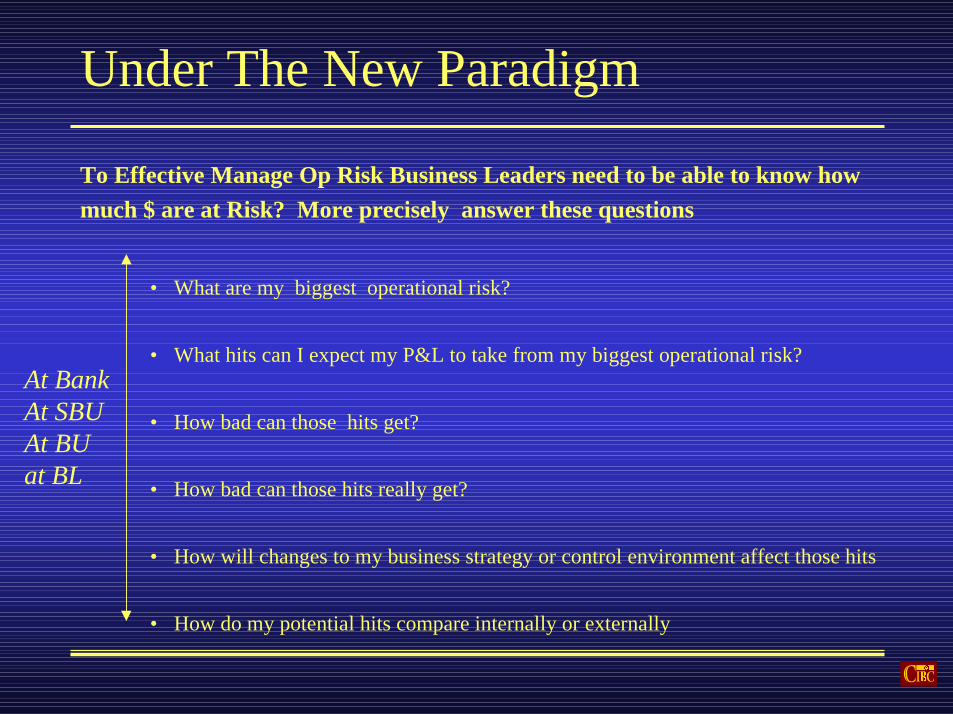
Under The New Paradigm
To Effective Manage Op Risk Business Leaders need to be able to know howmuch $ are at Risk? More precisely answer these questions
• What are my biggest operational risk?
• What hits can I expect my P&L to take from my biggest operational risk?
• How bad can those hits get?
• How bad can those hits really get?
• How will changes to my business strategy or control environment affect those hits
• How do my potential hits compare internally or externally
At BankAt SBUAt BUat BL

How is operational risk measured

Objective of Measuring OperationalRisk• Provide an accurate view of the operational risk profile of the business
over the next 12 months.8 What is the expected losses from operational risk8 What is the Worst Case Loss from operational risk
• Supports the analysis of Operational Risk8 What are the top Op Risk8 What is the Worst case loss under stress conditions
8 How will changes to my business strategy or control environment affectthe potential.
8 How does the potential hit compare with other business units or otherbanks

Measuring Operational Risk For betterManagement
Based on analytic techniques widely used in the insurance industry to measure the financialimpact of an operational failure
•The foundation is8 the historical operational loss experience8 deep understanding of what and why is at risk
•The edifice is business judgement8 similar to putting together a business plan8 judgement is used to supplement/ replace or enhance historical loss experience based inputs8 follows the same rigorous process as if all the inputs were historical loss data
•The measure is called OP VaR
•used for determining8 the expected loss from operational failures8 the worst case loss at confidence level8 the required economic and regulatory operational risk capital8 concentration of operational risk

First StepRecognise Distinct Operational Risk Losses Types
1. Legal Liability:inlcudes client, employee and other third party lawsuits
2 . Regulatory, Compliance and Taxation Penaltiesfines, or the cost of any other penalties, such as license revocations and associated costs - excludes lost /forgone revenue.
3 . Loss of or Damage to Assets:reduction in value of the firm’s non-financial asset and property
4 . Client Restitutionincludes restitution payments (principal and/or interest) or other compensation to clients.
5 . Theft, Fraud and Unauthorized Activitiesincludes rogue trading
6. Transaction Processing Riskincludes failed or late settlement, wrong amount or wrong counterparty
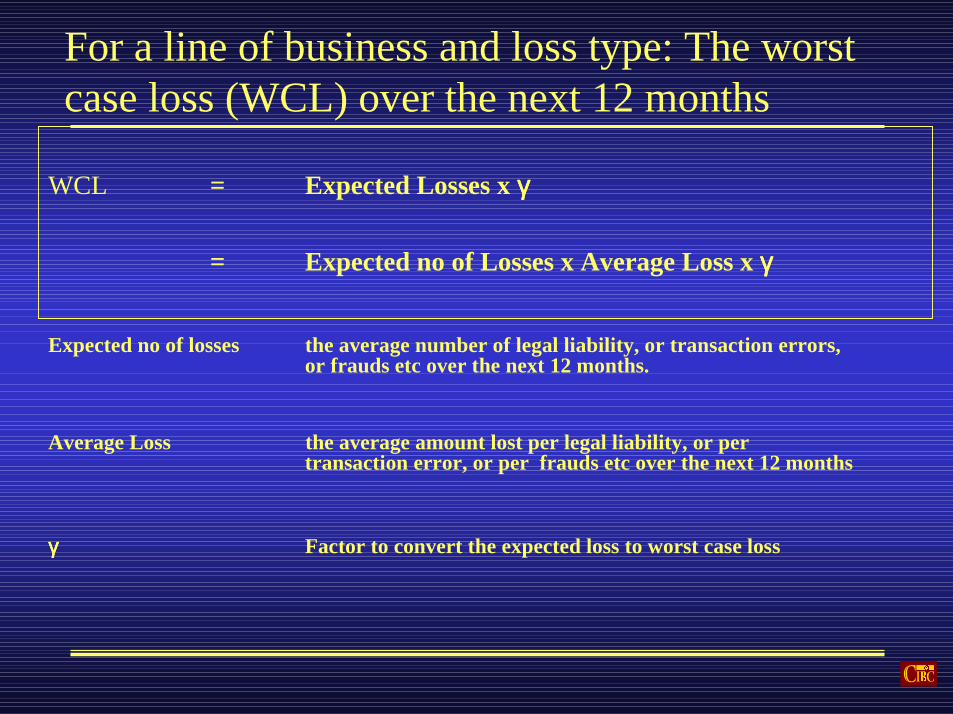
WCL = Expected Losses x γγγγ
= Expected no of Losses x Average Loss x γγγγ
Expected no of losses the average number of legal liability, or transaction errors, or frauds etc over the next 12 months.
Average Loss the average amount lost per legal liability, or per transaction error, or per frauds etc over the next 12 months
γγγγ Factor to convert the expected loss to worst case loss
For a line of business and loss type: The worstcase loss (WCL) over the next 12 months
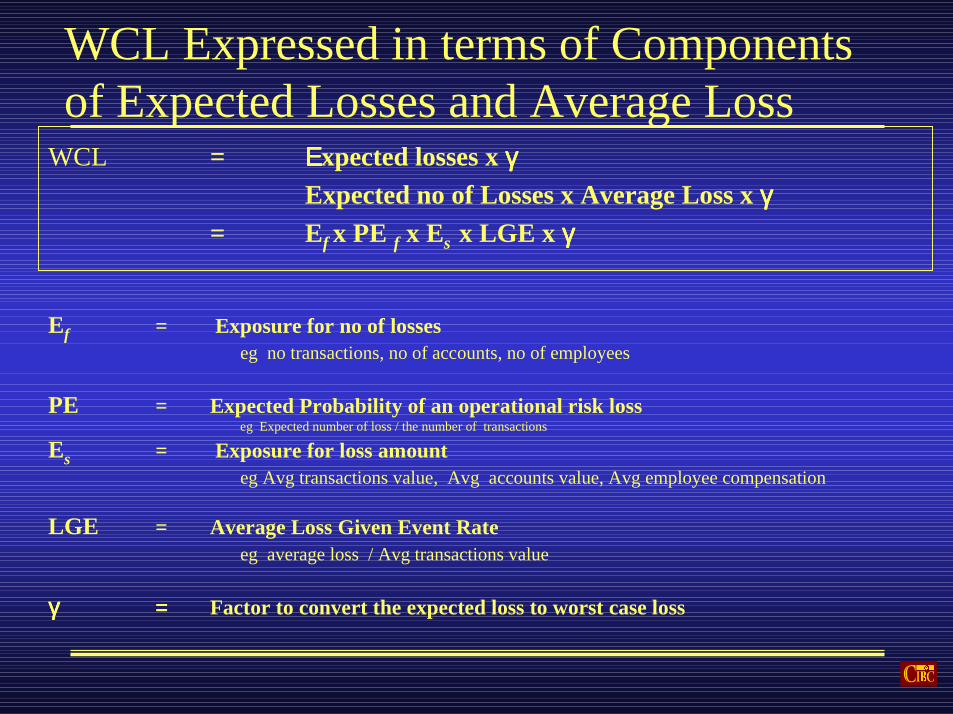
WCL = ΕΕΕΕxpected losses x γγγγExpected no of Losses x Average Loss x γγγγ
= Ef x PE f x Es x LGE x γγγγ
Ef = Exposure for no of losseseg no transactions, no of accounts, no of employees
PE = Expected Probability of an operational risk losseg Expected number of loss / the number of transactions
Es = Exposure for loss amounteg Avg transactions value, Avg accounts value, Avg employee compensation
LGE = Average Loss Given Event Rateeg average loss / Avg transactions value
γγγγ = = = = Factor to convert the expected loss to worst case loss
WCL Expressed in terms of Componentsof Expected Losses and Average Loss
980
985
990
995
1000
1005
1010
1015
1 3 5 7 9 11 13 15 17 19 21 23 25 27 29 31 33 35
-
1.00
2.00
3.00
4.00
5.00
6.00
7.00
8.00
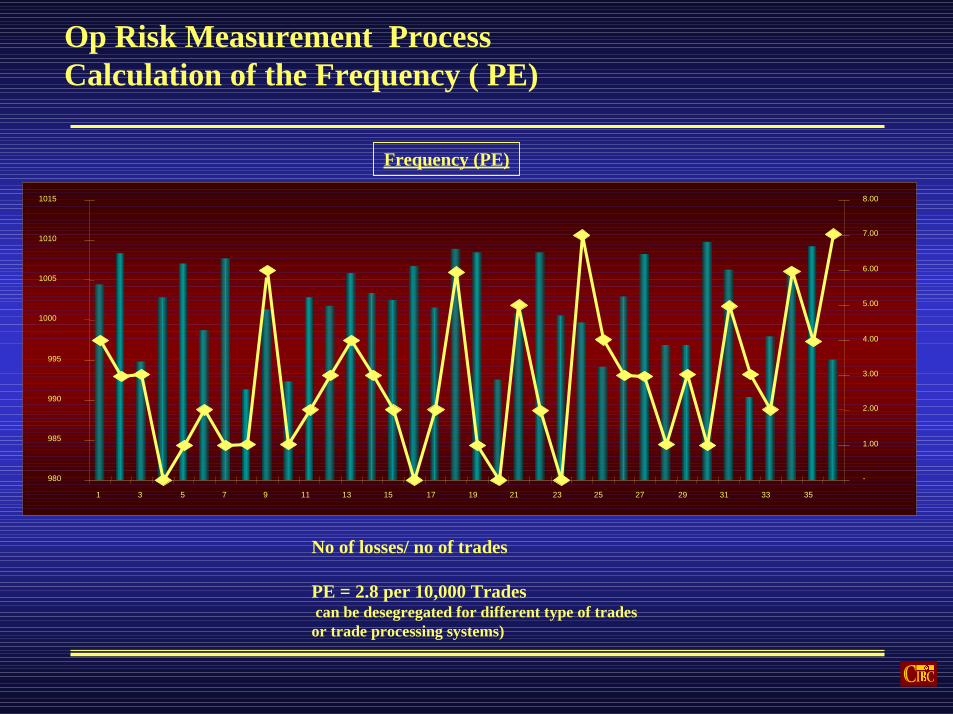
Op Risk Measurement ProcessCalculation of the Frequency ( PE)
No of losses/ no of trades
PE = 2.8 per 10,000 Trades can be desegregated for different type of tradesor trade processing systems)
Frequency (PE)

Op Risk Measurement ProcessCalculation of the Severity (LGE)
Amount of loss /average trade amount
LGE = 9.8 % of Avg. Trade Value
0.0%
10.0%
20.0%
30.0%
40.0%
50.0%
60.0%
70.0%
80.0%
1 6 11 16 21 26 31 36 41 46 51 56 61 66 71 76 81 86 91 96 101
Severity (LGE)
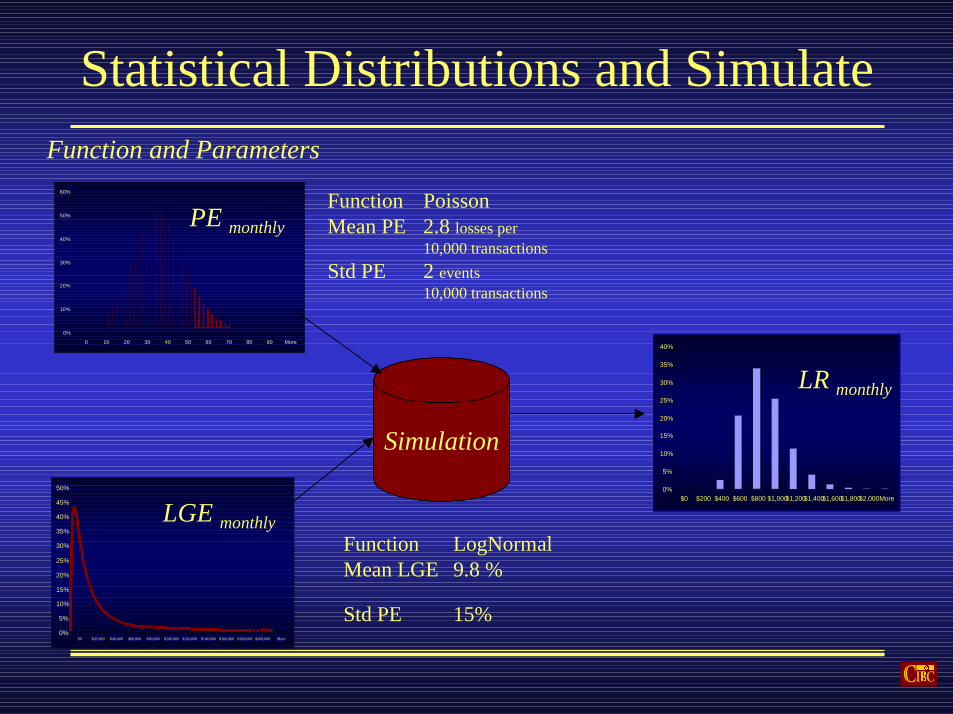
Function PoissonMean PE 2.8 losses per
10,000 transactionsStd PE 2 events
10,000 transactions
Statistical Distributions and Simulate
0%
5%
10%
15%
20%
25%
30%
35%
40%
$0 $200 $400 $600 $800 $1,000$1,200$1,400$1,600$1,800$2,000More
0%
10%
20%
30%
40%
50%
60%
0 10 20 30 40 50 60 70 80 90 More
PE monthly
0%
5%
10%
15%
20%
25%
30%
35%
40%
45%
50%
$0 $20,000 $40,000 $60,000 $80,000 $100,000 $120,000 $140,000 $160,000 $180,000 $200,000 More
LGE monthly
LR monthly
Function LogNormalMean LGE 9.8 %
Std PE 15%
Function and Parameters
Simulation

Annualize the Losses And EstimateExposure
Av Loss Rate 8%WCL 40%
Gamma 5
LR annual
With an Exposure of $10mm the expected loss is $.8mm ( $10mm x 8%) and the worst case loss is $4mm ($10mm x 40%)
Simulation
0%
5%
10%
15%
20%
25%
30%
35%
40%
$0 $200 $400 $600 $800 $1,000$1,200$1,400$1,600$1,800$2,000More
LR monthly
0%
5%
10%
15%
20%
25%
30%
35%
40%
$0 $200 $400 $600 $800 $1,000$1,200$1,400$1,600$1,800$2,000More
LR annual

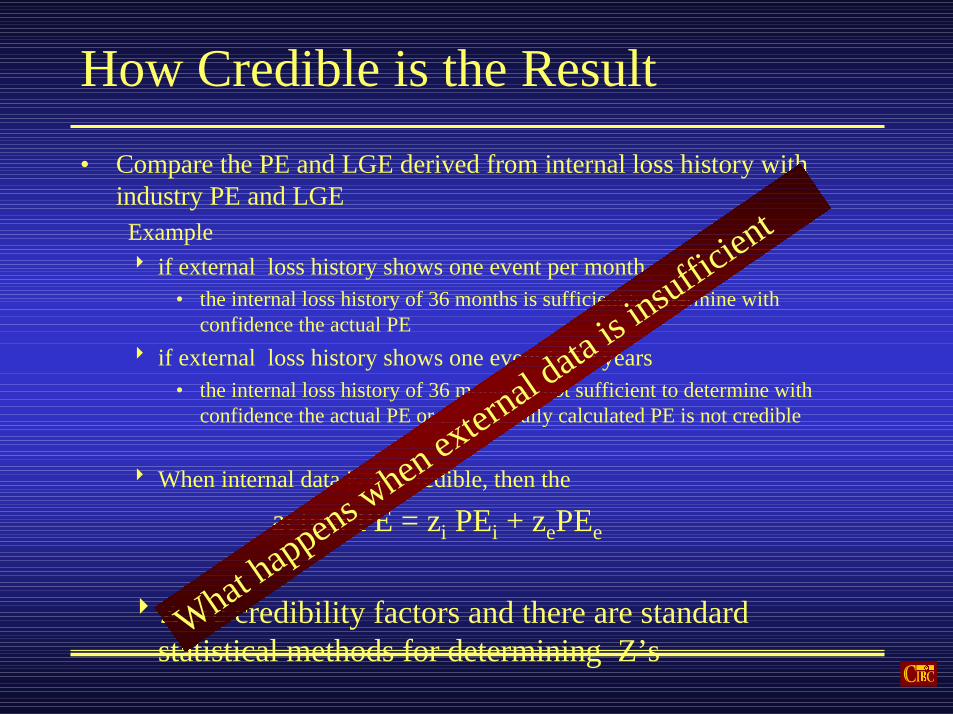
How Credible is the Result• Compare the PE and LGE derived from internal loss history with
industry PE and LGEExample8 if external loss history shows one event per month
• the internal loss history of 36 months is sufficient to determine withconfidence the actual PE
8 if external loss history shows one event in 10 years• the internal loss history of 36 months is not sufficient to determine with
confidence the actual PE or the internally calculated PE is not credible
8 When internal data is not credible, then the
actual PE = zi PEi + zePEe
8Z are credibility factors and there are standardstatistical methods for determining Z’s
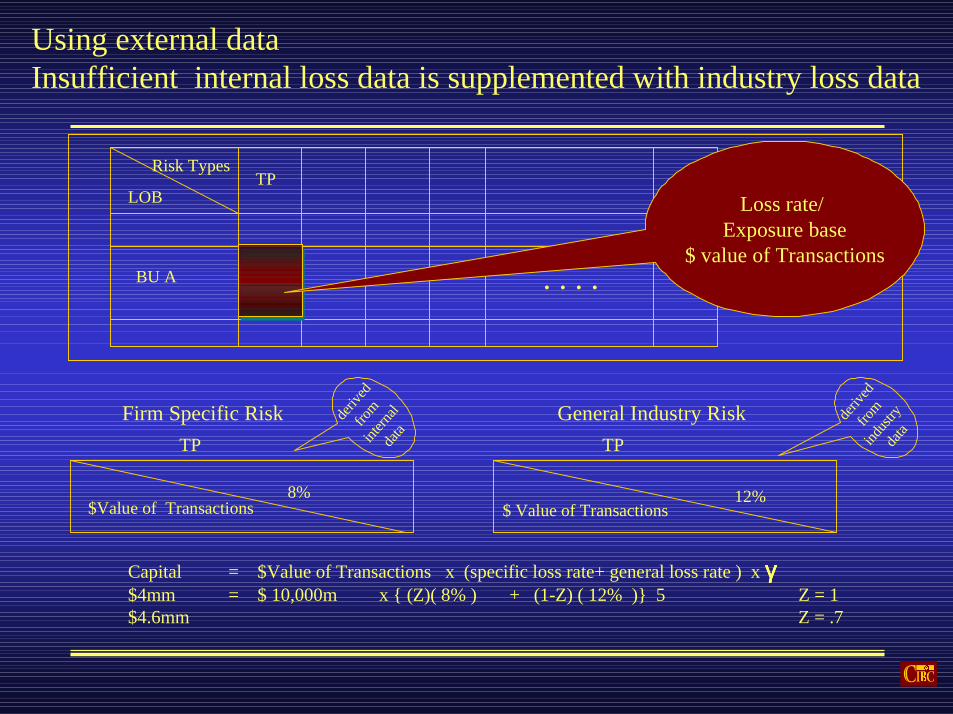
Using external dataInsufficient internal loss data is supplemented with industry loss data
Capital = $Value of Transactions x (specific loss rate+ general loss rate ) x γγγγ$4mm = $ 10,000m x { (Z)( 8% ) + (1-Z) ( 12% )} 5 Z = 1$4.6mm Z = .7
. . . .
Risk Types
LOBTP
BU A
Loss rate/ Exposure base
$ value of Transactions
TP
$ Value of Transactions12%
General Industry Risk deriv
ed
from
indust
ry da
ta
Firm Specific RiskTP
8%
deriv
ed
from
intern
alda
ta
$Value of Transactions
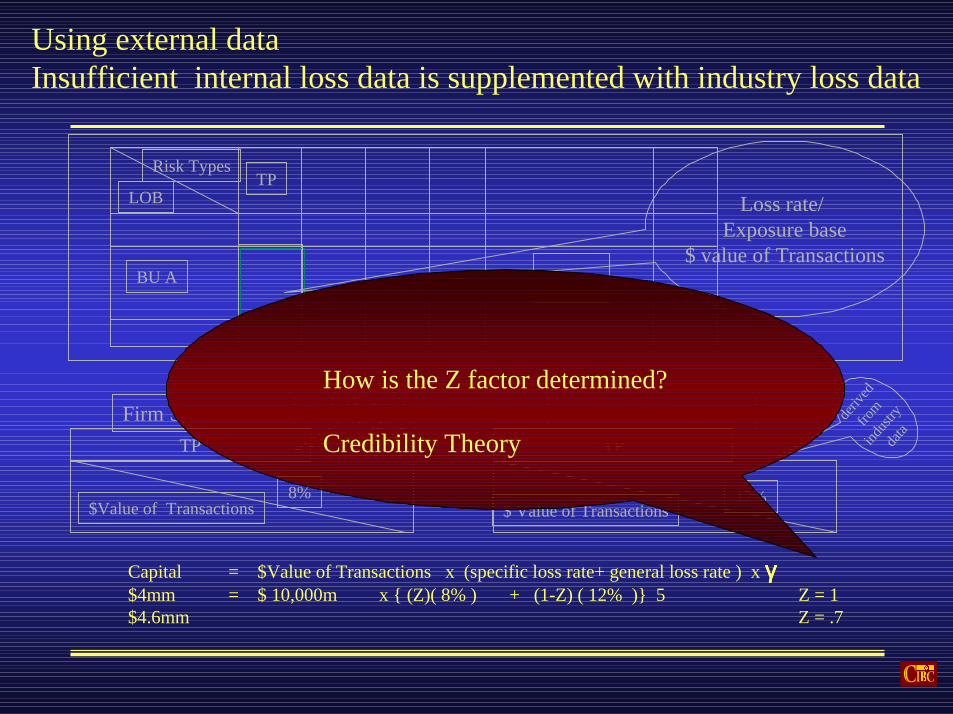
How is the Z factor determined?
Credibility Theory

Credibility
yy
y
yy
yy
y
yyy
yy
y
y
y
y
xx
xx
xxx
x
xx
xxxx
x
xx
x
w
ww
w
ww
w
w w
ww
w w
w
w
w w
o oo
o
o ooo
oooo
o
o
o
o
oz
yy
yy
y
yy
y
yyy
yy
y
y
y
y
xx x
xx
xx
x x
xx
xxx
x
xx
x
w
ww
w
ww
w
w w
ww
w w
w
w
w w
o oo
o
o ooo
oooo
o
o
o
o
oz
yy
y
y
y
yy
y
y
yy
yy
y
y
y
y
xx
x
xx
xx
x
x
x
x
xxxx
xx
x
w
ww
w
ww
w
w w
ww
w w
w
w
w w
oo
o
o
o ooo
ooo
o
o
o
o
o
oz
Means Are far Apart, Strong Clustering
Means Are far Apart, Weak Clustering
Means Are Close, Strong Clustering
Means Are Close, Weak Clustering
xx
x
xx
xx
x
x
x
x
xxxx
xx
x
w
ww
w
ww
w
w w
ww
w w
w
w
w w
oo
o
o
o ooo
ooo
o
o
o
o
o
oz
yy
y
y
y
yy
y
y
yy
yy
y
y
y
y
How Credible is the Result• Compare the PE and LGE derived from internal loss history with
industry PE and LGEExample8 if external loss history shows one event per month
• the internal loss history of 36 months is sufficient to determine withconfidence the actual PE
8 if external loss history shows one event in 10 years• the internal loss history of 36 months is not sufficient to determine with
confidence the actual PE or the internally calculated PE is not credible
8 When internal data is not credible, then the
actual PE = zi PEi + zePEe
8Z are credibility factors and there are standardstatistical methods for determining Z’s
What happens w
hen extern
al data
is insuffic
ient

Function PoissonMean PE 2.8 losses per
10,000 transactionsStd PE 2 events
10,000 transactions
Scenario Analysis
0%
5%
10%
15%
20%
25%
30%
35%
40%
$0 $200 $400 $600 $800 $1,000$1,200$1,400$1,600$1,800$2,000More
0%
10%
20%
30%
40%
50%
60%
0 10 20 30 40 50 60 70 80 90 More
PE monthly
0%
5%
10%
15%
20%
25%
30%
35%
40%
45%
50%
$0 $20,000 $40,000 $60,000 $80,000 $100,000 $120,000 $140,000 $160,000 $180,000 $200,000 More
LGE monthly
LR monthly
Function LogNormalMean LGE 9.8 %
Std PE 15%
Function and Parameters
Simulation
These are estimated using Business and Risk Management Judgement

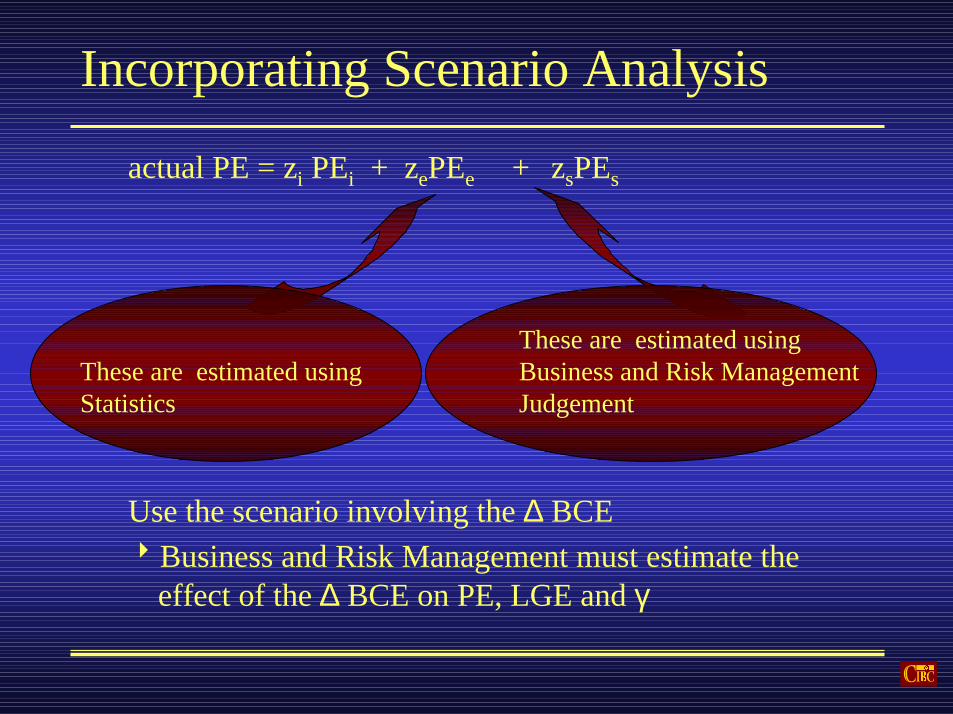
Incorporating Scenario Analysis
actual PE = zi PEi + zePEe + zsPEs
These are estimated using Business and Risk Management Judgement
These are estimated using Statistics

Op VaR Reflects Changes in PE and LE over time
• Business Unit A
• Note the Lag• How is ∆ BCE incorporated
Business Unit A - Transaction Error and Client Restitution Losses (12 month rolling average)
$-
$100,000
$200,000
$300,000
$400,000
$500,000
$600,000
$700,000
$800,000
Nov-99 Dec-99 Jan-00 Feb-00 Mar-00 Apr-00 May-00 Jun-00 Jul-00 Aug-00 Sep-00 Oct-00 Nov-00 Dec-00 Jan-01 Feb-01 Mar-01$2.5
$3.0
$3.5
$4.0
$4.5
$5.0
Monthly Losses OpVar ($ MM)

Use Qualitative Adjustments
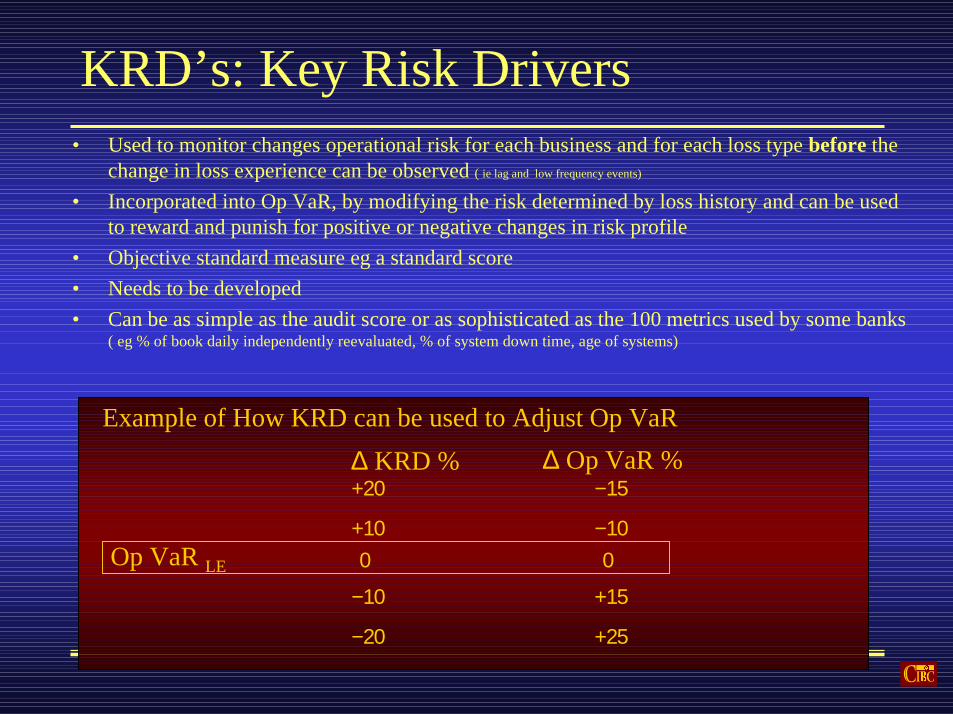
KRD’s: Key Risk Drivers• Used to monitor changes operational risk for each business and for each loss type before the
change in loss experience can be observed ( ie lag and low frequency events)
• Incorporated into Op VaR, by modifying the risk determined by loss history and can be usedto reward and punish for positive or negative changes in risk profile
• Objective standard measure eg a standard score• Needs to be developed• Can be as simple as the audit score or as sophisticated as the 100 metrics used by some banks
( eg % of book daily independently reevaluated, % of system down time, age of systems)
Op VaR LE
∆ KRD % ∆ Op VaR %+20
+10
−10
−20
0
−15
−10
+15
+25
0
Example of How KRD can be used to Adjust Op VaR

Is there an alternative to the scorecard approach to the Qualitative Adjustment or more precisely to incorporating the ∆ BCE
Incorporating Scenario Analysis
actual PE = zi PEi + zePEe + zsPEs
These are estimated using Business and Risk Management Judgement
These are estimated using Statistics
Use the scenario involving the ∆ BCE8Business and Risk Management must estimate the
effect of the ∆ BCE on PE, LGE and γ

General OP VaR MethodologyWCL = Expected no of Losses x Average Loss x γ
= Ef x Es x PE x LGE x γ
Ef x Es = E = (1-zle )Eh + zle Ele
PE = zh PEh + ze PEe + zbce PEbce
PEh = 36 month average rate from internal loss experiencePEe = 36 month average rate from external loss experiencePebce = Scenario analysis (RM and BM Judgement)
Zh and Ze Calculated using statistical credibility theoryZbce is from RM and BM Judgement
Eh = 12 month average exposureELE = latest estimate from BM JudgementZle is from RM and BM Judgement

The AMORAMOR Report
AAnalysis and MMonitoring ofOOperational RRisk

AMOR
•SBU OP VaR
•Q3-01 by Loss Types
OpVaRs ($MM) OpVaR as % ofGross Income
333 300 329
283
Q4-00 Q1-01 Q2-01 Q3-01
7.6 7.6 8.27.0
11 15 11 9
Q4-00 Q1-01 Q2-01 Q3-01
23.0
131
0.0 0.0
7093
166
0.6
3.3
0.0 0.0
1.82.3
4.1
A B C D E F G A B C D E F G
A. Client RestitutionB. Legal liability ClientC. Legal Liability EmployeeD. Loss and Damage to AssetsE. Reg. Compliance Tax PenaltiesF. Theft Fraud Unauthorized Act.G. Transaction Processing
Comentary

$20$27
$35
$47$56
$58$62 $66
$70
$0
$10
$20
$30
$40
$50
$60
$70
F2001 F2002 F2003 F2004 F2005 F2006 F2007 F2008 F2009
F2001
$15
$13
$5
44%
81%
95%
$-
$2.0
$4.0
$6.0
$8.0
$10.0
$12.0
$14.0
$16.0
Fraud
Regula
tory
Lawsui
ts
Transac
tion
Assets
0%
100%$69
$11$5 $4
77%
88%93%
$-
$10.0
$20.0
$30.0
$40.0
$50.0
$60.0
$70.0
$80.0
Fraud
Lawsui
ts
Rev.
Transac
tion
Regula
tory
0%
100%
F2009
• OP VaR increases 2.5 times over 9 years compared toaccount balance growth 208 times:
• Reduction in infrastructure build.• Reduction in fraud rates because of business
maturing..• Composition of Op VaR changes over the 9 year horizon
• First year, 81% of risk is Transaction risk reflectinginfrastructure (kiosks) build up
• Ninth year, 77% of the risk is Theft and Fraud.• Historical Proxy losses rates have been used
Start up Op VaR

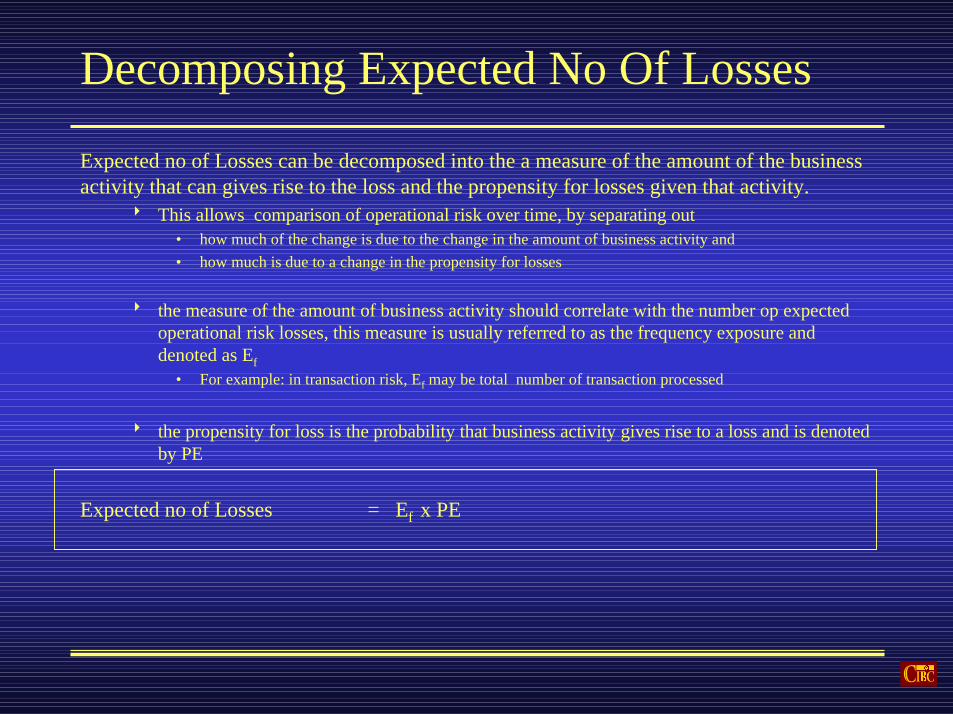
Decomposing Expected No Of Losses
Expected no of Losses can be decomposed into the a measure of the amount of the businessactivity that can gives rise to the loss and the propensity for losses given that activity.
8 This allows comparison of operational risk over time, by separating out• how much of the change is due to the change in the amount of business activity and• how much is due to a change in the propensity for losses
8 the measure of the amount of business activity should correlate with the number op expectedoperational risk losses, this measure is usually referred to as the frequency exposure anddenoted as Ef
• For example: in transaction risk, Ef may be total number of transaction processed
8 the propensity for loss is the probability that business activity gives rise to a loss and is denotedby PE
Expected no of Losses = Ef x PE

Decomposing Average LossAverage loss can be decomposed into the average of amount at risk per loss event and thepercentage lost per loss event
8 this allows the comparison of operational risk over time, by separating out• how much of the change is due to the change in the amount at risk per loss event and• how much is due to a change in the percentage lost per loss event• This decomposition is especially useful for risk management, when action ca
8 the measure of the amount at risk should correlate with average loss per loss event, thismeasure is usually referred to as the severity exposure and denoted as Es
• For example: in transaction risk, Es may be average value of transaction processed
8 the percentage lost of the amount at risk per loss event is denoted by LGE ( loss given event)
Average Loss = ES x LGE


