54
Operations Center SQL Views Guide September 2016
Operations Center SQL Views Guide
September 2016

Legal Notice
For information about NetIQ legal notices, disclaimers, warranties, export and other use restrictions, U.S. Government restricted rights, patent policy, and FIPS compliance, see https://www.netiq.com/company/legal/.
Copyright (C) 2016 NetIQ Corporation. All rights reserved.

Contents
About This Guide 5
1 About SQL Views 7
2 Configuration 9
2.1 Prerequisites . . . . . . . . . . . . . . . . . . . . . . . . . . . . . . . . . . . . . . . . . . . . . . . . . . . . . . . . . . . . . . . . . . . . 92.2 Configuring the ODBC Driver . . . . . . . . . . . . . . . . . . . . . . . . . . . . . . . . . . . . . . . . . . . . . . . . . . . . . . . . 9
2.2.1 Defining an ODBC Data Source for Windows . . . . . . . . . . . . . . . . . . . . . . . . . . . . . . . . . . . 102.2.2 Setting Up an ODBC Data Source for UNIX . . . . . . . . . . . . . . . . . . . . . . . . . . . . . . . . . . . . 132.2.3 Reconfiguring the Command Line Driver. . . . . . . . . . . . . . . . . . . . . . . . . . . . . . . . . . . . . . . 132.2.4 Defining Character Encoding for Windows Clients in International Environments. . . . . . . . 14
2.3 JDBC Driver Requirements . . . . . . . . . . . . . . . . . . . . . . . . . . . . . . . . . . . . . . . . . . . . . . . . . . . . . . . . 142.4 Verifying SQL Views Status . . . . . . . . . . . . . . . . . . . . . . . . . . . . . . . . . . . . . . . . . . . . . . . . . . . . . . . . 152.5 Auditing SQL Views . . . . . . . . . . . . . . . . . . . . . . . . . . . . . . . . . . . . . . . . . . . . . . . . . . . . . . . . . . . . . . 16
3 Queries and Reports 17
3.1 Using Excel for Queries and Reports . . . . . . . . . . . . . . . . . . . . . . . . . . . . . . . . . . . . . . . . . . . . . . . . . 183.2 Using Crystal Reports for Queries and Reports . . . . . . . . . . . . . . . . . . . . . . . . . . . . . . . . . . . . . . . . . 20
4 Tables and Views 25
4.1 Using Tables. . . . . . . . . . . . . . . . . . . . . . . . . . . . . . . . . . . . . . . . . . . . . . . . . . . . . . . . . . . . . . . . . . . . 254.1.1 Agreement Table . . . . . . . . . . . . . . . . . . . . . . . . . . . . . . . . . . . . . . . . . . . . . . . . . . . . . . . . . 264.1.2 Alarms Table . . . . . . . . . . . . . . . . . . . . . . . . . . . . . . . . . . . . . . . . . . . . . . . . . . . . . . . . . . . . 264.1.3 AlarmsConstructed Table. . . . . . . . . . . . . . . . . . . . . . . . . . . . . . . . . . . . . . . . . . . . . . . . . . . 274.1.4 AlarmsNamed Table . . . . . . . . . . . . . . . . . . . . . . . . . . . . . . . . . . . . . . . . . . . . . . . . . . . . . . 294.1.5 Availability Table . . . . . . . . . . . . . . . . . . . . . . . . . . . . . . . . . . . . . . . . . . . . . . . . . . . . . . . . . 304.1.6 Breaches Table . . . . . . . . . . . . . . . . . . . . . . . . . . . . . . . . . . . . . . . . . . . . . . . . . . . . . . . . . . 324.1.7 Condition Table . . . . . . . . . . . . . . . . . . . . . . . . . . . . . . . . . . . . . . . . . . . . . . . . . . . . . . . . . . 334.1.8 Elements Table . . . . . . . . . . . . . . . . . . . . . . . . . . . . . . . . . . . . . . . . . . . . . . . . . . . . . . . . . . 344.1.9 Health Table. . . . . . . . . . . . . . . . . . . . . . . . . . . . . . . . . . . . . . . . . . . . . . . . . . . . . . . . . . . . . 344.1.10 Outages Table . . . . . . . . . . . . . . . . . . . . . . . . . . . . . . . . . . . . . . . . . . . . . . . . . . . . . . . . . . . 354.1.11 Performance Table. . . . . . . . . . . . . . . . . . . . . . . . . . . . . . . . . . . . . . . . . . . . . . . . . . . . . . . . 364.1.12 Properties Table. . . . . . . . . . . . . . . . . . . . . . . . . . . . . . . . . . . . . . . . . . . . . . . . . . . . . . . . . . 374.1.13 PropertiesConstructed Table . . . . . . . . . . . . . . . . . . . . . . . . . . . . . . . . . . . . . . . . . . . . . . . . 384.1.14 PropertiesNamed Table . . . . . . . . . . . . . . . . . . . . . . . . . . . . . . . . . . . . . . . . . . . . . . . . . . . . 384.1.15 Relationships Table . . . . . . . . . . . . . . . . . . . . . . . . . . . . . . . . . . . . . . . . . . . . . . . . . . . . . . . 39
4.2 Using System Views. . . . . . . . . . . . . . . . . . . . . . . . . . . . . . . . . . . . . . . . . . . . . . . . . . . . . . . . . . . . . . 394.3 Creating Views in the Operations Center console . . . . . . . . . . . . . . . . . . . . . . . . . . . . . . . . . . . . . . . 40
4.3.1 Editing a View . . . . . . . . . . . . . . . . . . . . . . . . . . . . . . . . . . . . . . . . . . . . . . . . . . . . . . . . . . . 414.3.2 Creating a New View . . . . . . . . . . . . . . . . . . . . . . . . . . . . . . . . . . . . . . . . . . . . . . . . . . . . . . 414.3.3 Deleting Views . . . . . . . . . . . . . . . . . . . . . . . . . . . . . . . . . . . . . . . . . . . . . . . . . . . . . . . . . . . 42
4.4 Creating Custom Views . . . . . . . . . . . . . . . . . . . . . . . . . . . . . . . . . . . . . . . . . . . . . . . . . . . . . . . . . . . 434.4.1 Testing Mossqlcli . . . . . . . . . . . . . . . . . . . . . . . . . . . . . . . . . . . . . . . . . . . . . . . . . . . . . . . . . 434.4.2 Creating a View using Mossqlcli . . . . . . . . . . . . . . . . . . . . . . . . . . . . . . . . . . . . . . . . . . . . . 44
4.5 Writing Custom Queries . . . . . . . . . . . . . . . . . . . . . . . . . . . . . . . . . . . . . . . . . . . . . . . . . . . . . . . . . . . 44
Contents 3
4 Ope
5 Example Reports 47
5.1 Alarms Reports. . . . . . . . . . . . . . . . . . . . . . . . . . . . . . . . . . . . . . . . . . . . . . . . . . . . . . . . . . . . . . . . . . 485.2 Performance Reports . . . . . . . . . . . . . . . . . . . . . . . . . . . . . . . . . . . . . . . . . . . . . . . . . . . . . . . . . . . . . 495.3 SLA Catalog Reports . . . . . . . . . . . . . . . . . . . . . . . . . . . . . . . . . . . . . . . . . . . . . . . . . . . . . . . . . . . . . 505.4 SLA Availability Reports . . . . . . . . . . . . . . . . . . . . . . . . . . . . . . . . . . . . . . . . . . . . . . . . . . . . . . . . . . . 51
5.4.1 Understanding Availability and Downtime . . . . . . . . . . . . . . . . . . . . . . . . . . . . . . . . . . . . . . 525.4.2 Creating an Availability Report. . . . . . . . . . . . . . . . . . . . . . . . . . . . . . . . . . . . . . . . . . . . . . . 53
5.5 Service Catalog Changes Report. . . . . . . . . . . . . . . . . . . . . . . . . . . . . . . . . . . . . . . . . . . . . . . . . . . . 53
rations Center SQL Views Guide

About This Guide
The SQL Views Guide provides functionality in Operations Center that allows for third-party applications to have read access to Operations Center data.
Chapter 1, “About SQL Views,” on page 7
Chapter 2, “Configuration,” on page 9
Chapter 3, “Queries and Reports,” on page 17
Chapter 4, “Tables and Views,” on page 25
Chapter 5, “Example Reports,” on page 47
Audience
This guide is intended for Operations Center system administrators.
Feedback
We want to hear your comments and suggestions about this manual and the other documentation included with this product. Please use the User Comments feature at the bottom of each page of the online documentation.
Additional Documentation & Documentation Updates
This guide is part of the Operations Center documentation set. For the most recent version of the SQL Views Guide and a complete list of publications supporting Operations Center, visit our Online Documentation Web Site at Operations Center online documentation.
The Operations Center documentation set is also available as PDF files on the installation CD or ISO; and is delivered as part of the online help accessible from multiple locations in Operations Center depending on the product component.
Additional Resources
We encourage you to use the following additional resources on the Web:
NetIQ User Community (https://www.netiq.com/communities/): A Web-based community with a variety of discussion topics.
NetIQ Support Knowledgebase (https://www.netiq.com/support/kb/?product%5B%5D=Operations_Center): A collection of in-depth technical articles.
NetIQ Support Forums (https://forums.netiq.com/forumdisplay.php?26-Operations-Center): A Web location where product users can discuss NetIQ product functionality and advice with other product users.
Technical Support
You can learn more about the policies and procedures of NetIQ Technical Support by accessing its Technical Support Guide (https://www.netiq.com/Support/process.asp#_Maintenance_Programs_and).
About This Guide 5
Use these resources for support specific to Operations Center:
Telephone in Canada and the United States: 1-800-858-4000
Telephone outside the United States: 1-801-861-4000
E-mail: [email protected] ([email protected])
Submit a Service Request: http://support.novell.com/contact/ (http://support.novell.com/contact/)
Documentation Conventions
A greater-than symbol (>) is used to separate actions within a step and items in a cross-reference path. The > symbol is also used to connect consecutive links in an element tree structure where you can either click a plus symbol (+) or double-click the elements to expand them.
When a single pathname can be written with a backslash for some platforms or a forward slash for other platforms, the pathname is presented with a forward slash to preserve case considerations in the UNIX* or Linux* operating systems.
A trademark symbol (®, ™, etc.) denotes a NetIQ trademark. An asterisk (*) denotes a third-party trademark.
6 Operations Center SQL Views Guide
1 1About SQL Views
Operations Center SQL Views provides functionality in Operations Center that allows for third-party applications to have read access to Operations Center data. The purpose of SQL Views is to take data from the Operations Center server and the Service Warehouse and make it accessible for you to query it and write reports using it. External products, such as Business Objects Crystal Reports or Microsoft Excel can be used to create reports. In addition to reporting, Operations Center data can also be used by other applications for other business purposes.
The Operations Center server contains real-time data feeds from external management systems and the Service Warehouse contains historical data, such as alarms, Service Level Agreement data, and performance data.
The foundation of SQL Views is Apache Derby, which is a relational database implemented entirely in Java. This database is embedded in the Operations Center server. For more information on Apache Derby, see www.db.apache.org.
To use SQL Views, do the following:
1. Obtain a license that allows access to both Operations Center SQL Views and the Operations Center Web Services Application Interface.
2. Configure SQL Views.
3. Connect a third party reporting tool to SQL Views.
4. Write queries and create reports using the reporting tool.
The data in SQL Views is surfaced using views. Operations Center ships with some existing system views. You can create additional views to use to create your reports.
The other sections in this guide explain each step in detail and describe how to create new views. In addition, examples of reports that you can create are included in Chapter 5, “Example Reports,” on page 47.
In order to explain how to use SQL Views, this guide includes step-by-step instructions and illustrations from other products that are not associated with Operations Center, including Microsoft Excel and Business Objects Crystal Reports. These instructions and illustrations can vary, depending on the version of the product being used. Consult the documentation for the product for additional information.
About SQL Views 7

8 Operations Center SQL Views Guide
2 2Configuration
To use SQL Views, you must configure it so it can be connected to a reporting tool. After SQL Views is configured, you can verify its status and set audit options in the Operations Center console.
Section 2.1, “Prerequisites,” on page 9
Section 2.2, “Configuring the ODBC Driver,” on page 9
Section 2.3, “JDBC Driver Requirements,” on page 14
Section 2.4, “Verifying SQL Views Status,” on page 15
Section 2.5, “Auditing SQL Views,” on page 16
2.1 PrerequisitesSQL Views is automatically installed during the installation of Operations Center. To use SQL Views, the following requirements must be met:
The Operations Center server must be up and running.
SQL Views is installed with the default port of 1560. However, this port might be changed in the Configuration Manager.
Configuration settings are generally set at the time Operations Center is installed. If another port is used, you must specify it in order to connect to SQL Views. For more information, see the Operations Center Server Installation Guide.
For an external reporting tool to connect to Operations Center, one of the following requirements must be met, depending on the tool used:
An ODBC driver for reporting tools that do not have native support for JDBC
This includes most Windows reporting tools. After an ODBC driver is installed, an ODBC data source must be defined.
For information on ODBC drivers, see Section 2.2, “Configuring the ODBC Driver,” on page 9.
A JDBC driver for access to Java applications that have native support for JDBC
For information on JDBC drivers, see Section 2.3, “JDBC Driver Requirements,” on page 14.
2.2 Configuring the ODBC DriverAn ODBC driver is required to connect SQL Views on the Operations Center server to any external reporting tool that does not have native support for JDBC. This includes most Windows reporting tools (such as Business Objects Crystal Reports, Microsoft Excel, and so on).
An Open Database Connectivity (ODBC) driver is a standard database access method. It is used to access any data from any application, regardless of the database management system (DBMS) that handles the data. It translates application data queries into commands understood by the DBMS.
Configuration 9

At the time of the release of Operations Center 5.6, no free 64-bit Windows ODBC drivers were compatible with SQL Views. If your reporting solution requires an ODBC connection to SQL Views, you can evaluate the IBM JDBC/ODBC driver, but there are reliability issues with the driver for SQL Views on 32-bit Windows operating systems and it does not work with 64-bit Windows operating systems. Some third parties have drivers that seem to work available for a fee.
The ODBC client driver for DB2 (Version 9 or lower) from IBM works with SQL Views. The ODBC driver for DB2 from IBM can be downloaded from the IBM Web site (http://www-01.ibm.com/support/docview.wss?uid=swg21363866).
The ODBC client driver from IBM does not work with Apache Derby. To use an ODBC driver with Apache Derby, you must purchase a proprietary driver from another vendor. You can use a JDBC driver with Apache Derby.
After the driver has been installed, you must define an ODBC data source in either Windows or UNIX.
Section 2.2.1, “Defining an ODBC Data Source for Windows,” on page 10
Section 2.2.2, “Setting Up an ODBC Data Source for UNIX,” on page 13
Section 2.2.3, “Reconfiguring the Command Line Driver,” on page 13
Section 2.2.4, “Defining Character Encoding for Windows Clients in International Environments,” on page 14
2.2.1 Defining an ODBC Data Source for Windows
To define an OBDC Data Source for Windows:
1 To open the ODBC Data Source Administrator, click Start > Control Panel > Administrative Tools > ODBC Data Source Administrator:
2 Click Add to open the Create New Data Source dialog box.
3 Select IBM DB2 ODBC Driver from the list, then click Finish to open the ODBC IBM DB2 Driver – Add dialog box.
10 Operations Center SQL Views Guide
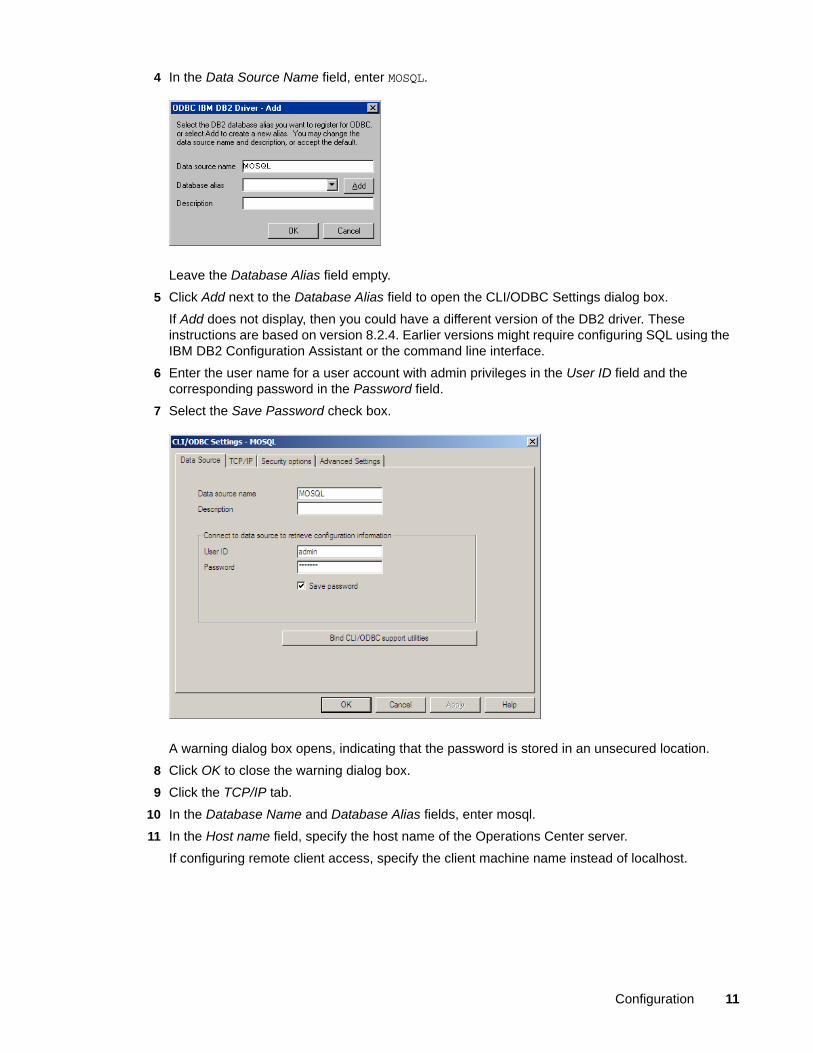
4 In the Data Source Name field, enter MOSQL.
Leave the Database Alias field empty.
5 Click Add next to the Database Alias field to open the CLI/ODBC Settings dialog box.
If Add does not display, then you could have a different version of the DB2 driver. These instructions are based on version 8.2.4. Earlier versions might require configuring SQL using the IBM DB2 Configuration Assistant or the command line interface.
6 Enter the user name for a user account with admin privileges in the User ID field and the corresponding password in the Password field.
7 Select the Save Password check box.
A warning dialog box opens, indicating that the password is stored in an unsecured location.
8 Click OK to close the warning dialog box.
9 Click the TCP/IP tab.
10 In the Database Name and Database Alias fields, enter mosql.
11 In the Host name field, specify the host name of the Operations Center server.
If configuring remote client access, specify the client machine name instead of localhost.
Configuration 11
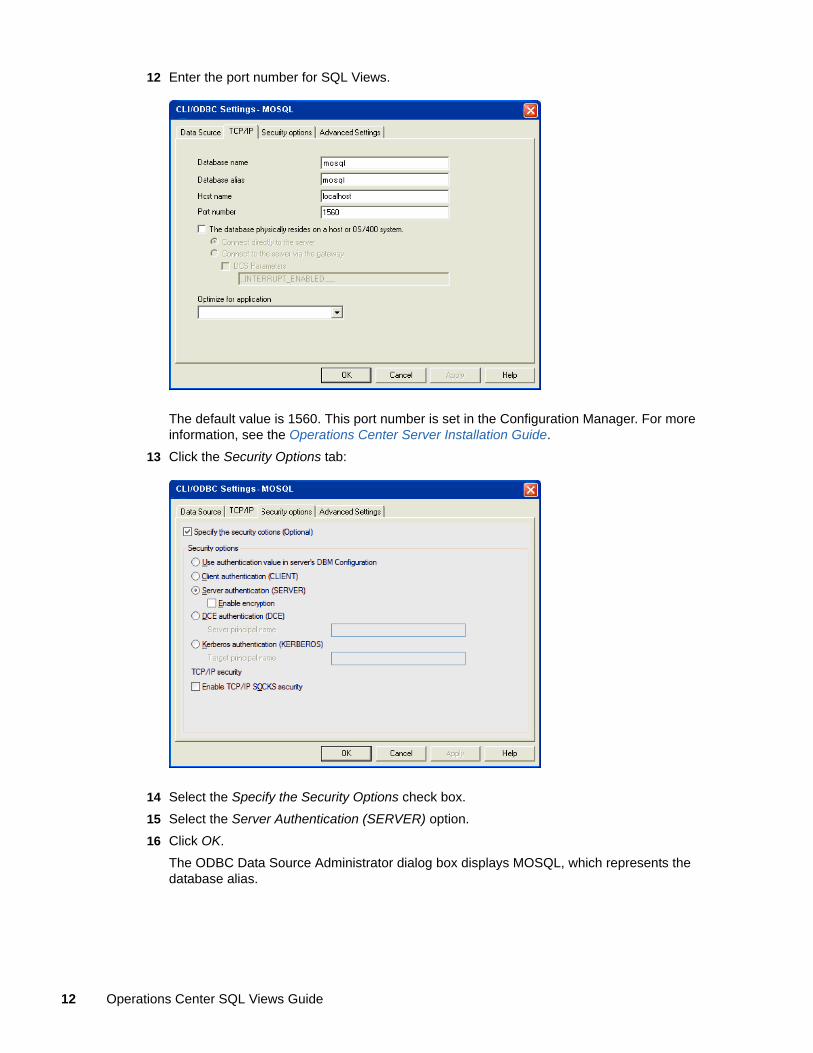
12 Enter the port number for SQL Views.
The default value is 1560. This port number is set in the Configuration Manager. For more information, see the Operations Center Server Installation Guide.
13 Click the Security Options tab:
14 Select the Specify the Security Options check box.
15 Select the Server Authentication (SERVER) option.
16 Click OK.
The ODBC Data Source Administrator dialog box displays MOSQL, which represents the database alias.
12 Operations Center SQL Views Guide
2.2.2 Setting Up an ODBC Data Source for UNIX
To set up the database source on UNIX, use the DB2 command prompt.
The general set up process involves setting up a database and node in the DB2 database catalog. This involves running the DB2 command prompt and setting up the proper aliases in the DB2 driver database. To catalog the SQL database, run the DB2 command prompt.
The following commands use the database name mosql and the node name fnode:
db2 => catalog tcpip node fnode remote localhost server 1527 DB20000I The CATALOG TCPIP NODE command completed successfully. DB21056W Directory changes may not be effective until the directory cache is refreshed. db2 => catalog db mosql at node fnode authentication server DB20000I The CATALOG DATABASE command completed successfully. DB21056W Directory changes may not be effective until the directory cache is refreshed. db2 => connect to mosql user admin using formula Database Connection Information Database server = Server_Name SQL authorization ID = FNODE Local database alias = MOSQL
If you are using other names for the database and node, change the commands accordingly.
2.2.3 Reconfiguring the Command Line Driver
After reinstalling Operations Center, it is sometimes necessary to reconfigure the command line driver. Use the following commands to uncatalog the database and node in DB2. The examples use a database name mosql and a node name fnode. If necessary, replace these with the names used in your system.
To reconfigure the driver:
1 Open the ODBC Data Source Administrator and delete the SQL Views ODBC configuration.
2 Go to the DB2 command prompt and enter the Uncatalog db mosql command:
db2 => uncatalog db mosql DB20000I The UNCATALOG DATABASE command completed successfully.DB21056W Directory changes may not be effective until the directory cache is refreshed.
3 Enter the Uncatalog fnode command:
db2 => uncatalog node fnodeDB20000I The UNCATALOG NODE command completed successfully.DB21056W Directory changes may not be effective until the directory cache is refreshed.
4 Use the ODBC Data Source Administrator to reconfigure SQL Views.
Configuration 13
2.2.4 Defining Character Encoding for Windows Clients in International Environments
Client programs, such as MS Excel, might error out because of character encoding issues while accessing SQL Views on computers that are configured for non-western regional languages.
To force the ODBC drivers to use UTF character encoding:
1 Set the environment variable DB2CODEPAGE to 1208 on the client side machine.
This forces the IBM DB2 ODBC driver to use UTF character encoding.
2 Restart the client program interfacing with SQL Views (such as MS-Excel) after setting the environment variable.
3 If restarting the client program does not work, reboot the machine for the client programs to pick up the environment variable change.
2.3 JDBC Driver RequirementsA JDBC driver is necessary for Java applications that have native JDBC support to access SQL Views. Java Database Connectivity (JDBC) is an API for the Java programming language that defines how a client can access a database. It provides methods for querying and updating data in a database.
Defining the JDBC access mode for Java applications involves installing derbyclient.jar to the target program’s classpath. Each database tool handles this differently. The class for the JDBC driver is: org.apache.derby.jdbc.ClientDriver.
The URL is:
jdbc:derby://host:port/database_name_and_credentials
A sample URL is:
jdbc:derby://localhost:1560/MOSQL;user=formula;password=formula;
For more information, consult your documentation for the JDBC drivers.
14 Operations Center SQL Views Guide

2.4 Verifying SQL Views Status1 In the Operations Center console, expand Enterprise > Administration > SQL Views.
2 Right-click the SQL Views element, then select Properties > Status to display:
3 Verify that condition of SQL Views is the same as the condition of other elements in Operations Center.
For more information about condition, see “Understanding Element Condition” in the Operations Center User Guide.
Configuration 15

2.5 Auditing SQL ViewsYou can audit the events impacting SQL Views. You can audit when operations are started and stopped, and when views are created and dropped.
To access the audit options:
1 In the Operations Center console, expand Enterprise > Administration > SQL Views.
2 Right-click the SQL Views element, then select Properties> Audit to display:
3 For more information about auditing, particularly how to use the global options and how to view audited events, see the Operations Center Security Management Guide.
16 Operations Center SQL Views Guide
3 3Queries and Reports
After you are connected to SQL Views, you can use any third-party reporting tools, such as Microsoft Excel and Business Objects Crystal Reports, to make reports and charts using data from Operations Center. SQL Views uses views to make data accessible to these tools.
Some basic instructions are included here to get you started using Excel or Crystal Reports to build reports. For more information, consult the documentation for these products.
To create reports, you might need to enter some SQL statements. It is your responsibility to ensure the SQL statement syntax is correct. For example, when using Excel, it is necessary to manually enter the statement. Otherwise, Excel enters column names without enclosing them in parentheses, which results in invalid statement because the dot (.) is a keyword. An example of the correct syntax for such a column name is:
.CI.HARDWARE.CPU.MODEL
With regard to SQL statements, SQL Views accepts the following two time stamp formats. These formats are required for specifying the start time and end time of a historical query.
yyyy-MM-dd-HH.mm.ssExample: 2006-05-01-00.00.00
yyyy-MM-dd HH:mm:ssExample: 2006-05-01 00:00:00
The following sections review how to integrate Operations Center data into reports via Excel or Crystal Reports:
Section 3.1, “Using Excel for Queries and Reports,” on page 18
Section 3.2, “Using Crystal Reports for Queries and Reports,” on page 20
Queries and Reports 17

3.1 Using Excel for Queries and ReportsMicrosoft Excel is a commonly used application that can extract external data using its Import wizard. This section explains how to extract data from SQL Views using Excel. Sample reports are available in /OperationsCenter_install_path/database/examples/mosql.
Figure 3-1 Data from SQL Views formatted in Microsoft Excel
18 Operations Center SQL Views Guide
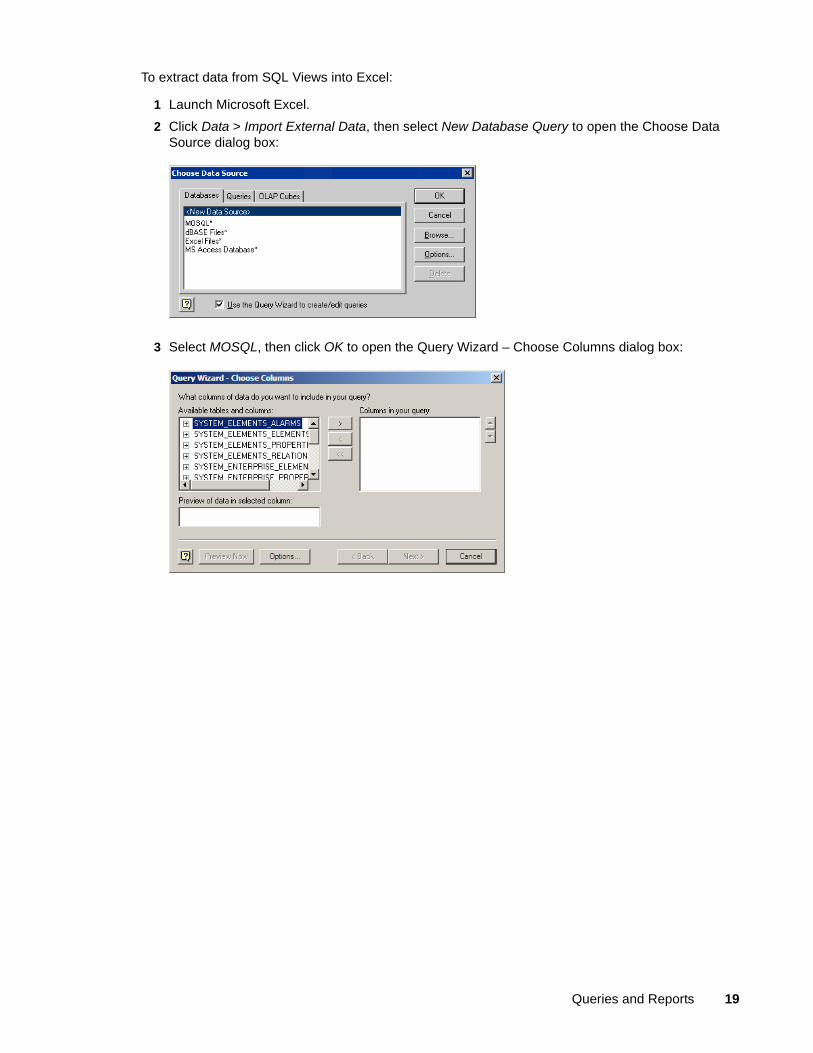
To extract data from SQL Views into Excel:
1 Launch Microsoft Excel.
2 Click Data > Import External Data, then select New Database Query to open the Choose Data Source dialog box:
3 Select MOSQL, then click OK to open the Query Wizard – Choose Columns dialog box:
Queries and Reports 19
4 Select the tables and columns for your query, then click Next.
The remaining wizard pages are standard Excel dialogs. For information on these features, see your Microsoft Excel documentation.
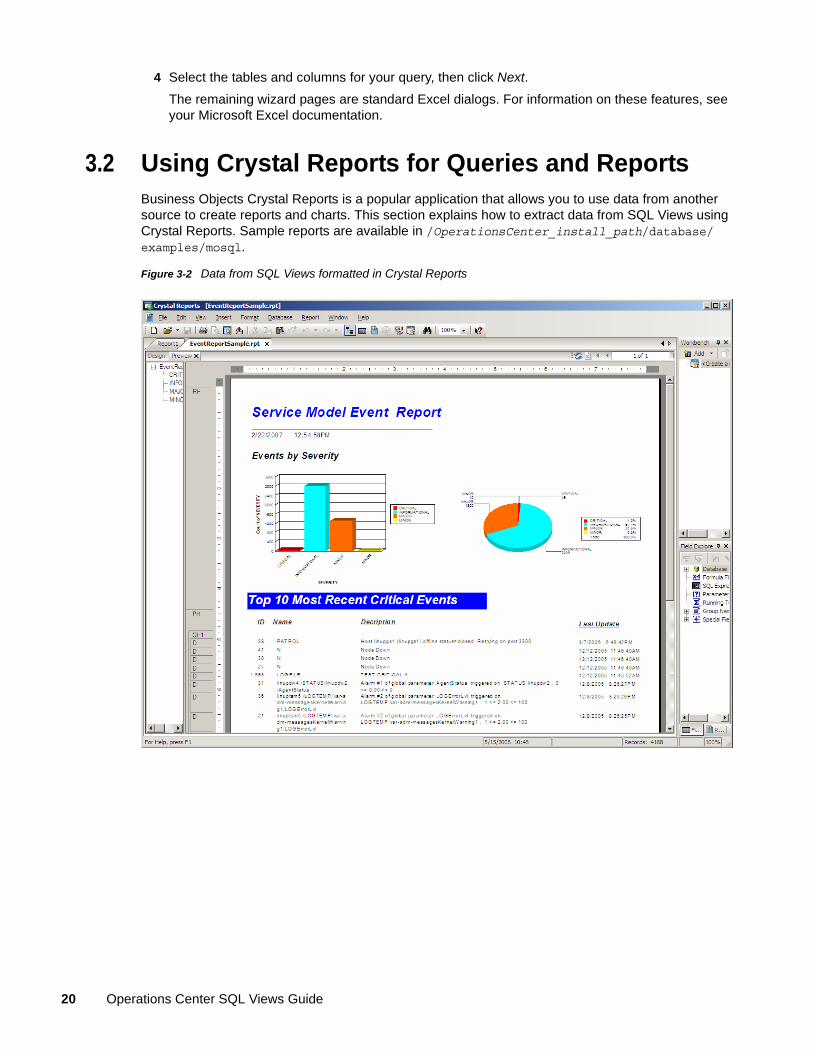
3.2 Using Crystal Reports for Queries and ReportsBusiness Objects Crystal Reports is a popular application that allows you to use data from another source to create reports and charts. This section explains how to extract data from SQL Views using Crystal Reports. Sample reports are available in /OperationsCenter_install_path/database/examples/mosql.
Figure 3-2 Data from SQL Views formatted in Crystal Reports
20 Operations Center SQL Views Guide

To extract data from SQL Views to Crystal Reports:
1 Launch Crystal Reports.
2 Click Start and select a blank report to display the Database Expert:
3 In the Available Data Sources list, expand Create New Connection:
Queries and Reports 21
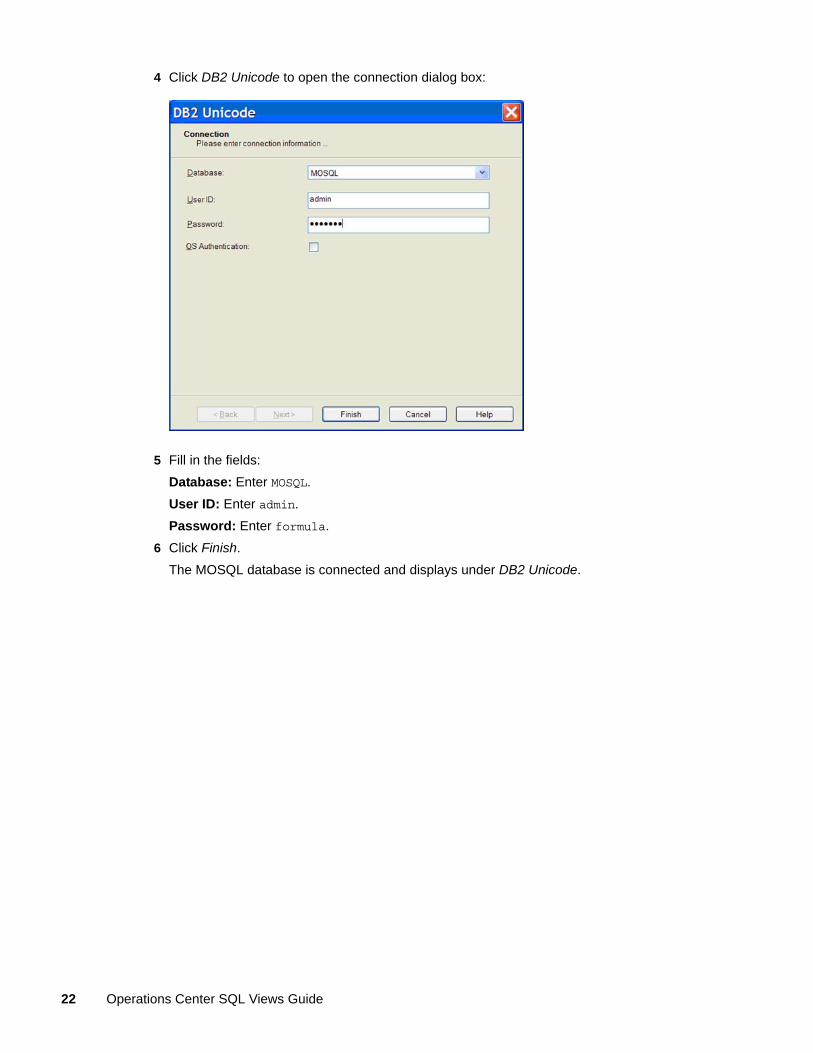
4 Click DB2 Unicode to open the connection dialog box:
5 Fill in the fields:
Database: Enter MOSQL.
User ID: Enter admin.
Password: Enter formula.
6 Click Finish.
The MOSQL database is connected and displays under DB2 Unicode.
22 Operations Center SQL Views Guide
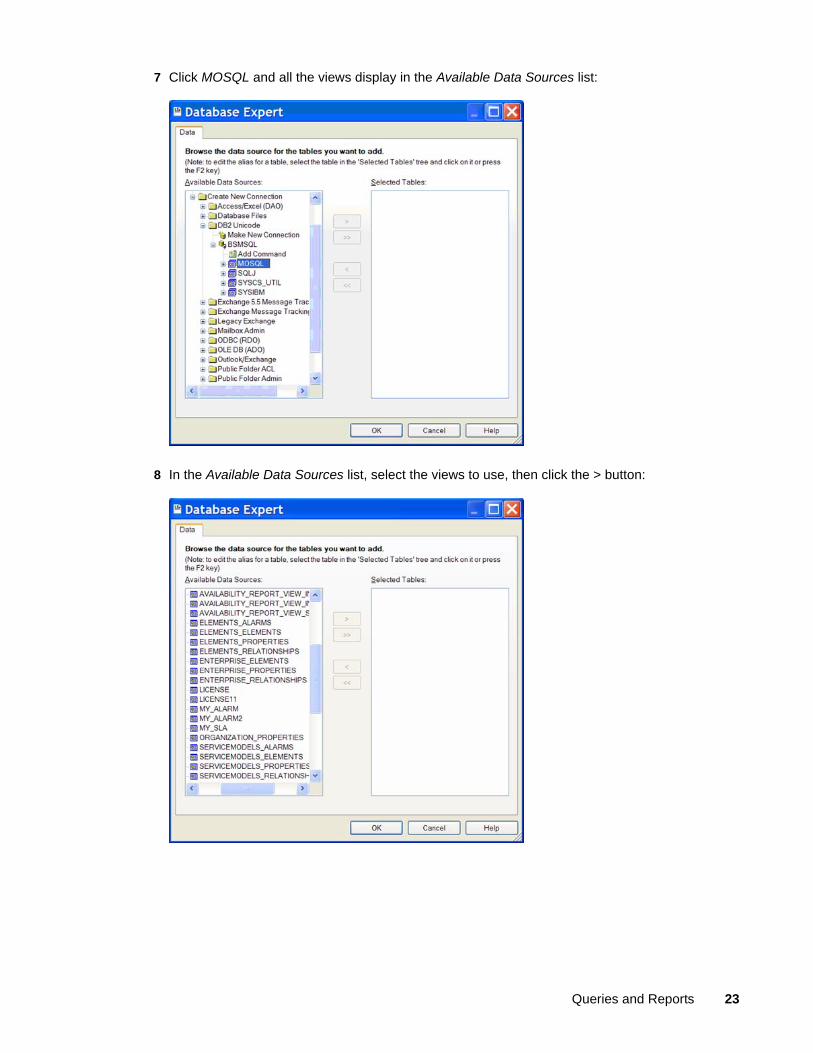
7 Click MOSQL and all the views display in the Available Data Sources list:
8 In the Available Data Sources list, select the views to use, then click the > button:
Queries and Reports 23
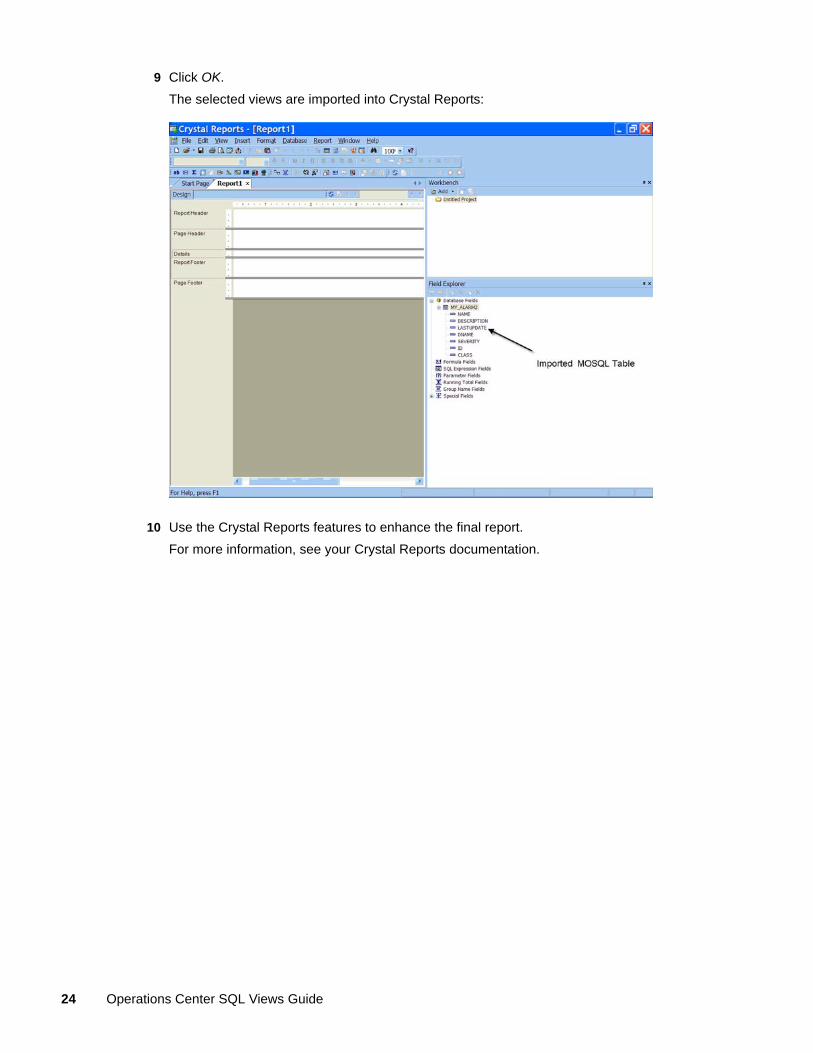
9 Click OK.
The selected views are imported into Crystal Reports:
10 Use the Crystal Reports features to enhance the final report.
For more information, see your Crystal Reports documentation.
24 Operations Center SQL Views Guide
4 4Tables and Views
SQL Views uses views to make data stored in tables accessible for creating reports using third-party reporting tools. There are two types of views:
Predefined: Called system views that ship with Operations Center
Custom: views that you create
You can create views from a single table in the Operations Center console or you can use a third-party tool, such as Apache Derby to create views from multiple tables.
System views extract data only one level deep in the Operations Center hierarchy.
You can also write custom queries that extract data directly from the tables.
Section 4.1, “Using Tables,” on page 25
Section 4.2, “Using System Views,” on page 39
Section 4.3, “Creating Views in the Operations Center console,” on page 40
Section 4.4, “Creating Custom Views,” on page 43
Section 4.5, “Writing Custom Queries,” on page 44
4.1 Using TablesThe system views and any views you create are based on the following tables:
Section 4.1.1, “Agreement Table,” on page 26
Section 4.1.2, “Alarms Table,” on page 26
Section 4.1.3, “AlarmsConstructed Table,” on page 27
Section 4.1.4, “AlarmsNamed Table,” on page 29
Section 4.1.5, “Availability Table,” on page 30
Section 4.1.6, “Breaches Table,” on page 32
Section 4.1.7, “Condition Table,” on page 33
Section 4.1.8, “Elements Table,” on page 34
Section 4.1.9, “Health Table,” on page 34
Section 4.1.10, “Outages Table,” on page 35
Section 4.1.11, “Performance Table,” on page 36
Section 4.1.12, “Properties Table,” on page 37
Section 4.1.13, “PropertiesConstructed Table,” on page 38
Section 4.1.14, “PropertiesNamed Table,” on page 38
Section 4.1.15, “Relationships Table,” on page 39
Tables and Views 25
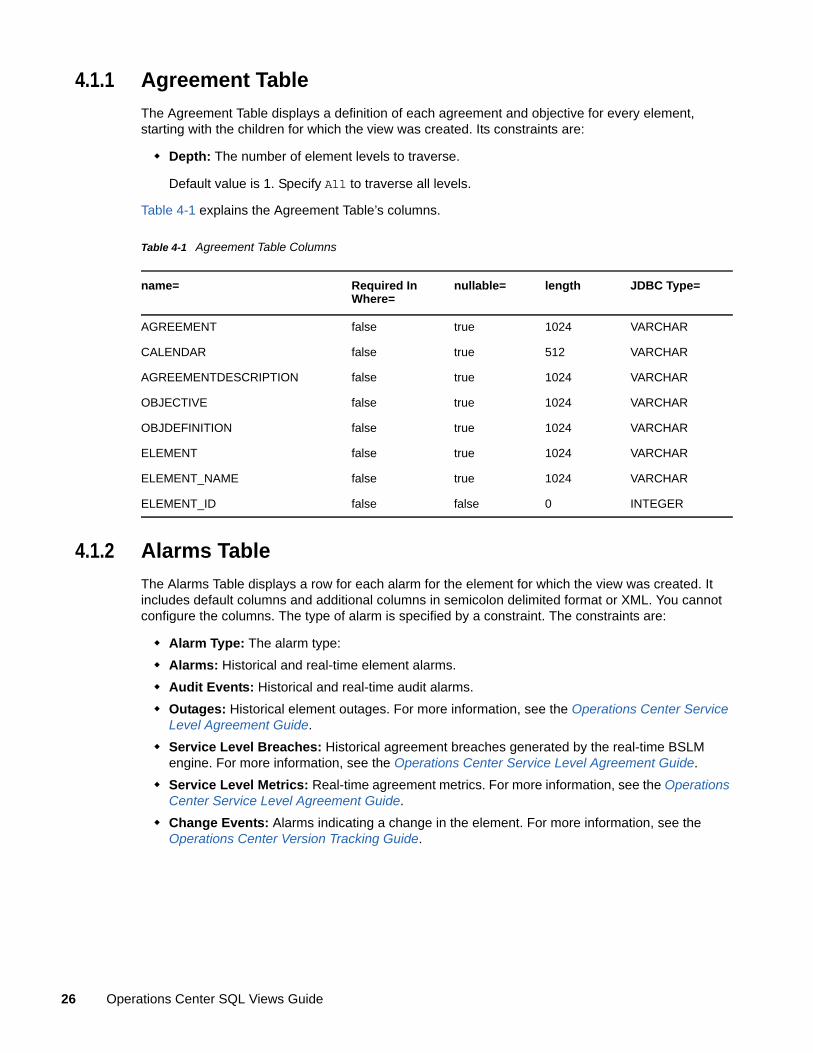
4.1.1 Agreement Table
The Agreement Table displays a definition of each agreement and objective for every element, starting with the children for which the view was created. Its constraints are:
Depth: The number of element levels to traverse.
Default value is 1. Specify All to traverse all levels.
Table 4-1 explains the Agreement Table’s columns.
Table 4-1 Agreement Table Columns
4.1.2 Alarms Table
The Alarms Table displays a row for each alarm for the element for which the view was created. It includes default columns and additional columns in semicolon delimited format or XML. You cannot configure the columns. The type of alarm is specified by a constraint. The constraints are:
Alarm Type: The alarm type:
Alarms: Historical and real-time element alarms.
Audit Events: Historical and real-time audit alarms.
Outages: Historical element outages. For more information, see the Operations Center Service Level Agreement Guide.
Service Level Breaches: Historical agreement breaches generated by the real-time BSLM engine. For more information, see the Operations Center Service Level Agreement Guide.
Service Level Metrics: Real-time agreement metrics. For more information, see the Operations Center Service Level Agreement Guide.
Change Events: Alarms indicating a change in the element. For more information, see the Operations Center Version Tracking Guide.
name= Required In Where=
nullable= length JDBC Type=
AGREEMENT false true 1024 VARCHAR
CALENDAR false true 512 VARCHAR
AGREEMENTDESCRIPTION false true 1024 VARCHAR
OBJECTIVE false true 1024 VARCHAR
OBJDEFINITION false true 1024 VARCHAR
ELEMENT false true 1024 VARCHAR
ELEMENT_NAME false true 1024 VARCHAR
ELEMENT_ID false false 0 INTEGER
26 Operations Center SQL Views Guide

Report Time Period: For historical tables, enables creating a single view that can be reused on a regular basis to produce a standard interval of data without having to edit the view and specify the start and end dates. The valid values are:
Last Year, Last Quarter, Last Month, Last Week, Yesterday, Last Hour, This Year, This Quarter, This Month, This Week, Today, This Hour, None
Ensure that data exists for the time period queried. If no data exists for the time period, no results are returned. Use the Start_Time and End_Time columns to define a specific time period for pruning the result set. One of the following time formats must be specified:
yyyy-MM-dd-HH.mm.ss For example: 2012-05-01-00.00.00
yyyy-MM-dd HH:mm:ss For example: 2012-05-01 00:00:00
The first format uses periods and hyphens where the other format uses colons and spaces.
Table 4-2 explains the Alarm Table’s columns.
Table 4-2 Alarms Table Columns
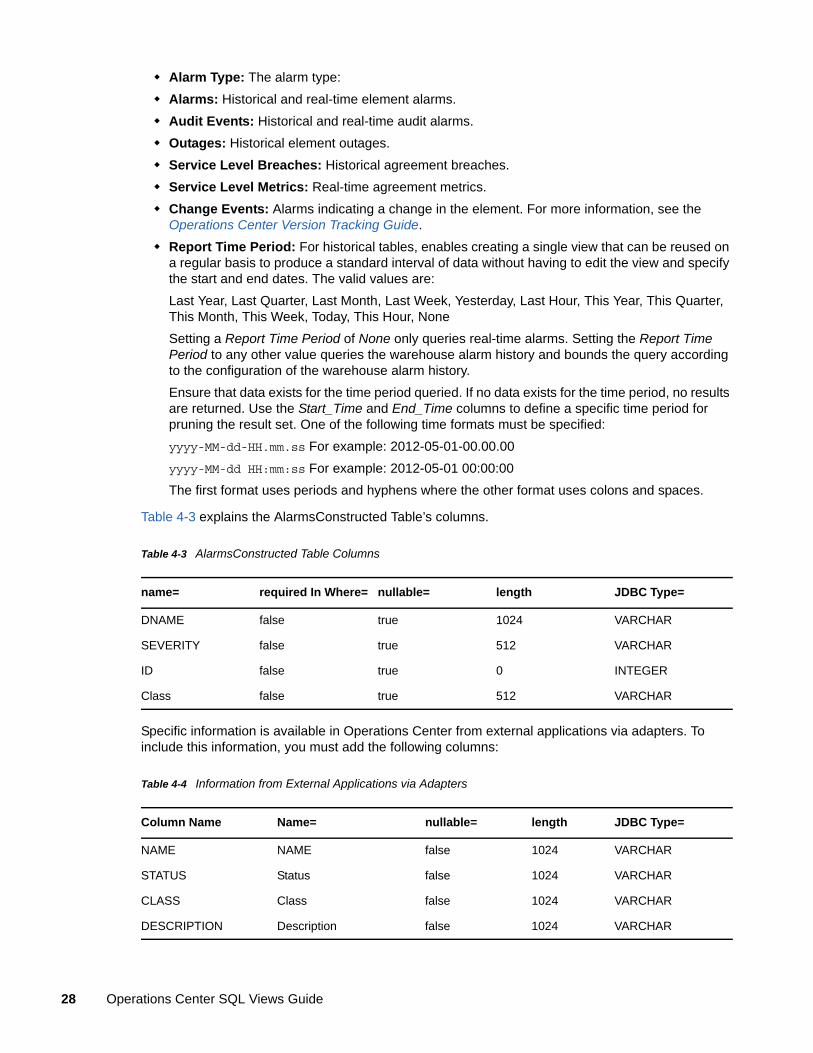
4.1.3 AlarmsConstructed Table
The AlarmsConstructed Table displays a row for each alarm for the element for which the view was created. You can define a custom set of columns and add EMS (external management system) as a searchable column. For example, to search for alarms generated from an external management system called ALPHA, you would add EMS as a column and ALPHA as a value and then use the following query:
select * from MOSQL.EVE_NAMED_ALARMS where EMS='ALPHA'
The type of alarm is specified by a constraint. A constraint determines which columns display. The constraints are:
Columns: The columns to display. The syntax for identifying columns is:
Name:name, Type:type, Nullable:Yes|No, Size:size_in_bytes
For example:
Name:LASTUPDATE,Type:Timestamp, Nullable:false,Size:1024
name= required In Where= nullable= length JDBC Type=
START_TIME false true 0 TIMESTAMP
END_TIME false true 0 TIMESTAMP
ELEMENT false true 1024 VARCHAR
ELEMENT_ID false false 0 INTEGER
ELEMENT_NAME false true 1024 VARCHAR
ID false true 0 INTEGER
SEVERITY false true 512 VARCHAR
LASTUPDATE false true 0 TIMESTAMP
DATA false true 0x1000000 LONGVARCHAR
XMLDATA false true 0x1000000 LONGVARCHAR
Tables and Views 27
Alarm Type: The alarm type:
Alarms: Historical and real-time element alarms.
Audit Events: Historical and real-time audit alarms.
Outages: Historical element outages.
Service Level Breaches: Historical agreement breaches.
Service Level Metrics: Real-time agreement metrics.
Change Events: Alarms indicating a change in the element. For more information, see the Operations Center Version Tracking Guide.
Report Time Period: For historical tables, enables creating a single view that can be reused on a regular basis to produce a standard interval of data without having to edit the view and specify the start and end dates. The valid values are:
Last Year, Last Quarter, Last Month, Last Week, Yesterday, Last Hour, This Year, This Quarter, This Month, This Week, Today, This Hour, None
Setting a Report Time Period of None only queries real-time alarms. Setting the Report Time Period to any other value queries the warehouse alarm history and bounds the query according to the configuration of the warehouse alarm history.
Ensure that data exists for the time period queried. If no data exists for the time period, no results are returned. Use the Start_Time and End_Time columns to define a specific time period for pruning the result set. One of the following time formats must be specified:
yyyy-MM-dd-HH.mm.ss For example: 2012-05-01-00.00.00
yyyy-MM-dd HH:mm:ss For example: 2012-05-01 00:00:00
The first format uses periods and hyphens where the other format uses colons and spaces.
Table 4-3 explains the AlarmsConstructed Table’s columns.
Table 4-3 AlarmsConstructed Table Columns
Specific information is available in Operations Center from external applications via adapters. To include this information, you must add the following columns:
Table 4-4 Information from External Applications via Adapters
name= required In Where= nullable= length JDBC Type=
DNAME false true 1024 VARCHAR
SEVERITY false true 512 VARCHAR
ID false true 0 INTEGER
Class false true 512 VARCHAR
Column Name Name= nullable= length JDBC Type=
NAME NAME false 1024 VARCHAR
STATUS Status false 1024 VARCHAR
CLASS Class false 1024 VARCHAR
DESCRIPTION Description false 1024 VARCHAR
28 Operations Center SQL Views Guide
NAME corresponds to the element name displayed in the Operations Center console, and STATUS, CLASS, and DESCRIPTION contain values that originate from external applications.
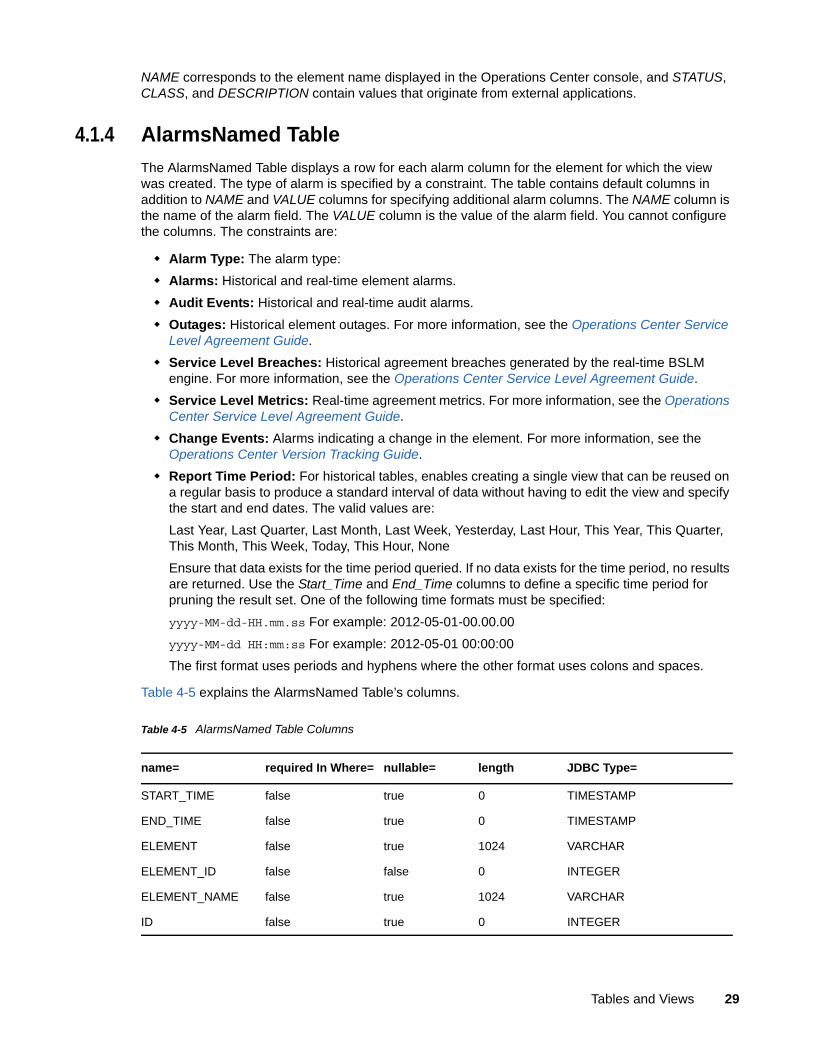
4.1.4 AlarmsNamed Table
The AlarmsNamed Table displays a row for each alarm column for the element for which the view was created. The type of alarm is specified by a constraint. The table contains default columns in addition to NAME and VALUE columns for specifying additional alarm columns. The NAME column is the name of the alarm field. The VALUE column is the value of the alarm field. You cannot configure the columns. The constraints are:
Alarm Type: The alarm type:
Alarms: Historical and real-time element alarms.
Audit Events: Historical and real-time audit alarms.
Outages: Historical element outages. For more information, see the Operations Center Service Level Agreement Guide.
Service Level Breaches: Historical agreement breaches generated by the real-time BSLM engine. For more information, see the Operations Center Service Level Agreement Guide.
Service Level Metrics: Real-time agreement metrics. For more information, see the Operations Center Service Level Agreement Guide.
Change Events: Alarms indicating a change in the element. For more information, see the Operations Center Version Tracking Guide.
Report Time Period: For historical tables, enables creating a single view that can be reused on a regular basis to produce a standard interval of data without having to edit the view and specify the start and end dates. The valid values are:
Last Year, Last Quarter, Last Month, Last Week, Yesterday, Last Hour, This Year, This Quarter, This Month, This Week, Today, This Hour, None
Ensure that data exists for the time period queried. If no data exists for the time period, no results are returned. Use the Start_Time and End_Time columns to define a specific time period for pruning the result set. One of the following time formats must be specified:
yyyy-MM-dd-HH.mm.ss For example: 2012-05-01-00.00.00
yyyy-MM-dd HH:mm:ss For example: 2012-05-01 00:00:00
The first format uses periods and hyphens where the other format uses colons and spaces.
Table 4-5 explains the AlarmsNamed Table’s columns.
Table 4-5 AlarmsNamed Table Columns
name= required In Where= nullable= length JDBC Type=
START_TIME false true 0 TIMESTAMP
END_TIME false true 0 TIMESTAMP
ELEMENT false true 1024 VARCHAR
ELEMENT_ID false false 0 INTEGER
ELEMENT_NAME false true 1024 VARCHAR
ID false true 0 INTEGER
Tables and Views 29
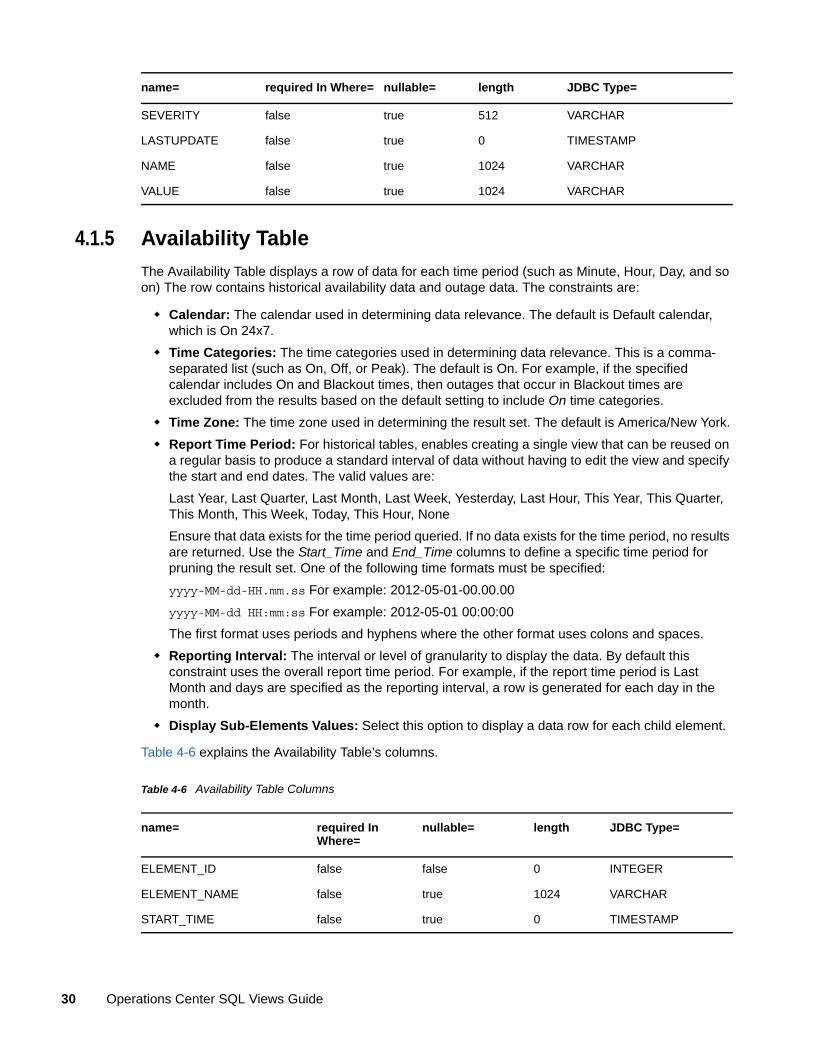
4.1.5 Availability Table
The Availability Table displays a row of data for each time period (such as Minute, Hour, Day, and so on) The row contains historical availability data and outage data. The constraints are:
Calendar: The calendar used in determining data relevance. The default is Default calendar, which is On 24x7.
Time Categories: The time categories used in determining data relevance. This is a comma-separated list (such as On, Off, or Peak). The default is On. For example, if the specified calendar includes On and Blackout times, then outages that occur in Blackout times are excluded from the results based on the default setting to include On time categories.
Time Zone: The time zone used in determining the result set. The default is America/New York.
Report Time Period: For historical tables, enables creating a single view that can be reused on a regular basis to produce a standard interval of data without having to edit the view and specify the start and end dates. The valid values are:
Last Year, Last Quarter, Last Month, Last Week, Yesterday, Last Hour, This Year, This Quarter, This Month, This Week, Today, This Hour, None
Ensure that data exists for the time period queried. If no data exists for the time period, no results are returned. Use the Start_Time and End_Time columns to define a specific time period for pruning the result set. One of the following time formats must be specified:
yyyy-MM-dd-HH.mm.ss For example: 2012-05-01-00.00.00
yyyy-MM-dd HH:mm:ss For example: 2012-05-01 00:00:00
The first format uses periods and hyphens where the other format uses colons and spaces.
Reporting Interval: The interval or level of granularity to display the data. By default this constraint uses the overall report time period. For example, if the report time period is Last Month and days are specified as the reporting interval, a row is generated for each day in the month.
Display Sub-Elements Values: Select this option to display a data row for each child element.
Table 4-6 explains the Availability Table’s columns.
Table 4-6 Availability Table Columns
SEVERITY false true 512 VARCHAR
LASTUPDATE false true 0 TIMESTAMP
NAME false true 1024 VARCHAR
VALUE false true 1024 VARCHAR
name= required In Where= nullable= length JDBC Type=
name= required In Where=
nullable= length JDBC Type=
ELEMENT_ID false false 0 INTEGER
ELEMENT_NAME false true 1024 VARCHAR
START_TIME false true 0 TIMESTAMP
30 Operations Center SQL Views Guide

The following explain the Downtime, Availability, and Discontinuity column values:
Downtime and Availability are determined based on element condition data.
Downtime is recorded in milliseconds.
Availability is calculated based on the total time within the report time period For example, if you request availability for the month of January, the total possible time is the number of milliseconds from Jan 1, 12:00 AM until Feb 1, 12:00 AM. Availability is determined by the formula: (total time in period minus total downtime in period) divide by total time in period. The Availability value is between 0 and 1, where 1 = 100%. By default, an element is available when its state is anything other than CRITICAL. The Calendar and Time Categories specified are used to determine when system outages are relevant to the calculated Availability, Downtime, and Outage results. Only those system outages that occur during time windows of the Calendar that reference the included Time Categories are included in the calculated results. For example, outages that occur during a scheduled maintenance period are not included in the results if the Blackout time category is not specified as included in the view.
When Agreement and Objective are specified as part of the Where clause in the query, Availability is calculated using the SLA and Objective definitions to determine the total time window.
Discontinuity is the time recorded when the system does not record any condition data. This might occur because of manually stopping an adapter, the Operations Center server, or a profile, or if the Operations Center server or a management system feed goes down unexpectedly. It is not known if the element was available during these times. By default, the BSLM engine calculates availability by assuming that there was no outage during these times.
Agreement and Objective columns are not saved values, but allow Agreement and Objective definitions to be applied in the Availability calculation. Agreement and Objective are displayed as null unless defined as part of the query. These columns are optional in the SQL query.
For more detailed information, see the Operations Center Service Level Agreement Guide.
END_TIME false true 0 TIMESTAMP
DNAME false true 1024 VARCHAR
AVAILABILITY false true 0 DOUBLE
DOWNTIME false true 0 BIGINT
OUTAGES false true 0 INTEGER
OUTAGES_CONTINUING false true 0 INTEGER
OUTAGES_INITIATED false true 0 INTEGER
RELEVANCE false true 0 DOUBLE
DISCONTINUITY false true 0 DOUBLE
AGREEMENT false true 1024 VARCHAR
OBJECTIVE false true 1024 VARCHAR
name= required In Where=
nullable= length JDBC Type=
Tables and Views 31

4.1.6 Breaches Table
The Breaches Table displays a row of data for each breach in the time period (such as Minute, Hour, Day, and so on) The row contains historical breaches. The constraints are:
Calendar: The calendar used in determining data relevance. The default is Default calendar.
Time Categories: The time categories used in determining data relevance. This is a comma-separated list (such as On, Off, or Peak). The default is On. For example, if the specified calendar includes On and Blackout times, then outages that occur in Blackout times are excluded from the results based on the default setting to include On time categories.
Time Zone: The time zone used in determining the result set. The default is America/New York.
Report Time Period: For historical tables, enables creating a single view that can be reused on a regular basis to produce a standard interval of data without having to edit the view and specify the start and end dates. The valid values are:
Last Year, Last Quarter, Last Month, Last Week, Yesterday, Last Hour, This Year, This Quarter, This Month, This Week, Today, This Hour, None
Ensure that data exists for the time period queried. If no data exists for the time period, no results are returned. Use the Start_Time and End_Time columns to further prune the result set. One of the following time formats must be specified:
yyyy-MM-dd-HH.mm.ss For example: 2012-05-01-00.00.00
yyyy-MM-dd HH:mm:ss For example: 2012-05-01 00:00:00
The first format uses periods and hyphens where the other format uses colons and spaces.
Reporting Interval: The interval or level of granularity to display the data. By default this constraint uses the overall report time period. For example, if the report time period is Last Month and days are specified as the reporting interval, a row is generated for each day in the month.
Table 4-7 explains the Breaches Table’s columns.
Table 4-7 Breaches Table Columns
name= required In Where=
nullable= length JDBC Type=
ELEMENT_ID false false 0 INTEGER
ELEMENT_NAME false true 1024 VARCHAR
AGREEMENT true false 1024 VARCHAR
OBJECTIVE false true 1024 VARCHAR
START_TIME false true 0 TIMESTAMP
END_TIME false true 0 TIMESTAMP
DNAME false true 1024 VARCHAR
DATE false true 0 TIMESTAMP
SEVERITY false true 512 VARCHAR
STATUS false true 1024 VARCHAR
KEYMETRIC false true 0 DOUBLE
32 Operations Center SQL Views Guide

This table requires specifying AGREEMENT in the SQL query as part of the where clause. It also optionally accepts OBJECTIVE as part of the where clause.
4.1.7 Condition Table
The Condition Table displays historical condition data. Each row represents the condition of the element at the specified data. The constraints are:
Report Time Period: For historical tables, enables creating a single view that can be reused on a regular basis to produce a standard interval of data without having to edit the view and specify the start and end dates. The valid values are:
Last Year, Last Quarter, Last Month, Last Week, Yesterday, Last Hour, This Year, This Quarter, This Month, This Week, Today, This Hour, None
Ensure that data exists for the time period queried. If no data exists for the time period, no results are returned. Use the Start_Time and End_Time columns to further prune the result set. One of the following time formats must be specified:
yyyy-MM-dd-HH.mm.ss For example: 2012-05-01-00.00.00
yyyy-MM-dd HH:mm:ss For example: 2012-05-01 00:00:00
The first format uses periods and hyphens where the other format uses colons and spaces.
Display Sub-Elements Values: Select this option to display a data row for each child element.
Table 4-8 explains the Condition Table’s columns.
Table 4-8 Condition Table Columns
APPLIEDAGREEMENT false true 1024 VARCHAR
REASON false true 1024 VARCHAR
PERSISTENTID false true 1024 VARCHAR
name= required In Where=
nullable= length JDBC Type=
name= required In Where= nullable= length JDBC Type=
DNAME false true 1024 VARCHAR
ELEMENT_ID false false 0 INTEGER
ELEMENT_NAME false true 1024 VARCHAR
TIME true true 0 TIMESTAMP
TYPE false true 1024 VARCHAR
SVALUE false true 1024 VARCHAR
DVALUE false true 0 DOUBLE
Tables and Views 33
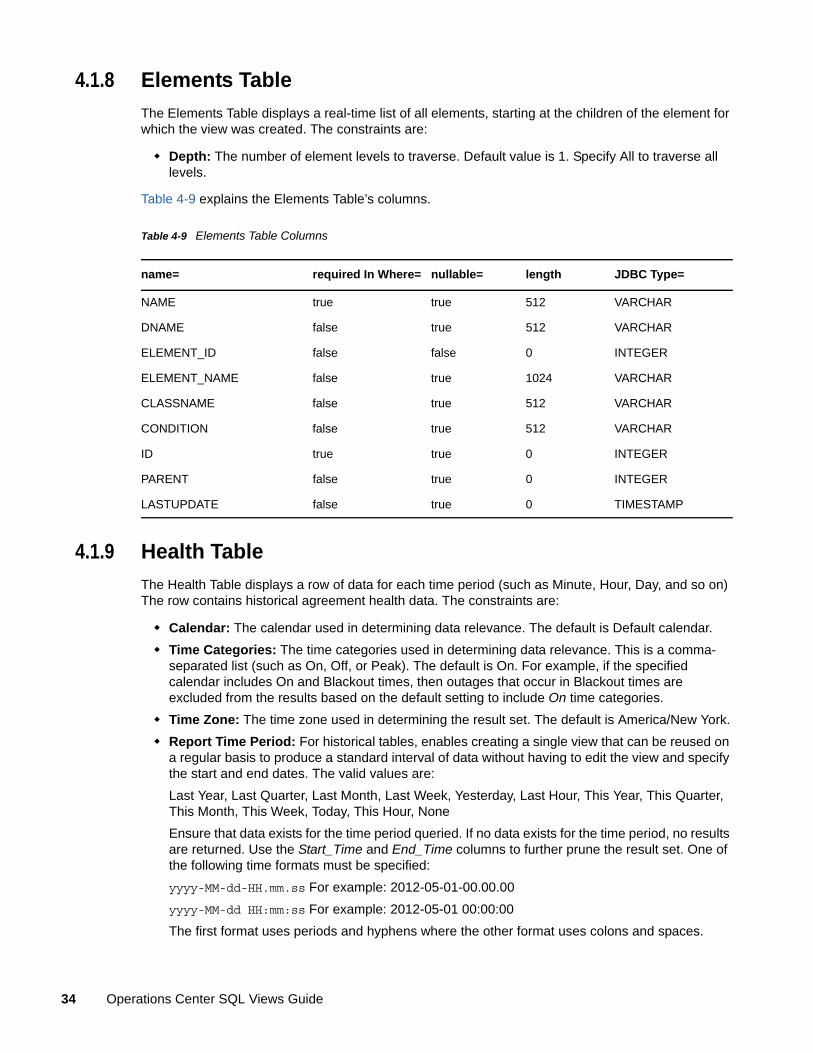
4.1.8 Elements Table
The Elements Table displays a real-time list of all elements, starting at the children of the element for which the view was created. The constraints are:
Depth: The number of element levels to traverse. Default value is 1. Specify All to traverse all levels.
Table 4-9 explains the Elements Table’s columns.
Table 4-9 Elements Table Columns
4.1.9 Health Table
The Health Table displays a row of data for each time period (such as Minute, Hour, Day, and so on) The row contains historical agreement health data. The constraints are:
Calendar: The calendar used in determining data relevance. The default is Default calendar.
Time Categories: The time categories used in determining data relevance. This is a comma-separated list (such as On, Off, or Peak). The default is On. For example, if the specified calendar includes On and Blackout times, then outages that occur in Blackout times are excluded from the results based on the default setting to include On time categories.
Time Zone: The time zone used in determining the result set. The default is America/New York.
Report Time Period: For historical tables, enables creating a single view that can be reused on a regular basis to produce a standard interval of data without having to edit the view and specify the start and end dates. The valid values are:
Last Year, Last Quarter, Last Month, Last Week, Yesterday, Last Hour, This Year, This Quarter, This Month, This Week, Today, This Hour, None
Ensure that data exists for the time period queried. If no data exists for the time period, no results are returned. Use the Start_Time and End_Time columns to further prune the result set. One of the following time formats must be specified:
yyyy-MM-dd-HH.mm.ss For example: 2012-05-01-00.00.00
yyyy-MM-dd HH:mm:ss For example: 2012-05-01 00:00:00
The first format uses periods and hyphens where the other format uses colons and spaces.
name= required In Where= nullable= length JDBC Type=
NAME true true 512 VARCHAR
DNAME false true 512 VARCHAR
ELEMENT_ID false false 0 INTEGER
ELEMENT_NAME false true 1024 VARCHAR
CLASSNAME false true 512 VARCHAR
CONDITION false true 512 VARCHAR
ID true true 0 INTEGER
PARENT false true 0 INTEGER
LASTUPDATE false true 0 TIMESTAMP
34 Operations Center SQL Views Guide
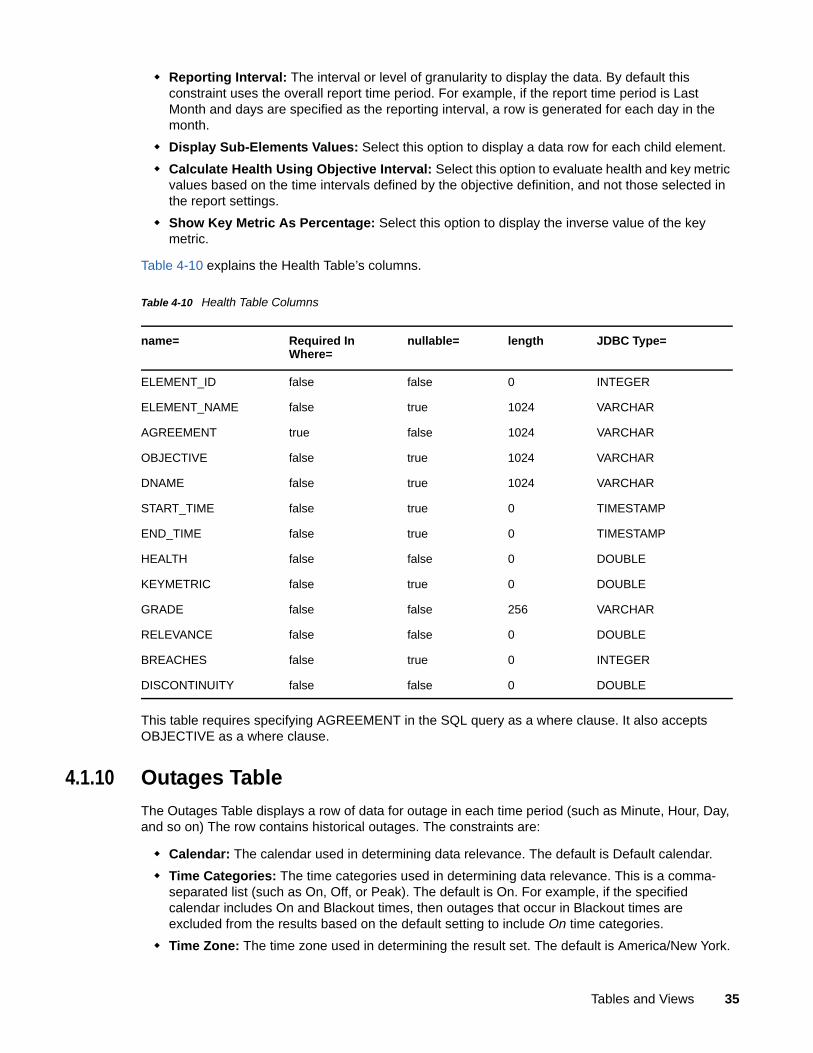
Reporting Interval: The interval or level of granularity to display the data. By default this constraint uses the overall report time period. For example, if the report time period is Last Month and days are specified as the reporting interval, a row is generated for each day in the month.
Display Sub-Elements Values: Select this option to display a data row for each child element.
Calculate Health Using Objective Interval: Select this option to evaluate health and key metric values based on the time intervals defined by the objective definition, and not those selected in the report settings.
Show Key Metric As Percentage: Select this option to display the inverse value of the key metric.
Table 4-10 explains the Health Table’s columns.
Table 4-10 Health Table Columns
This table requires specifying AGREEMENT in the SQL query as a where clause. It also accepts OBJECTIVE as a where clause.
4.1.10 Outages Table
The Outages Table displays a row of data for outage in each time period (such as Minute, Hour, Day, and so on) The row contains historical outages. The constraints are:
Calendar: The calendar used in determining data relevance. The default is Default calendar.
Time Categories: The time categories used in determining data relevance. This is a comma-separated list (such as On, Off, or Peak). The default is On. For example, if the specified calendar includes On and Blackout times, then outages that occur in Blackout times are excluded from the results based on the default setting to include On time categories.
Time Zone: The time zone used in determining the result set. The default is America/New York.
name= Required In Where=
nullable= length JDBC Type=
ELEMENT_ID false false 0 INTEGER
ELEMENT_NAME false true 1024 VARCHAR
AGREEMENT true false 1024 VARCHAR
OBJECTIVE false true 1024 VARCHAR
DNAME false true 1024 VARCHAR
START_TIME false true 0 TIMESTAMP
END_TIME false true 0 TIMESTAMP
HEALTH false false 0 DOUBLE
KEYMETRIC false true 0 DOUBLE
GRADE false false 256 VARCHAR
RELEVANCE false false 0 DOUBLE
BREACHES false true 0 INTEGER
DISCONTINUITY false false 0 DOUBLE
Tables and Views 35

Report Time Period: For historical tables, enables creating a single view that can be reused on a regular basis to produce a standard interval of data without having to edit the view and specify the start and end dates. The valid values are:
Last Year, Last Quarter, Last Month, Last Week, Yesterday, Last Hour, This Year, This Quarter, This Month, This Week, Today, This Hour, None
Ensure that data exists for the time period queried. If no data exists for the time period, no results are returned. Use the Start_Time and End_Time columns to further prune the result set. One of the following time formats must be specified:
yyyy-MM-dd-HH.mm.ss For example: 2012-05-01-00.00.00
yyyy-MM-dd HH:mm:ss For example: 2012-05-01 00:00:00
The first format uses periods and hyphens where the other format uses colons and spaces.
Reporting Interval: The interval or level of granularity to display the data. By default this constraint uses the overall report time period. For example, if the report time period is Last Month and days are specified as the reporting interval, a row is generated for each day in the month.
Table 4-11 explains the Outages Table’s columns.
Table 4-11 Outages Table Columns
4.1.11 Performance Table
Queries against the Performance table must contain a valid performance Profile name and Expression name defined in the Operations Center server. If the names are not included in the query as part of the where clause, then the query returns an error. For example:
select * from PERFORMANCE_VIEW where Profile = 'Router Performance' and Expression = 'Condition Counts'
name= Required In Where= nullable= length JDBC Type=
ELEMENT_ID false false 0 INTEGER
ELEMENT_NAME false true 1024 VARCHAR
DNAME false true 1024 VARCHAR
START_TIME false true 0 TIMESTAMP
END_TIME false true 0 TIMESTAMP
OUTAGE_START false true 0 TIMESTAMP
OUTAGE_END false true 0 TIMESTAMP
DURATION false false 0 DOUBLE
DESCRIPTION false true 1024 VARCHAR
PERSISTENTID false true 1024 VARCHAR
36 Operations Center SQL Views Guide
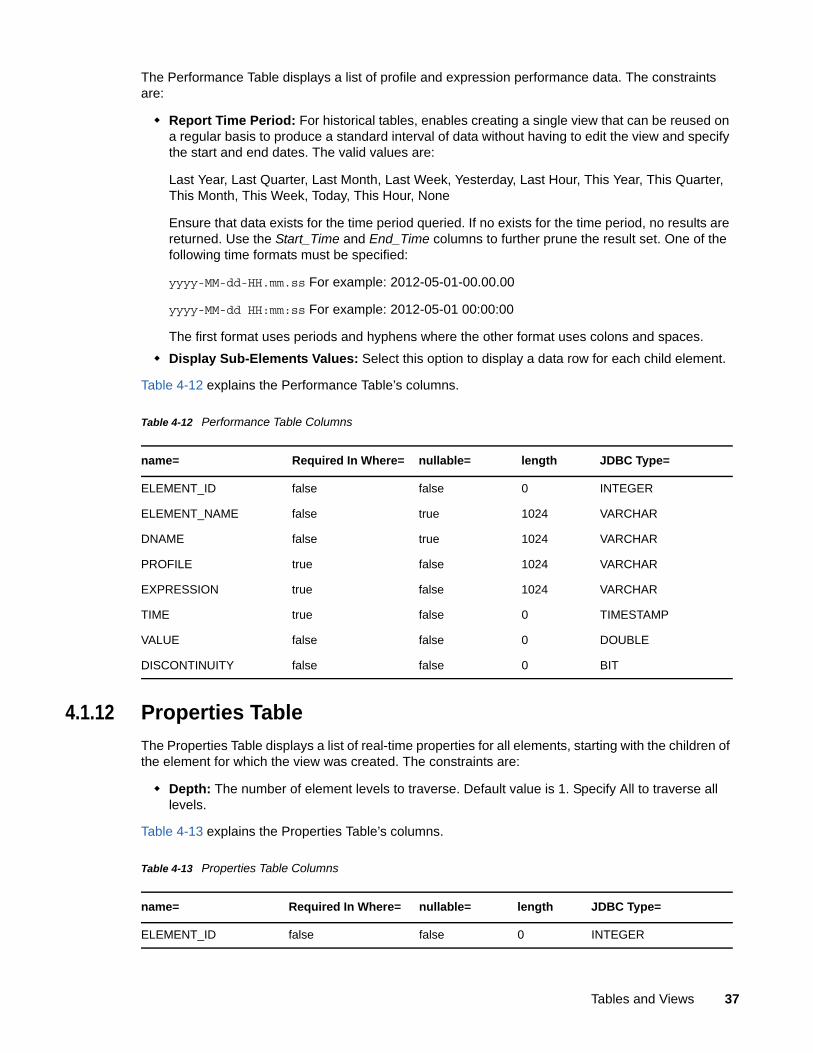
The Performance Table displays a list of profile and expression performance data. The constraints are:
Report Time Period: For historical tables, enables creating a single view that can be reused on a regular basis to produce a standard interval of data without having to edit the view and specify the start and end dates. The valid values are:
Last Year, Last Quarter, Last Month, Last Week, Yesterday, Last Hour, This Year, This Quarter, This Month, This Week, Today, This Hour, None
Ensure that data exists for the time period queried. If no exists for the time period, no results are returned. Use the Start_Time and End_Time columns to further prune the result set. One of the following time formats must be specified:
yyyy-MM-dd-HH.mm.ss For example: 2012-05-01-00.00.00
yyyy-MM-dd HH:mm:ss For example: 2012-05-01 00:00:00
The first format uses periods and hyphens where the other format uses colons and spaces.
Display Sub-Elements Values: Select this option to display a data row for each child element.
Table 4-12 explains the Performance Table’s columns.
Table 4-12 Performance Table Columns
4.1.12 Properties Table
The Properties Table displays a list of real-time properties for all elements, starting with the children of the element for which the view was created. The constraints are:
Depth: The number of element levels to traverse. Default value is 1. Specify All to traverse all levels.
Table 4-13 explains the Properties Table’s columns.
Table 4-13 Properties Table Columns
name= Required In Where= nullable= length JDBC Type=
ELEMENT_ID false false 0 INTEGER
ELEMENT_NAME false true 1024 VARCHAR
DNAME false true 1024 VARCHAR
PROFILE true false 1024 VARCHAR
EXPRESSION true false 1024 VARCHAR
TIME true false 0 TIMESTAMP
VALUE false false 0 DOUBLE
DISCONTINUITY false false 0 BIT
name= Required In Where= nullable= length JDBC Type=
ELEMENT_ID false false 0 INTEGER
Tables and Views 37

4.1.13 PropertiesConstructed Table
The PropertiesConstructed Table displays a list of real-time properties for all elements, starting with the children of the element for which the view was created. This table displays columns based on the table constraint. The constraints are:
Columns: The columns to display. The syntax for identifying columns is:
Name:name, Type:type, Nullable:Yes|No, Size:size_in_bytes
For example:
Name:LASTUPDATE,Type:Timestamp, Nullable:false,Size:1024
Depth: The number of element levels to traverse. Default value is 1. Specify All to traverse all levels.
The PropertiesConstructed Table’s columns are user-defined.
4.1.14 PropertiesNamed Table
The PropertiesNamed Table displays a list of real-time properties for all elements, starting with the children of the element for which the view was created. Each property is specified in a single row. The NAME column specifies the property name. The VALUE column specifies the property value. The constraints are:
Depth: The number of element levels to traverse. Default value is 1. Specify All to traverse all levels.
Table 4-14 explains the PropertiesNamed Table’s columns.
Table 4-14 PropertiesNamed Table Columns
ELEMENT_NAME false true 1024 VARCHAR
DNAME false true 1024 VARCHAR
DATA false true 0x1000000 LONGVARCHAR
XMLDATA false true 0x1000000 LONGVARCHAR
name= Required In Where= nullable= length JDBC Type=
name= Required In Where= nullable= length JDBC Type=
ELEMENT_ID false false 0 INTEGER
ELEMENT_NAME false true 1024 VARCHAR
DNAME false true 1024 VARCHAR
NAME true true 512 VARCHAR
VALUE false true 1024 VARCHAR
38 Operations Center SQL Views Guide
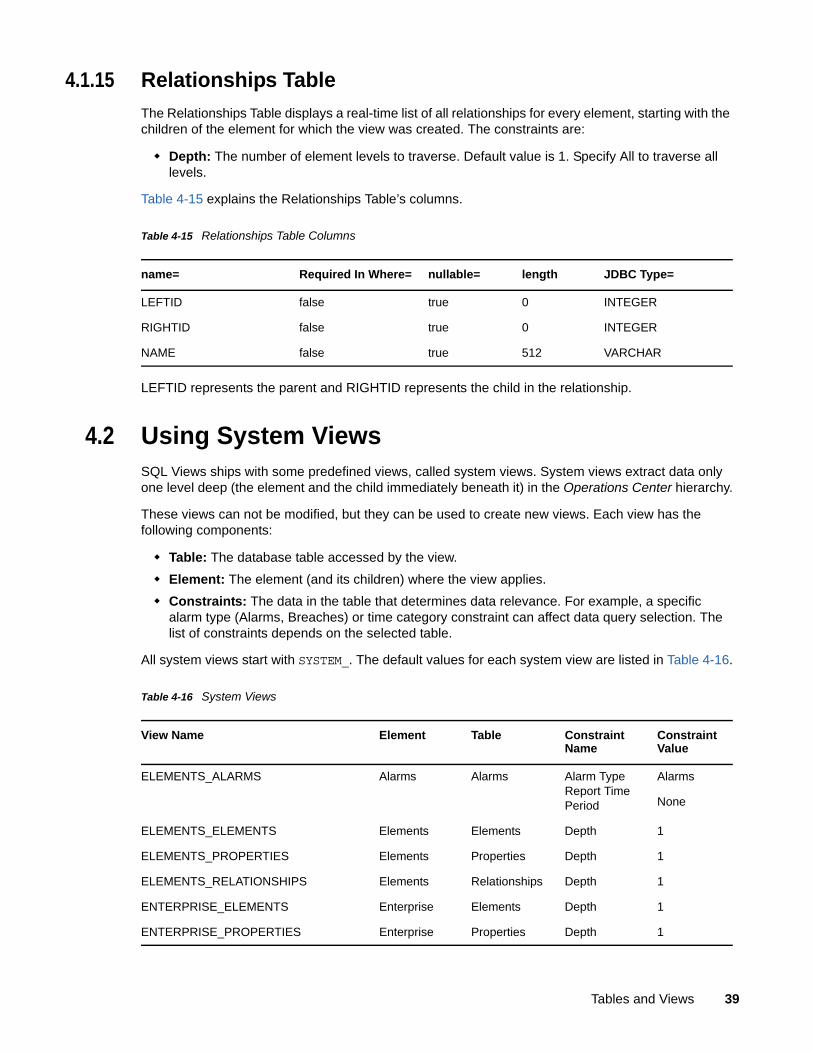
4.1.15 Relationships Table
The Relationships Table displays a real-time list of all relationships for every element, starting with the children of the element for which the view was created. The constraints are:
Depth: The number of element levels to traverse. Default value is 1. Specify All to traverse all levels.
Table 4-15 explains the Relationships Table’s columns.
Table 4-15 Relationships Table Columns
LEFTID represents the parent and RIGHTID represents the child in the relationship.
4.2 Using System ViewsSQL Views ships with some predefined views, called system views. System views extract data only one level deep (the element and the child immediately beneath it) in the Operations Center hierarchy.
These views can not be modified, but they can be used to create new views. Each view has the following components:
Table: The database table accessed by the view.
Element: The element (and its children) where the view applies.
Constraints: The data in the table that determines data relevance. For example, a specific alarm type (Alarms, Breaches) or time category constraint can affect data query selection. The list of constraints depends on the selected table.
All system views start with SYSTEM_. The default values for each system view are listed in Table 4-16.
Table 4-16 System Views
name= Required In Where= nullable= length JDBC Type=
LEFTID false true 0 INTEGER
RIGHTID false true 0 INTEGER
NAME false true 512 VARCHAR
View Name Element Table Constraint Name
Constraint Value
ELEMENTS_ALARMS Alarms Alarms Alarm Type Report Time Period
Alarms
None
ELEMENTS_ELEMENTS Elements Elements Depth 1
ELEMENTS_PROPERTIES Elements Properties Depth 1
ELEMENTS_RELATIONSHIPS Elements Relationships Depth 1
ENTERPRISE_ELEMENTS Enterprise Elements Depth 1
ENTERPRISE_PROPERTIES Enterprise Properties Depth 1
Tables and Views 39

To manage these views:
1 In the Explorer pane of the Operations Center console, expand Administration > SQL Views.
2 To edit the properties of an existing view, right-click the name of the view, then select Properties.
3 On the Properties page, select View.
4.3 Creating Views in the Operations Center consoleYou can create your own views in the Operations Center console that select data from a single table. This view only extracts data only one level deep (the element and the child immediately beneath it) in the Operations Center hierarchy.
The Operations Center console contains functionality for viewing and editing existing views, as well as creating, copying, editing, and deleting views.
The iSQL Viewer in the MOSDB utility only allows you to view the data in SQL Views. This utility is not intended for use with SQL Views.
The following sections cover creating and maintaining views:
Section 4.3.1, “Editing a View,” on page 41
Section 4.3.2, “Creating a New View,” on page 41
Section 4.3.3, “Deleting Views,” on page 42
ENTERPRISE_RELATIONSHIPS Enterprise Relationships Depth 1
SERVICEMODELS_ALARMS Service Models Alarms Alarm Type
Report Time Period
Alarms None
SERVICEMODELS_ELEMENTS Service Models Elements Depth 1
SERVICEMODELS_PROPERTIES Service Models Properties Depth 1
SERVICEMODELS_RELATIONSHIPS Service Models Relationships Depth 1
SERVICEMODELS_SLAS Service Models Agreement Depth 1
View Name Element Table Constraint Name
Constraint Value
40 Operations Center SQL Views Guide

4.3.1 Editing a View
1 In the Operations Center console, expand Enterprise > Administration > SQL Views.
2 Right-click the desired view, select Properties, then select View in the Properties dialog box.
3 Edit the view as required.
4.3.2 Creating a New View
To create a new view, you have two options:
Copy an existing view and modify it.
Create a new view from scratch.
You cannot rename or modify system views, such as views that are named SYSTEM_. However, you can copy a system view and rename the copy.
“Copying a View and Renaming It” on page 41
“Creating a New View from Scratch” on page 42
Copying a View and Renaming It
1 Right-click a view, then select Copy.
The view is copied to the Clipboard.
2 Right-click the SQL Views element, then select Paste.
A copy of the view name is appended with _COPY and placed under the SQL Views element.
3 Right-click the view, then select Rename to open the Rename dialog box.
4 Specify the new name, then click OK.
The renamed view displays in the Explorer pane.
Tables and Views 41
Creating a New View from Scratch
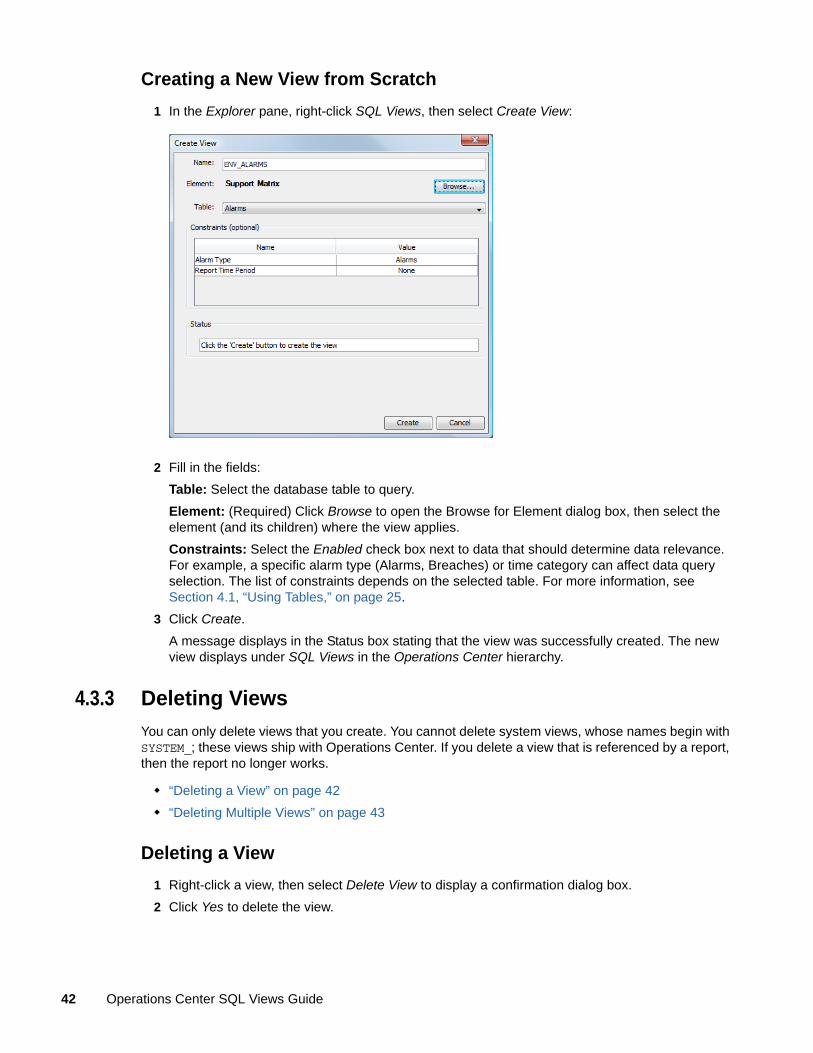
1 In the Explorer pane, right-click SQL Views, then select Create View:
2 Fill in the fields:
Table: Select the database table to query.
Element: (Required) Click Browse to open the Browse for Element dialog box, then select the element (and its children) where the view applies.
Constraints: Select the Enabled check box next to data that should determine data relevance. For example, a specific alarm type (Alarms, Breaches) or time category can affect data query selection. The list of constraints depends on the selected table. For more information, see Section 4.1, “Using Tables,” on page 25.
3 Click Create.
A message displays in the Status box stating that the view was successfully created. The new view displays under SQL Views in the Operations Center hierarchy.
4.3.3 Deleting Views
You can only delete views that you create. You cannot delete system views, whose names begin with SYSTEM_; these views ship with Operations Center. If you delete a view that is referenced by a report, then the report no longer works.
“Deleting a View” on page 42
“Deleting Multiple Views” on page 43
Deleting a View
1 Right-click a view, then select Delete View to display a confirmation dialog box.
2 Click Yes to delete the view.
42 Operations Center SQL Views Guide
Deleting Multiple Views
1 Right-click the SQL Views element, then select Manage Views to open the Manage Views dialog box.
2 Use Shift+click or Ctrl+click to select multiple views.
3 Click Delete to delete the views.
A message displays in the Status dialog box saying that the views were successfully deleted.
4.4 Creating Custom ViewsUsing the Mossqlcli tool, you can create custom views that use more complex queries to include multiple tables. Views can even be combined to form more complex views. You can then use third-party tools to query just a single view to create reports.
Section 4.4.1, “Testing Mossqlcli,” on page 43
Section 4.4.2, “Creating a View using Mossqlcli,” on page 44
4.4.1 Testing Mossqlcli
Mossqlcli is based on Apache Derby ij, a third-party tool, which is installed with SQL Views. For information on how to use Derby ij and for a tutorial on the Apache Derby Web site, see http://db.apache.org/derby/integrate/plugin_help/ij_toc.html.
The following is a possible test query:
select * from MOSQL.SYSTEM_SERVICEMODELS_ELEMENTS;
If mossqlcli has not been installed, you can install it.
“Testing that Mossqlcli was Installed Properly” on page 43
“Installing Mossqlcli” on page 43
Testing that Mossqlcli was Installed Properly
1 Run mossqlcli.
The following should dislpay:
Usage: mossqlcli username password [host:port]The port shown is the port for Managed Object SQL; the default is 1560.
2 Run the file again with valid arguments.
3 Verify a connection to SQL Views.
The Operations Center server and SQL Views must be running.
Installing Mossqlcli
1 Install the latest patch bundle from Operations Center.
For more information, contact Technical Support.
2 Run the Operations Center Configuration Manager (such as customizer).
3 Verify that a new bin file called mossqlcli (Unix) or mossqlcli.bat (Windows) exists.
Tables and Views 43
4.4.2 Creating a View using Mossqlcli
You can use mossqlcli to create a custom view based on one or more tables. For example, to create a view called MOSQL One containing the data from the system view called SYSTEM_ELEMENTS_ELEMENTS, which contains one record, you enter the following code:
create view MOSQLONE as select * from MOSQL.SYSTEM_SERVICEMODELS_ELEMENTS;
Mossqlcli returns the following:
0 rows inserted/updated/deteled
To see the contents of the view, enter the following code:
select * from MOSQLONE;
Mossqlcli returns the following:
NAME
|DNAME
|CLASSNAME
|CONDITION |ID |PARENT |LASTUPDATE
--------------------------------------------------------------------------------------------------------------------------------------------------------------------------------------------------------------------------------------------------------------------------------------------------------------------
Adapter: NOC Demonstration Adapter
|demoMgr=Adapter%3A+NOC+Demonstration+Adapter/root=Elements
|demoMgr
|CRITICAL |1206626208 |1206624715 |2008-04-04 14:00:14.102
1 row selected
You can use the SQL Views syntax to write more complex queries to create more complex views, also.
4.5 Writing Custom QueriesSQL Views uses views to make data accessible for use in reports. Views are used for two reasons:
The SQL dialect for SQL Views is slightly different than standard SQL
The definition of a view causes the altered SQL syntax to be hidden from the third party reporting tool or java application.
The definition of a view causes the database metadata to report a view in the database catalog
44 Operations Center SQL Views Guide
You can query the tables to either use the results for a custom view or in a report; the query must use SQL Views. The following is a sample query:
SELECT EL1.NAME AS "Service Name", EL1.CLASSNAME AS "Service Type", EL1.DNAME AS "Service Address", RL.NAME AS "Relationship Name", EL2.NAME AS "Component Name", EL2.CLASSNAME AS "Component Type", EL2.DNAME AS "Component Address"FROM NEW formula.Elements('root=Elements') AS EL1, NEW formula.Elements() AS EL2, NEW formula.Relationships() AS RLWHERE EL1.ID = RL.LEFTIDAND EL1.CLASSNAME = 'computer_workstation'AND EL2.ID = RL.RIGHTID;SELECT * FROM Enterprise_Elements;SELECT EL1.NAME AS "Service Name", EL1.CLASSNAME AS "Service Type", EL1.DNAME AS "Service Address", RL.NAME AS "Relationship Name", EL2.NAME AS "Component Name", EL2.CLASSNAME AS "Component Type", EL2.DNAME AS "Component Address"FROM NEW formula.Elements('root=Elements') AS EL1, NEW formula.Elements() AS EL2, NEW formula.Relationships() AS RLWHERE EL1.ID = RL.LEFTIDAND EL1.CLASSNAME = 'computer_workstation'AND EL2.ID = RL.RIGHTID;SELECT *FROM NEW formula.Properties('root=Elements') AS properties;SELECT *FROM NEW formula.Relationships() AS RLWHERE RL.NAME <> 'NAM';
Tables and Views 45

46 Operations Center SQL Views Guide
5 5Example Reports
SQL Views can be used to create many different types of reports. The following are five potential uses:
Alarms
Performance
SLA catalog
Availability, downtime, and outages based on Service Level Agreements (SLAs) and objectives
Service catalog changes
A BSLM license key is required for performance reporting, service level catalog reporting, and availability reporting.
Sample reports ship with SQL Views and can be found in /OperationsCenter_install_path/database/examples/mosql.
The following sections contain various types of reports generated using SQL Views:
Section 5.1, “Alarms Reports,” on page 48
Section 5.2, “Performance Reports,” on page 49
Section 5.3, “SLA Catalog Reports,” on page 50
Section 5.4, “SLA Availability Reports,” on page 51
Section 5.5, “Service Catalog Changes Report,” on page 53
Example Reports 47

5.1 Alarms ReportsUsing SQL Views, you can create reports that contain historical alarm data. There are two system views that contain alarm data: system_elements_alarms and system_servicemodels_alarms. You can use these views to create reports. Two possible reports are events (alarms) by severity (Figure 5-1) and number of incidents by severity (Figure 5-2), as shown in the following examples:
Figure 5-1 Report showing events (alarms) by severity
48 Operations Center SQL Views Guide
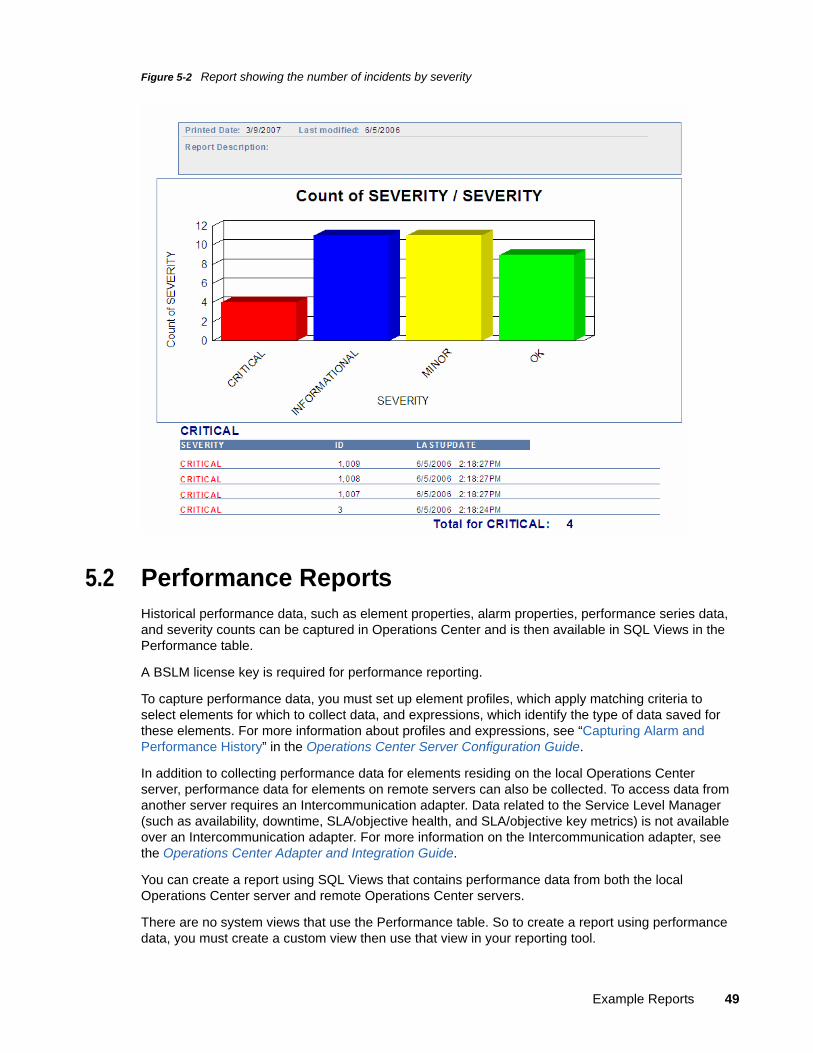
Figure 5-2 Report showing the number of incidents by severity
5.2 Performance ReportsHistorical performance data, such as element properties, alarm properties, performance series data, and severity counts can be captured in Operations Center and is then available in SQL Views in the Performance table.
A BSLM license key is required for performance reporting.
To capture performance data, you must set up element profiles, which apply matching criteria to select elements for which to collect data, and expressions, which identify the type of data saved for these elements. For more information about profiles and expressions, see “Capturing Alarm and Performance History” in the Operations Center Server Configuration Guide.
In addition to collecting performance data for elements residing on the local Operations Center server, performance data for elements on remote servers can also be collected. To access data from another server requires an Intercommunication adapter. Data related to the Service Level Manager (such as availability, downtime, SLA/objective health, and SLA/objective key metrics) is not available over an Intercommunication adapter. For more information on the Intercommunication adapter, see the Operations Center Adapter and Integration Guide.
You can create a report using SQL Views that contains performance data from both the local Operations Center server and remote Operations Center servers.
There are no system views that use the Performance table. So to create a report using performance data, you must create a custom view then use that view in your reporting tool.
Example Reports 49

To create a performance report for local and remote data:
1 Create an InterCommunication adapter.
For instructions, see the Operations Center Adapter and Integration Guide.
2 Create and start a profile with expressions that track the desired performance data, such as an element property or an alarm property.
For example, create a profile that stores the total number of alarms in the Operations Center server element or stores the queue size of the Data Warehouse element.
3 Create a view.
In creating this view, select an element that has profile information, then select Performance as the table.
4 Configure SQL Views, if you have not done so already.
For more information, see Section 2.1, “Prerequisites,” on page 9.
5 Extract the performance data into Microsoft Excel or Crystal Reports and create a report.
For more information, see Chapter 3, “Queries and Reports,” on page 17.
5.3 SLA Catalog ReportsUsing SQL Views, you have access to information about Service Level Agreements (SLAs).
A BSLM license key is required for SLA Catalog reporting.
The system_servicemodels_agreement view contains the following information about Service Level Agreements:
Name of the agreement
Name of any objectives
Definitions of objectives
Elements associated with each SLA and objective
50 Operations Center SQL Views Guide

You can use this view to create a report that gives you a service level catalog listing the Agreements and Objectives defined in the system. Figure 5-3 illustrates this:
Figure 5-3 Report showing a SLA catalog
5.4 SLA Availability ReportsTo monitor the status of your Service Level Agreements (SLAs), you can write a report in SQL Views that includes availability, downtime, and breaches on specific elements during a month.
A BSLM license key is required for SLA Availability reporting.
Section 5.4.1, “Understanding Availability and Downtime,” on page 52
Section 5.4.2, “Creating an Availability Report,” on page 53
Example Reports 51
5.4.1 Understanding Availability and Downtime
Availability and downtime are defined as follows:
Downtime and Availability are determined based on element condition data.
Downtime is recorded in milliseconds.
Availability is calculated based on the total time within the report time period.
For example, if you request availability for the month of January, the total possible time is the number of milliseconds from Jan 1, 12:00 AM until Feb 1, 12:00 AM.
Availability is determined by the formula: (total time in period minus total downtime in period) divided by total time in period.
The Availability value is between 0 and 1, where 1 = 100%.
By default, an element is available when its state is anything other than CRITICAL.
The Calendar and Time Categories specified are used to determine when system outages are relevant to the calculated Availability, Downtime, and Outage results. Only those system outages that occur during time windows of the Calendar that reference the included Time Categories are included in the calculated results. For example, outages that occur during a scheduled maintenance period are not included in the results if the Blackout time category is not specified as included in the view.
Optionally specify Agreement and Objective as part of the Where clause in the query, to calculate Availability using the SLA and Objective definitions to determine the total time window, versus report time period.
Agreement and Objective columns are not saved values, but allow Agreement and Objective definitions to be applied to the Availability calculation. Agreement and Objective are displayed as null unless defined as part of the query. These columns are optional in the SQL query.
Discontinuity is the time recorded when the software did not record any condition data. This might occur because of manually stopping an adapter, the Operations Center server, or a profile, or if the Operations Center server or a management system feed goes down unexpectedly.
It is not known by the software if the element was available during these times. By default, the BSLM engine calculates availability by assuming that there was no outage during these times.
Data on availability, outages, and breaches is stored in the availability, outages, and breaches tables. To use this data, you must create views that use these tables.
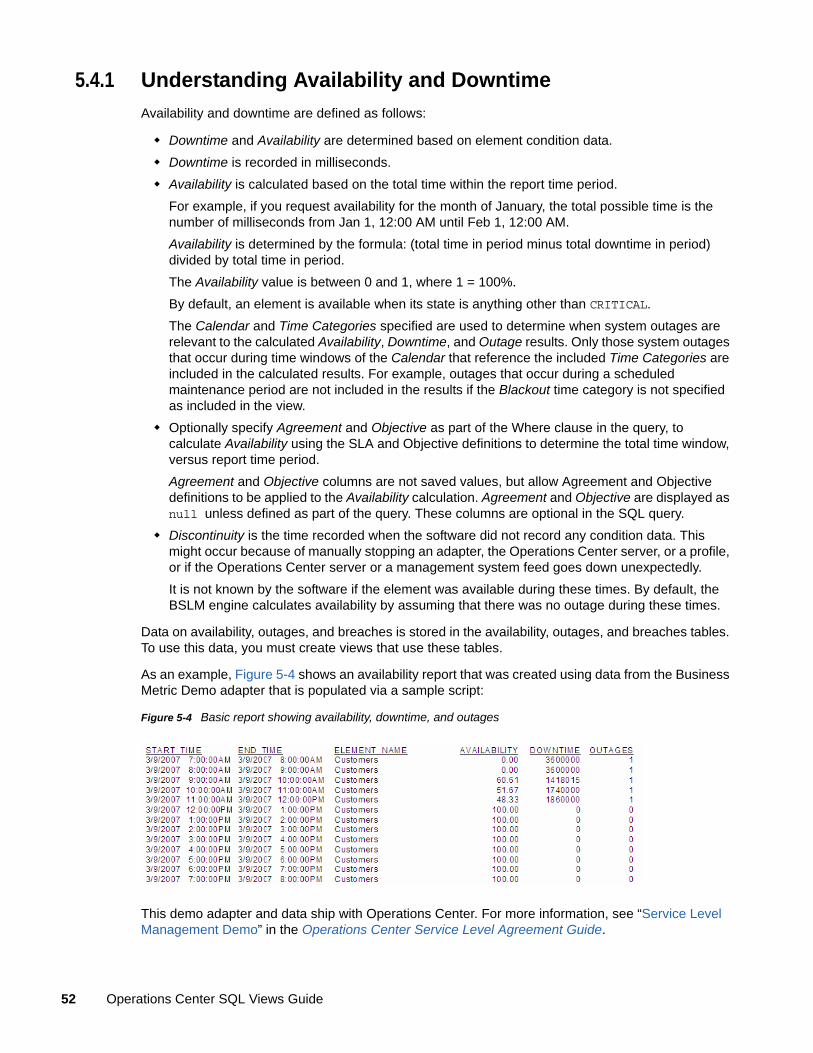
As an example, Figure 5-4 shows an availability report that was created using data from the Business Metric Demo adapter that is populated via a sample script:
Figure 5-4 Basic report showing availability, downtime, and outages
This demo adapter and data ship with Operations Center. For more information, see “Service Level Management Demo” in the Operations Center Service Level Agreement Guide.
52 Operations Center SQL Views Guide
5.4.2 Creating an Availability Report
To create an availability report with demo BSLM data:
1 Configure a service model for the data.
For the example, the service model is called Customers and contains one element called Customer2.
2 Create a new view called Availability.
3 Select Customer for Element.
4 Select Availability for Table.
5 Select a period for which you know there is data for the Report Time Period and a corresponding Report Interval.
6 Configure SQL Views, if you have not done so already.
For more information, see Section 2.1, “Prerequisites,” on page 9.
7 Extract the performance data into Microsoft Excel or Crystal Reports and create a report.
For more information, see Chapter 3, “Queries and Reports,” on page 17.
5.5 Service Catalog Changes ReportIf you use Operations Center as a service catalog, you can create a report that gives you changes in the catalog if you have configured version tracking. The version tracking functionality in Operations Center records all changes to an element. When the following change events occur, they are recorded as alarms:
Create, change, or remove an element
Add, change, or remove an attribute
Add, change, or remove a relationship
For more information about change events and version tracking, see the Operations Center Version Tracking Guide.
Your Operations Center server must be configured for version tracking in order to capture and report on change data.
You can use this data to create a report that shows all the changes to elements over a specific amount of time. This report gives you an indication of how your service catalog has changed over time. For an example of a report created with SQL Views, see the Operations Center Version Tracking Guide.
Example Reports 53

54 Operations Center SQL Views Guide


