OPERATIONS MANAGEMENT 1222 MRP FOR COMPLEX ASSEMBLY SYSTEMS UNDER ENVIRONMENTAL UNCERTAINTY 1223 Danilovic Milos, Ilic Oliver, Cvetic Biljana SPREADSHEET APPLICATION IN OPERATIONS MANAGEMENT EDUCATION 1231 ĐorĊević Lena, Antic Slobodan, Lecic-Cvetkovic Danica IMPROVEMENT OF PLANNING SYSTEM IN SUPPLY CHAINS AND SOFTWARE SUPPORT 1239 Omerbegović-Bijelović Jasmina, Atanasov Nikola, Rakićević Zoran AN OVERVIEW OF CAUSES FOR BULLWHIP EFFECT AND MODES OF DECREASING THEIR EFFECT 1249 Panić Biljana, Vujošević Mirko, Makajić-Nikolić Dragana MAINTENANCE MANAGEMENT MODELS - A COMPARATIVE ANALYSIS 1257 Popovic Jovana, Popovic Jelena, Paunović Viktorija NOVEL APPROACH TO BUSINESS PROCESS PERFORMANCE MEASUREMENT 1264 Simeunović Barbara, Radović Milić, Slovic Dragoslav BPM PRACTICE: EXPERIENCES FROM COMPARISON STUDY IN SERBIA 2012-2014 1272 Stojanović Dragana, Tomašević Ivan, Simeunović Barbara OPERATIONS MANAGEMENT RESEARCH: AN UPDATE FOR 21ST CENTURY 1280 Tomašević Ivan, Stojanović Dragana, Simeunović Barbara
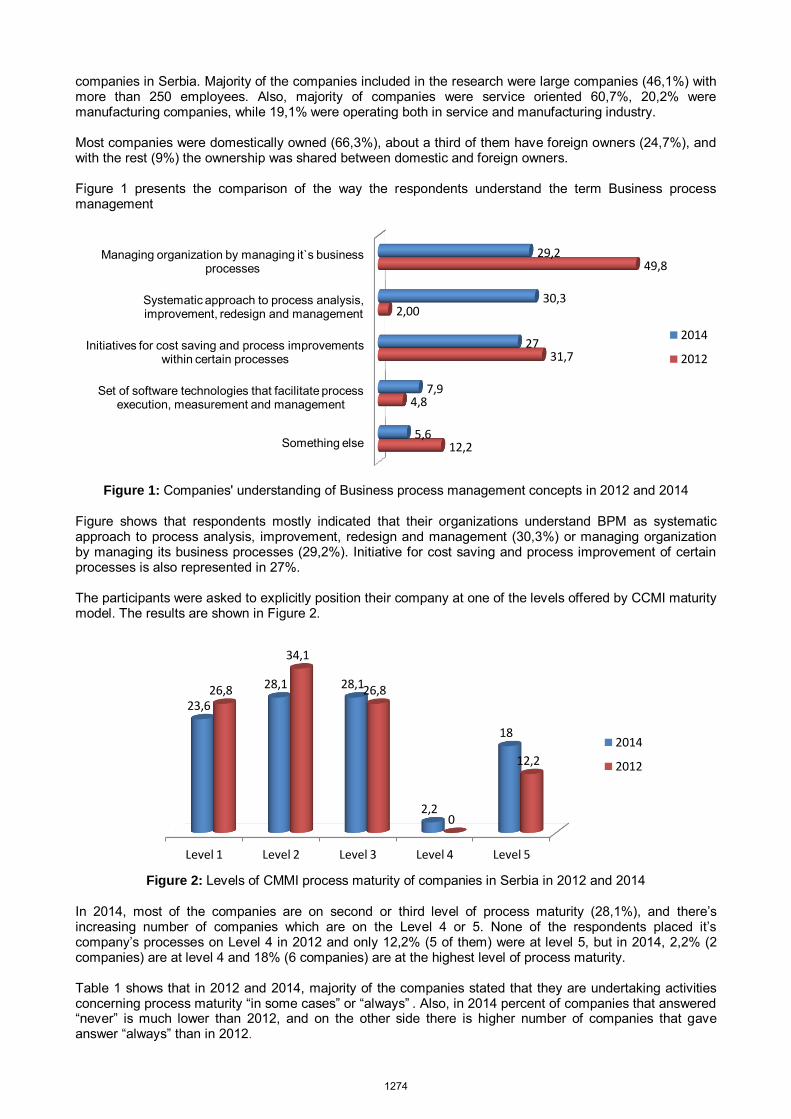
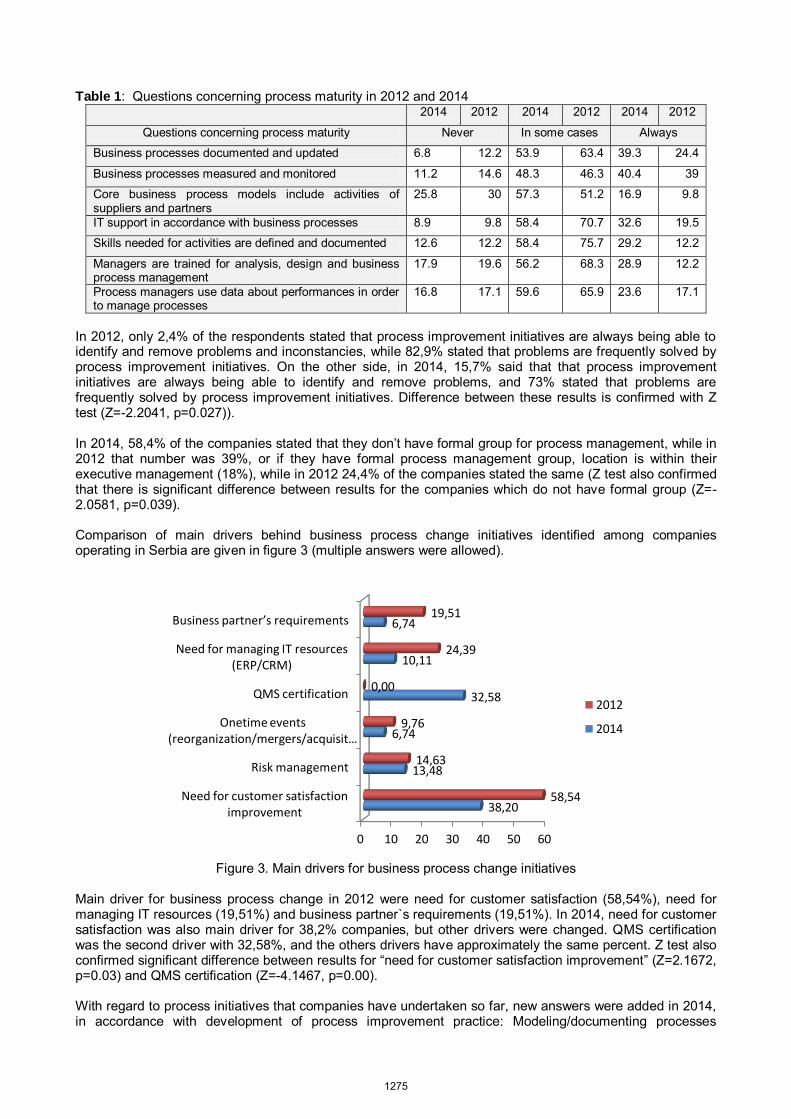
Transcript
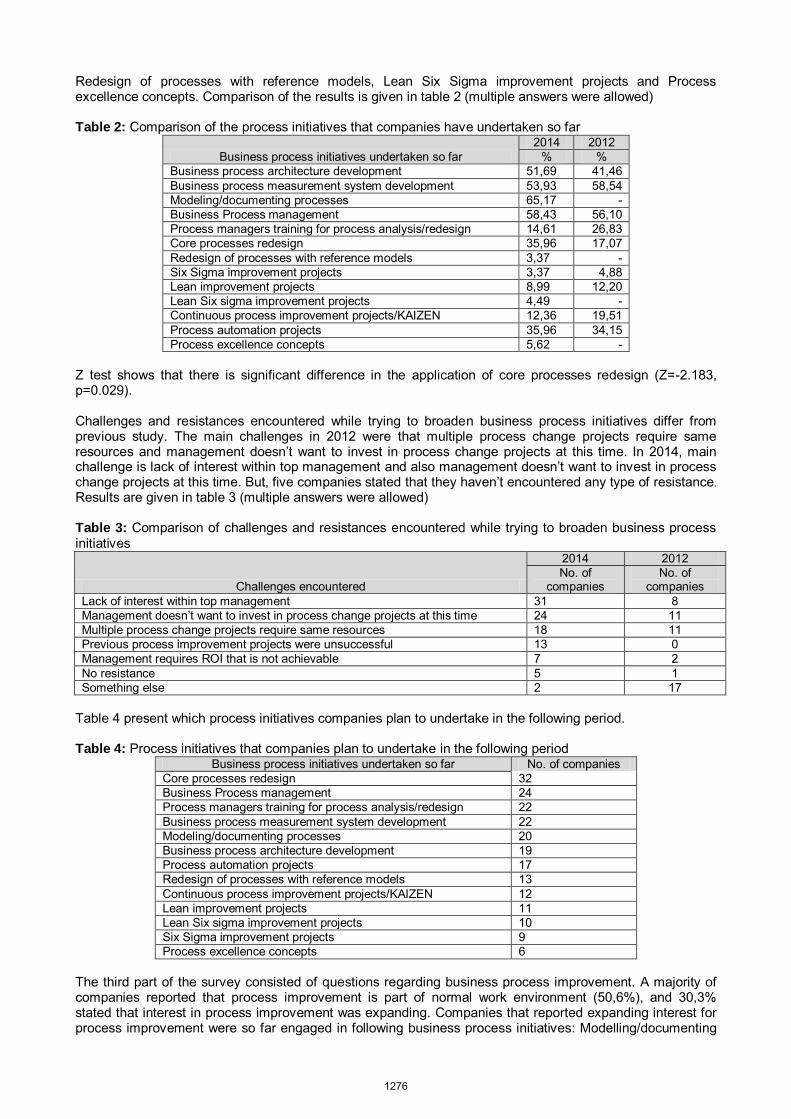
OPERATIONS MANAGEMENT 1222
MRP FOR COMPLEX ASSEMBLY SYSTEMS UNDER ENVIRONMENTAL UNCERTAINTY 1223
Danilovic Milos, Ilic Oliver, Cvetic Biljana
SPREADSHEET APPLICATION IN OPERATIONS MANAGEMENT EDUCATION 1231
Abstract: This paper presents basic settings of an original framework for optimizing the supply planning under environmental uncertainty in the assembly systems. A new dynamic inventory model with stochastic demand and stochastic lead times is formulated and incorporated within the framework. This notably strengthens the framework and makes it able to operate with real shortage costs of the final products within the optimization process and with more realistic assumptions about product demand. The use of the proposed framework is considered for single-level multi-product, multi-component assembly systems and, it is believed, that it can be generalized to a multi-level systems as well. The advantages of the proposed framework are confirmed through the experimental results, and the case in which multiple finished products share a common component bank is presented.
Keywords: shortage costs, backlogging, service level, component bank, BOM, dynamic programming
1. INTRODUCTION
Effective management of inventory levels under environmental uncertainty is a complex and essential problem in production and operations management. The selection of no adequate replenishment policy leads to expensive inventories or increased penalty costs. The commonly accepted approach for replenishment planning in major companies is the Material Requirements Planning (MRP) under environmental uncertainties (Louly et al., 2008). Uncertainty in demand and supply creates the need for the optimizations procedures and almost all of them can be formulated as a trade-off between overstocking and stock out while minimizing the total cost. The inventory management is especially important for assembly systems, because for them a lack or excess of a component leads to increased holding and shortage costs related to the corresponding final product and components that assemble that final product. Therefore, the inventory level of a component depends on the stock levels of other components. Stock out for a component stops the assembly process, and so the stocks of other components and the corresponding holding costs increase. In the available literature, there is a lack of works that can be effectively applied in practice in the cases of complex component’s and final product’s interdependencies in assembly systems. Traditional approaches should typically result in a large model that is difficult to solve and maintain. The assumptions made in known models tend to be restrictive for this kind of a problem, so the range of possible applications is significantly restricted. A serious drawback is that the obtained MRP is rather unrealistic, because it cannot take into account the real state of the production environment. Hence, the system cannot follow the large number of significant production events to make real-time decisions and it does not provide support to the manager to revise the unrealistic plans. The assumption that, without a doubt, produces useless solutions for considered applications is that the shortage cost for an assembly component is known in advance. In assembly systems, shortage costs are related to a finished product, but the objective in a significant number of optimization procedures is to minimize the sum of average backlogging and holding component costs. As the stock out for a component can increase the holding costs for other components, it is clear that the holding costs also depend of the distribution of missing components. NP-hard character of this problem makes finding the proper solution to this problem very difficult. This is the main reason why researchers circumvented this problem, either by introducing backorders or by assuming that shortage component costs are known. Another fact that further complicates the problem is that the demands for products are correlated in practice. This leads to a correlation between the demands for components, so incorporation of this into a model makes that model, due to its extreme complexity, practically unsolvable. However, as a holding cost, shortage cost and demand distribution are the three most important parameters on which optimization is performed, avoiding the real modeling leads to a completely useless solutions.
The paper deals with the management of inventory levels in a single-level multi-product, multi-component assembly system in a MRP environment under uncertainties. It presents basic settings of an original framework for optimizing the supply planning under environmental uncertainty in the complex assembly systems. A new dynamic inventory model with stochastic demand and stochastic lead times is formulated and incorporated within the framework. This contributes to determination of real costs and demand distributions in the considered environment. This is a significant improvement over the existing procedures, which, in real applications, due to the arbitrary and inaccurate defined input parameters, cannot give usable results, even for the simplest instances of the problem. The remainder of the paper is organized as follows. The next section presents related works. The problem formulation is given in Section 3. Section 4 presents the basic settings of proposed framework, while Section 5 presents a detailed approach for the incorporation of total costs, incurred due to the lack of components into a known simple model for MRP under environmental uncertainty. The comparison of the proposed approach with the best known procedure (Proth et al. (1997)) is given in Section 6. Concluding remarks and directions of future research are given at the end of the paper.
2. LITERATURE REVIEW
The problem of supply planning in assembly systems in which multiple finished products share a common component bank, in its original form, has been given limited attention in literature. The extreme complexity of this problem can be one of the reasons for the lack of related works. The only paper that considers the incorporation of real shortage costs into the optimization procedure is the paper by Proth et al. (1997). This paper proposes an approximate assessment of components based on the arrangement of the final products. The production-volume policy states that it will be good to assemble as many type-1 products as possible, then as many type-2 products as possible, etc. Other published mathematical models of component inventory control for assembly systems cannot be directly applied when multiple finished products share a common component bank. Best replacement for the unit backlogging cost was with introduction of the service level or special control policies, and this does not solve the problem in a significant number of applications. The clear conclusion can be derived according to Louly and Dolgui (2008): “the obtained models show that the increased number of component types increases the optimal value of planned lead time”. On the other side, the literature is rich in papers that consider optimization problems of MRP parameters, which is of great importance for the formulation of the problem. There are various approaches that optimize MRP parameters, like safety stocks, lot-sizing, planning horizons, planned lead times and other. Also, there are a number of exceptional works dealing with MRP parameterization under uncertainties and the comprehensive reviews of these models are given in Yeung et al. (1998), Dolgui et al. (2005) and Mula et al. (2006). It can be concluded that the analytical modeling approach was the most frequently encountered (Molinder (1997), de Kok and Visschers (1999), Yeung et al. (1999), Louly and Dolgui (2002), Gupta and Maranas (2003), Axsäter (2005, 2011), Arda and Hennet (2006), Dolgui and Prodhon (2007), Louly et al. (2008)). The dynamic programming models were mainly theoretical and they addressed only one type of uncertainty and assumed a simple structure of the problem. For problems with many different final products and more than one type of uncertainty, the analytical approach is replaced by procedures based on artificial intelligence (Hojati (2004), Samanta and Al-Araimi (2001), Petrovic (2001), Fox et al. (2000)) and simulation (Kadipasaoglu and Sridharan (1997), Xie et al. (2003)).
3. PROBLEM FORMULATION
Planning of multi-component supply for interrelated assembly systems with random lead times and random demands is impossible if the costs, which result from the lack of a certain amount of components, are not known. In defining the model on the basis of which the cost for an assembly system under environmental uncertainty is optimized, first task is to introduce variables that quantitatively determine the costs incurred if insufficient, or more than necessary components are available for assembling the finished product. In case of insufficient quantity, unified size is the shortage cost, while for the case where the amount is greater than the required, holding cost is considered. In inventory management, holding costs include rent for the required space, labor to operate the inventory, interest on money invested in the inventory, cost for damaged and lost goods and other direct expenses. All of these factors can be introduced, on the basis of historical data and business analysis, into the aggregate holding cost of a certain component. How well the aggregate value reflects the real situation so the results of the optimization based on the applied model are more or less usable.
1224
Cost, due to insufficient amounts of the components is, in the real world, far more complex than the holding cost. The shortage or penalty cost is the total of all costs per unit of not satisfying the order on its due date. It can be paid directly or it can be a chance of profit missed, which is called the opportunity cost. In assembly systems, first problem is that these costs are still tied for the finished product, but the optimization is always performed with regard to the components, because release of orders is always made for components, not for final products. In these systems, component shortages create additional cost in the form of holding cost for the other components which can’t be assembled to the finished product. An additional complexity is the possibility that the same components can be used to assemble various finished products having different penalty costs. Most papers in the literature introduce the assumption which not only narrow the range of practical application, but in general provide useless solutions. The most common approximation in these papers is defining these parameters as deterministic constants related directly to the component, without any feedback to the other parameters of the model. As the holding cost and the shortage cost are an integral part of each of models and represents basic values of any optimization, application of this simplified model in practice usually gives inapplicable results. On the other hand, if these variables are presented in the model by real interdependence with other variables, obtained models, because of its enormous size would be also inapplicable in practice.
Problem can be formulated as an optimal assessment of unfinished final products according to the specific lack of components in a single-level assembly line. Once, the optimal assessment is determined, shortage cost for that assessment is uniquely defined. A procedure for solving described problem can be applied in two ways in the further optimization processes: it can be incorporated into a procedure for optimizing release orders and it can be used as a separate tool for the optimal assessment of unfinished final products.
In this paper we consider a multi-period planning horizon T having n periods of a cyclic assembly system for multiple finished products sharing a common component bank. Let index i denote the type of the finished product, nii ,...,1 , where ni is the number of product types, index k denote the type of the component,
nkk ,...,1 , where nk is the number of component types and kiq , denote quantity of component k neededto assemble the finished product i. Thus we can define the BOM matrix Q,
nknini
nk
qq
qq
Q
,1,
,11,1
...
.....
.....
...
which uniquely represents a BOM of a considered assembly system.
Following notations are used to describe the proposed model (upper script j denotes the period): hk, the unit holding cost for component k; pi, penalty cost charged for each finished product i short; *
kp , penalty cost charged for each component k being short.
Lk , the lead time for component k; di, demand for the final product i;
jkdc , demand for component k in period j,
ni
iiki
jk dqdc
1, ;
ddPdf ji
ji )( , probability mass function giving the demand for period j for finished product i;
ddcPdfc jk
jk )( , probability mass function giving the demand for period j for component k;
jkx , j
kjk
jk dyx , random variable representing ending inventory for period j for component k;
ok , unit order cost for component k.
jky , available quantity of component k in period j;
),...,,...,(][ 1jnk
jk
jj xxxnk X , vector whose k-th element is jkx ;
1225
At the start of the j-th assembly cycle two decisions have to be made: how many type-i products to assemble in that cycle and how many components k to order in the same cycle. Ordering too many components results in excessive inventory costs and too few, in excessive costs related to product backlogging.
4. PROPOSED FRAMEWORK
The framework for optimizing the supply planning under environmental uncertainty in the assembly systems (SPF) enables incorporation of real costs into optimization procedures. SPF consists of four modules (Database, knowledge-based component - KBC, module OAMC and an arbitrary optimization procedure). In the Database, historical data about stochastic variables is stored. Also, dynamic data, produced in other modules is incorporated into database. The main task of KBC is to evaluate the probability distribution of stochastic variables and helps in optimizing the trade-off between the quality and efficiency of the optimization process. The module OAMC is used for optimal assessments of missing components.
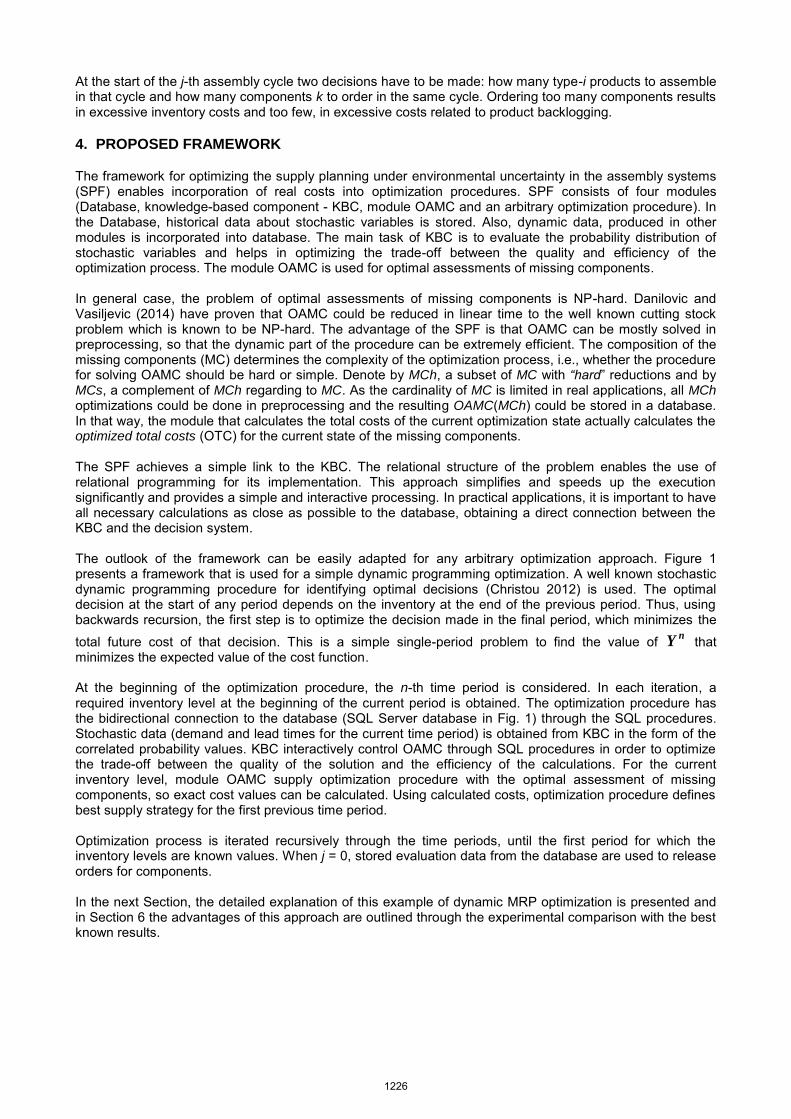
In general case, the problem of optimal assessments of missing components is NP-hard. Danilovic and Vasiljevic (2014) have proven that OAMC could be reduced in linear time to the well known cutting stock problem which is known to be NP-hard. The advantage of the SPF is that OAMC can be mostly solved in preprocessing, so that the dynamic part of the procedure can be extremely efficient. The composition of the missing components (MC) determines the complexity of the optimization process, i.e., whether the procedure for solving OAMC should be hard or simple. Denote by MCh, a subset of MC with “hard” reductions and by MCs, a complement of MCh regarding to MC. As the cardinality of MC is limited in real applications, all MCh optimizations could be done in preprocessing and the resulting OAMC(MCh) could be stored in a database. In that way, the module that calculates the total costs of the current optimization state actually calculates the optimized total costs (OTC) for the current state of the missing components. The SPF achieves a simple link to the KBC. The relational structure of the problem enables the use of relational programming for its implementation. This approach simplifies and speeds up the execution significantly and provides a simple and interactive processing. In practical applications, it is important to have all necessary calculations as close as possible to the database, obtaining a direct connection between the KBC and the decision system. The outlook of the framework can be easily adapted for any arbitrary optimization approach. Figure 1 presents a framework that is used for a simple dynamic programming optimization. A well known stochastic dynamic programming procedure for identifying optimal decisions (Christou 2012) is used. The optimal decision at the start of any period depends on the inventory at the end of the previous period. Thus, using backwards recursion, the first step is to optimize the decision made in the final period, which minimizes the
total future cost of that decision. This is a simple single-period problem to find the value of nY that minimizes the expected value of the cost function. At the beginning of the optimization procedure, the n-th time period is considered. In each iteration, a required inventory level at the beginning of the current period is obtained. The optimization procedure has the bidirectional connection to the database (SQL Server database in Fig. 1) through the SQL procedures. Stochastic data (demand and lead times for the current time period) is obtained from KBC in the form of the correlated probability values. KBC interactively control OAMC through SQL procedures in order to optimize the trade-off between the quality of the solution and the efficiency of the calculations. For the current inventory level, module OAMC supply optimization procedure with the optimal assessment of missing components, so exact cost values can be calculated. Using calculated costs, optimization procedure defines best supply strategy for the first previous time period. Optimization process is iterated recursively through the time periods, until the first period for which the inventory levels are known values. When j = 0, stored evaluation data from the database are used to release orders for components. In the next Section, the detailed explanation of this example of dynamic MRP optimization is presented and in Section 6 the advantages of this approach are outlined through the experimental comparison with the best known results.
1226
Figure 1: SPF for dynamic programming optimization
5. STOCHASTIC DYNAMIC MODEL
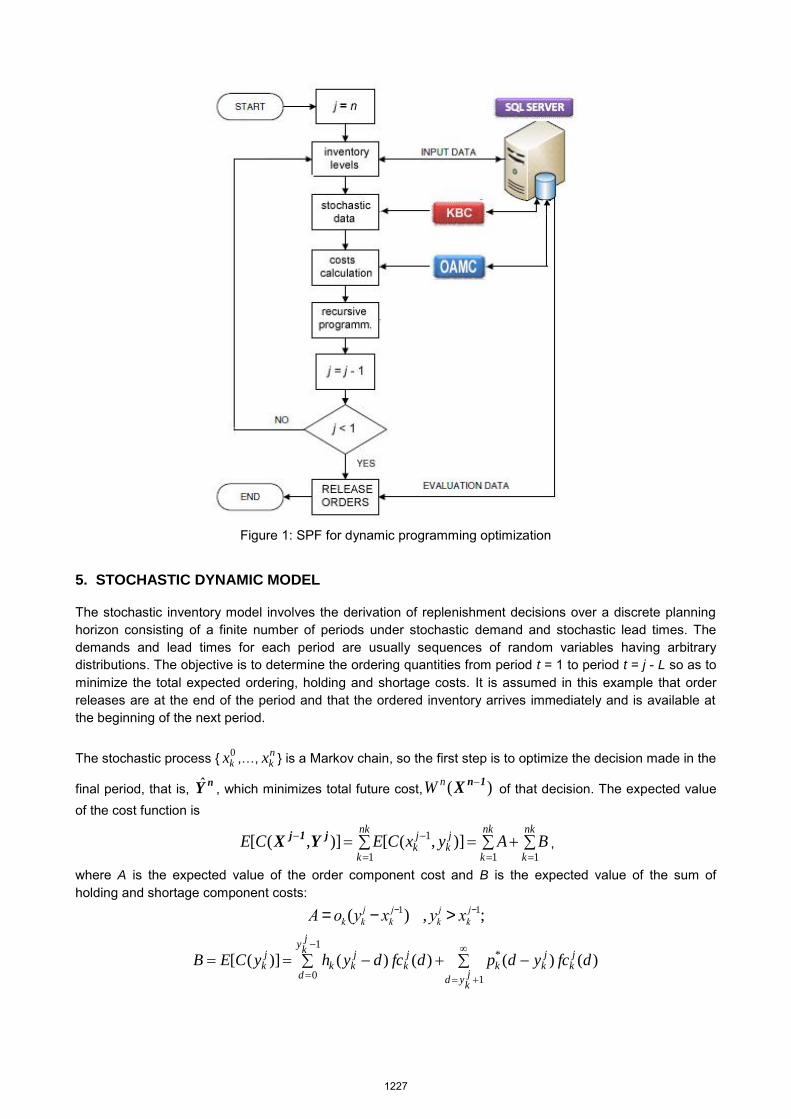
The stochastic inventory model involves the derivation of replenishment decisions over a discrete planning horizon consisting of a finite number of periods under stochastic demand and stochastic lead times. The demands and lead times for each period are usually sequences of random variables having arbitrary distributions. The objective is to determine the ordering quantities from period t = 1 to period t = j - L so as to minimize the total expected ordering, holding and shortage costs. It is assumed in this example that order releases are at the end of the period and that the ordered inventory arrives immediately and is available at the beginning of the next period.
The stochastic process { 0kx ,…, n
kx } is a Markov chain, so the first step is to optimize the decision made in the
final period, that is, nY , which minimizes total future cost, )( 1nX nW of that decision. The expected value of the cost function is
nk
k
nk
k
nk
k
jk
jk BAyxCECE
111
1 ]),([)],([ j1j YX ,
where A is the expected value of the order component cost and B is the expected value of the sum of holding and shortage component costs:
A = ok (ykj - xk
j-1) , ykj > xk
j-1;
1
*1
0
)()()()()]([jk
yd
jk
jkk
jk
y
d
jk
jkk
jk dfcydpdfcdyhyCEB
1227
The major critique of this approach lies in it’s inapplicability for the assembly systems where multiple finished
products share a common component bank due to incorrectly defined variables *kp and )(dfc j
k . The *kp is an
abstract value which doesn’t exists in the real environment. Only the value pi for the finished product is
known, and the estimation of *kp from pi is impossible. On the other hand, the value )(dfc j
k must be
calculated from expected demand of final products.
The following suggested approach more precisely defines this problem with the introduction of probability mass function of nk variables:
nkjnk
jjnk
jj ddcddcddcPdddfff ...),...,,( 221121 .
The use of ),...,,( 21 nkj dddff enables efficient and simple inclusion of real costs into the model. The list of
arguments ),...,,( 21 nkddd represents a specific sequence of component demand values. Therefore, KBC
sets, for the j-th period, a set of sequences rrr ,...,1,}{ jrσ , where rr is the cardinality of the set and j
rσ
denotes the r-th sequence from a set. Denote by jkdk )(j
rσ , the k-th element of the sequence jrσ .
Expected value of the cost function is then:
rr
r
jnk
k
rffOTCACE11
)(),()],([ jr
jj1j σYYX ,
noting that ),( jr
j σYOTC is the optimal total cost for the current component quantities, obtained from the
OAMC module. The data for )(rff j can be stored as a data table in the database, and can be dynamically updated by KBC.
Using dynamic programming, value for nY is obtained minimizing )],([ n1n YX CE , so the total future cost is:
)]),([min()( n1n1n YXX CEW n
. Now, dynamic programming recursive function can be applied:
)]),([)],([min()(1 1n1-n2n2n XYXX nn WECEW and the procedure can be proceeded until the first period, for which, the state of the inventory is a known value.
6. EXPERIMENTAL RESULTS
The aim of the experimental study is to outline the necessity for exact calculations of total costs for assembly systems, where final products share common component bank. In the literature, due to the complexity of the problem, no optimal assessments of missed components are considered. The only exception is the paper of Proth et al. (1997), which is an extended version of some previous works. Hereinafter their policy is denoted as PROTH. We will compare PROTH results with the results obtained with the proposed framework.
The PROTH policy introduces the sorting of product types in descending order according to their cost values,
nk
kkkii hqp
1, . Assembling of products is then performed according to this sorted list: we assemble as many
products which type is the first element in the list, then products which type is the second element in the list, etc.
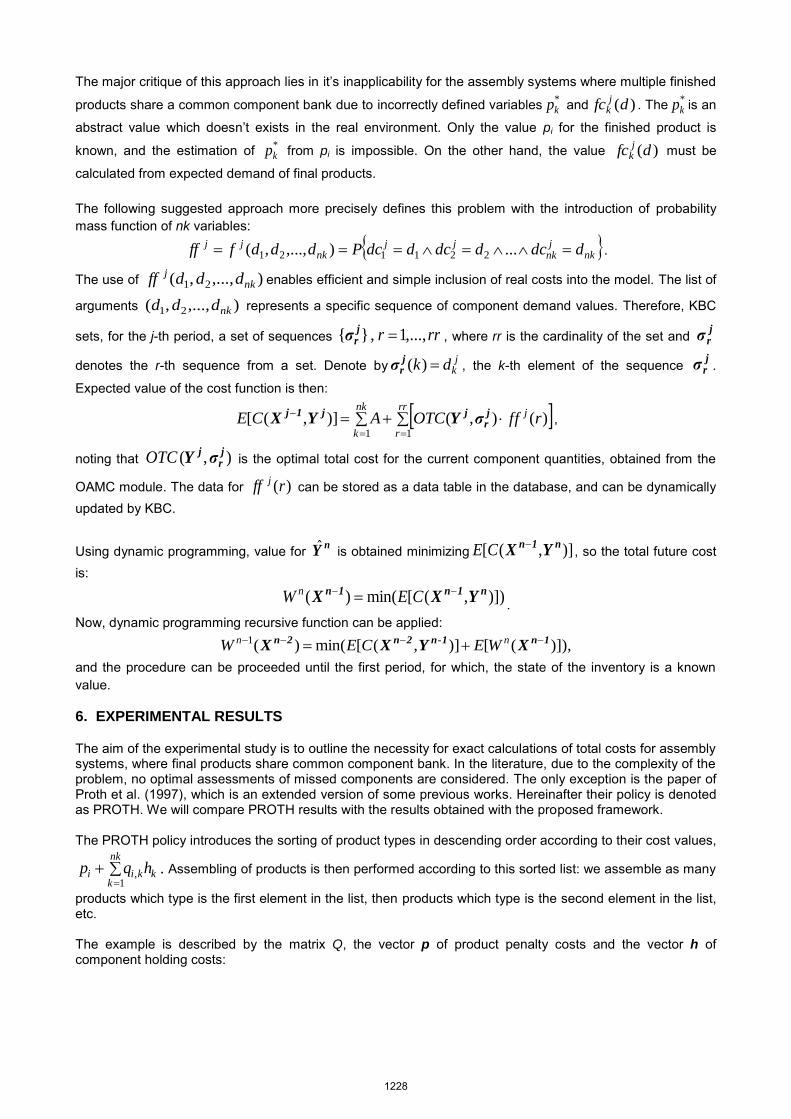
The example is described by the matrix Q, the vector p of product penalty costs and the vector h of component holding costs:
1228
245302000
002413000
000312000
000003213
Q
)2,5,3,5,2,3,1,3,2(h , p = (200,150, 200,150).
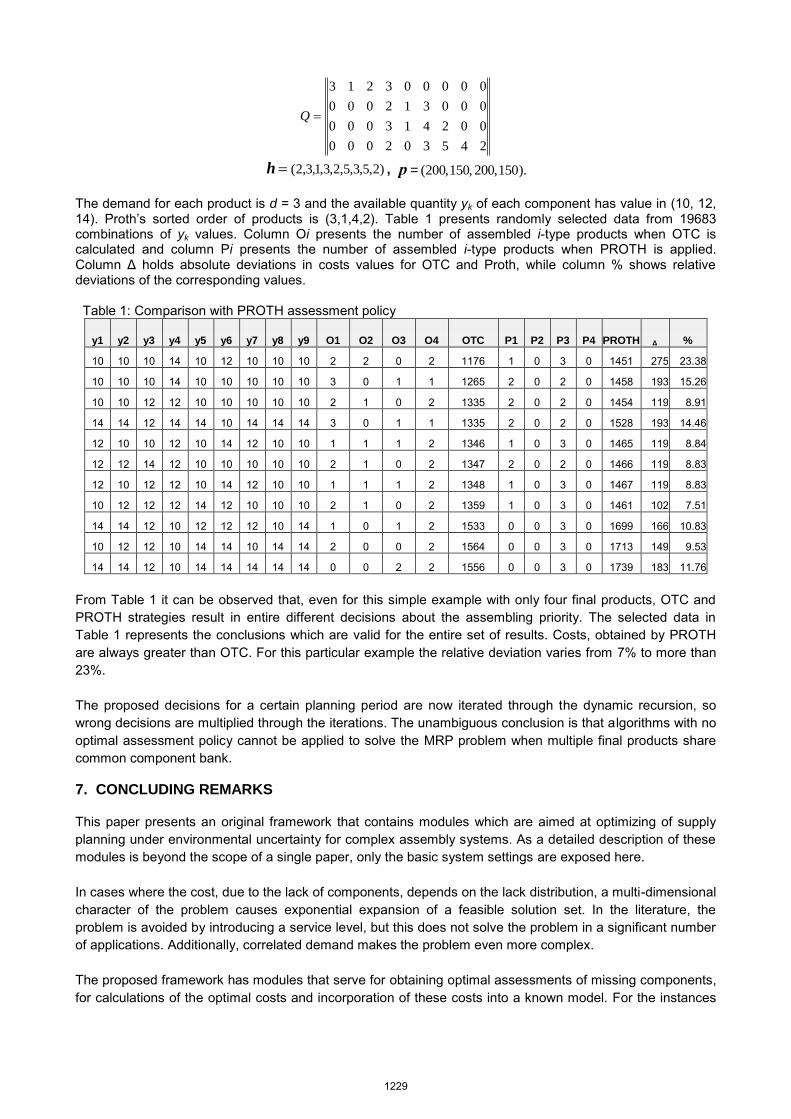
The demand for each product is d = 3 and the available quantity yk of each component has value in (10, 12, 14). Proth’s sorted order of products is (3,1,4,2). Table 1 presents randomly selected data from 19683 combinations of yk values. Column Oi presents the number of assembled i-type products when OTC is calculated and column Pi presents the number of assembled i-type products when PROTH is applied. Column Δ holds absolute deviations in costs values for OTC and Proth, while column % shows relative deviations of the corresponding values.
From Table 1 it can be observed that, even for this simple example with only four final products, OTC and PROTH strategies result in entire different decisions about the assembling priority. The selected data in Table 1 represents the conclusions which are valid for the entire set of results. Costs, obtained by PROTH are always greater than OTC. For this particular example the relative deviation varies from 7% to more than 23%.
The proposed decisions for a certain planning period are now iterated through the dynamic recursion, so wrong decisions are multiplied through the iterations. The unambiguous conclusion is that algorithms with no optimal assessment policy cannot be applied to solve the MRP problem when multiple final products share common component bank.
7. CONCLUDING REMARKS
This paper presents an original framework that contains modules which are aimed at optimizing of supply planning under environmental uncertainty for complex assembly systems. As a detailed description of these modules is beyond the scope of a single paper, only the basic system settings are exposed here.
In cases where the cost, due to the lack of components, depends on the lack distribution, a multi-dimensional character of the problem causes exponential expansion of a feasible solution set. In the literature, the problem is avoided by introducing a service level, but this does not solve the problem in a significant number of applications. Additionally, correlated demand makes the problem even more complex.
The proposed framework has modules that serve for obtaining optimal assessments of missing components, for calculations of the optimal costs and incorporation of these costs into a known model. For the instances
1229
having complex BOM structures, KBC and OAMC serve to reduce these structures to the level which is appropriate for the proposed procedures. The conclusion, which is common for all tested instances, is that it was always possible to reduce, even most complex BOM structures, to the structures that could efficiently be processed by the proposed procedures. The results, obtained on reduced networks, accurately reflected the real input variables of the problem. Experimental results at the end of this paper confirm the significant advantage of our proposed framework in comparison with the policy presented in Proth et al. (1997).
Limitations of the proposed approach are related to the depth of a corresponding network reduction, so future work on this problem has two possible directions: first, development of new modules for network reduction which would increase the number of instances that can be efficiently processed; next, determination of the most suitable stochastic procedures to treat multidimensional input variables.
REFERENCES Arda, Y. and Hennet, J. C. (2006). Inventory control in a multi-supplier system. Int. J. Prod. Econ., 104(2),
249–259. Axsäter, S. (2005). Planning order release for an assembly system with random operations times. OR
Spectrum, 27, 459–470. Axsäter, S. (2011). Inventory Control when the Lead-time Changes. Prod. Oper. Man., 20(1), 72–80. Banda, M. G. and Stuckey P. J. (2007). Dynamic Programming to Minimize the Maximum Number of Open
Stacks. INFORMS J. Com., 19(4), 607-617. Christou, I. T. (2012). Quantitative Methods in Supply Management; Models and Algorithms. Springer
London, isbn 978-0-85729-765-5. Danilovic, M. and Vasiljevic, D. (2014). A Novel Relational Approach for Assembly System Supply Planning
Under Environmental Uncertainty. Int. J. Prod. Res., doi: 10.1080/00207543.2014.916429. de Kok, T. G. and Visschers, J. W. C. H. (1999). Analysis of assembly systems with service level constraints.
Int. J. Prod. Econ., 59, 313–326. Dolgui, A., Louly, M.-A. and Prodhon, C. (2005). A survey on supply planning under uncertainties in MRP
environments. In Selected Plenaries, Milestones and Surveys. 16th IFAC World Congress, edited by P. Horacek, M. Simandl and P. Zitek. Prague, Czech Republic.
Dolgui, A. and Prodhon, C. (2007). Supply planning under uncertainties in MRP environments: A state of the art. Annual Reviews in Control, 31(2), 269–279.
Fox, M.S., Barbuceanu, M. and Teigen, R. (2000). Agent-oriented supply chain management. Int. J. Flex. Man. Sys., 12, 165–188.
Gupta, A. and Maranas, C.D. (2003). Managing demand uncertainty in supply chain planning. Comp. Chem. Eng., 27, 1216–1227.
Hojati, M. (2004). Bridging the gap between probabilistic and fuzzy-parameter EOQ models. Int. J. Prod. Econ., 91, 215–221.
Kadipasaoglu, S.N. and Sridharan, V. (1997). Measurement of instability in multi-level MRP systems. Int. J. Prod. Res., 35, 713–737.
Louly, M. A. and Dolgui, A. (2002). Newsboy model for supply planning of assembly systems. Int. J. Prod. Res., 40, 4401–4414.
Louly, M. A., Dolgui, A. and Hnaien, F. (2008). Optimal supply planning in MRP environments for assembly systems with random component procurement times. Int. J. Prod. Res., 46(19), 5441–5467.
Molinder, A. (1997). Joint optimisation of lot-sizes, safety stocks and safety lead times in an MRP system. Int. J. Prod. Res., 35, 983–994.
Mula, J., Poler, R., Garcıa-Sabater, J. P. and Lario, F. C. (2006). Models for production planning under uncertainty: A review. Int. J. Prod. Econ., 103, 271–285.
Petrovic, D. (2001). Simulation of supply chain behaviour and performance in an uncertain environment. Int. J. Prod. Econ., 71, 429–438.
Proth, J.M., Mauroy, G., Wardi, Y., Chu, C. (1997). Supply management for cost minimization in assembly systems with random component yield times., J. Intell Manuf., 8, 385–403.
Samanta, B., Al-Araimi, S.A. (2001). An inventory control model using fuzzy logic. Int. J. Prod. Econ., 73, 217–226.
Xie, J., Zhao, X. and Lee, T.S. (2003). Freezing the master production schedule under single resource constraint and demand uncertainty. Int. J. Prod. Econ., 83, 65–84.
Yeung, J. H. Y., Wong, W. C. K. and Ma, L. (1998). Parameters affecting the effectiveness of MRP systems: A review. Int. J. Prod. Res., 36, 313–331.
Yeung, J. H. Y., Wong, W. C. K., Ma, L. and Law, J. S. (1999). MPS with multiple freeze fences in multi-product multi-level MRP systems. Int. J. Prod. Res., 37, 2977–2996.
1230
SPREADSHEET APPLICATION IN OPERATIONS MANAGEMENT EDUCATION
Lena Đorđević1, Slobodan Antić2 , Danica Lečić-Cvetković3
1 Faculty of Organizational Sciences, University of Belgrade, [email protected] 2 Faculty of Organizational Sciences, University of Belgrade, [email protected]
3 Faculty of Organizational Sciences, University of Belgrade, [email protected]
Abstract: This paper describes good practice of spreadsheet application in education. It enables operations management (OM) students to learn the logic behind software packages, to gain experience using a spreadsheet to model and solve real problems, to have a more clear view of the dynamics of business systems. We present modelling of operations management problems as discrete controlled object in spreadsheets. This concept allows clear separation between a discrete object (a low of behaviour and the control domain), a performance criterion, and a method used to find an optimal solution. Also, paper includes forecastig methods, developed in spreadsheets, as part of OM education. Benefit of approach, described in the paper, is in the easier understanding and solving of operations management problems for students. Approach is applied and tested in the education of operations managers at Faculty of Organizational Sciences, University of Belgrade. Primary purpose of paper is contribution to the development of spreadsheet models and spreadsheet applications in operations management education.
In today business world, that is very competitive, spreadsheets play an important role as a business modelling, analysis, and decision support tool. Undergraduates from business, accountancy, information systems, economics, and social sciences schools, that doing internships in all business functional areas consider that Excel skills are invaluable and that corporate recruiters demand spreadsheet skills when hiring fresh graduates, as it is stated in Leong and Cheong (2008). It is therefore meaningful to examine how well spreadsheets are incorporated into management and engineering education and in what ways it can be improved. Most undergraduate programs on universities teach foundational courses in statistics, calculus, and computer programming. Their main purpose is to equip undergraduates with the ability to analyze and solve problems. Many students find learning such technical material dry and demanding and usually do not continue to apply those skills meaningfully beyond university course work. In order to facilitate acquiring of analytical skills for students, more professors that teaching these courses, and also teaching management science, have embraced spreadsheets as their primary computing and teaching tool, as it is stated in Liberatore and Nydick (1999),Winston (1996) and Winston (2004). . Research on spreadsheets in engineering education in the last few decades has placed great challenges on educators and other stakeholders to apply this computational tool both theoretically and practically towards improving the teaching process. These challenges have forced institutions of higher education to adapt spreadsheets for instructional purposes, with its enhancement tools as a means to improve the quality of engineering education, as it can be seen in Oke (2004). The need for high quality, learning-centred education has therefore made the application of spreadsheets important.
Spreadsheets are in accordance with active learning. Active learning allows students to discuss about problems, supports teamwork and problem solving activities. As it is described in Prince (2004) active learning is widely accepted as a far more effective mode of instruction than lecture alone.
This paper analyses spreadsheet models and application in education of operations managers. We organize paper as follows. In the introduction and second chapter, we briefly explained the need for spreadsheet application in education. Specifically, we base our review on operations management (OM) education. Chapter three describes concept of modelling business dynamics in spreadsheet as discrete controlled object. This chapter presents a low of behaviour, the control domain, a performance criterion, and a method used to find an optimal solution of operations management problems, modelled as discrete controlled object
1231
in spreadsheets. Section four is dedicated to forecasting in a spreadsheet, as another example of learning the logic of operations management problems. Finally, we made general remarks and present future directions.
2. THE APPLICATION OF SPREADSHEETS IN OM EDUCATION
In the field of education, spreadsheets can be utilized in many different ways. Spreadsheets reduce the need for tedious calculations allowing greater attention to be focused on the subject itself. This feature of spreadsheets can be used in many disciplines across the curriculum. The distinction should be made between "content of the curriculum" which includes terms, facts, symbols, formulas, principles etc. and "process skills" which cover observing, measuring, inferring, communicating and experimenting. On the basis of this distinction, students should be given the opportunity to design and develop their own templates in each content area, and also to use the devices to solve problems and make decisions on the basis of quantified evidence. Spreadsheets are very useful for achievement of these objectives, since they are capable of solving different problems involving numbers or formulas, and are especially powerful if data are used repetitively and changing over time. Using spreadsheet software in operations management courses can add relevance by enabling students to work on problems and data sets that are larger than textbook examples and similar in size to those they encounter in the real world, as it is presented in Gardner (2008). Having students build their own operations management software in a spreadsheet, takes students beyond the learning experience of using special purpose software by enabling them:
to learn the logic behind software packages, to gain experience using a spreadsheet to solve real problems, to have a more transparent view of business systems dynamics, and to learn to organize and manage their work.
Lecturer can focus on the process logic, organizing the spreadsheet according to the logic while demonstrating the dynamics of business systems and processes, rather than teach spreadsheet mechanics. Spreadsheet projects are particularly good tools to use with hands-on learners and the charting capabilities make them effective with visual learners. 3. BUSINESS DYNAMICS IN SPREADSHEETS Spreadsheet simulation is very appropriate for business dynamics understanding and modelling. One of convenient approaches for representing model of real operation management problems in spreadsheets is provided by discrete controlled object concept. This concept allows clear separation between a discrete object (a low of behaviour and the control domain), a performance criterion, and a method used to find an optimal solution. Spreadsheet structure, consisted of rows and columns, is appropriate for presenting different value of variables in time periods, as it is described in Kostic (2001). For example, dynamic discrete EOQ problem to find optimal number of replenishments in the fixed-order quantity system as a basic problem of optimal control can be modelled as discrete controlled object in spreadsheets, as it is showed in Kostic (2009). The decision environment is deterministic and the time horizon is finite. A discrete system consists of the law of dynamics, control domain and performance criterion. It is primarily a simulation model of business dynamics, but the performance criterion enables various order strategies to be compared. Model of discrete system control is both a simulation model of business dynamics and an optimization model which can give optimal control according to the defined performance criterion. This approach is appropriate for modelling and solving various types of operations management problems as:
Minimizing costs of raw materials procurement; Production costs minimization; Route optimization; Production dynamics optimization; Business management financial aspects; Investment funds allocation; Transport cost minimization, etc.
The process that we follow in order to make students understand business dynamics and build their own model of discrete controlled object in a spreadsheet is:
1. Problem presenting and verbal description; 2. Problem analyzing:
a. Time horizon and time intervals defining; b. System flows identification (actions and accumulations); c. Factors of influence identification (circumstances and control);
1232
d. Flow regulator relations development;e. Control domain constraints:
flow non negativity constraints; available capacity constraints; storage space constraints; other constraints;
f. Performance criterion formulation;g. Combined flows block diagram;
3. Optimal control problem:a. Transformation to basic problem form;b. Discrete object optimal control problem defining;
4. Spreadsheet simulation:a. Transformation of mathematical relations to spreadsheet formulas and functions;b. Tables, menus, reports and graphs organization;c. One admissible solution determination;d. Better solution determination;
Students repeat described process for every new problem that is presented on the lectures. At the beginning of each class professor presents the underlying logic of problem for practice, using one or more examples in a lecture. Each student constructs spreadsheet model or application in a computer lab under the supervision of the instructor who may do a step-by-step demonstration. Over the course of the semester, as students gain experience with spreadsheet models, the detail level of instructions diminishes. This forces students to rely more and more on what they have learned from previous problems. At the end of course students have to model and solve assigned problems by themselves, with little or no help from the instructor because the goal is to teach students to work independently.
In the following of paper we will present simple example of transportation costs minimization problem, translated to discrete controlled object problem developed in spreadsheet, Kostić (2012). Problem is presented in order to describe learning process, which is created for better understanding and modeling of system dynamics.
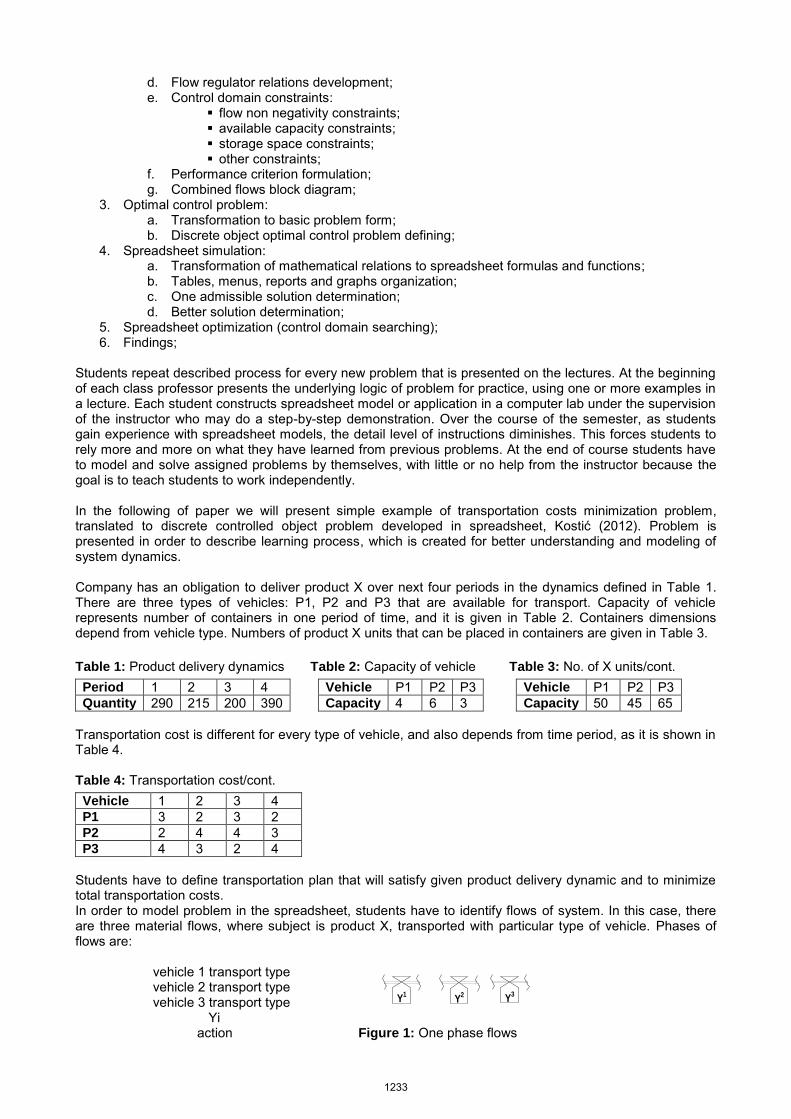
Company has an obligation to deliver product X over next four periods in the dynamics defined in Table 1. There are three types of vehicles: P1, P2 and P3 that are available for transport. Capacity of vehicle represents number of containers in one period of time, and it is given in Table 2. Containers dimensions depend from vehicle type. Numbers of product X units that can be placed in containers are given in Table 3.
Students have to define transportation plan that will satisfy given product delivery dynamic and to minimize total transportation costs. In order to model problem in the spreadsheet, students have to identify flows of system. In this case, there are three material flows, where subject is product X, transported with particular type of vehicle. Phases of flows are:
vehicle 1 transport type vehicle 2 transport type vehicle 3 transport type
Yi action Figure 1: One phase flows
Y3
Y1
Y2
1233
Phases of flow can be presented as it is shown in Figure 1, where i
tY represents transport of product X with transport vehicle i (i=1,2,3) in time period t. Next step is influence factors identification. Influence factors are recognized in verbal description of problem.
1
tp - product X transport dynamics 1i
tp - available containers for transportation vehicle i (i=1,2,3) 4i
tp - container i capacity (i=1,2,3) 7i
tp - transportation cost for container i (i=1,2,3) i
tu - quantity of product X transported with vehicle i (i=1,2,3) After problem flows and influence factors identification, students are familiar with problem. Now, they can start with mathematical modeling. In described problem, flow regulators equation development considers that for all vehicles transport is discrete, with stages on the beginning of time periods. Total of all previous delays of function rebound, when discrete quantity is created, is equal zero. Because of that, delay factors Ki (i=1,2,3) are also zero, and whole discrete quantity of flow c i = ui (i=1,2,3) is realized in the same time period as its realization started.
4,3,2,1;3,2,1, tiuY i
t
i
t (1)
Relations for constraints of available containers capacity, that has to be engaged for transport of ui product X units, are following:
i
ti
t
i
ti
tp
uINTS ][
4 (2)
4,3,2,1;3,2,1,
0][0
0][1
44
44
ti
p
uINT
p
uza
p
uINT
p
uza
i
t
i
t
i
t
i
t
i
t
i
t
i
t
i
t
i
t (3)
That number can’t be greater than number of available containers for transport vehicle i.
4,3,2,1;3,2,11
tii
t
i
t pS Realization of transportation plan, which will satisfy given product delivery dynamic, has to be included in control space relations.
4,3,2,1,3
1
1t
i
i
tt up (4)
Goal function represents minimization of total transportation costs.
4
1
3
1
7}min{t i
i
t
i
t pSJ (5)
Now, discrete control object is defined through the low of behavior
4,3,2,1;3,2,1, tiuY i
t
i
t (6)
and control domain
1234
4,3,2,1;3,2,1,0
0
3
1
1
1
ti
i
i
tt
i
t
i
t
up
Sp
(7)
where
4,3,2,1;3,2,1,
0][0
0][1
44
44
ti
p
uINT
p
uza
p
uINT
p
uza
i
t
i
t
i
t
i
t
i
t
i
t
i
t
i
t
i
t
(8)
i
ti
t
i
ti
tp
uINTS ][
4
Initial state is known 00
iX (i=1,2,3). For defined object, admissible control should be chosen in accordance with circumstances dynamic ps
t(s=1,2,...,10; t=1,2,3,4) for time periods T=4, in the way that will guide discrete object from known initial state
iX 0 to the set of final phase states 44 MX i . For every t=1,2,3,4 control space constrains have to be
satisfied and goal function J has to be minimized.
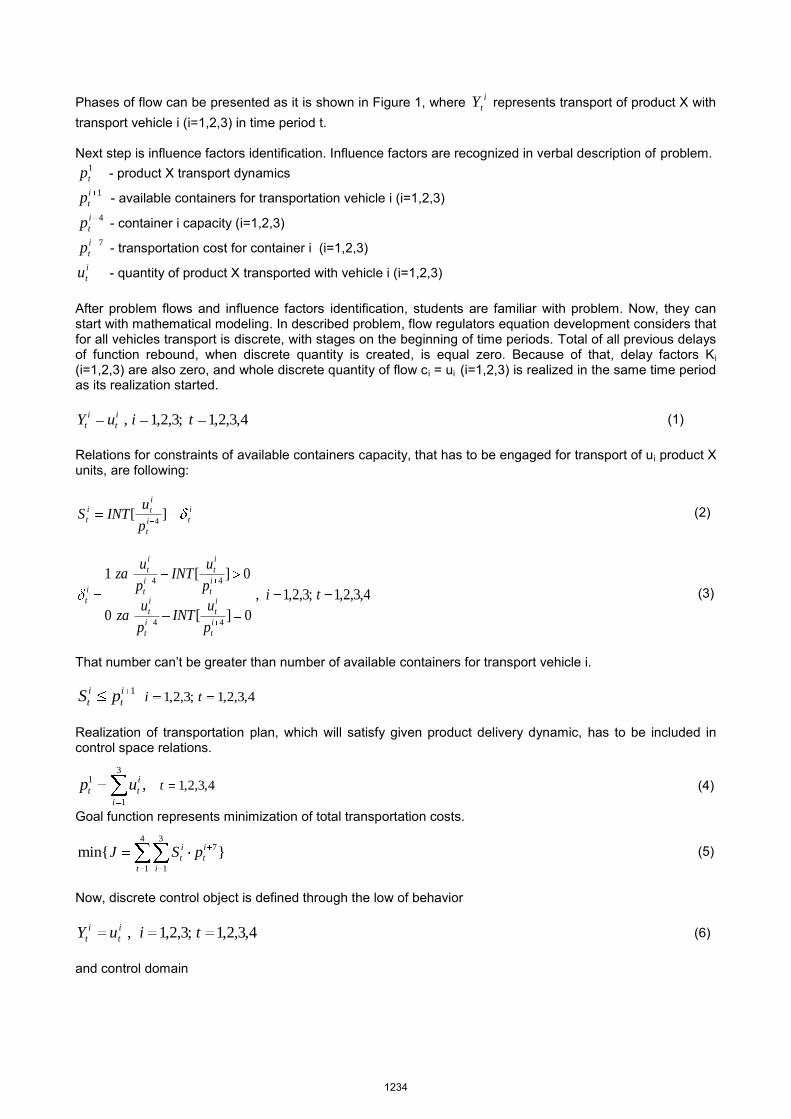
When mathematical model is created, students translate relations to spreadsheet model. Tables in worksheet are arranged in defined areas, for example:
values for circumstances variables p are arranged in area D11:G20 formulas for auxiliary variables δ are arranged in area D24:G26 formulas for auxiliary variables S are arranged in area D30:G32 control variables should be written in area D36:G38 formulas for control space O are arranged in area D42:G46 formulas for goal function are arranged in area D50:G50
Simulation model in spreadsheet is obtained when mathematical relations for discrete control object are translated in appropriate spreadsheet formulas and functions. Next paragraph presents spreadsheet formulas for time period t=1, in column D. These formulas should be copied in next three columns.
AUXILIARY VARIABLES δ D24 =IF(D36/D15-TRUNC(D36/D15)>0;1;0) D25 =IF(D37/D16-TRUNC(D37/D16)>0;1;0) D26 =IF(D38/D17-TRUNC(D38/D17)>0;1;0) AUXILIARY VARIABLES S D30 =TRUNC(D36/D15)+D24 D31 =TRUNC(D37/D16)+D25 D32 =TRUNC(D38/D17)+D26 CONTROL SPACE O D42 =D11-SUM(D36:D38) D43 =SUM(D36:D38)-D11 D44 =D12-D30 D45 =D13-D31 D46 =D14-D32 GOAL FUNCTION J D50 =C50+D30*D18+D31*D19+D32*D20
1235
Figure 2: Spreadsheet model of the problem
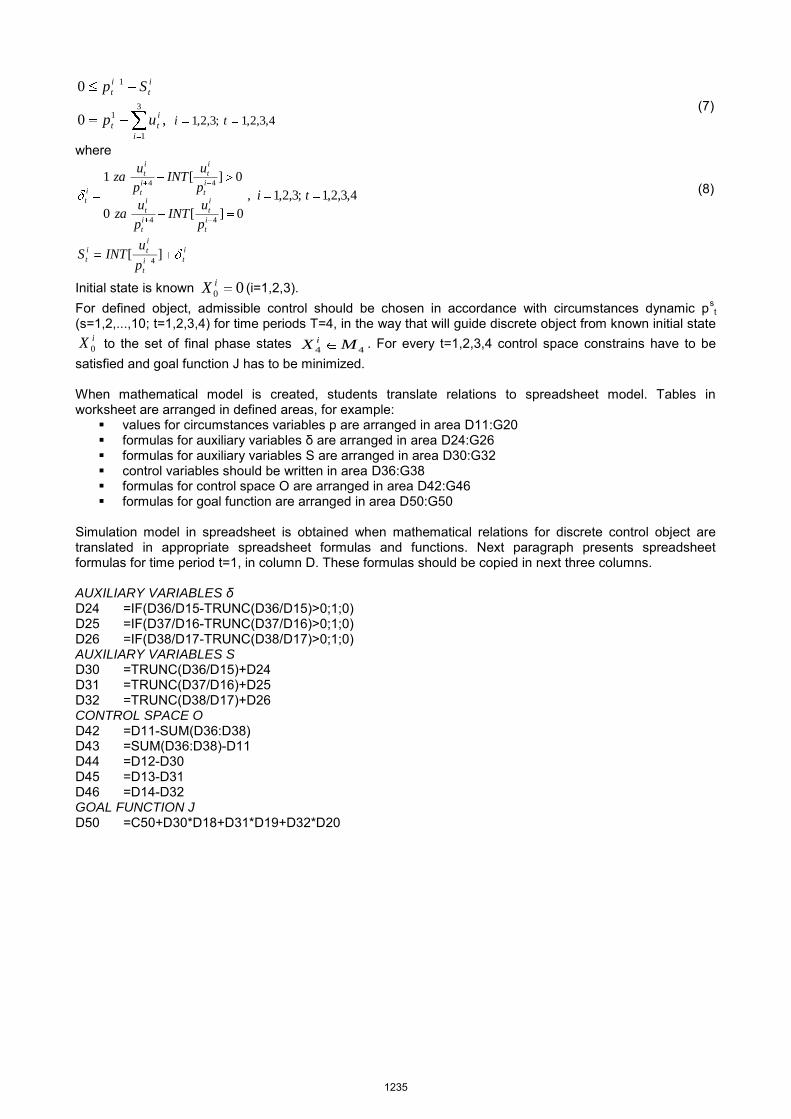
Careful selection of control variables values leads to admissible solution. Admissible solution provides non negativity of control space, arranged in area D42:G46. Negative values in control space are guide for admissible solution finding. Better solution is one that gives smaller value to goal function. When all described steps are realized, spreadsheet model for transportation costs minimization problem translated in discrete control object problem is created. This model is presented in the Figure 2. 4. FORECASTING IN SPREADSHEETS Forecasting is another topic where students need to understand the underlying technique, but where textbook examples, that are small enough for hand computation, are too small to be realistic. As it is demonstrated in Gardner (2008) spreadsheets allow students: to understand mathematical concepts and techniques by enabling them to see the computation,
without having to do the computation and get lost in the mechanics, to see the effects of changing parameters for various forecasting models, to learn to adapt forecasting models to special situations, to see the effects of data issues on forecasts, to use critical thinking skills to evaluate forecasting models, and to learn to organize their work.
Charting capabilities enhance the effectiveness of spreadsheets as a learning tool by providing visual images that enable students to observe the properties and limitations of the various forecasting techniques. This works particularly well for students who are visual learners. Moving averages and exponential smoothing concepts (Holt and Winters forecasting methods) are much easier for understanding through copying formulas down a column in a spreadsheet, using data generated in the previous row. Data and formulas for the Holt forecasting procedure in spreadsheet are presented in the Figure 3.
1236
Figure 3: The Holt forecasting procedure in spreadsheet
As it is presented in the Figure 3, students enter formulas for the first period and known initial values, and then copy them. For example, formulas needed to be entered in presented model are following:
LEVEL Lt D3 =$I$2*C3+(1-$I$2)*(D2+E2) TREND Tt E3 =$I$3*(D3-D2)+(1-$I$3)*E2 FORECAST FOR ONE FUTURE PERIOD F3 =D2+E2 FORECAST FOR n FUTURE PERIODS F9 =$C$8+(A9-$A$8)*$E$8 MEAN SQUARED ERROR
G3 =(C3-F3)^2
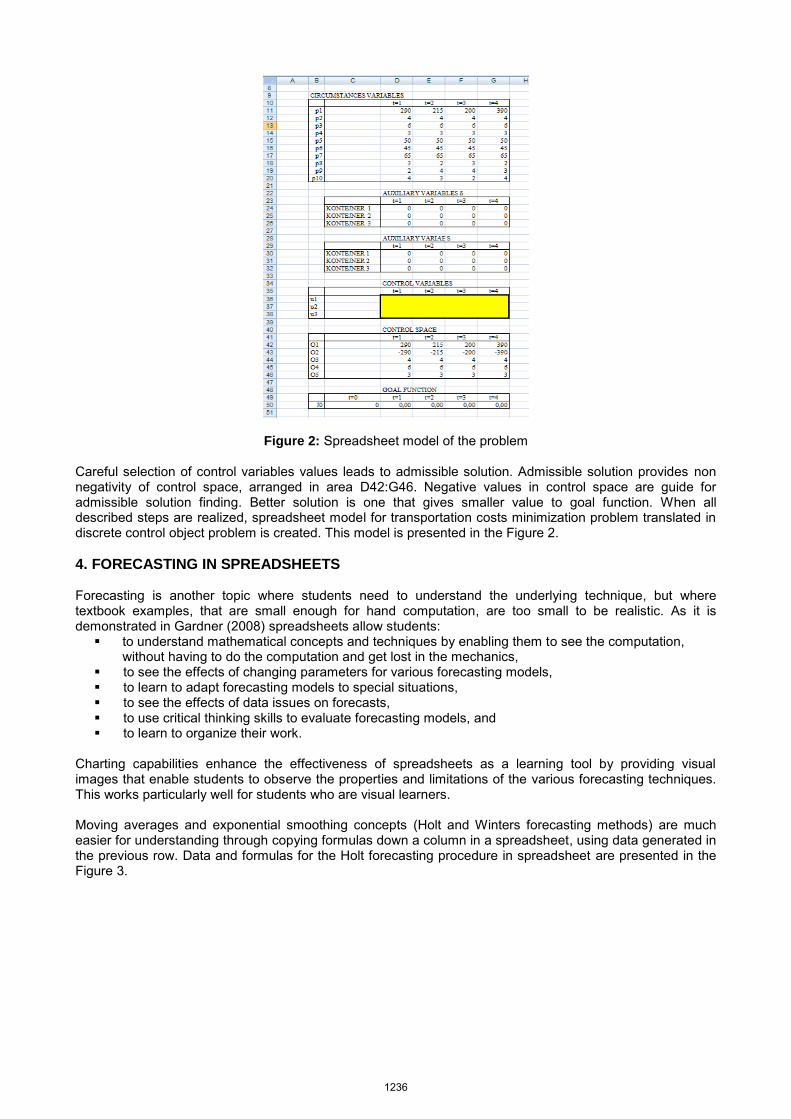
The effect of changing parameters can be taught very effectively with a spreadsheet. In the case of exponential smoothing, smoothing constants can be maintained in cells that are referenced from the formulas so the constants can be easily changed and the formulas and charts updated automatically. By constructing the spreadsheet to accommodate multiple forecasts, the lagging and smoothing effects of different smoothing constants can be illustrated in a chart as in the Figure 4. This again allows the student to mentally connect the concepts of the parameter, the formula, and the visual image of the chart.
Figure 4: Comparison of Exponential Smoothing Parameters
5. CONCLUSION
Approach described in this paper is applied and tested in the education of operations managers at Faculty of Organizational Sciences, University of Belgrade, Serbia. This approach is used in education process, for students of the third and fourth year of undergraduate studies. As a result of this curriculum implementation in the classroom, we came to the conclusions that are given in the further of paper.
1237
The final benefit of learning through spreadsheet approach is that students must learn to recognize problems in real world, describe noticed problems, translate them to mathematical and spreadsheet model, and try to find some satisfactory solution. Whole process teaches students to plan, organize, and assure quality in their work. In this way, students overcome usual fact that forecasting packages, ERP systems and other software packages appear to be black boxes that take data inputs and spit out answers without giving them any insight into the solution process. Students are learned to understand how the process behind the software works, to understand limitations and to recognize when data are missing or inappropriate for the application. Also, as employees, they are capable to model problem or create application by their own. Most textbooks have spreadsheet models to accompany them, but that is not the case when some of the real projects should be implemented. Some texts, such as Barlow (2005) are actually spreadsheet-based. As it is proven in Gardner (2008), having students build their own operations management software in a spreadsheet enables improves and learning by allowing the instructor to tailor the software and the instructions for developing it:
to the students’ level of knowledge and ability, to any textbook, and to the instructor’s teaching style and real-world experience.
Being able to adapt, rather than adopt, teaching materials can provide a more satisfying teaching and learning experience for both instructors and students. As it is presented in the paper, dynamic discrete models are very appropriate for developing in spreadsheets because of the approach that takes as principal variable a discrete time t and separation of the law of dynamics, control domain, performance criterion and a method used to find an optimal solution. Spreadsheet structure of rows and columns is appropriate for developing this kind of model. Model set in spreadsheet in this way provide quality base for simulation, which is very useful for laboratory experiments in educational purposes. In this way students can understand the problem, develop mathematical model, translate it to spreadsheet model and run simulation. One of directions for further elaboration of using spreadsheets in operations management education can be based on the integration of spreadsheet models and heuristic methods in order to solve different operations management problems modelled as discrete control systems. That approach could lead to the development of software applications, which would allow students to introduce and use searching methods, in order to achieve higher level of applied knowledge, which can be used for OM problems solving. Another possible application of spreadsheet in OM education is combination of Visual Basic for Application and spreadsheets, as very appropriate tool in problem solving. Usage of Visual Basic for Application and spreadsheets allow student to create own information system or software adjusted to exact problem. Even better, this kind of software is very quick to create, thanks to Visual Basic and spreadsheets characteristics. Also, any changes that should be implemented in model and application are easy to make.
REFERENCES
Barlow, J. (2005). Excel Models for Business and Operations Management, 2nd ed. John Wiley & Sons, Inc Gardner, L. (2008). Using a spreadsheet for active learning projects in operations management. INFORMS Trans. Ed. 8(2) 75-88 Kostic K. (2001). Izrada i koriscenje poslovnih modela, Fakultet organizacionih nauka, Beograd Kostic, K. (2009). Inventory control as a discrete system control for the fixed-order quantity system. Applied Mathematical Modelling Kostić K. (2012). Simulacija biznis situacija, FON, Beograd Leong, T.Y., Cheong, M. L. F. (2008). Teaching Business Modeling Using Spreadsheets.INFORMS Trans. Ed. 9(1), pp. 20-34. Liberatore, M. J., R. L. Nydick. (1999). Breaking the mold—A new approach to teaching the first MBA course in management science. Interfaces 29(4) 99–116. Oke, S. A. (2004). Spreadsheet applications in engineering education: A review. Int J Eng Educ 20, pp. 893–901. Prince, M. (2004). Does active learning work? A review of the research. J. Engrg. Ed. 93(3) 223–231 Winston, W. L. (1996). Management science with spreadsheets for MBAs at Indiana University. Interfaces 26(2) 105–111. Winston, W. L. (2004). Microsoft Excel: Data Analysis and Business Modeling. Microsoft Press, Redmond, WA.
1238
IMPROVEMENT OF PLANNING SYSTEM IN SUPPLY CHAINS AND SOFTWARE SUPPORT
Jasmina Omerbegović-Bijelović1, Nikola Atanasov1, Zoran Rakićević1
Abstract: The topic of this paper was born out of the pratical need for improving collaboration also within planning, and it deals with synchronising a) constant improvement of Planning Systems (principles, concepts, processes, structure, software sulutions etc.) of the Supply Chain members (SCPS) and b) limited ability of the SC members (especially if they are of the small and medium enterprise type – SMEs) to maintain the required software solutions needed to support such a dynamic planning system in SC. Bearing in mind: a) the different types of SC and their members (big business and/or SME), b) the complexity of planning per se, c) the different ways of organising for planning in LS and d) the difficulty in applying software changes within SCPS (stress, waiting, cost etc.), the problem is how to ensure adequate, but not overly expensive software support (new or improved) in a timely fashion for the new SCPS concept. The initial hypothesis is that there is at least one way in which it is possible to develop SCPS and, at the same time maintain the adequacy of the software solution supporting it. The paper is intended for those who design and construct SCPS, as well as all users of it, with the intention to increase awareness of the necessity for constant development of that particular system and about the need for its flexibility, as well as the awareness of the significance and possibilities of planning system engineering. At the same time it is also intended for those who create SCPS software – so that they bear in mind that their software should be functional even if significant changes within SCPS occur. In this paper we have shown a SC model followed by the relevant problem areas (and related works): planning in SC, with the need for SCPS improvement, and the standard software solutions in SC planning/management. In the section about research and results, we have defined seven research questions; we have then pointed out the significant elements of participant collaboration complexity within SC, as well as the possibility for maintaining the adequacy (relevancy) of the software solutions whilst constantly imporving SCPS.
Keywords: System Planning, Supply Chain (SC), Collaboration in SC, Software Solutions adequacy, SC Planning System Improvement
1. INTRODUCTION
Management of organizational systems, both individual and those associated in supply chains (SC), begins with planning. Planning is the process of defining goals and their decomposition to the level of operational objectives, defining the necessary operations for transforming objects of work and defining the associated resource requirements, as well as determining the total demand for resources and ensuring their availability (Omerbegovic-Bijelovic, 2010). This large task becomes even more complicated when connecting companies in SC (Fig. 1), because the planning for one company becomes the planning for a number of companies - related by management (including planning), but also by business, technological, economic, and formal - legal issues.
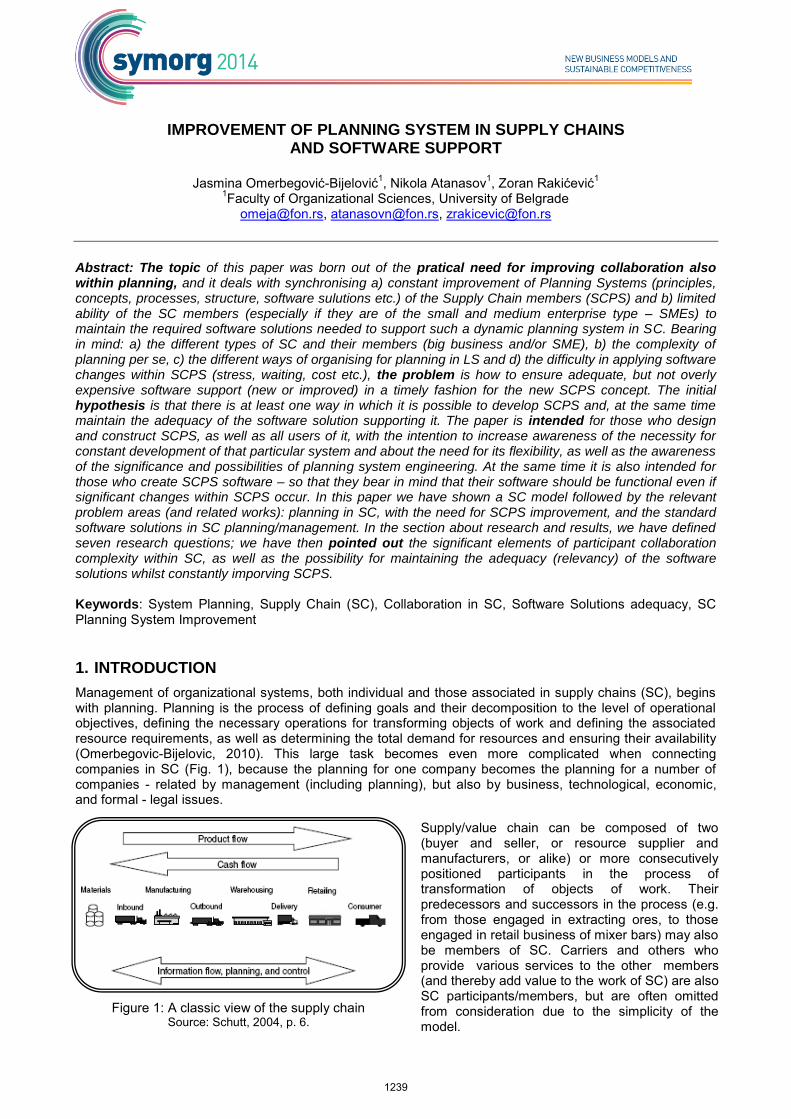
Supply/value chain can be composed of two (buyer and seller, or resource supplier and manufacturers, or alike) or more consecutively positioned participants in the process of transformation of objects of work. Their predecessors and successors in the process (e.g. from those engaged in extracting ores, to those engaged in retail business of mixer bars) may also be members of SC. Carriers and others who provide various services to the other members (and thereby add value to the work of SC) are also SC participants/members, but are often omitted from consideration due to the simplicity of the model.
Figure 1: A classic view of the supply chain Source: Schutt, 2004, p. 6.
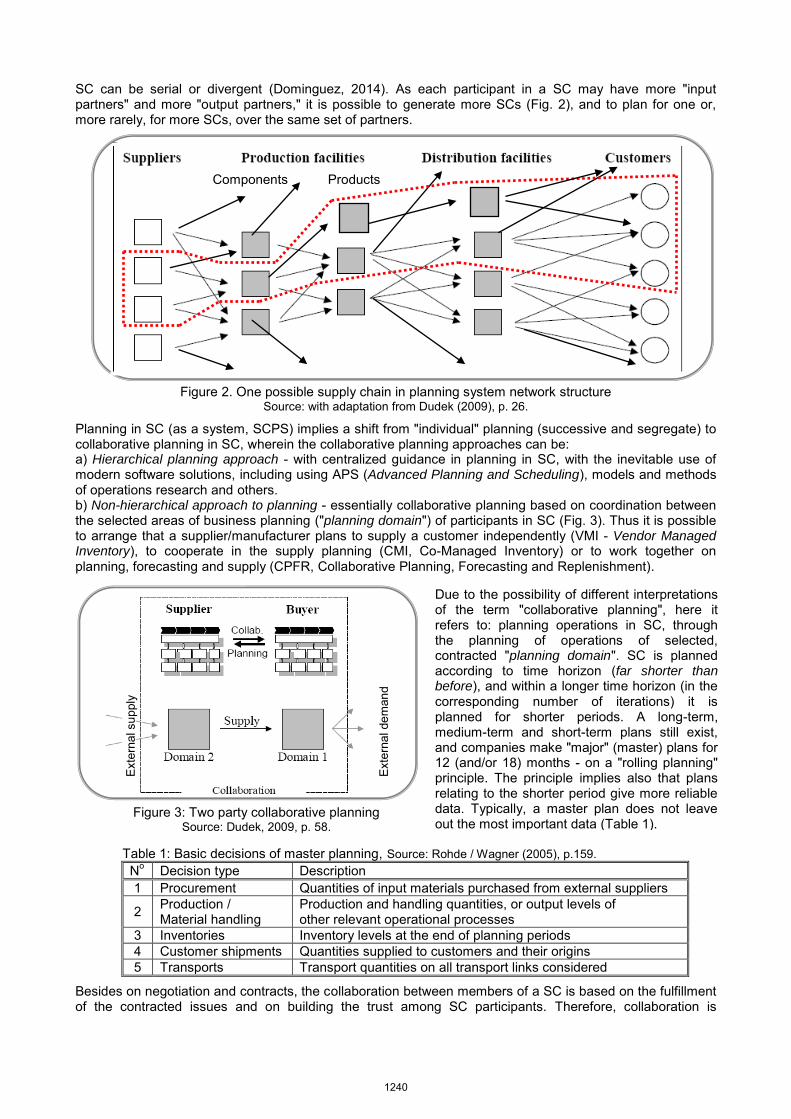
SC can be serial or divergent (Dominguez, 2014). As each participant in a SC may have more "input partners" and more "output partners," it is possible to generate more SCs (Fig. 2), and to plan for one or, more rarely, for more SCs, over the same set of partners.
Figure 2. One possible supply chain in planning system network structure Source: with adaptation from Dudek (2009), p. 26.
Planning in SC (as a system, SCPS) implies a shift from "individual" planning (successive and segregate) to collaborative planning in SC, wherein the collaborative planning approaches can be: a) Hierarchical planning approach - with centralized guidance in planning in SC, with the inevitable use of modern software solutions, including using APS (Advanced Planning and Scheduling), models and methods of operations research and others. b) Non-hierarchical approach to planning - essentially collaborative planning based on coordination between the selected areas of business planning ("planning domain") of participants in SC (Fig. 3). Thus it is possible to arrange that a supplier/manufacturer plans to supply a customer independently (VMI - Vendor Managed Inventory), to cooperate in the supply planning (CMI, Co-Managed Inventory) or to work together on planning, forecasting and supply (CPFR, Collaborative Planning, Forecasting and Replenishment).
Figure 3: Two party collaborative planning Source: Dudek, 2009, p. 58.
Table 1: Basic decisions of master planning, Source: Rohde / Wagner (2005), p.159. No Decision type Description 1 Procurement Quantities of input materials purchased from external suppliers
2 Production / Material handling
Production and handling quantities, or output levels of other relevant operational processes
3 Inventories Inventory levels at the end of planning periods 4 Customer shipments Quantities supplied to customers and their origins 5 Transports Transport quantities on all transport links considered
Besides on negotiation and contracts, the collaboration between members of a SC is based on the fulfillment of the contracted issues and on building the trust among SC participants. Therefore, collaboration is
Components Products
Ext
erna
l sup
ply
Due to the possibility of different interpretations of the term "collaborative planning", here it refers to: planning operations in SC, through the planning of operations of selected, contracted "planning domain". SC is planned according to time horizon (far shorter than before), and within a longer time horizon (in the corresponding number of iterations) it is planned for shorter periods. A long-term, medium-term and short-term plans still exist, and companies make "major" (master) plans for 12 (and/or 18) months - on a "rolling planning" principle. The principle implies also that plans relating to the shorter period give more reliable data. Typically, a master plan does not leave out the most important data (Table 1).
Ext
erna
l dem
and
1240
established in multiple phases (Kilger and Reuter, 2005, p. 271): Domain planning, Data exchange, Negotiation&Exception handling, Execution, Performance measurement. When it comes to the realization of the planning process, it is done by a pull principle: first the outputs from SC are determined, then predecessors' operations, upstream. At each stage (for each participant in SC) firstly the type and quantity of its output are determined, and then - based on consumption norms - the necessary amount of resources (which should be obtained from the predecessor in SC). The neighbours in SC cooperate on the level of "planning domain" (Fig. 4).
Figure 4: Upstream planning scheme Source: Dudek (2009), p. 47.
The above suggests the complexity of the problems of planning systems in SC (SCPS). The complexity increases when we take into consideration the development of SCPS. As the system implies a process (processes) and structure, here the "organization to plan," as well as appropriate meta-managerial tools (Omerbegovic - Bijelovic, 1998) such as concepts / models, methods, technical means and organizational tools (including software), their development even more/ further multiplies the complexity of SCPS. This paper is written based on the following structure: Section 2 explains the conceptual framework and gives the problem description; in Section 3 survey results are presented, and Section 4 summarizes some concluding remarks and suggestions for further studies.
2. PROBLEM DESCRIPTION AND LITERATURE REVIEW
Working within SC demands serious activities and resources for synchronising the varied interests and operations of its members. Synchronising the SC functioning starts with planning (SCPS), which, in time, changes (as a rule: improves). Planning in SC has, for decades, been impossible without software support. That support needs to change together with the changes within SCPS. SC members, not only within the SME category – which have “evidently of limited capacity” (Sitompul, 2012), and can therefore seem like a serious if not insurpountable problem – especially if the changes are very frequent. This is why some members of SC, unable to follow developments, decide on ceasing to be in SC altogether or find other solutions for keeping the relevancy of their software planning solutions.
2.1. Planning in supply chains
Schut (2004, p. 219) states that planning (including SC) covers the following areas: Sales Forecasting, Quantitative support for Sales & Operations Planning, Integrated Supply Chain Tactical Planning, Production requirements calculation from distribution network requirements, Master Scheduling of production, Detailed scheduling of production, Inventory deployment planning in a distribution network and Short-range transportation planning and load building. By Zamarripa et al. (2012), “the typical scope of the SC planning problem is to determine the optimal production levels, inventories and product distribution in an organized network of production sites, distribution centers, consumers, etc., taking care of the constraints associated to products and raw materials availability, storage limits, etc. in such network nodes.”
All of these areas (and others relevant to SCPS) are based on mathematical modelling and programming, which is an argument in favour of claims that there is no modern planning without software support. (Of course, sometimes, in special circumstances and only for the limited scope of issues / narrow fields, even today it is possible to obtain an acceptable solution without software support.) But the business system is so complex that it is impossible (and certainly not profitable) to operate without adequate software support in the conditions of contemporary competition.
2.1.1. Planning of one participant in a supply chain Participants in SC can retain a tendency to "individualistic" or "disconnected" planning in SC (DSC), reffering to planning without involving other parties and without "spreading" the scope of the information based on which the planning is done. Moreover, within a single company so called "Functional silos" may appear
1241
where there is a lack of cooperation between different functions within a company. In the same way we can define the ”planners' silos” in SC, where the planning is done without taking into consideration the attitudes/knowledge of other participants in SC who are also involved in the planning (planning "within the closed box"). This planning approach implies that a company plans only internal activities (procurement, production, sales) that are directly related to the supply/demand of the first predecessor/successor in SC. Companies that aim to integrate the entire supply chain tend to eliminate "functional-" and "planning silos" and create inter-functional processes.
2.1.2. Cooperation between neighbouring participants in SC in production and inventory planning Cooperation between neighbouring participants in SC in the area of production and inventory planning in different participants in SC has been studied by many authors. Prominent authors in this area (Lee, Padmanabhan and Whang, 1997; Barratt and Oliveira, 2001) agree that the presentation of sales data from retail outlets is useful information for manufacturing companies that are planning the production in line with demand forecasts. Raghunathan (1999) claims that a manufacturer reduces its costs to a different extent, depending on the number (percentage share) of retailers who share their sales forecasts with a manufacturer, as well as that the cooperation in forecasting helps to reduce the cost of the retail chain which shares its forecasts with a manufacturer. Paiva et al. (2014) suggest that supply planning and trust-based relationship within buyers and suppliers are positively related and both influence supply integration and operational performance. They claim that “integration with suppliers is the means by which companies work with suppliers seeking mutual objectives, sharing ideas, information, knowledge, risks, rewards and solutions to common problems”.
2.1.3. The cooperation of the entire supply chain in production and inventory planning It is assumed that some of the members of SC (e.g. retail) have limited interest in participating in the exchange of information and cooperation in SCPS . The key reason for cooperation can be identified by the fact that SCPS is a prerequisite for the efficient supply of all the members of SC. Cao and Zhang (2011) consider collaborative relationships and find that they “can help firms share risks, access complementary resources, reduce transaction costs and enhance productivity, and enhance profit performance and competitive advantage over time”. Collaboration concerns with the alignment of decisions and actions amongst SC members - in their planning and inventory management. This alignment is enabled by the exchange of information in the SC (Stadtler 2009). The availability of relevant information provides a manufacturer with better production planning, especially for products with a high variation in demand. As production plans are developed under the direct influence of identified demand, this means the possibility of creating a detailed and reliable delivery and supply schedule, using simulations in defining future orders, for example. A manufacturer is enabled to create its own delivery plan that is probably different from that of the customer's orders, with the adjustment of production plans to the real market needs. Considering research studies, according to Småros (2007), it is possible to draw a general conclusion that the availability of sales data from customers' facilities to the end user is a very significant potential for improving business of manufacturing enterprises. Studies show that by a combination of reports on orders of retail outlets and reports on the flow of goods in distribution centers of retail chains (which are governed by the concept of VMI), a production company can benefit even when only a handful of the total number of customers and retailers is involved in the collaboration system. The greater part (%) of its sales is "covered" by including into the VMI system, the better for all participants in SC.
2.2. Application software in supply chain planning
The general trend of the software manufacturers is the integration of supply chain components into existing software packages (ERP) in order to offer customers a complete solution designed for the overall needs of companies in SC. According to (Yen, Chou and Chang, 2002), in most cases, softwares for SC management (SCM software) are software solutions specifically developed for the needs of companies of a certain type (production, storage, distribution, trade). Some of the major software vendors have tried to combine different and specific software solutions for SC in a single software solution. According to (Yen, Chou and Chang, 2002), the best solution for the success of SC is the development of SCM software in two ways: a) The solutions that support the planning of participants in SC (Supply Chain Planning Software), and b) Software solutions that support the operational functioning of SC (Supply Chain Execution Software). Softwares used for planning in SCs are based on mathematical algorithms whose implementation optimize the flow of information and goods, enhance the efficiency of the SCs and optimize inventories. These software solutions are completely dependent on the available information and its reliability (precision). Software for planning in SC provides the support for these most important functions of SC; the greatest contribution is realized in the demand planning, which is the initial plan for all other activities in the chain - based on which further plans are created. Software intended to support the operational functioning of SC is designed for automation of SC
1242
specific needs (e.g. vehicle route optimization in distribution or automatic ordering in accordance with predefined signal inventories/re-order point).
2.2.1. Software packages for production and inventory planning of one participant in SC Software used for planning in SC allows SC members to manage inventory in line with sales and demand forecasts. As part of the SCM in general, a software solution for SC planning (S&OP - Sales and Operations Planning) plays an important role in reducing costs and improving the profitability of a company. Using software for SC planning (such as Modules for demand planning or S&OP modules), based on historical data and along with the expected activities to improve sales, companies can simulate the potential demand and, in line with expectations, harmonize inventories of finished goods and raw materials. In some cases the software components required to manage SC represent solutions that are fully integrated into the standard ERP, while in the others they represent separate modules or fully independent software solutions for the management of SC. According to (Kumar, 2001), software solutions for the SCM have a very large impact on the performance of the entire company, which has been recognized by leading software manufacturers. Major producers of software (SAP and Oracle) are dedicated to the further development of software for SCSP; this resulted in the creation of advanced software modules aimed at "complex" planning in SC (Chang and Makatsoris, 2001). Current software solutions for planning in SC enable cooperation between a manufacturer and buyer through the exchange of information on the available stock and realized sales, in order to perform mutual optimization of inventories. According to the recommendation made by Software AdviceTM (www.softwaradvice.com), in accordance with the cost of software, the number of implementation and success in optimizing inventory, the following software packages are recommended: JD Edwards, WISERoyal, SCP 4.0, SAP-SCM, PackManagerNulogy's, iTracker Hosted 3PL, MachSix, IBS Enterprise Manufacturers, POOL4TOOL and Quintiq's Supply Chain Planning & Optimization. SC aims to integrate all the key business processes. In practice, it happens that the key processes in SC individually do not have uniformed adequacy of software support, which implies a reduction of compatibility and causes missed business results. Standard business softwares (ERP) are primarily focused on providing software support to internal operations (production planning, inventory records of raw materials and finished goods, material and financial records - accounting, etc.). In contrast to standard ERP solutions, software solutions designed for SC are focused both on internal business activities and on external processes among participants in SC. According to (Buxmann, von Ahsen, Díaz and Wolf, 2004), the largest number of Supply Chain Management Software packages support SCPS (all SC members who cooperate in planning), while standard ERP solutions provide automation and support in the implementation of operational plans. The most common system of advanced planning, APS, provides immediate response to customer requirements providing timely and reliable information from the business system of a production company. APS system is a concept on which the software for SCM is based. The basic structure of APS concept ensures the creation of software that consists of the following planning modules and sub-modules: Strategic Network Planning, Demand Fulfilment & ATP, Production Planning and Scheduling, Transportation Planning and Distribution Planning.
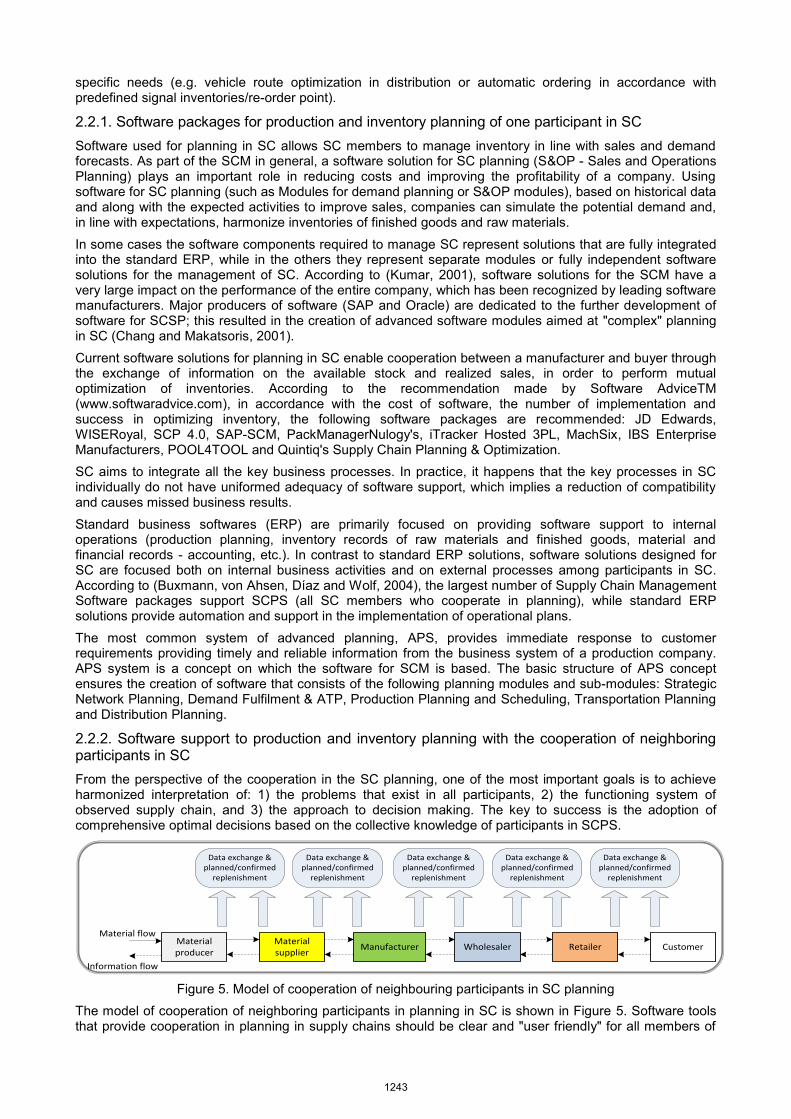
2.2.2. Software support to production and inventory planning with the cooperation of neighboring participants in SC From the perspective of the cooperation in the SC planning, one of the most important goals is to achieve harmonized interpretation of: 1) the problems that exist in all participants, 2) the functioning system of observed supply chain, and 3) the approach to decision making. The key to success is the adoption of comprehensive optimal decisions based on the collective knowledge of participants in SCPS.
Figure 5. Model of cooperation of neighbouring participants in SC planning The model of cooperation of neighboring participants in planning in SC is shown in Figure 5. Software tools that provide cooperation in planning in supply chains should be clear and "user friendly" for all members of
Material supplier
Manufacturer Wholesaler RetailerMaterial producer
Customer
Material flow
Information flow
Data exchange & planned/confirmed
replenishment
Data exchange & planned/confirmed
replenishment
Data exchange & planned/confirmed
replenishment
Data exchange & planned/confirmed
replenishment
Data exchange & planned/confirmed
replenishment
1243
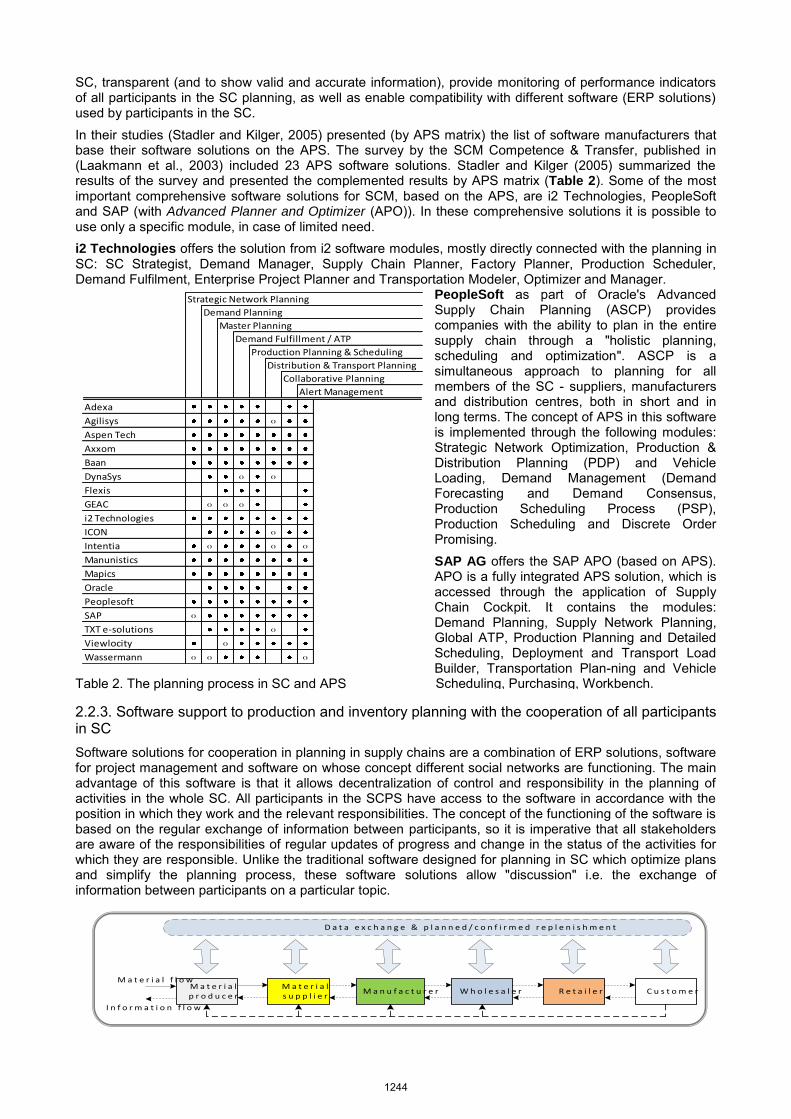
SC, transparent (and to show valid and accurate information), provide monitoring of performance indicators of all participants in the SC planning, as well as enable compatibility with different software (ERP solutions) used by participants in the SC. In their studies (Stadler and Kilger, 2005) presented (by APS matrix) the list of software manufacturers that base their software solutions on the APS. The survey by the SCM Competence & Transfer, published in (Laakmann et al., 2003) included 23 APS software solutions. Stadler and Kilger (2005) summarized the results of the survey and presented the complemented results by APS matrix (Table 2). Some of the most important comprehensive software solutions for SCM, based on the APS, are i2 Technologies, PeopleSoft and SAP (with Advanced Planner and Optimizer (APO)). In these comprehensive solutions it is possible to use only a specific module, in case of limited need. i2 Technologies offers the solution from i2 software modules, mostly directly connected with the planning in SC: SC Strategist, Demand Manager, Supply Chain Planner, Factory Planner, Production Scheduler, Demand Fulfilment, Enterprise Project Planner and Transportation Modeler, Optimizer and Manager.
PeopleSoft as part of Oracle's Advanced Supply Chain Planning (ASCP) provides companies with the ability to plan in the entire supply chain through a "holistic planning, scheduling and optimization". ASCP is a simultaneous approach to planning for all members of the SC - suppliers, manufacturers and distribution centres, both in short and in long terms. The concept of APS in this software is implemented through the following modules: Strategic Network Optimization, Production & Distribution Planning (PDP) and Vehicle Loading, Demand Management (Demand Forecasting and Demand Consensus, Production Scheduling Process (PSP), Production Scheduling and Discrete Order Promising. SAP AG offers the SAP APO (based on APS). APO is a fully integrated APS solution, which is accessed through the application of Supply Chain Cockpit. It contains the modules: Demand Planning, Supply Network Planning, Global ATP, Production Planning and Detailed Scheduling, Deployment and Transport Load Builder, Transportation Plan-ning and Vehicle
Table 2. The planning process in SC and APS
2.2.3. Software support to production and inventory planning with the cooperation of all participants in SC Software solutions for cooperation in planning in supply chains are a combination of ERP solutions, software for project management and software on whose concept different social networks are functioning. The main advantage of this software is that it allows decentralization of control and responsibility in the planning of activities in the whole SC. All participants in the SCPS have access to the software in accordance with the position in which they work and the relevant responsibilities. The concept of the functioning of the software is based on the regular exchange of information between participants, so it is imperative that all stakeholders are aware of the responsibilities of regular updates of progress and change in the status of the activities for which they are responsible. Unlike the traditional software designed for planning in SC which optimize plans and simplify the planning process, these software solutions allow "discussion" i.e. the exchange of information between participants on a particular topic.
M a t e r i a l s u p p l i e r
M a n u f a c t u r e r W h o l e s a l e r R e t a i l e rM a t e r i a l p r o d u c e r
C u s t o m e r
M a t e r i a l f l o w
I n f o r m a t i o n f l o w
D a t a e x c h a n g e & p l a n n e d / c o n f i r m e d r e p l e n i s h m e n t
Strategic Network Planning
Demand Planning
Master Planning
Demand Fulfillment / ATP
Production Planning & Scheduling
Distribution & Transport Planning
Collaborative Planning
Alert Management
Adexa
Agilisys o
Aspen Tech
Axxom
Baan
DynaSys o o
Flexis
GEAC o o o
i2 Technologies
ICON o
Intentia o o o
Manunistics
Mapics
Oracle
Peoplesoft
SAP o
TXT e-solutions o
Viewlocity o
Wassermann o o o
Scheduling, Purchasing, Workbench.
1244
Figure 6. Model of a full cooperation in planning in SC
The cooperation of the participants in planning in SC can be full or limited. Full co-operation (Fig. 6) is achieved if all participants in SC cooperate fully (transparent) and use the appropriate software for collabo-ration in planning in SC. The basic concept of cooperation is presented in Lecic-Cvetkovic et al. (2012). Limited co-operation (Fig. 7) is a modification of the full cooperation model; it occurs when the cooperation of the participants in SC is limited, where each participant cooperates with the first predecessor and successor in the SC, whilst concurrently cooperating with the final buyer. It is believed that the cooperation with the buyer is most easily attainable, because the buyer i.e. retail store, aims to ensure the availability of products to consumers and thus "retain" them, while the other SC members have the opportunity to find alternative channels of product placement.
Material supplier
Manufacturer Wholesaler RetailerMaterial producer
Customer
Material flow
Information flow
Data exchange & planned/confirmed replenishment
Data exchange & planned/confirmed replenishment
Data exchange & planned/confirmed replenishment
Data exchange & planned/confirmed replenishment
Data exchange & planned/confirmed replenishment
Figure 7. Model of limited cooperation between the participants in SC planning
Collaborative planning, forecasting and replenishment (CPFR) software from „Demand Solutions“ which is "cloud-based" concept, provides reliable information on the demand and the need for replenishment of the stock through the coordination of material and informational flow between multiple participants in the SC, between different locations and different companies. Demand Solution software allows defining priorities in meeting the demand (through Demand Solutions Dashboards), as well as different levels of aggregate considerations of demand and the available stock. Cooperation is achieved through the following additional features: Exchange calendar event (production, delivery, receipt), Support for XML and EDI in order to facilitate the exchange of information, full access to the entire SC from the perspective of each member. Cooperation in planning in SC is also provided by software „Voyager Collaborate“, whose main advantage is Module Logility Voyager Collaborate with providing effective communication in decision-making, contributes to the identification of potential problems and preventive action. JDA CPFR, created by JDA Software Group, is a direct upgrade by creators of VICS CPFR ® standard, through the module that allows planning by the application "alerts" and the work with flexible planning horizon. NeoGrid CPFR is a software solution for collaboration in planning in SC which is derived from the solutions intended for aligning inventory levels between the SC members, i.e. between multiple storage positions.
3. RESEARCH AND RESULTS
By Paiva et al. (2014), “Some studies about supply chain planning have focussed on mathematical models to reduce losses due to mismatches, while other studies have focussed on antecedents that lead to improvements in supply chain planning, for example, the use of electronic marketplaces, advanced planning systems, information technologies use and supply chain flexibility. Here we draw attention to the improvement of planning in LS and the need to maintain the software support for such, new planning.
Contemporary SC cannot operate without adequate software support (which effectively and efficiently serve SCPS, i.e. which can be applied, and, at the same time, provides the benefit for SCPS), and the adequacy of software support reduces with the accumulation of changes in the concept of SCPS (because every change of SCPS requires appropriate, new or updated software). Hence the need to replace the software with a new, more adequate one. But the downsides of the replacement are: replacement costs, changing time, and stress (training for new software for planning in SC, adjustments of experts in planning in SC etc.). Hence SCPS must be improved, and the adequacy of its software support must be maintained, i.e. must not be reduced. Therefore, this paper seeks answers to questions (RQ1-RQ7): RQ1: What is the "chosen problem" in SCPS? RQ2: Why is it necessary to have a software support for SCPS?
1245
RQ3: What changes with the improvement of SCPS? RQ4: What is happening with the SC planning software with the improvement of SCPS? RQ5: Is it possible to "keep" the adequacy of the software for SCPS? RQ6: Who can "keep" the adequacy of the software for SCPS? RQ7: How to "keep" the adequacy of the software for SCPS? "Selected problem" (RQ1) refers to maintaining the adequacy (or at least the usability and usefulness) of not too expensive, new or improved, software solutions to support the SC planning system (SCPS), in circumstances when SCPS maintains its topicality, i.e. it improves in accordance with the progress of the environment. "The adequacy of software support for SCPS" (Software Support Adequacy for Supply Chain Planning System, SSA4SCPS) as one of the key performance indicators of "quality software solutions for SCPS", means that software solutions suit all the needs of SCPS, that this support is effective and efficient, is on the same "level of modernity" as the SCPS, is usable (accomplishes its goals well enough) and is useful. Indicator SSA4SCPS, similarly to other quality indicators of any product/service, must be measurable/comparable, its functional dependence on certain variables should be described, standards for measures of their changes should be defined for the measurement system and the maintenance of the desired values, etc. The question is what happens when the SCPS software support loses its function, i.e. is it possible to do business without this support? Examples from the past show that it is (was) possible, but the contemporary practice says that it is not possible. Modern business involves a significant level of availability and reliability of data, accessibility, and the use of software tools for decision making, quick decision making, and dislocation of the participants in the decision-making system and in the complete management, etc. The cooperation of the participants in SC without software support for SCPS is now virtually impossible. Therefore, it is necessary to maintain the highest possible (or at least acceptable) indicator levels of SSA4SCPS. When considering the SC planning system, it is interesting to investigate what is the function of software support (RQ2), i.e. which business activities in SC cannot be planned if there is no adequate software support. It is already said (Tab. 1) what "basic decisions of master planning" are. But that is only part of the function of a complex planning system in general as well as in SC. Practically, there is no area or object of planning where the software support does not facilitate obtaining a solution of a higher quality (more reliable, more accurate, faster, etc.). When asked why the SCPS is complex, the best response is to remember at least some of the dimensions of the business system (Omerbegović-Bijelović, 2005): processes, resources, organizational components/parts, inputs and outputs, the relationship between inputs and outputs, changes, property, environment, expectations and goals, constraints, and so on. When this is viewed as an object of development in SC, exponential growth in a number of potential problems can be identified. For managers (owners and managers), this complexity would be insurmountable without a software support - for planning and for all other managerial activities. Enhancement/improvement of the SC planning system (RQ3) can be symbolic and "painless", but a radical change (concepts, principles, data supply and software support, together with function and location of parts of the planning system in the SC organizational structure) is an important, complex, and unavoidable task. The cause of these changes is the need to maintain the competitiveness of SC and its members while the motives may be different - depending on the perceived problems and the capacity to address them, but always with setting a certain priority/objective: maximizing the satisfaction of customer requirements (Lecic - Cvetkovic et al., 2010). Often the Bullwhip Effect phenomenon (BWE) is used as an excuse to change the SC planning system. For example, instead of founding their plans on communicating with their immediate neighbours, the SC members may decide that each member of the SC should plans it output according to the last member in SC (usually a retail), using the same reasoning mechanism and taking into account its own historical data (Lecic - Cvetkovic et al., 2012). The often cause of SCPS changes is the necessity to improve the SCM system (in order to improve the quality of plans, eliminate conflicts, increase the level of communication within the SC and with the environment), or the application or changes of meta-managerial tools, reducing costs, reducing the duration of production and business cycles, improving decision-making (by introducing higher mathematics and related disciplines), introduction of APS and the like. Along with the improvement of SCPS, it is necessary to adapt its software support (RQ4). Only together they perform their function in the SCM. If the software is not flexible, if there is no automatism in its adaptation to changes in SC and in its planning system, the question of the adequacy of such software support arises. SSA4SCPS indicator should signal the need for software updates. Maintenance of the adequacy of the software is important for all participants in the SC; in several ways: as a sign that SC is uniformly developed and remains competitive, but also as an incentive to occasionally check whether at least one element from the set {"Planning system in SC" * "Software support to SCPS"} has been improved (and caused the improvement of the other one) in the given period. Practice shows that the improvement of the planning system in the SC is inevitable, even desirable,
1246
but that it is also necessary to keep the adequacy of the planning software in SC (RQ5). It is not difficult to keep SSA4SCPS within the limits of admissibility - if there are necessary resources (e.g., money, time, staff readiness for change). Given the importance and the task of SCPS imrovement, including the importance, and the task of maintaining the adequacy of the software (SSA4SCPS), the question is who has a role in fulfilling these tasks (RQ6). Among the resposabile and interested are: a) Those who conceived, designed, devised the SCPS, b) Those who "produce" software support to SC planning, and c) Companies - participants in SC. Some of the ways to keep the adequacy of the software for SCPS within the limits of acceptability (RQ7) are proposed: application of planning system engineering (processes and organizational structures) and the design of a flexible planning system for SC; the use of flexible, adaptable software solutions for planning in SC (modules and the possibility of accepting the "upgrade" - tailored to the changes in the SCPS); replacement of SCPS software (especially if it is possible to substitute it on the "old to new" principle with software provider); automatic updating of software solutions; timely defining principles for the change of software and allocation of related costs; that, from the moment of establishing SC, all participans define and agree on not only SCPS, but also the principles of its development; timely creation of a body for improving SC planning/management; the fund for improvement of SC planning/management settings; miscellaneous.
4. CONCLUSION
The paper points at the necessity of improving the planning system in supply chains (SCPS), and the need and ability to maintain the adequacy of the software to support the SC planning even when the planning improves and promotes/develops. Today, a complex planning system (planning, organizational structure in which the process takes place and the cooperation among the participants in SC) cannot function without a software support. Given the variety ranges of SC in which modern businesses operate, the complexity of planning is still growing. The competition between enterprises and their association’s increases, and therefore SCs need to increase their competitiveness, i.e. to develop. Consequently, it urges the planning systems in enterprises in SC to improve, innovate, change, including the whole SC.
Due to the development of the principles and concepts of organization and functioning of SCPS, a reduction of the adequacy of existing software support occurs, and this leads to the need to provide the software that is not too expensive, which is (new or improved) adequate for the new SCPS. Therefore, the problem of maintaining the adequacy (usability, usefulness) of software packages that need to support the operation and development of the SCPS is noticed. In addition to identifying the needs for maintaining the adequacy (or at least usability) of software support to SCPS, this paper also pointed at some possibilities to extend the duration, usefulness and/or appropriateness of software for planning in supply chains. Different aspects of cooperation/collaboration in planning in SC are presented by authors (as shown on Fig.5, Fig.6 and Fig.7) clearly showing the respective information flows between one or more participants in SC planning, with extension of closed loop for feedback/backward data collection. Some ways of keeping the SCPS software support adequacy within acceptable boundaries are also suggested.
Regarding further study on this subject, authors would like to suggest examining the scale of the software support adequacy and/or measuring its influence on business results.
REFERENCES
Barratt, M., Oliveira A., 2001. Exploring the experiences of collaborative planning initiatives, International Journal of Physical Distribution & Logistics Management, Vol. 31, No. 4.
Bozarth, C.C., Handfield R.B., 2006. Introduction to Operations and Supply Chain Management. Pearson Education, Inc.
Buxmann, P., von Ahsen A., Díaz L.M., Wolf K., 2004. Usage and evaluation of Supply Chain Management Software – results of an empirical study in the European automotive industry, Info Systems Journal, Vol. 14, pp. 295–309.
Cao, M., Zhang Q., 2011. Supply chain collaboration: impact on collaborative advantage and firm performance. Journal of Operations Management, 29(3), 163-180.
Chang, Y., Makatsoris H., 2001. Supply chain modelling using simulation. International Journal of Simulation, Vol. 2, No. 1, 24-30.
Christopher, M., 2005. Logistics and Supply Chain Management. 3rd ed. Pearson Education Limited, GreatBritain
Domínguez, R., Cannella S., Framiñán J. M., 2014. On bullwhip-limiting strategies in divergent supply chain networks (accepted for publishing). Computers & Industrial Engineering.
Dudek, G., 2009. Collaborative Planning in Supply Chains – A Negotiation Based Approach (2nd ed.), Springer, Berlin.
1247
Kilger, C., Reuter B., 2005. Collaborative Planning, in: Stadtler, H., Kilger, C. (2005). Supply Chain management and Advanced Planning – Concepts, Models, Software and Case Studies, 3rd ed., Springer-Verlag, Berlin et al. 2005. pp. 259-278.
Kumar, K., 2001. Technology for supporting supply chain management: Introduction. Communications of the ACM, Vol. 44, No. 6, pp. 58 – 61.
Laakmann, F., Nayabi K., Hieber R., 2003. Market Survey 2003: Supply Chain Management Software – Detailed investigation of supply chain planning systems, Fraunhofer IPA Stuttgart, Fraunhofer IML Dortmund, ETH Zürich BWI
Lecic-Cvetkovic, D., Atanasov N., Babarogic S., 2010. An Algorithm for Customer Order Fulfilment in a Make-to-Stock Manufacturing System. International Journal of Computer, Communications and Control, 5(5), 783-791.
Lecic-Cvetkovic, D., Atanasov N., Omerbegovic-Bijelovic J., 2012. Improvement of Supply Chain Management by Bullwhip Effect Reduction. Proceedings of the XIII International Symposium SymOrg 2012, Serbia, 226-234.
Lee, H., Padmanabhan V., Whang S., 1997. The Bullwhip Effect in Supply Chains, Sloan Management Rev. 38, 93-102.
Omerbegovic-Bijelovic, J., 1998. Meta-management and quality of management (monograph, in Serbian), Zaduzbina Andrejevic, Belgrade.
Omerbegovic-Bijelovic, J., 2005. Planning and preparing of production and services delivering (in Serbian), Faculty of organisational sciences – Belgrade University, Belgrade.
Omerbegovic-Bijelovic, J. (editor and one of authors) et al., 2010. Basics of Operations management (in Serbian), Faculty of organisational sciences – Belgrade University, Belgrade.
Paiva, E. L., Teixeira R., Vieira L. M., Finger A. B., 2014. Supply chain planning and trust: two sides of the same coin. Industrial Management & Data Systems, 114(3), 405-420.
Raghunathan, S., 1999. Inter-organizational collaborative forecasting and replenishment systems and supply chain implications, Decision Sciences, Vol. 30, No 4.
Rohde, J., Wagner M., 2005. Master Planning, in: Stadtler H., Kilger C. (Eds.), Supply Chain Management and Advanced Planning – Concepts, Models, Software and Case Studies, 3rd ed., Springer-Verlag, Berlin et al., 2005, pp. 159-177.
Schutt, J. H., 2004. Directing the flow of product: a guide to improving supply chain planning, J.Ross Publishing&APICS, Boca Raton, Florida
Sitompul, C., 2012. A Supply Chain Planning for Small and Medium Enterprises. Procedia Economics and Finance, 4, 384-389.
Småros, J., 2007. Forecasting Collaboration in the European Grocery Sector: Observations from a case study, Journal of Operations Management, Vol. 25, No 3.
Stadtler, H., Kilger C. (Eds.), 2005. Supply Chain Management and Advanced Planning – Concepts, Models, Software and Case Studies, 3rd ed., Springer-Verlag, Berlin et al.
Stadtler, H., 2009. A framework for collaborative planning and state-of-the-art, in: Günther, H.O. and Meyr, H. (authors and editors) et al., Supply Chain Planning - Quantitative Decision Support and Advanced Planning Solutions, Springer, Berlin, 2009, pp. 3-28.
Abstract: Bullwhip effect in supply chains is a topic of interest of many authors, but research has mainly been done on operational causes and only some of them. This paper gives an overview of all operational and behavioral causes of the bullwhip effect, as well as modes of overcoming them.
Keywords: supply chain, bullwhip effect, operational and behavioral causes
1. INTRODUCTION
Coordination of supply chains operates well if all the participants in a supply chain (suppliers, manufacturers, distributers, wholesalers, retailers) consider how their actions affect other participants and the entire chain. Lack of information and coordination can cause the bullwhip effect, which implies a distortion of information within the supply chain because different stages in the supply chain have different demand forecasts, so that demand increasingly varies from retailer to manufacturer. Bullwhip effect was first identified by Forrester (1958). Later, the causes of the bullwhip effect were defined as “players’ systematic irrational behavior” or as a “misperception of feedback” (Sterman, 1989, Goodwin 1994). The retailer interprets small variations in customer demand as a growth trend, which leads him to increase his order. Further up the chain, the size of the orders increases. Also, retail sales may increase an order due to planned promotions. If the manufacturer interprets this increase in demand as a permanent increase, and orders from the supplier accordingly, he will have the problem of surplus stock by the end of the promotional period. Croson et al. (2004) have classified the causes of the bullwhip effect as operational and behavioral. Most authors deal with operational causes and mainly only some of them, while behavioral causes are seen as important, but insufficient research has been done. This paper provides an overview of all operational and behavioral causes of the bullwhip effect, and modes of overcoming them.
2. OPERATIONAL CAUSES OF THE BULLWHIP EFFECT
Lee et al. (1997a, 1997b) found that the information on the size of orders distort more as they move up the supply chain, thus leading to the bullwhip effect. The causes they list are: 1. processing a signal that there is demand, i.e. that it is necessary to order, 2. rationing game - when the manufacturer has limited capacities and the available quantity produced must be divide among all consumers, consumers start to order more, because they think that there will be a shortage and that they will get a certain percentage from the order, 3. determining the size of the orders, 4. price variations.
Aly (2007) showed that increasing the lead time, the time between two deliveries and the time during which an average amount of stock is consumed leads to an increase in the bullwhip effect. On the other hand, increasing the prediction frame (the number of previous weeks when demand is monitored and used to forecast future demand) leads to a reduction of the bullwhip effect
Buchmeister et al. (2008) list the factors: forecast errors, overreaction to backlog, lead time variability, no communication and no coordination up and down the supply chain, delay times for information and material flow, batch ordering (larger orders result in more variance), rationing and shortage gaming, price fluctuations, product promotions, free return of goods policy, inflated orders.
1249
Chopra and Meindl (2001) list the following as obstacles to coordination in the supply chain and as operational causes of the bullwhip effect: Incentive obstacles – Incentives for the participants to purchase more, in case this leads to an increase
in demand variability which is not followed by a change in demand from end buyers, decrease the supply chain profit. These include incentives for a participant’s local activity, and do not increase the overall supply chain profit.
Information processing obstacles – Information about demand is distorted as it moves from the retailer to the manufacturer or if the demand forecast is based on orders, instead of customer demand.
Operational obstacles – If a company orders larger quantities of a product than it can sell, due to the economy of scale or the discount on purchase price, and the supplier identifies the current rise as a trend and includes it in the plan for the forthcoming period, he will have surplus stock. The longer the lead time, the higher the error.
Pricing obstacles – Promotions and other short-term discounts from a manufacturer result in forward buy, where retail and wholesale buy large quantities during the promotion period to cover the needs for a longer period of time, which is followed by a decrease in orders. During the promotion period, orders are larger than sale, so after this period the orders are lower so as to sell the delivered stock.
Decreasing the Influence of Operational Causes of Bullwhip Effect
It is possible to decrease the bullwhip effect by affecting its causes. Numerous authors have dealt with this problem, and the solutions can be divided into six categories. 1. Information sharing is usually seen as a “remedy” for the bullwhip effect and it is generally
acknowledged that it can optimize supply chain performance (Forrester, 1958, Lee et al., 1997a and 1997b, Simchi-Levi et al., 2000, Chen et al., 2000, Carlsson and Fuller, 2002, Gangopadhyay and Huang, 2004, Vujošević, 2004, Vujošević and Panić, 2004). However, some authors show that the value of information sharing varies depending on the scenario. Variation in manufacturer demand is lower when the demand is filtered through a distribution centre, than when a retailer orders directly from the producer (Baganha and Cohen, 1998). When all supply chain participants replenish stocks on the same day, information sharing has no effect on stocks (Bourland et al., 1996). Some participants find that information sharing could disclose confidential information of a company, which would lead to loss of competitiveness. To prevent abuse of information sharing, the chain participants determine the minimum amount of information which should be shared to gain benefit and not risk abuse. In addition, it has been determined that the more the participants evaluate information as useful, the more often they share and forward them. However, the participants underestimate the usefulness of information for other participants when compared to the estimated value of the information for them. The less the usefulness of the information is evaluated to be, the less they are prepared to forward this information (Nienhaus, 2006). The most common is either the type of information shared (horizontal perspective) or the number of trading partners involved in information sharing (vertical perspective). According to the type of information shared, they can be classified as (Gangopadhyay and Huang, 2004): 1. product information, 2. inventory level and consumer transaction information and 3. decision models. In this case, it is possible to share all information, share partial information or share no information. It is important that trading partners see why and which information should be shared. Li et al. (2006) differentiate three levels of information sharing: transactional, operational and strategic. Transactional information sharing includes the quantity of order, prices, sales level, product specifications, quality and delivery specifications. Operational information sharing includes an exchange of information on the level of stock, expenses, production and transport capacities and lead time. Strategic information include information on retail centers, demand in real time, understanding of market trends, what customers value most and product design. The companies that are closer to the end user have a better view of the demand and should forward this information upstream to companies who are further away from consumers. On the other hand, information that is forwarded downstream should be the information on order status, storage utilization, production schedule and inventory level. Table 1 shows the type of information which can be shared in the supply chain and why (Lee and Whang, 2000). Miler (1996) underlines the importance of information quality and suggests the following characteristics of information: relevance, accuracy, timeliness, completeness, coherence, format, accessibility, compatibility, security and validity.
In addition to the type and quality of information, the mode of information sharing is also important. There are a number of variations between non-sharing and complete sharing of information. Lee and Whang (2000) propose three ways of sharing information: the information transfer model, where one partner forwards information to the other who maintains the decision-making database, the third party model
1250
where the third partner maintains the database and gathers information and the information hub model, where the third partner is the system.
Table 1: Type of information shared and the aim of sharing type of information aim of sharing
inventory level avoid double storage of safety stock (with both participants)
sale level decrease bullwhip effect order status enable buyer to know where the order currently
is sale forecast decrease safety stock of participants who are
further away from the end user production and delivery schedule provide customer with a specific delivery time performances (product quality, lead time, waiting time)
identify where bottleneck is
capacity avoid rationalizations
2. Improvement of information flow can decrease the bullwhip effect. Since the only demand that needsto be met is the demand of the end user for the final product, all participants in the supply chain shouldhave information about this and plan accordingly (Chopra and Meindl, 2001). Also, replenishment anddelivery time for the whole supply chain must be collaboratively controlled. The most common models ofreplenishment which enable information sharing are: Continuous Replenishment Programs - CRP(Chopra and Meindl, 2001), Manufacturing Resource Planning - MRP II (Renko, 2011), EnterpriseResource Planning - ERP (Chopra and Meindl, 2001, Renko, 2011), Advanced Planning Systems - APS(Renko, 2011) Vendor-Managed Inventories - VMI (Chopra and Meindl, 2001, Renko, 2011),Collaborative Planning, Forecasting and Replenishing Processes - CPFR (Jovanović and Vasiljević,2008, Renko, 2011, BLANCHARD, 2010).
3. Collaborative observation of goals decreases the bullwhip effect by making the decisions regardingtransport, information and inventory based on their influence on profitability, and not based on the totalprice and particularly not the local prices of individual participants in the chain (Chopra and Meindl, 2001,Vujošević, 2004).
4. Collaborative demand forecast and making decisions about orders decreases the variations oforders (Chen et al., 2000, Wu and Katok, 2006). The bullwhip effect can be decreased by analyzingdemand patterns and by applying appropriate demand forecast methods. Buchmeister (2008) proposesthe method of moving average for demand forecast.
5. Flexibility of the supply chain includes process and logistics flexibility (April and Garavelli, 2007).Process flexibility refers to the number of product types produced, and logistics flexibility refers todifferent logistics strategies applied. Flexibility of the supply chain and the improvement of operationsdecrease the bullwhip effect caused by undetermined (stochastic) lead time or production capacity(Chopra and Meindl, 2001, Aprile and Garavelli, 2007). Improvement of operations includes (Chopra andMeindl, 2001): decrease in lead time and the quantity of order i.e. decrease stock. Safety stock shouldbe decreased as we move up the supply chain and maximum stock level should be limitied(Buchmeister, 2008). By decreasing the replenishment lead time, uncertainty of demand can bedecreased, and this is achieved by increasing manufacturer flexibility and electronic exchange ofinformation (Chopra and Meindl, 2001). A decrease in quantity of goods ordered, decreases demandvariance between specific supply chain phases. The main obstacle for this decrease is the transportcost, if the cost is fixed for a vehicle. The solution is to load the vehicles with smaller quantities ofproducts, if they can be transported together. This increases the cost of delivery, but it can be regulatedby implementing a technology which simplifies the delivery process. One of the convenient ways fordecreasing transport costs is the so called milk runs, which means that one vehicle transports a smallerquantity of a product for more retailers. Another way of having smaller orders are incentives forcustomers when ordering, so that demand is leveled in time (Chopra and Meindl, 2001).
6. Strategic pricing and stabilization of orders encourage retailers to order goods in smaller quantitiesand thus reduce the forward buy. If they are offered a discount on the total amount of goods purchasedwithin a certain longer period, this will reduce the size of orders at shorter intervals. It is possible tocompletely eliminate promotions and charge every day low prices (EDLP - Every Day Low Price), limitthe amount of goods that may be ordered or bound the size of promotions offered to retail to the amountsold to the end user.
1251
3. BEHAVIOURAL CAUSES OF THE BULLWHIP EFFECT AND DECRESAING THE EFFECT OF BEHAVIOURAL CAUSES OF THE BULLWHIP EFFECT
The second category of the causes for the bullwhip effect are behavioral causes, which refer to a bounded rationality of the decision maker, particularly on wrong account of feedback and time delays, and can be classified into five groups. 1. The causes of imbalance can be external, such as change in customer demand which is not timely
forecasted. However, if the decision makers doubt that their suppliers and customers would make wrong decisions, they may drop the balance strategy to provide stocks for the case of non-optimal behavior of partners. These are internal causes. Uncertainty caused by internal actions of partners in a supply chain can be labeled as coordination risk (Croson et al., 2004).
2. If the participants cannot predict how other supply chain partners would act, because they have limited
knowledge or insufficient trust in the motives or cognitive abilities of the partners, variance in demand arises (Croson et al., 2004). This is not only the distrust that other participants would obey the rules; it is the distrust that they would know how to implement a rule. Lack of trust leads to work doubling. The more important the available information is, the more likely it is that it has not been shared or that it is ignored, because it is not trusted (Chopra and Meindl, 2001).
3. Sterman (1989a) and Croson and Donohue (2006) have shown that the supply chain partners behave as
if there are oscillations in demand even when there are none, thus causing the bullwhip effect, which indicates cognitive limitations of the participants in causing the bullwhip effect. People find it difficult to simultaneously monitor and reflect on their inventory, inventories in progress, how much has been ordered, what the unmet demand is and how much to order. The way in which the participants are presented with the simulation game can affect their way of thinking. They think more about movement, changes and differences than stock. If the participants’ calculations in a way emphasize lead time, for example, the participant takes the time into calculations more often and shows better results (Schaffernicht, 2006). Participants perceive their actions locally and cannot see the impact of their actions on others. Thus, a participant does not learn from their own actions, because the consequences of certain actions are best reflected elsewhere (Chopra and Meindl, 2001).
4. People often order based on the shortage between the target and current stock levels, ignoring the
amount they have ordered, which has not yet arrived. If the system is out of balance, rational decision makers will try to restore the system back into balance, but if they apply sub-optimal decision making rules based on inadequate mental models, they can increase the imbalance and get into an infinite loop. Various authors (Sterman 1987, Kampmann, 1992, Diehl and Sterman, 1995, Croson and Donohue, 2006) showed that even when all participants know what the optimal ordering policy is and when demand is constant and known to all, still the majority of participants underweight the supply line. This proves that the bullwhip effect is partly a behavioral phenomenon. Participants react to the current local situation, before identifying the problem model for the whole chain (Chopra and Meindl, 2001).
5. Some personality traits may influence the decision-making process. Ruel at all. (2006) examined the
extent to which risk taking, ambiguity, self-efficiency and locus of control may influence decision-making and performance. Self-efficiency can be described as a person’s belief in their ability to perform a task. Locus of control is a tendency of people to attribute the causes of their behavior either to themselves (internal) or to environmental factors (external). People with an internal locus of control believe that they can control their results, and people with external locus find that their results are a product of circumstances that are beyond their power. People who are prone to risk have higher backorder costs than those who are moderately or highly prone to risk. The authors believe that such persons are cautious when placing orders, and it happens that they have insufficient stock. Only the manufacturers had positive stocks, but they also had a lower level of stock than manufacturers who are more prone to risk. Retailers who are less prone to risk place larger orders on average when compared to people who are more prone to risk on the same position. It is highly probable that people, who are less prone to risk, react more slowly to changes in demand, but when they respond, they place larger orders. As a result of this behavior, retailers who are not prone to risk cause a greater bullwhip effect and incur higher costs. In contrast, wholesalers, distributors and manufacturers who are not prone to risk and behave the same way, cause a smaller bullwhip effect and have lower costs, because in these positions it is better to react more slowly to changes in demand. People who perceive themselves as less efficient, have higher costs due to lack in stocks, but lower storage costs in comparison to the people who see themselves as more efficient. People prone to risk react more quickly, which proved to be good in the position of a retailer, but bad in other positions. People who prefer unambiguous situations have higher costs due to shortage in stocks, probably because people who like ambiguity feel better in ambiguous situations. The level of
1252
orders is higher as people are less inclined to ambiguous situations. People who have an external locus of control were making larger storage costs and placed larger orders. Participants blame each other for the variability of demand (Chopra and Meindl, 2001). Nienhaus et al. (2006) and Nienhaus (2002) have identified two extreme types of behavior called “safe harbor” and “panic”. “Safe harbor” means that people order more than they need to ensure the level of safety stock. This increases their stock, but forces their suppliers to either increase their orders or to pay for unmet demand. “Panic” means that a participant just forwards the orders placed, and empties their warehouse at the beginning. Initially, it does not affect other participants, but if the end-user demand increases, a participant behaving this way must order more than a participant with safety stocks would. This is when this strategy is having the same negative effect as the previous one. The authors have showed that the optimal value is attainable only if a player is a computer. The more people participate in the simulation, i.e. as more people take part, rather than a computer, the result is worse. If a player chooses the “panic” strategy, they pay high penalty, and if the strategy “safe harbor” is played, they pay high storage costs (Nienhaus, 2006).
Decreasing the Influence of Behavioral Causes of the Bullwhip Effect
Croson and Donohue (2006) showed that, after the common knowledge and trust that everyone will make optimal decisions has been established, providing additional stocks does not eliminate the risk of coordination, but reduces order oscillations that could occur due to internal risk of wrong decision making. Therefore, the authors introduce the concept of coordination stocks. Unlike safety stock, which protect against external uncertainty, coordination stocks provide protection from non-optimal decisions of the participants in the chain. In addition, to overcome the coordination risk, a common knowledge about optimal orders should be created, to reduce the effects of suboptimal activities (Croson et al., 2004).
Long-term relations between the participants in a supply chain change the supply chain performance (Chen et al., 2012). Belavina and Girotra (2001) showed that in the case of one-off sales, a centralized supply chain generates higher gross profit, and individual participants generate higher profits in a centralized supply chain. If the sale is repeated, as long as the participants behave in the agreed manner, balance is maintained. If a participant disturbs the balance by deviating from planned actions, other participants also deviate, i.e. take punitive action, as they have strategic memory which influences decisions in subsequent periods if the sales repeat (Belavina and Girotra, 2001). If the sale is repeated, a decentralized supply chain generates higher profit than a centralized.
All of these actions are much more successful if there is trust and strategic partnerships within the supply chain. This ensures more successful information sharing and the reduction of prices between phases of the supply chain. Successful cooperation is beneficial when executing a specific task around which partners work together, but also improves the quality of the relationship between the partners. The highest value of better relations between a supplier and its customer is a satisfied end user. The basic purpose of cooperation between the participants in a supply chain is the reduction of costs and the possibility to give the customer a better offer, so that supply chains compete, rather than companies within a supply chain. Collaboration means that two or more companies share responsibility for the exchange of mutual information on planning, management, execution and performance measurement. There are two types of collaboration in a supply chain (Barratt, 2004 in Van de Vijver, 2009): vertical, between different levels of a supply chain and horizontal, between participants on the same level, but from a different supply chain. The elements necessary for successful collaboration are (Barratt, 2004 in Van de Vijver, 2009): Trust – reliance on an exchange with a partner who we trust Mutuality – mutual benefit and risk sharing Information sharing – transparency and quality of information flows Communication and understanding – clear lines of communication Openness and honesty – results in high level of trust, respect and devotion.
A research conducted by Mentzer, in Poirier (2002) identified enablers, impediments and benefits from collaboration in supply chains. Enablers are: Common interest and clear expectations – All participants should take part in the results of collaboration
in order to achieve long-term cooperation. Everyone should have a clear understanding of what isexpected from them.
Openness and trust – For a partnership to be functional, all participants should speak openly about theirpractices. This sometimes means sharing confidential information and it is necessary for the partners tobe responsible and ethical.
Acknowledging who and what is important – The participants and activates that bring most benefitshould be selected.
Leadership – A leader who supports collaboration is essential.
1253
Cooperation, non-punishment – When things do not go as planned, punitive actions sometimes help, but an appropriate approach for good cooperation is collaborative problem solving.
Benefit sharing – Partners should share both benefit and damage. Impediments, i.e. obstacles to collaboration and their consequences are (Van de Vijver, 2009): Lack of mutual commitment – partners are not motivated to cooperate with each other Unclear roles and responsibilities – partners are dissatisfied with relations, because they feel the other
partner is not meeting the responsibilities Insufficient information on the added value of collaboration – partners are insufficiently interested in
collaboration Opportunistic behavior of partners – partners lose trust. Based on the experiences of 20 professionals in managing supply chains from various sectors and industries, Quinn (2000) concludes that collaboration in supply chains can bring benefits if the enablers are in the right place and if the impediments can be overcome. Enablers have more to do with the style of management and interpersonal relationships, than with technology. Collaboration is a process which evolves through three stages (Lapid et al. 2002): Initial level of collaboration, where chain members exchange information to complete day-to-day
transactions Cooperative collaboration, where chain members have simultaneous access to information needed Cognitive collaboration, where chain members share information to collaboratively increase the level of
knowledge and make decisions - “win-win” partnership. Relations within a supply chain can be based on either power or trust. If the relations are based on power, in the long term it leads to increased profits of one participant at the expense of others, and others are seeking alternative ways to survive. If the balance is once disturbed, unjust division may be detrimental to the company. The more powerful party has greater control and the ability to profit at the expense of the weak. Relations should be beneficial for both parties. The stronger party must accept its responsibility for partner profitability. Relationships based on trust imply that every participant is interested in the welfare of others and that they will not act without taking into account the impact of their actions on others. Trust can be based on retention or built through various formal contracts, or based on a process where trust is built over time as a result of long-term cooperation between two or more groups. It is most common to start with the trust based on a contract, which then evolves into process trust. The ways companies can have a positive influence on the development of partnerships are (Van de Vijver (2009): transparency with the aim of avoiding suspicion, teams whose members are from two/more companies working in the same office on solving a common problem, defining the common key performance indicators, face to face meetings. Chopra and Meindl (2001) propose the following activities for successful coordination: Measuring the bullwhip effect Devotion to coordination on the part of top management Allocation of resources to coordination Focus on communication with other phases Tendency to achieve coordination in the whole supply chain Use of technology for improving connections and communication within the chain Division of benefit from just coordination As for interpersonal aspects of collaboration, three aspects are mainly discussed: 1. the influence of emotions (Andersen and Kumar, 2006, Hutt et al., 2000, Bagozzi 2006), 2. the role of trust (Jap and Anderson, 2003, 2005, Jeffries and Reed, 2000) and 3. the importance of maintaining relationships (Welling and Kamann, 2001, Ulaga, 2003). Interpersonal trust has the most positive effect when opportunism is low. However, if the inclination to opportunism is high, confidence can be harmful and show its “dark side” and even induce opportunistic behavior on one side. One of the ways of increasing trust and improving relationships is socialization, which represents “interactions and communication between participants and between organizations, whose aim is to build rapport and improve communication and problem solving”. It was found that there was a significant positive impact of socialization on supply chain performance; however, if there is a previous bad experience with partners, socialization does not give expected results (Van de Vijver, 2009).
1254
4. CONCLUSION
The paper gives an overview of the causes of the bullwhip effect, both operational and behavioral, as well as modes of overcoming them. Although the authors agree that the bullwhip effect is to some extent a behavioral phenomenon, behavioral causes are rarely investigated. Therefore, further research could take this course. Since supply chain management and the reduction of the bullwhip effect emphasize the importance of cooperation, further research could examine the impact of cooperation between participants in a supply chain on the bullwhip effect.
REFERENCES
Ameera Aly Ismail (2007). A Simulation Model to Investigate Critical Factors Influencing the Bullwhip Effect in a Supply Chain, Faculty of Management and Information Systems, The French University in Egypt, Retrieved from http://oro.univ-nantes.fr/sujets-09-10/aly.pdf
Anderson, E., Jap, S. D., (2005). The dark side of close relationships, MIT Sloan Management Review, 46(3), 75-82
Andersen, P. H., Kumar, R., (2006). Emotions, trust and relationship development in business relationships: A conceptual model for buyer-seller dyads, Industrial Marketing Management, 35 (4), 522-535.
Ayers, J.B. (2006). Handbook of Supply Chain Management, (2nd ed.) Taylor & Francis Group, Boca Raton, USA.
Bagozzi, R.P. (2006). The role of social and self-conscious emotions in the regulation of business-tobusiness relationships in salesperson-customer interactions, Journal of Business & Industrial Marketing, 21 (7), 453-457.
Bandura, A., (1977). Self-efficacy: Towards a unifying theory of behavioural change, Psychological Review, 84, 191-215.
Blanchard, D., (2010). Supply Chain Management Best Practices, John Wiley & Sons, Inc., Hoboken, New Jersey.
Baiman, S., Fischer, P.E., Rajan, M.V., (2001). Performance measurement and design in supply chains, Belavina E., Girotra K., The Benefits of Decentralized Decision-Making in Supply Chains, Management Science, 47(1),173-188
Bourland, K., Powell, S., Pyke, D., (1996). Exploring timely demand information to reduce inventories, European Journal of Operation Research, 92, 239-253.
Buchmeister, B., (2008, January). Investigation of the bullwhip effect using spreadsheet simulation, International Journal Of Simulation Modelling, 7(1), 29-41.
Buchmeister, B., Pavlinjek, J., Palcic, I., Polajnar, A., (2008). Bullwhip effect problem in supply chains. Advances in Production Engineering and Management, 3(1), 45-55.
Cachon, G.P., Zipkin, P.H., (1999). Competitive and cooperative inventory policies in a two-stage supply chain, Management Science, 45(7), 936-853
Carlsson, C. and Fuller, R. (2002). A fuzzy approach to taming the bullwhip effect. In Advances in Computational Intelligence and Learning: Methods and Applications, Deventer, The Netherlands, The Netherlands. Kluwer, B.V., 247-262.
Chen, F., Drezner, Z., Ryan, J., Simchi-Levi, D. (2000). Quantifying the Bullwhip Effect in a Simple Supply Chain: The Impact of Forecasting, Lead Times, and Information. Management Science, 46(3), 436-443.
Chen, L., Gilbert, S., Xu, X., (2012). The role of revenue-focused managerial performance in supply chain coordination, Production and Operations Management.
Chopra, S, Meindl, P., (2001). Supply Chain Management: Strategy, Planning, and operation, Prentice Hall, Upper Saddle River, New Jersey
Croson, R.T.A., Donohue, K.L., Katok, E., Sterman, J., (October 2004).Order Stability in Supply Chains: Coordination Risk and the Role of Coordination Stock, MIT Sloan Working Paper 4513-04. Retrieved from http://www.utdallas.edu/~emk120030/Order_Stability_0719.pdf
Croson, R., Donohue, L., (2006, March). Behavioral Causes of the Bullwhip Effect and the Observed Value of Inventory Information, Management science, Vol. 52, No. 3, 323-336, DOI 10.1287/mnsc.l050.0436
Diehl, E., Sterman, J.D., (1995). Effects of Feedback Complexity on Dynamic Decision Making. Organizational Behavior and Human Decision Processes 62 (2), 198-215.
Forrester, J. (1958, July - August). Industrial dynamics, a major breakthrough for decision makers. Harvard Business Review, 36, 37 -66.
Forrester, J. (1961). Industrial Dynamics, MIT Press, Cambridge MA. Gangopadhyay, A., Huang, Z. (2004). Studying the Value of Information Sharing in E-Business Supply Chain
Management, Journal of International Technology and Information Management, 2004 13(1), 49-60 Goodwin, J., Franklin, S. (1994). The beer distribution game: using simulation to teach systems thinking,
Journal of Management Development, 13(8), 7-15.
1255
Hutt, M. D., Stafford, E. R., Walker, B. A., Reingen, P. H., (2000). Defining the social network of a strategic alliance, Sloan Management Review, 41 (2), 51-62
Jap, S. D., Anderson, E., (2003). Safeguarding interorganizational performance and continuity under ex post opportunism, Management Science, 49 (12), 1684-1701.
Jeffries, F. L., Reed, R., (2000). Trust and adaptation in relational contracting, Academy of Management Review, 25 (4), 873-882.
Jovanović, B., Vasiljević, D., (2008). Kolaboracija u lancu snabdevanja, VI Skup privrednika i naučnika SPIN 2008, Operacioni menadžment i evropske integracije, Zbornik radova, Centar za operacioni menadžment, FON i Privredna komora Srbije, Beograd, 252-256.
Kampmann, C.E., (1992). Feedback Complexity and Market Adjustment: An Experimental Approach, PhD Dissertation, Sloan School of Management, MIT, Cambridge, MA.
Lapide, L., Derome, J., Radjou, N., (2002, April). Analysts’ panel discussion, Supply Chain World North America : Extending Collaboration to End-to-End Synchronization in: Ayers, J.B. (2006), Handbook of Supply Chain Management (2nd ed.) Taylor &Francis Group, Boca Raton, USA, 96.
Lee, H., Padmanabhan, V., Whang, S. (1997a). Information Distortion in a Supply Chain: The Bullwhip Effect. Management Science, 43(4), 546-558.
Lee, H., Padmanabhan, V., Whang, S., (1997b). The bullwhip effect in supply chains, Sloan Management Review, 38(3),93-103.
Lee. H.L., Whang, S., (2000). Information sharing in a supply chain. International Journal of Manufacturing Technology and Management 20(3/4), 373–387.
Li J., Sikora R., Shaw, M.J., Woo Tan, G., (2006). A strategic analysis of inter organizational information sharing, Decision Support Systems 42(1), 251–266.
Nienhaus, J., (2002, October). What is the Bullwhip Effect caused by?, Study based on the Beer distribution Game online, Supply Chain World Europe 2002, Amsterdam, 28-30
Nienhaus, J., Ziegenbein, A., Schoensleben, P., (2006). How human behaviour amplifies the bullwhip effect, A study based on the beer distribution game online, Production Planning and Control, 17(6),547 - 557.
Poirier, C., (2002). The Supply Chain Manager’s Problem-Solver: Maximizing the Value of Collaboration and Technology, St. Lucie Pres, A CRC Press Company, Boca Raton London New York Washington, D.C.
Quinn, F., (2000). Collaboration: More than Just Technology, The Aspect Project, Accenture Publication, New York, 222–223.
Renko S., Vertical Collaboration in the Supply Chain Faculty of Economics & Business, University of Zagreb, Croatia DOSTUPNO U SUPPLY CHAIN MANAGEMENT - NEW PERSPECTIVES, Edited by Sanda Renko
Rotter, J.B., (1990). Iinternal versus external control of reinforcement: A case history of a variable, American Psychologist, 45, 489-493
Ruël, G., van Donk, D.P., van der Vaart, T., (2006, June). The Beer Game Revisited: Relating Risk-Taking Behaviour And Bullwhip Effect, Proceedings of the 13th International EurOMA Conference, Glasgow, Scotland, 1, 403-412, Retrieved from http://www.bdk.rug.nl/organisatie/clusters/PSD/pdf/Euroma2006RuelDonkVaart.pdf
Simchi-Levi D., Kaminsky, P., Simchi-Levi, E., (2000). Designing and managing the supply chain: concepts, strategies, and case studies, Boston: Irwin/McGraw-Hill.
Schaffernicht, M., (2006). Modifying the Beer Game to make its dynamic structure more salient, Proceedings of the 24th International Conference of the System Dynamics Society
Sterman, J.D., (1987). Testing Behavioral Simulation Models by Direct Experiment. Management Science 33 (12), 1572-1592.
Sterman, J. (1989). Modelling managerial behaviour: Misperceptions of feedback in a dynamic decision making experiment, Management Science, 35(3), 321 -339.
Ulaga, W., (2003). Capturing value creation in business relationships: A customer perspective, Industrial Marketing Management, 32 (8), 677-693.
Van De Vijver, M., (2009). Collaboration in Buyer-Supplier Relationships, Phd Thesis, Retrieved from http://arno.uvt.nl/show.cgi?fid=90480
Vujošević, M., Panić, B., (2004, April). “Efekat biča i metode koordinacije u lancima snabdevanja”, E-trgovina 2004 International e-business conference, CD, http://events.e-trgovina.co.yu/2004/index.html
Vujošević, M., (2004, September). “Kooperacija i koordinacija kao uslov uspešnosti lanaca snbabdevanja”, XI naučni skup Tehnologija, kultura i razvoj, Palić, 110-19.
Welling, D. T., Kamann, D.J. F., (2001). Vertical cooperation in the construction industry: Size does matter, Journal of Supply Chain Management, 37 (4), 28-33.
Wu, D., Katok, E., (2006, December). Learning, Communication and the Bullwhip Effect, Journal of Operations Management, 24(6), 839–850
Abstract: This article deals with three concepts of maintenance management: (i) Total Productive Maintenance (TPM), (ii) Reliability Centered Maintenance (RCM) and (iii) Life Cycle Cost (LCC). The article is based on the works of prominent and distinguished authors in the field of maintenance concepts. The purpose of the article is to compare these concepts: their goals, methods they are based on, system reliability, system failure, their costs, advantages and disadvantages and other characteristics. The original result achieved through this analysis is a systematic representation of the three concepts with their main advantages and disadvantages, which should be useful to maintenance managers and anyone who is engaged in maintenance management.
Keywords: Total Productive Maintenance, Reliability Centered Maintenance, Life Cycle Cost, advantages, disadvantages, criteria
1. INTRODUCTION
Subject of this work are management models, total productive maintenance, reliability centered maintenance and terotechnology (product economic lifecycle) and their analysis.
The goal of the research is a comparative analysis of management models with the aim of determining advantages and shortcomings of each model, as well as possibilities of their integration to achieve maximal performances of technical systems.
In the second chapter of this paper the theoretical background is given. An overview of the chosen models is given in third, fourth and fifth chapter, while the sixth chapter, named Comparative analysis, shows tabular review of the mentioned models comparison. This chapter considers resemblances and differences between the models and potential for their integration in order to attain minimal maintenance costs. In the final, seventh chapter the authors’ conclusion and suggestion about further analysis are given.
2. THEORETICAL BACKGROUND
Literature shows that manufacturing organizations worldwide are faced with numerous challenges in trying to operate successfully in today’s competitive environment. Modern production requires organizations to have effective and efficient maintenance in order to be successful.
During the past two decades, manufacturing organizations used different approaches in order to improve maintenance effectiveness as said in Roup, J. (1999), (p. 5-32). One approach for improvement of maintenance activities is implementation and development of Total Productive Maintenance (hereinafter: TPM) strategies. Moore, R. (1997), (p.88-90) said that implementation of TPM enables organizations to substantially transform their factories by integration of culture, process and technology, .
TPM concept originated from the Japanese production industry (adopted in Japan in 1951). It was initially aimed at elimination of production loss due to limitations in JIT (just in time) process in production. Seiichi Nakajima, the vice president of Japanese Institute of Plant Engineering, promoted TPM in Japan and became known as the father of TPM. Contemporary equipment management was started by preventive maintenance and developed into productive maintenance. TPM is based on teamwork and inclusion of all levels and functions in an organization, from the top management to the manufacturing workers.
Numerous researchers emphasized the importance of TPM implementation, both in production environment Ahmed, S., Hassan, M.H. & Taha, Z. (2005) and Ahuja, I.P.S. & Khamba, J.S. (2007), and service sector Patra, N.K., Tripathy, J.K. & Choudhary, B.K. (2005) and Pramod, V.R., Devadasan, S.R., Muthu, S., Jagathyraj, V.P. & Moorthy, G.D. (2006). TPM is considered to be a Japanese response to American approach to Preventive maintenance as it said in Wal, R.W.E. & Lynn, D. (2002). It is widely recognized as a strategic tool for improvement of production performances by boosting effectiveness of production plants Dwyer, J. (1999) and Dossenbach, T. (2006) and it was accepted as the most perspective strategy for maintenance improvement, aimed to achieve success at high-demanding market in Nakajima, S. (1988). It is a proven production strategy, which has been successfully applied worldwide in the past three decades for
reaching organizational goals related to achievement of essential competence in competitive environment like it was discussed in Ahuja, I.P.S., Singh, T.P., Sushil, M. & Wadood, A. (2004) (p. 422-426)
Problems with Reliability Centered Maintenance have been studied for a long time by numerous scientists and experts in this field. Best known works regarding reliability centered maintenance are: Heap, F. H., & Nowlan, F. S. (1978) and Moubray, J. (1997) and there is also a large number of works dealing with this issue. All these works are more focused on maintenance than reliability. Prominent author Smith, A. M. (1993) said: “(…) How to introduce RCM model depends on experience of owner and employees.”
Back in December 1978, Heap, F. H., & Nowlan, F. S. (1978), have published the report “Reliability Centered Maintenance”. The report was the result of a multi-annual work aimed at finding a new, cost-effective model for maintenance of complex systems. It was named Reliability Centered Maintenance (RCM) because it was focused on safety and reliability of equipment and minimization of costs. Until then, managers usually practiced repair of all machines as a way to prevent failures. Gradual development of RCM model in American aviation industry has lead to the application of this approach in other industries. If proper tools and procedures are applied, RCM model is simple to apply and reduces the costs and risks in a system.
According to Gibbons, P., & Friis, J. (2013) RCM is: “Approach using reactive, proactive and preventive maintenance and strategies in integrated manner, in order to increase probability that machine or component will operate in demanded mode during its overall economic life, with minimal maintenance. In Technical Manual (2006) (p. 4), it is written that savings after introduction of RCM model at annual level are between 30 and 50%.
The Oxford Dictionary Oxford Dictionary website – 2013 defines terotechnology as “the branch of technology and engineering concerned with the installation and maintenance of equipment” (downloaded from The Oxford Dictionary website, 2013). However, this definition does not explain the essence of the term – there are other concepts concerned with sustainability (such as RCM and TPM), while terotechnology is just one of them. The main idea behind terotechnology is that the domain of sustainability management should not only include the period of system technological use, but also the whole system life cycle. In other words, as defined by the British Standard BS:3811, terotechnology is "A combination of management, financial, engineering, building and other practices applied to physical assets in pursuit of economic life-cycle costs." (downloaded from the website www.plaint-maintenance.com, 2013).
The term terotechnology first appeared in 1971 when the Supplement to Radio and Electronic Engineer published the article “Terotechnology – A New Approach to An Old Problem” by professor Leonard Atkinson. Atkinson claimed that sustainability system, which was in use at that time, is set up too narrowly and that a lot of savings could be achieved by taking into account the system life cycle cost (downloaded from the IeeeXplore website, 2013).
Today, the term terotechnology is mainly obsolete, and replaced with the term life cycle cost (LCC). Therefore, the term life cycle costs will be used in this article, along with the references concerning the LCC analysis. It is important however, to stress that LCC approach as known today, in addition to its implementation in the field of sustainability management, could also be used in project management, product analysis and other areas. Ralph Horne, Tim Grant and Karl Verghese (2009) in their book “Life Cycle Assessment: Principles, practice and Prospects”, claim that the LCC concept is created with a new generation of energy technologies in the post-World War 2 era. As more complex nuclear technologies were developed, more researches were conducted in order to answer questions such as whether a given nuclear technology produced more energy than it consumed as well as analyses of uranium mining, waste management, and transportation impact. Further, such researchers followed to development, marketing and service management sectors, i.e. to all LCC costs related to nuclear power plant‟s management and usage. In time, this approach started to be applied in other fields, such as maintenance management. (p.2)
3. TOTAL PRODUCTIVE MAINTENANCE
As it was noted in Suzuki, T. (1994) Total productive maintenance can be regarded as a machine medicine. It is a maintenance program which includes a new definition of the concept for plants and equipment maintenance. The goal of this program, particularly emphasizing maintenance, is to significantly increase production and simultaneously raise employees moral and job satisfaction and to reduce urgent and unscheduled maintenance to the minimum.
Japan Institute of Plant Maintenance defines TPM as:
T = Total – Inclusion of all employees at each level of organization P= Productive – Efficient use of all resources M = Maintenance – Maintenance of Staff/Machines/Materials in optimal condition
1258
TPM is an innovative Japanese maintenance concept. Its roots go back to 1951 when preventive maintenance concept, accepted from USA, was introduced for the first time in Japan. Nippondenso was the first company introducing preventive maintenance in 1960. Combination of Preventive Maintenance concept, Prevention of Maintenance concept and Improving Maintenance concept resulted in Productive maintenance concept as it was stated in Venkatesh, J. (2007). The goal of productive maintenance was maximal effectiveness of plants and equipment:
1. Achieve minimum 90% OEE (Overall Equipment Effectiveness); 2. Machine should work during breaks as well (Breaks are for staff, not for machines); 3. Run business with no complaints of consumers; 4. Reduce production expenses by 30%; 5. Achieve 100% success in goods delivery in accordance with buyers‟ demands; 6. Keep working environment safe; 7. Increase by three times employees suggestions for improvements and in this way develop multi-
skilled and flexible workers.
The main system of measurement connected to TPM is Overall Equipment Effectiveness (OEE) which was originally developed in Japan in the 70‟s as a system for determining production effectiveness. It includes three basic indicators of equipment performances and reliability like it was said in Gupta, A.K., & Dr. Garg, R.K., (2012), (p.1-2). Hence, OEE is function of three following factors:
1. Availability or readiness (deadlocks; scheduled and unscheduled, replacement of tools, service of tools, change of work)
2. Equipment effect ratio (real capacity compared to the incorporated one) 3. Participation of accurate products in overall number of products (malfunctions and reproduction)
TPM reminds of Total Quality Management – TQM concept. Many of tools, such as encouraging employees to take active part in increasing effectiveness process and benchmarking, used in TQM concept are also included in TPM concept.
4. RELIABILITY CENTERED MAINTENANCE
According to Rausand, M., & Vatn, J. (1998), (p.1-26) main goal of RCM model is to provide effective and applicable maintenance, taking into consideration four factors: safety of staff, impact to environment, production capacities of company and material losses (costs). Effective maintenance requires an increase of reliability in order to provide better safety of staff and, in so doing, to ensure better production capacity. By increasing production capacities, costs are reduced, as well as losses due to failures. By applying contemporary methods and appliances in the production process, harmful effects to environment are reduced and reliability of systems is increased. The conclusion is that the main goals are maximal reliability and minimal costs, which contributes to increased safety of staff and productivity.
RCM model determines conditions that must be fulfilled so that a physical device, in its operating context, could continue to work in a way that consumers expect. Smith, A. M. (1993) stated that RCM approach has four key features. Each of these is defined and discussed here.
The most important feature of RCM is maintenance of continual equipment functionality of overall system. The fact is that equipment functionality has to be provided so that overall system could be effective, but RCM approach starts from the desired output, as a primary task. The basic idea is to establish necessary functions for creation of the final product and then provide equipment functionality which performs these functions.
The next feature is based on functionality failure, in other words, loss of system function. It is necessary to study all potential in the state of equipment, in order to determine possible deadlocks and failures. The main goal is to identify possible failures in equipment components, which could potentially endanger system functionality.
The third feature of the RCM approach means defining priorities as a basis for establishing the distribution of resources and budget. Here, the goal is to define which failures have more importance and, according to defined priorities, to remedy them. Distribution of priorities is based on „‟decision tree‟‟ method.
Previously mentioned features help to establish location of failure occurrence, cause of occurrence, as well as priority for taking measures to remedy these failures. The next step (i.e. the fourth feature of RCM) is to apply appropriate methods for failures removal, which must be applicable and effective. The idea is to carry out only applicable methods for failures removal which are the most convenient as well. By doing so, we can prevent removal of failures with minor priority, in order to prevent unnecessary waste of limited resources.
RCM approach combines different models such as preventive, proactive maintenance, „‟work until failure‟‟ and uses advantages of each model to provide equipment effectiveness and functionality at lowest costs.
1259
Advantages achieved by application of this approach have already been proved in numerous industries: military industry, aviation, navy, chemical industry, oil industry, small and middle size companies, as well as in hospitals, railroads, ships, wind turbines. According to Smith, A. M. (1993) key advantages are: improvement of system performances, lower maintenance costs, longer economic life of equipment, simple database maintenance, minimization of repairs, risks included in analysis, better staff motivation, teamwork. Shortcomings of this model are mentioned on the website Energy.Gov (2013) and they are: high costs for staff training and teaching, as well as longer necessary time frame to achieve results through return of investments.
From the text above it can be concluded that RCM approach has four basic tasks:
Machine maintenance Indentifying possible causes of machine failures Lowering costs Extending the life cycle of machines
5. LIFE CYCLE COST
The core idea of the LCC approach is usually presented with the famous “tip of the iceberg” metaphor. When a company purchases expensive installations and systems, it is a big mistake to take into account only acquisition costs. They are the tip of the iceberg. In the effort to minimize costs, a company often focuses on activities that will reduce its short-term costs, which could have a very negative effect on its long-term costs. Therefore, when a company considers the acquisition of some equipment, it should also take into account the labor costs, operating costs, scheduled maintenance costs, unscheduled maintenance costs and conversion/decommission costs. Paul Barringer (2007) in his article Life Cycle Cost & Reliability for Process Equipment state that these are the key elements of the LCC structure which should be assessed prior to purchase of equipment, as well as for product pricing calculation (p.6).
The object of LCC analysis is to choose the most cost-effective approach from a number of alternatives so that the least long term cost of ownership is achieved. LCC analysis helps engineers to justify equipment and process selection based on total costs, rather than making decision on the initial equipment/services purchase price only. Furthermore, the LCC could be used for the system effectiveness calculation. System effectiveness is derived from the relationship between LCC and technical effectiveness. This relationship can also be used as a benchmark, i.e. as a basis for the two systems comparison. This is also a statement claimed by Paul Barringer (2008) in his article Life Cycle Cost And Good Practices (p.7).
Christer Idhammar, Reliability and Maintenance Management Consultant and Vice President of IDCON said that the concept of Life Cycle Cost is not properly practiced in many organizations because management is often focused on short-term cost reductions instead on what drives the cost. He gives two main examples to illustrate the importance of understanding the total amount of costs in a company. One example is about a preventive maintenance program. A good preventive maintenance program reduces final costs, but it costs money to be implemented in mid-term. Although some effects could be seen after a year, significant results emerge only after three to five years. Due to staff turnover, it often happens that the management team that carried out LCC implementation left the company and could not claim the results. Selection of equipment based on Life Cycle Cost is another example. The proper equipment might cost more, but cost of ownership is lower. Therefore, understanding the whole picture, in the process of equipment or system acquisition is the key issue of the LCC approach (downloaded from the website www.idcon.com, 2013).
6. COMPARATIVE ANALYSIS
One of the essential criteria in comparison of these three models is their focus, i.e. a particular field affected by the models to achieve their goal. These criteria make substantial difference between the three models. It is also significant to point out the origin of each model in order to make it easier to understand the concepts they are based on. The approach to employees is one of the criteria giving insight into the models and it shows that they are applied in organizations in approximately the same manner, which suggests the possibility of combining them to achieve the desired objective. The comparative analysis can be seen in Table 1 shown below. The table and the comparative analysis is the result of the work of the authors.
Basically, TPM approach is more focused on management, while RCM approach is more focused on engineering. LCC approach implies use of accounting methods and exercising different analyses to determine various costs, their bearers and position of costs. It would be wrong to say that these three approaches are not compatible, bearing in mind that they achieve the same goals in different manners.
Criteria Total productive maintenance Reliability centered maintenance Economic Life cycles costs
Origin Japan-car factory USA-military aircraft industry
USA and Great Britain – nuclear technology and aircraft industry
Focus Equipment (system input and causes of failure occurrence)
Reliability of system and equipment
Reduction of overall costs of economic life cycle of equipment
Applicability Car industry, microelectronics, movies, plastic, administration
Military industry, energetic, aviation, nuclear plants, wind turbines, small and middle size companies
Energetics, nuclear plants, aviation, big companies and supply chains
Costs Reduced (30-50%) Reduced (30-50%) Reduced up to 80-90%
System reliability Increased (10-250%) Increased (40-70%) /
Failure occurrence Reduced Reduced Reduced
Methods based Preventive, productive, improvement of maintenance, prevention of maintenance
Preventive, proactive, conditions centered maintenance, „‟work until failure‟‟
Preventive, proactive maintenance, accounting methods of costs conversion and , statistical methods of risk estimation and probability related to certain costs, long-term approach
Goals
-Increase OEE to 90%
-Consumer‟s satisfaction
-Reduction of production costs for 30%
-Safe working environment
-Safety of staff
-Reduced impact to environment
-Increase of production capacities
-Costs reduction
-Reduction of overall costs of system or equipment economic life cycle
-Calculation of price for customer
-Support in making decisions (selection among more equipment alternatives considering all costs)
Advantages
-Increase of equipment and machine effectiveness
-Increase of production quality
-Reduction of losses when production starts
-Reduction of maintenance time and costs
-Increase of performances
-Increase of staff and system safety
-Lower costs
-Longer economic life of equipment
-Minimization of repairs
-Motivated staff and team work
Minimization of overall equipment economic life cycle costs by long-term and comprehensive approach and analysis of all costs
Shortcomings -High cost for staff training who to deal with equipment maintenance
- High costs for staff training and teaching and equipment
- Potential savings are not easy to achieve
-Effects of application are noticeable after 3-5 years the least
-It requires collection and processing of large number of information from different company departments
- It requires close cooperation and team work of the employees from different company
1261
departments, which might be difficult to achieve
- Inconsistency in information processing and application of different accounting methods in different fields make results invalid
Approach to employees
-Staff practise self-maintenance
-Inclusion of all employees
-Staff development
-Inclusion of top management in early stage
-Circles of employees
-Expert team for introduction of RCM model
-Introducing model to all employees
-Association of employees from different departments
LCC approach requires team work and cooperation of employees from different departments in order to collect all necessary information about overall costs
In a technical system it is necessary to establish priorities on what is the first to be repaired or improved. It could be the purity of a system, inclusion of employees, preventive maintenance or environment issues. When every problem of one system is defined and when priorities are assigned, there is decision to be made regarding the maintenance type to be applied, with the possibility of combining RCM and TPM model. According to Moore, R. (1997) (p.88-90) RCM approach is based on establishing standards of preventive maintenance, and TPM approach carries out further improvement within the overall system. This is so called integrated system, aiming to take the best of each model in accordance with the company‟s goals. There is no conflict as long as powers of TPM approach supplement weaknesses of RCM approach and vice versa.
LCC approach enables consideration of the bigger picture. Each maintenance concept used in some system implies certain costs and resources, necessary for its application. LCC approach puts the scheduler in a position to assess costs of each maintenance model. Costs of maintenance models determined in this manner constitute the basis for their comparison. It is significant to mention that during comparison of different models only their distinguishing aspects are taken in consideration.
As a conclusion of this comparative analysis arises the viewpoint that TPM and RCM concepts could and should be combined, while LCC approach presents a tool for their costs comparison and independent method providing complete consideration of different systems.
7. CONCLUSION
The present work arrives at the conclusion that total productive maintenance is an approach that is primarily based on inclusion of all employees into the maintenance process, thus accomplishing minimum costs and optimal engagement of each individual in a company. As for reliability centered maintenance, it can be concluded that it is primarily a preventive model, aimed at improving the reliability of the overall technical system, through maintenance of critical components. By so doing, maintenance costs are reduced and economic life of equipment is extended, which leads to the increase of functionality and productivity of the overall system. The essence of the third model, LCC, is to provide significant support in decision making. It‟s vital feature and main advantage is in providing consideration of the bigger picture, in terms of time and value. Each of these models has its advantages and shortcomings and different approaches in the maintenance process. However, the possible conclusion is that the main goal of these models is minimization of costs in a technical system. According to the accomplished analysis, we can conclude that these models are mutually compatible, capable of being successfully combined within one technical system, in order to achieve minimal costs and maximal productivity.
8. REFERENCES Ahuja, I.P.S., Singh, T.P., Sushil, M. & Wadood, A. (2004). Total productive maintenance implementation at
Tata Steel for achieving core competitiveness, Journal of Manufacturing Technology Management, 45(3), 422-426.
Ahmed, S., Hassan, M.H. & Taha, Z. (2005). TPM can go beyond maintenance: excerpt from a case implementation, Journal of Quality in Maintenance Engineering, 11(1), 19-42.
Ahuja, I.P.S. & Khamba, J.S. (2007). An evaluation of TPM implementation in an Indian manufacturing enterprise'', Journal of Quality in Maintenance Engineering, 13(4), 338-352.
Barringer Paul, P.E., (2007). Life Cycle Cost & Reliability for Process Equipment. Paper presented at the 8th Annual ENERGY WEEK Conference & Exhibition.
1262
Barringer Paul, P.E., (2008). Life Cycle Cost And Good Practices. Paper presented at the NPRA Maintenance Conference.
Dossenbach, T. (2006). Implementing total productive maintenance, Wood and Wood Products, Journal of Quality in Maintenance Engineering 111(2), 29-32.
Dwyer, J. (1999). More than a maintenance technique, Works Management, 52(9), 15-16. Energy.Gov (2013). Reliability Centered Maintenance. Retrieved from http://energy.gov/eere/femp/reliability-
centered-maintenance Farr, J.V. (2009). System Life Cycle Costing: Economic Analysis, Estimation and Management, (3rd ed.).
Boca Raton Taylor & Francis, 1-6. Gupta, A.K., & Dr. Garg, R.K., (2012). OEE Improvement by TPM Implementation: A Case Study,
International Journal of IT, Engineering and Applied Sciences Research (IJIEASR), 1(1), 1-2. Heap, F. H., & Nowlan, F. S. (1978). Reliability Centered Maintenance. United Airlines and Dolby Press.
Glossaryy
Horn. R., Grant, T. & Vergese, K. (2009). Life Cycle Assessment: Principles, practice and Prospects, (3rd ed.). Collingwood, Vic. : CSIRO Pub.
IDCON (2013). Retrieved from http://www.idcon.com/resource-library/articles/maintenance-and-design-for-reliability/493-life-cycle-cost.html
IeeeXplore. (2013). Terotehnology: A new aproach to an old problem. Retrieved from http://ieeexplore.ieee.org/xpl/login.jsp?tp=&arnumber=5268645&url=http%3A%2F%2Fieeexplore.ieee.org%2Fiel5%2F5266378%2F5268644%2F05268645.pdf%3Farnumber%3D5268645
Igbaa, J., Kazem A., Anyanwu-Ebob, I., Gibbonsa P.,Friisb J. (2013). A Systems Approach towards Reliability-Centered Maintenance (RCM) of Wind Turbines, Paper presented at the Conference on Systems Engineering Research.
Moubray, J. (April 1997). Reliability-Centered Maintenance, (2nd ed.). New York : Industrial Press. Moore, R. (1997). Combining TPM and reliability-focused maintenance, Plant Engineering, 51(6), 88-90. Nakajima, S. (1988). Introduction to Total Productive Maintenance (2nd ed.). Cambridge, Mass. : Productivity
Press. Oxword Dictionaries. (2013). Terotechnology. Retreived from
http://www.oxforddictionaries.com/definition/english/terotechnology Patra, N.K., Tripathy, J.K. & Choudhary, B.K. (2005). Implementing the office total productive maintenance
('office TPM') program: a library case study, Library Review, 54(7), 415-424. Palival, S., Varshney, A.R., & Awanna, D.S., (2013). Relationship and comparison Between in JIT, TQM and
TPM: A Rewiew, International Journal of Mechanical Engineering Research and Development (IJMERD), 3(2), 64-65.
Plaint-maintenance (2013). Retrieved from http://www.barringer1.com/lcc.htm Pramod, V.R., Devadasan, S.R., Muthu, S., Jagathyraj, V.P. & Moorthy, G.D. (2006). Integrating TPM and
QFD for improving quality in maintenance engineering, Journal of Quality in Maintenance Engineering, 12(2), 71-150.
Rausand, M., & Vatn, J. (1998). Reliability Centered Maintenance, Risk and Reliability in Marine Technology, 1-26.
Roup, J. (1999). Moving beyond TPM to total plant reliability: redefining the concept to optimize benefits, Plant Engineering, 53(2), 5-32.
Smith, A. M. (1993). Reliability-centered maintenance. New York: McGraw-Hill Suzuki, T. (1994). TPM in Process Industries (1st ed.). Portland, Or. : Productivity Press. Technical Manual, (October 2006). Reliability-Centered Maintenance (RCM) for Command, Control,
Communications, Computer, Intelligence, Surveillance, and Reconnaissance (C4ISR) Facilities, 2-4. Venkatesh, J. (2007). An Introduction to Total Productive Maintenance, Plant Maintenance Resource
Center,1-21. Wal, R.W.E. & Lynn, D. (2002). Total productive maintenance in a South African pulp and paper company: a
case study, The TQM Magazine, 14(6), 359-366.
1263
NOVEL APPROACH TO BUSINESS PROCESS PERFORMANCE MEASUREMENT
Barbara Simeunović1, Milić Radović2, Dragoslav Slović3
Abstract: In the literature, as in practice, there are number of models and frameworks that provide guidelines for the performance measurement system development and review performance measurement problems from different perspectives. In the paper, some of the most important performance measurement models are considered, and it is noticed that the majority of models takes into account the strategy or goals while determining performance, most of them don’t specify performance indicators, but give an indication for their determination and none of them link directly organizational goals and performance indicators. In other words, none of them specify their interdependence, which would allow model flexibility. Furthermore, the novel approach to business process performance measurement is proposed, which starts from business system goals, decompose them on the lower level objectives and link them to the key processes of business system. Suggested approach allows interconnection between organization’s top level goals and key process performance indicators, by using lower level objectives, which enable model flexibility.
Keywords: process performance measurement model, objectives, performance indicator, flexibility
1. INTRODUCTION
Business processes performance measurement has began in the early 20th century, when, among the others, Frank and Lilian Gilbreth formally related performance measures to processes (Towers, 2005, p.10). Although much has changed in the meantime, the business process performance measurement practice of is becoming increasingly important. According to Antonucci at al. (2009, p. 11), it is the performance of the business processes, not the organizational functional units or a set of assets, that has to be manager’s central focus in order to gain true benefits of a performance management initiative. Through performance measurement, managers receive the information for defining, improving and managing the key business processes. Nowadays, there are a number of performance measurement models that include or strongly rely on performance planning, job design, performance measures determination and monitoring, and on the reward system definition (Sikavica and Hernaus, 2011, p.433). Those frameworks assist in this performance measurement system building process by clarifying boundaries, specifying dimensions or views and may also provide initial intuitions into relationships among the performance dimensions (Rouse and Putterill, 2003, p.792). In the paper, some of the most important performance measurement models are briefly described, as the results of their comparative analysis. After that, a new performance measurement approach is proposed, which overcomes some of the shortcomings of existing models. At the end, some conclusions are drawn, and direction of future research is proposed.
2. THEORETICAL BACKGROUND
Performance measurement systems models may be considered as a means of reaching performance objectives (Lisiecka and Czyż-Gwiazda, 2013). In the literature, as in practice, there are number of models and frameworks that provide guidelines for the performance measurement system development. The objective for such models is to help organizations to define a set of measures that reflects their objectives and assesses their performance appropriately (Kennerly and Neely, 2002, p. 146). Those models are multidimensional, balancing financial and nonfinancial measures. Some of them are: Activity Based Costing (ABC), developed by R. Cooper and R.S Kaplan (1991), has been promoted and
adopted as a basis for making strategic decisions and for improving profit performance (Cagwin andBouwman, 2002, p.1). ABC model assigns more accurately than traditional instruments, the costs of anorganization's activities to its products and processes (Kueng, 2000, p.69). ABC has emerged as atremendously useful guide to management action that can translate directly into higher profits Because
1264
ABC reveals the links between performing particular activities and the demands those activities make on the organization's resources it can give managers a clear picture of how products brands, customers, facilities, regions, or distribution channels both generate revenues and consume resources (Cooper and Kaplan, 1991, p.130).
Brown’s performance measurement concept (Brown,1996) shows links between five stages in a business process and their performance measures. These stages are defined as inputs, processing system, outputs, outcomes, and goals respectively. The model demonstrates how inputs to the organization affect the performance of processing systems and ultimately the top-level objectives of the organization (Kennerly and Neely, 2002, p. 147)
Balanced Scorecard proposed by Kaplan and Norton (1993) is a strategic management instrument: (1) to clarify and translate vision and strategy; (2) to communicate and link strategic objectives and measures; (3) to plan, set targets and align strategic initiatives; and (4) to enhance strategic feedback and learning (Kaplan and Norton, 1996, p. 10). The method looks at four interconnected perspectives: Financial, Customer, Internal business process and Learning and Growth. Customer satisfaction drives financial success; effective and efficient business processes ensure high levels of customer satisfaction; and sustained, continuous improvement enhances the organization’s operational performance (Franceschini at al, 2007, p.124)
Business System Design Decomposition framework (Taticchi at al, 2010), offers a holistic approach to performance measurement, identifies cause-effects relationships in business processes, measures the performance versus stakeholders and offers interlinking between performance indicators. BSDD is based on strengths of the Axiomatic Design and Analytic Hierarchy Process techniques. (Taticchi at al, 2010, p.229).
Data envelopment analysis (DEA) (Charnes at al, 1978), is a mathematical programming model applied to observational data which provides a new way of obtaining empirical estimates of external relations – such as the production functions and/or efficient production possibility surfaces that are a cornerstone of modern economics (Adler at al, 2002, p.250). DEA enables measuring the level of efficiency of non-frontier units, and to identify benchmarks against which such inefficient units can be compared (Cook and Seiford, 2009, p.2)
Demand to measure model (Ljungberg, 2002), classifies process measures in to main groups: process/activity measures and resource measures. Interrelating of this two groups of measures facilitate evaluation of efficiency and productivity (Ljungberg, 2002, p.267). Purpose of this seven-step method is to identify and derive proactive process measures.
DOE/NV model, proposed by U.S. Department of Energy Nevada Operations Office (Bellman at al, 1994), is standardized approach to developing and implementing performance measurement systems. Performance measurement process has been separated into 11 discrete steps. Those steps present a guideline, intended to show the process generically. Different organizations who have vast knowledge of their own internal processes should feel free to adapt the guidelines where necessary to best fit within their operations (Bellman at al, 1994., p. 9)
EFQM model, proposed by European Foundation for Quality Management (EFQM), is used to assess an organization’s progress towards excellence, independently of the organization’s type, size, structure, and maturity. The model is based on nine criteria. Five of these are classified as “Enablers” (cover what an organization does) and four as “Results” (cover what an organization achieves) (Franceschini at al, 2007, p.131).
Kanji Business Excellence Measurement System (Kanji, 2002), based upon Kanji’s Business Excellence Model and Kanji’s Business Scorecard (KBS), These are made up of several criteria that correspond to the Critical Success Factors, i.e. the areas that must perform well if an organization is to succeed. They form, respectively, Part A and Part B of the Performance Measurement System and should be applied simultaneously, since they form a single and complementary view of organizational performance (Kanji, 2002, p. 718).
Tableau de Bord (de Guerny at al, 1990) establishes a hierarchy of interrelated measures and cascading measures to different organizational levels, forcing functions and divisions of an organization to position themselves in the context of the company’s overall strategy (Kennerly & Neely, 2002, p. 148). This concept is designed to help the personnel pilot the organization by identifying key success factors, especially those that can be represented as indicators (Franceschini at al, 2007, p.127)
Performance measurement matrix (Keegan at al, 1989) categorizes performance measures as “external” or “internal” and “cost” or “non cost”. This is a simple and flexible framework, and whilst it does not reflect all attributes of measures that are increasingly considered necessary, the matrix is capable of accommodating any measure of performance (Neely at al, 1995, p. 97). However, the matrix does not make explicit the links between the different dimensions of business performance (Anderson & McAdam, 2004, p. 469).
Performance pyramid (Judson, 1990; Lynch and Cross, 1991), ties together the hierarchical view of business performance measurement with the process view. It cascades measures down the organization so that measures at department and work-center level reflect the corporate vision as well as internal
1265
business unit objectives. This strategic measurement and reporting technique also supports the need to include internally and externally focused measures of performance (Neely at al, 2007, p.146)
Performance Prism (Kennerly & Neely, 2002, p. 151) reflects the growing importance of satisfyingstakeholder requirements, considering five distinct but linked perspectives of performance: stakeholdersatisfaction, strategies, processes, capabilities and stakeholder contribution. In this framework, results(stakeholder satisfaction) are function of determinants (the other prism, facets) (Neely at al, 2007, p.156)
Framework of results and determinants (Fitzgerald at al, 1991) is based on the premise that there aretwo basic types of performance measure in any organization, those that relate to results(competitiveness and financial performance) and measures that focus on the determinants of thoseresults (quality, flexibility, resource utilization and innovation). Framework highlights the fact that theresults obtained are function of past business performance with regard to specific determinants (Neely atal, 2000, p.1122).
Supply Chain Operations Reference (SCOR) model, developed in 1997 by Supply Chain Council isbusiness process reference model that contains all supply chain activities from supplier’s supplier to acustomer’s customer. SCOR contains four levels of process detail. SCOR also includes methodologythat enables companies to analyze and improve their supply chain operations by helping them tocommunicate supply chain information across the enterprise, measure performance objectively, identifysupply chain performance gaps and improvement objectives (Scheer at al, 2002, p.50)
Theory of Constraints (Goldratt, 1984) offers a systematic and focused process that organizations use topursue ongoing improvement successfully. Within the TOC three global performance measures are usedfor assessing a business organization’s ability to obtain the goal (i.e. making money). These globalmeasures are net profit, ROI and cash flow (Tangen, 2004, p.732).
TQM performance measurement model (Sinclair & Zairi, 1995) is based on concept of Total QualityManagement and is designed to integrate measurement within the overall management process. Themodel consists of five levels: strategy development and goal deployment; process management andmeasurement; performance appraisal and management; break-point performance assessment; andreward and recognition systems concept.
Mentioned models consider performance measurement issues from different perspectives. Besides tendency to link operations and processes to strategic goals, they integrate financial and non-financial measures, and focus all business activities on customer requirements (Lynch & Cross, 1995, p.6). Nevertheless, these different approaches have led to numerous definitions of a performance measurement system, but still, there is little consensus regarding its main components and characteristics. (Dumond, 1994, p.17).
3. COMPARATIVE ANALYSIS OF EXISTING MODELS OF PERFORMANCE MEASUREMENT -THE RESULTS
Each of these performance measurement models suggests that it is unique and comprehensive. However, each model offers a different perspective on performance. Based on this, the following questions arise: Which process performance measurement model should be selected and applied? Which model is appropriate? When to use a certain performance measurement model? To respond to those and similar questions, a comparative analysis of above mentioned models was done according to ten selected criteria. Those criteria are: Model purpose The basis for performance measures determination Performance measures (categories) The interconnections between performance measures Specificity of indicators to be measured Complexity Stakeholders, considered within the model System improvements incorporation Possibility to compare with competition Interdependency between process indicators and organizational goals
Comparation of models according to cited criteria is described in the paper „Process performance measurement models“ (Simeunović at al, 2013, p.226). The results of comparative analysis show that all models consider performance from different perspectives, and that they are designed for different purposes. Analysis also show that the majority of models takes into account the strategy or goals while determining performance, which isn’t surprising since this is the way to ensure obtaining reliable information about achieving of strategic goals, and taking corrective action , if necessary.
1266
It should be noted that most of the studied models doesn’t specify performance indicators, but gives an indication for their determination, because the indicators are viewed as too specific to each individual company. However, what is most notable is that none of these models link directly organizational goals and performance indicators, in other words, they don’t specify their interdependence, which would allow model flexibility. This is important because the environment is dynamically evolving, and goals, as well as the organization's strategy should be changed in time and when they change, some of performance indicators also have to be changed. Therefore, there is the need for performance measurement system flexibility. According to Franceschini at al (2007, p.55), one of the most critical aspects in operations management is “translating” a firm’s goals into performance indicators. Those remarks are not surprising since even two decades ago numerous authors espoused the need for reflection on measures to ensure that they are updated to reflect these continuous changes (Meyer & Gupta, 1994; Ghalayini & Noble, 1996; Dixon et al., 1990; Wisner & Fawcett, 1991). So, the crucial question is: How to enable flexibility in measuring performance, i.e. how to respond quickly to changes of the business system goals, and adapt performance indicators, so the performance measurement results are kept up to date and provide timely and accurate information?
4. PROCESS PERFORMANCE MEASUREMENT MODEL BASED OF OBJECTIVE-INDICATORS LINKAGE
In order to overcome mentioned shortcomings of performance measurement models, and, particularly, to enable flexibility in measuring performance, the novel approach was proposed. This approach allows direct linking of organizational goals and process performance indicators. In order to apply this approach, it is necessary for an organization to have well-designed process model, that is the base for process management. Graphical interpretation of creation the foundation for processes management, and, therefore, for performance measurement is shown in Figure 1.
MISSION AND
VISION
PRODUCT AND/OR
SERVICE
CATALOGUE
PROCESS
CATALOGUE
STRATEGIES
POLICIES
Programs and plans
OBJECTIVES
(measurable)
PRODUCT/SERVICE
QUALITY
PRIOR, CRITICAL
AND KEY
PROCESSES
PROCESS
REVIEWING NAD
IMPROVING
PRODUCT/SERVICE
QUALITY
CONTROL
SECOND
LEVEL
OBJECTIVE
SECOND
LEVEL
OBJECTIVE
PROCESS
PERFORMANCE
INDICATORS
KEY PROCESS
(which will be
managed)
IMPROVED
METHOD OF
PROCESS
EXECUTION WITH
POSSIBILITY OF
MANAGEMENT
Time
Iu
Time
Iu
Plan
RealizedMin
Max
Realized
PROCESS MANAGEMENT SYSTEM OPERATON
Figure 1: Establishing foundation for process management (adapted from Radović at al, 2012a, p. 611)
1267
The first step in establishing process-oriented performance measurement system (figure 1) is the development of mission and vision statement. The mission can be seen as the far goal that may never be reached. It should describe what the organization is in business to do. The vision is where the company wants to go, the ideal future state of the organization (Radović at al, 2009). Well-defined mission statement should facilitate product/service identification, on the one hand, and identification of stakeholders, and their requirements, on the other hand, vision statement, along with identified stakeholders, are the basis for defining those product/service quality features by which the organization meets the requirements of stakeholders. Considering the importance of stakeholders for the success of the organization, their requirements should be than incorporated into the strategy and translated into measurable organizational goals. Those goals have to be defined according to stakeholders needs. Furthermore, company should decompose those organizational goals to lower level objectives of organizational units. At the same time, according to mission, the basic product/service (or more basic products/services) should be identified, and the product/service catalogue should be created, which is the basis for business process identification, i.e process model design. Next step is to identify those processes and activities that (from process model) lead to achievement of organizational goals, and whose performance indicators should be measured. However, since it is impossible to simultaneously improve all processes, or to measure performances of all processes, due to limited resources and time, considering that all performances are not equally important, efforts should be focused on measuring the performances of those processes whose execution contributes to achievement of the organizational goals or stakeholders requirements. So, the list of prior, critical and key processes should be created, whereby the key processes are those processes through which the specificity of business system can be recognized and which contribute to business system goals realization. Given the above mentioned, it is necessary to select the key processes that will be measured and managed. The final step is to translate the top level goals into key process performance indicators which lead to the achievement of these goals. The degree to which goals, as a mission, are met is determined by measuring and comparing process performance with a defined goal. Goal translation into key process performance indicators should enable determination of their interdependency. This would allow achieving of performance measurement system flexibility, i.e. possibility of rapid adaption of performance indicators according to changes in organizational goals and strategies. Translation process is performed as follows. When the goals at the highest level of organization are defined based on the requirements and expectations of customers, shareholders, employees, the state, local communities, and other stakeholders, it is necessary to determine what an organization needs to do for achieving those goals. Therefore, the strategic goals of the organization, aligned with the requirements of stakeholders, are decomposed into the lower level objectives, i.e. objectives of the business system units. If an organization achieves objectives of its organizational units, the top level goals will be achieved too. The goals of organization units are considered as second level objectives, and they should be defined according to SMART principles. In this step, it’s necessary to define the units of measurement, reference values (values that are required for goal achieving), the method of measuring these goals, and to describe how (in which interval) the trend of achieving these goals will be followed. Next step is to determine which processes in organization should be performed in order to achieve those second level goals. Those are the key processes, and performance of these processes should be measured, since they contribute to defined goals realization. The logic and procedure for translating the business system's goals in process performance indicators are shown in Figure 2.
Starting from the procedure described above, interdependencies between business system’s goals and organizational unit’s objectives can be identified, as the interdependencies between organizational unit’s objectives and key process performance indicators, and therefore the direct linkage between business system’s goals and process performance indicators
The proposed approach for measuring performance has been applied in over 30 companies in Serbia in the period from 2010 to the present, and the preliminary results show the satisfactory success in measuring business performances in these companies.
1268
Figure 2. Procedure for translating the business system's goals in process performance indicators (Radović
at al, 2012b, p.129)
5. CONCLUSIONS AND FURTHER RESEARCH
It is well-known that the performance measurement is vital for business system success and development. In the literature, there are number of process performance measurement models and frameworks. In this paper, some of those models are briefly described, and the results of their comparative analysis are shown. According to those results, each of the models has a purpose in the practice, and none of them can be selected as the best or the most successful model. Generally, those various models and frameworks have a clear academic grounding, and are “philosophically” sound – they do provide guidance on how a company should design its unique performance measurement system, but they rarely help with the practical realization of specific measures at an operational level. The measurement practitioner still has to translate the framework into practical measures. (Tangen, 2004, p.736). However, what is most notable is that none of those models link directly organizational goals and performance indicators, in other words, they don’t specify their interdependency which would allow model flexibility. Accordingly, the novel process performance measurement approach is suggested, which starts from business system goals, decompose them on the lower level objectives and link them to the key processes of business system. Suggested approach allows interconnection between organization’s top level goals and key process performance indicators, by using lower level objectives. This should enable model flexibility, i.e. rapid adaption of performance indicators according to organizational goals changes. The next step would be, according to linkages between goals and process indicators that are identified in companies in which this approach has been applied, to define the general set of business system’s goals and process performance indicators, and to determine their direct relationships, which would be applicable in all companies. This would be further research direction of authors.
REFERENCES
Adler, N., Friedman, L. & Sinuany-Stern, Z. (2002). Review of ranking methods in the data envelopment analysis context. European Journal of Operational Research, 140(2), 249–265.
Anderson, K. & McAdam, R. (2004). A critique of benchmarking and performance measurement: Lead or lag? Benchmarking: An International Journal, 11(5), 465 – 483.
Antonucci, Y.L., Bariff, M., Benedict, T., Champlin, B., Downing, B. D., Franzen, J., Madison, D. J., Lusk, S., Spanyi, A., Treat, M., Zhao, L., & Raschke, R. L. (2009). Guide to the Business Process Management Common Body of Knowledge (Version 2). Chicago: ABPMP.
Bellman, R., Droemer, D., Lohmann, M. & Miller, C. (1994). Performance Measurement Process Guidance Document. Las Vegas, NV: Department of Energy.
Brown, M.G. (1996). Keeping Score: Using the Right Metrics to Drive World-Class Performance. New York: Quality Resources.
Cagwin, D. & Bouwman, M.J. (2002). The association between activity-based costing and improvement in financial performance. Management Accounting Research, 13(1), 1-39.
Charnes, A., Cooper, W.W. & Rhodes, E. (1978). Measuring the efficiency of decision making units. European Journal of Operational Research, 2(6), 429-444.
Cook, W. & Seiford, L. (2009). Data envelopment analysis (DEA) - Thirty years on. European Journal of Operational Research, 192(1), 1-17.
Cooper, R. & Kaplan, R. (1991). Profit priorities from activity-based costing. Harvard Business Review, 69(3), 130-135.
de Guerny, J., Guiriec, J.C. & Lavergne, J. (1990). Principes et Mise en Place du Tableau de Bord de Gestion (6th ed.). Paris: J. Delmas.
Dixon, J. R., Nanni, A. J., & Vollmann, T. E. (1990). The new performance challenge: Measuring operations for world-class competition. Homewood, IL: Business One Irwin.
Dumond, E. J. (1994). Making best use of performance measures and information. International journal of operations & production management, 14(9), 16-31.
Fitzgerald, L., Johnston, R., Brignall, T.J., Silvestro, R. & Voss, C. (1991). Performance Measurement in Service Businesses. London. Chartered Institute of Management Accountants.
Franceschini, F., Galetto, M. & Maisano, D. (2007). Management by measurement - Designing key indicators and performance measurement systems. New York, Springer Berlin Heidelberg.
Ghalayini, A. M., & Noble, J. S. (1996). The changing basis of performance measurement. International Journal of Operations & Production Management, 16(8), 63-80.
Glad, E. & Becker, H. (1997). Activity-Based Costing and Management. New York, John Wiley &Sons. Goldratt, E.M. (1984). The Goal. Great Barrington, MA, The North River Press. Judson, A.S. (1990) Making Strategy Happen, Transforming Plans into Reality. London: Basil Blackwell. Kanji, G. K. (2002). Performance measurement system. Total Quality Management, 13(5), 715-728. Kaplan, R. S. & Norton, D. P. (1996). The balanced scorecard: translating strategy into action. Boston,
Harvard Business Press. Norton, D., & Kaplan, R. (1993). Putting the balanced scorecard to work. Harvard Business Review, 71(5),
134-140. Keegan, D. P., Eiler, R. G., & Jones, C. R. (1989). Are your performance measures obsolete. Management
accounting, 70(12), 45-50. Kennerley, M., & Neely, A. (2002). Performance measurement frameworks: a review. Business performance
measurement: Theory and practice, 145-154. Kueng, P. (2000). Process performance measurement system: a tool to support process-based
organizations. Total Quality Management, 11(1), 67-85. Lisiecka, K. & Czyż-Gwiazda, E. (2013, June). Performance measurement models - comparative review,
Paper presented at the 57th EOQ Congress: Quality Renaissance - Co-creating a Viable Future, Tallinn, Estonia
Ljungberg, A. (2002). Process measurement. International Journal of Physical Distribution & Logistics Management, 32(4), 254-287.
Lynch, R.L. & Cross, K.F. (1995). Measure Up!: How to Measure Corporate Performance. Oxford, Blackwell Publishers
Meyer, M. W., & Gupta, V. (1994). The performance paradox. Research in organizational behaviour, 16, 309-369.
Neely, A., Gregory, M., & Platts, K. (1995). Performance measurement system design: a literature review and research agenda. International journal of operations & production management, 15(4), 80-116.
Neely, A., Mills, J., Platts, K., Richards, H., Gregory, M., Bourne, M., & Kennerley, M. (2000). Performance measurement system design: developing and testing a process-based approach. International Journal of Operations & Production Management, 20(10), 1119-1145.
Neely, A., Kennerley, M., & Adams, C. (2007). Performance measurement frameworks: a review. in: Business Performance Measurement, Unifying theories and integrating practice (pp. 143-162). Cambridge, Cambridge University Press.
Radovic, M., Camilovic, S., Rakic, Z., Simeunovic, B., Tomasevic, I., & Stojanovic, D. (2012a). Process management as basis for quality management in service industry. TTEM-Technics Technologies Education Management, 7(3), 608-614.
Radović M., Tomašević I., Stojanović D., & Simeunović B. (2012b) Inženjering procesa. Beograd: FON. Radović M., Tomašević I., Stojanović D., & Simeunović B. (2009, September). Establishing system for
process oriented performance management. paper presented in12th International QMOD and Toulon-Verona Conference on Quality and Service Sciences.
Rouse, P., & Putterill, M. (2003). An integral framework for performance measurement. Management Decision, 41(8), 791-805.
Scheer, A-W., Abolhassan, F., Jost, W. & Kirchmer, M. (2002). Business Process Excellence, ARIS in Practice, Berlin: Springer-Verlag.
Sikavica P., & Hernaus T. (2011). Dizajniranje oganizacije - strukture, procesi, poslovi. Zagreb: Novi informator.
Simeunović,B., Stojanović, D., Tomašević, I., & Radović, M. (2013, November). Modeli za merenje performansi procesa. Paper presented at the IX Symposium of Business and Science SPIN ’13 .
Sinclair, D., & Zairi, M. (1995). Effective process management through performance measurement: Part III-an integrated model of total quality-based performance measurement. Business Process Re-engineering & Management Journal, 1(3), 50-65.
Tangen, S. (2004). Performance measurement: from philosophy to practice. International Journal of Productivity and Performance Management, 53(8), 726-737.
Taticchi, P., Cagnazzo, L., Santantonio, M., & Tonelli, F. (2010). A framework for performance measurement and management based on axiomatic design and analytical hierarchy process. In Business Performance Measurement and Management (pp. 229-240). Berlin: Springer Berlin Heidelberg.
Towers, S. (2005). In the beginning. In: In Search of BPM Excellence. Tampa: Meghan-Kiffer Press. Wisner, J. D., & Fawcett, S. E. (1991). Linking firm strategy to operating decisions through performance
measurement. Production and Inventory Management Journal, 32(3), 5-11.
1271
BPM PRACTICE: EXPERIENCES FROM COMPARISON STUDY IN SERBIA 2012-2014
1University of Belgrade, Faculty of Organizational Sciences, [email protected] 2 University of Belgrade, Faculty of Organizational Sciences, [email protected]
3 University of Belgrade, Faculty of Organizational Sciences, [email protected]
Abstract: The purpose of this paper is to compare business process management and business process improvement practice in Serbia from study in 2012 and 2014 in order to notice if there is any progress in implementation of those practices or companies process maturity level according to CMMI model, and whether there are changes in problems and challenges that companies in Serbia encounter while trying to implement process change initiatives. Questionnaire was sent to approximately 500 companies in Serbia based on the similar research in 2012 and response rate was higher. Results of the comparison study show that process maturity level increased over a two years period, that the main business driver for process change is need for cost reduction and main challenge is lack of interest within top management. This paper suggests steps for further efforts in process management and improvement practice and can be useful for practioners and researchers on this field in similar economies.
Keywords: Business process management, Process improvements, Serbian industry
1. INTRODUCTION
Today, there is declining number of customers who make the decision solely on price, and cost, quality, delivery speed and reliability play a decisive role in selecting product and/or service. (Simeunović et.al, 2012) Stojanovic et.al. (2012a) stated that “constant intensification of global competition and increasing of market demands, force all business systems, to find new ways of preserving and improving its competence and achieve advantage on market in terms of prices, deadlines, quality goods and services”. (p.205) Madison (2005) considers that 85% of all problems in the company can be attributed to the processes, and 15% to people, and solving problems in processes may lead to customer satisfaction improvement, cost and cycle time reduction (p. 3). Radović et.al. (2012) describes processes as elements of business system structure, which increasingly gaining the importance, because they are entity which can be used for the best establishing of new business systems, analyzing, improving and developing of existing business systems and managing of his parts and system in the whole. (p.4)
Business Process Management (BPM) has emerged as a concept in literature and practice in the last two decades. So, many associations of process professionals like BPTrends or Process Excellence Network analyze and monitor development of BPM practice in the world for several years (Wolf and Harmon, 2012; Process Excellence Network, 2012). First research of this kind was conducted in Serbia two years ago. The motivation to repeat the similar study after two years was to notice if there is any progress in process work in Serbia and to create a picture of what process management programs might look like in the following period. In the research, authors used questionnaire which was sent to 500 companies which operate in Serbia via e-mail and LinkedIn professional network.
After an introduction, a brief literature review will be given about business process management and improvement. Chapter three will present research methodology that was used for the purpose of this paper, and the main results of the research will be given in chapter 4. These results will be discussed in chapter 5, and the conclusion and future implications will be given afterwards.
2. THEORETICAL BACKGROUND
“Processes are vital for any organization, and they constitute a business system and things that it does, so it can be said that any business system can be managed by managing its processes”. (Stojanović, 2012c, p.1374) Lientz and Rea (2001) stated that “company profitability depends on processes”. (p.15) Businessprocess management and process improvement are important themes for researchers and practitioners, because process improvement represents bottom-line of business enhancement. (Siha & Saad, 2008, p.778). Jeston and Nelis (2006) defined BPM as “achievement of organizational objectives, through the
1272
improvement, management and control of essential business processes”, and emphasized that the “process management is an integrated part of “normal” management” (p.11) Therefore, the first part of the research is dedicated to ways in which companies understand BPM and how they describe level of interest for process improvements. In order to recognize the level of adoption of process management practice in Serbia, authors used CMMI model, which contains five level of process maturity (initial, repeatable, defined, managed, optimizing). Stojanović et.al. (2012c) stated that “key assumption of the model is that immature companies cannot provide the consistency of their performance, while mature companies make quality products at effective and consistent manner”, and key point of the model is to understand where the organization is today and where it wants to get. (p.1374) Skalle et.al. (2009) emphasized that one of the areas that are in focus of BPM is business process design and improvement in order to fulfil or exceed customer expectation, while achieving organizational goals. Work on process improvements is one of the important parts of BPM and is recognized as one of the main priorities of companies according to Gartner survey from 2009. (Zellner, 2011) Business process improvement was one of the sources of competitive advantage, but now is a necessity for surviving on the market. (Stojanovic, 2012b, p.281) Also, one of the shortcomings of BPM is long duration of implementation and companies cannot wait long to see the results, so they need to define improvement projects which will achieve and show results quickly and these projects can be a key drivers for successful BPM deployment. One part of the survey is dedicated to process improvements as part of the BPM in order to comprehend success factors for process improvements so as BPM. The main goal of this research is to evaluate level of adoption of process practice and to investigate what are drivers, challenges and trends for process work in Serbia in the following period, and to propose further efforts in process management and improvement practice which can be useful for practitioners and researchers on this field.
3. RESEARCH METHODOLOGY
The purpose of this study is to determine if there are any changes in the extent to which companies in Serbia have adopted process management and improvement practices, whether their process maturity level is higher or lower according to CMMI model, and what are the problems and challenges that companies in Serbia encounters while trying to implement process change initiatives. Besides that, it would be interesting to see:
1. What are factors for success in process improvement and management? 2. What is next for process management is Serbia?
In order to compare results, similar survey instrument to the one used in 2012 research was used, with additional questions concerning business process improvement (BPI) practice. Questionnaire included 28 questions divided into three groups: the first group are general questions about company and respondents, second group are questions about process maturity and third group of questions refers to business process improvement practice. The questions required single or multiple choices and some of them included an open form in case when offered answers couldn’t reflect the views of the respondents. The research instrument was mailed to general managers, CEOs, process analysts at a random sample of 500 manufacturing and service organizations in the Serbia. A total of 89 usable responses were returned, resulting in a response rate of 17,60 percent. The 300 of 500 companies were included in previous research. In 2012 research instrument was sent to 300 companies and response rate was 13,66 percent. This year, authors also used social professional network group LinkedIn to contact potential respondents. All of these responses were included in the results presented in this paper. After the questioners were filled by the participants, the statistical package SPSS was used for calculation of frequencies and Χ2 test (with significance set to 0.05) and Man-Whitney U test (with asymptotic significance value set to 0.05). In order to see is there any difference between results from 2012 and 2014, Z test was used.
4. RESULTS
Among 89 respondents in the research, 10,1% were general managers, 7,9% were executive officers, 22,5% were business function/department managers, 13,5% were business analyst, 14,6% were process analyst, 12,4% were consultants, 9% were researchers, while 10,1% of respondents stated that their position was something else. In comparison with previous research, new job title is defined – process specialist/analyst, because authors assumed that BPM practice is developed from 2012 and that this job title is present in
1273
companies in Serbia. Majority of the companies included in the research were large companies (46,1%) with more than 250 employees. Also, majority of companies were service oriented 60,7%, 20,2% were manufacturing companies, while 19,1% were operating both in service and manufacturing industry.
Most companies were domestically owned (66,3%), about a third of them have foreign owners (24,7%), and with the rest (9%) the ownership was shared between domestic and foreign owners.
Figure 1 presents the comparison of the way the respondents understand the term Business process management
Figure 1: Companies' understanding of Business process management concepts in 2012 and 2014
Figure shows that respondents mostly indicated that their organizations understand BPM as systematic approach to process analysis, improvement, redesign and management (30,3%) or managing organization by managing its business processes (29,2%). Initiative for cost saving and process improvement of certain processes is also represented in 27%.
The participants were asked to explicitly position their company at one of the levels offered by CCMI maturity model. The results are shown in Figure 2.
Figure 2: Levels of CMMI process maturity of companies in Serbia in 2012 and 2014
In 2014, most of the companies are on second or third level of process maturity (28,1%), and there’s increasing number of companies which are on the Level 4 or 5. None of the respondents placed it’s company’s processes on Level 4 in 2012 and only 12,2% (5 of them) were at level 5, but in 2014, 2,2% (2 companies) are at level 4 and 18% (6 companies) are at the highest level of process maturity.
Table 1 shows that in 2012 and 2014, majority of the companies stated that they are undertaking activities concerning process maturity “in some cases” or “always” . Also, in 2014 percent of companies that answered “never” is much lower than 2012, and on the other side there is higher number of companies that gave answer “always” than in 2012.
Managing organization by managing it`s business processes
Systematic approach to process analysis, improvement, redesign and management
Initiatives for cost saving and process improvements within certain processes
Set of software technologies that facilitate process execution, measurement and management
Something else
29,2
30,3
27
7,9
5,6
49,8
2,00
31,7
4,8
12,2
2014
2012
Level 1 Level 2 Level 3 Level 4 Level 5
23,6
28,1 28,1
2,2
18
26,8
34,1
26,8
0
12,2
2014
2012
1274
Table 1: Questions concerning process maturity in 2012 and 2014
2014 2012 2014 2012 2014 2012
Questions concerning process maturity Never In some cases Always
Business processes documented and updated 6.8 12.2 53.9 63.4 39.3 24.4
Business processes measured and monitored 11.2 14.6 48.3 46.3 40.4 39
Core business process models include activities of suppliers and partners
25.8 30 57.3 51.2 16.9 9.8
IT support in accordance with business processes 8.9 9.8 58.4 70.7 32.6 19.5
Skills needed for activities are defined and documented 12.6 12.2 58.4 75.7 29.2 12.2
Managers are trained for analysis, design and business process management
17.9 19.6 56.2 68.3 28.9 12.2
Process managers use data about performances in order to manage processes
16.8 17.1 59.6 65.9 23.6 17.1
In 2012, only 2,4% of the respondents stated that process improvement initiatives are always being able to identify and remove problems and inconstancies, while 82,9% stated that problems are frequently solved by process improvement initiatives. On the other side, in 2014, 15,7% said that that process improvement initiatives are always being able to identify and remove problems, and 73% stated that problems are frequently solved by process improvement initiatives. Difference between these results is confirmed with Z test (Z=-2.2041, p=0.027)). In 2014, 58,4% of the companies stated that they don’t have formal group for process management, while in 2012 that number was 39%, or if they have formal process management group, location is within their executive management (18%), while in 2012 24,4% of the companies stated the same (Z test also confirmed that there is significant difference between results for the companies which do not have formal group (Z=-2.0581, p=0.039). Comparison of main drivers behind business process change initiatives identified among companies operating in Serbia are given in figure 3 (multiple answers were allowed).
Figure 3. Main drivers for business process change initiatives
Main driver for business process change in 2012 were need for customer satisfaction (58,54%), need for managing IT resources (19,51%) and business partner`s requirements (19,51%). In 2014, need for customer satisfaction was also main driver for 38,2% companies, but other drivers were changed. QMS certification was the second driver with 32,58%, and the others drivers have approximately the same percent. Z test also confirmed significant difference between results for “need for customer satisfaction improvement” (Z=2.1672, p=0.03) and QMS certification (Z=-4.1467, p=0.00). With regard to process initiatives that companies have undertaken so far, new answers were added in 2014, in accordance with development of process improvement practice: Modeling/documenting processes
0 10 20 30 40 50 60
Need for customer satisfaction improvement
Risk management
Onetime events (reorganization/mergers/acquisit…
QMS certification
Need for managing IT resources (ERP/CRM)
Business partner’s requirements
38,20
13,48
6,74
32,58
10,11
6,74
58,54
14,63
9,76
0,00
24,39
19,51
2012
2014
1275
Redesign of processes with reference models, Lean Six Sigma improvement projects and Process excellence concepts. Comparison of the results is given in table 2 (multiple answers were allowed)
Table 2: Comparison of the process initiatives that companies have undertaken so far
Business process initiatives undertaken so far 2014 2012
% % Business process architecture development 51,69 41,46 Business process measurement system development 53,93 58,54 Modeling/documenting processes 65,17 - Business Process management 58,43 56,10 Process managers training for process analysis/redesign 14,61 26,83 Core processes redesign 35,96 17,07 Redesign of processes with reference models 3,37 - Six Sigma improvement projects 3,37 4,88 Lean improvement projects 8,99 12,20 Lean Six sigma improvement projects 4,49 - Continuous process improvement projects/KAIZEN 12,36 19,51 Process automation projects 35,96 34,15 Process excellence concepts 5,62 -
Z test shows that there is significant difference in the application of core processes redesign (Z=-2.183, p=0.029).
Challenges and resistances encountered while trying to broaden business process initiatives differ from previous study. The main challenges in 2012 were that multiple process change projects require same resources and management doesn’t want to invest in process change projects at this time. In 2014, main challenge is lack of interest within top management and also management doesn’t want to invest in process change projects at this time. But, five companies stated that they haven’t encountered any type of resistance. Results are given in table 3 (multiple answers were allowed)
Table 3: Comparison of challenges and resistances encountered while trying to broaden business process initiatives
Challenges encountered
2014 2012 No. of
companies No. of
companies Lack of interest within top management 31 8 Management doesn’t want to invest in process change projects at this time 24 11 Multiple process change projects require same resources 18 11 Previous process improvement projects were unsuccessful 13 0 Management requires ROI that is not achievable 7 2 No resistance 5 1 Something else 2 17
Table 4 present which process initiatives companies plan to undertake in the following period.
Table 4: Process initiatives that companies plan to undertake in the following period Business process initiatives undertaken so far No. of companies
Core processes redesign 32 Business Process management 24 Process managers training for process analysis/redesign 22 Business process measurement system development 22 Modeling/documenting processes 20 Business process architecture development 19 Process automation projects 17 Redesign of processes with reference models 13 Continuous process improvement projects/KAIZEN 12 Lean improvement projects 11 Lean Six sigma improvement projects 10 Six Sigma improvement projects 9 Process excellence concepts 6
The third part of the survey consisted of questions regarding business process improvement. A majority of companies reported that process improvement is part of normal work environment (50,6%), and 30,3% stated that interest in process improvement was expanding. Companies that reported expanding interest for process improvement were so far engaged in following business process initiatives: Modelling/documenting
1276
processes (14 companies), Business process architecture development (11 companies) and Business process management (11 companies). These companies plan to implement Business process management (13 companies), and will continue to work on process modelling and business process measurement system development. Companies with expanding interest in BPI also have core process redesign in their plans. Companies in which process improvement is a part of normal work environment have so far implemented following initiatives: Business process management (36 companies), Business process measurement system development (35 companies), and Business process architecture development (33 companies). More than one third of companies stated that they were engaged in business process improvement for more than two years (36%), and one third of companies reported that they work more than five years on process improvements (34,8%). The focus of business process improvement initiatives is mainly on production/operations (28 companies), IT business unit (27 companies) and sales (24 companies) or customer service (23 companies). According to the survey, 22 companies reported that they apply business process improvement methodologies in the whole company. In accordance with expansion of application of BPI in companies, majority of the respondents had enterprise-wide improvement projects (34,8%). Companies stated that their process improvement project length is 6-12 months (19,1%), while 15,7% reported that average project length is less than three months. Companies whose process improvement project length is 3-6 months account for 15,7%. Survey shows that 44,9% of the companies expect that number of employees dedicated to process improvement will increase, and 42,7% stated that number of employees will remain the same. Only 12,4% said that this number will decrease in the future. The same situation is with budget for process improvement program. Among the companies that have deployed business process improvement initiatives, 32,9% reported that their BPI program was successful, and 20% rate their programs as unsuccessful. Survey shows that 25 of 26 companies which report that they were successful in BPI program were engaged with the program for more than two years.. Chi-square and Mann-Whitney test were used in order to test whether interdependence between the basic parameters of the company, drivers and challenges with process management and improvement practice in companies in Serbia exists. The main driver for business process change in manufacturing companies is QMS certification (Χ2=7.535, df=2, p=0.025), while service companies listed QMS certification as the main driver to a much lesser extent. Large companies are increasingly facing with challenge of lack of interest within top management, while in the small companies that challenge is much less frequent (Χ2=11.419, df=2, p=0.002). Companies that have not yet started with process improvement initiatives reported that the main reason was lack of interest within top management (Χ2=8.111, df=3, p=0.04). On the other side, companies that work longer than 5 years on process improvement state that the main challenge for widening BPM initiatives across the company is that multiple project compete for the same resources (Χ2=7.696, df=3, p=0.04). Service companies are more oriented to process improvement deployment in IT sector, while none of the manufacturing companies report any initiative within this sector (Χ2=12.049, df=2, p=0.000). Small companies implement more BPI methodologies more in sales and marketing business unit than large companies (Χ2=5.935, df=2, p=0.04). Large companies are mostly oriented to enterprise wide deployment of BPI (Χ2=5.928, df=2, p=0.037). Mann-Whitney U test shows that companies faced with lack of interest within top management were unsuccessful in their process excellence program (U=540,00, Z=-3,336, p=0,001), and that companies which do not have a formal group for BPI are less successful in their improvement programs (U=702,50, Z=-2,331, p=0,02).
4. DISCUSSION
Majority of respondents are functional/department managers as in previous study, but also significant percent of respondents are process analyst. Respondents job title preliminary show that companies are aware of business process importance. Respondents' understanding of BPM is different in 2014 compared to 2012, but not significantly. Companies are more oriented to process improvement in order to reduce costs, but respondents also understand that BPM enables managing whole organization through business process management, like in previous study. In 2012 study, majority of the companies were at Level 1 or 2 of CMMI process maturity, while in 2014, there is growing percent of companies which are on the Level 4 or 5. Still, the majority of the companies are at Level 2 or 3, which is in accordance with companies in the world (Wolf and Harmon, 2012). Other answers to the questions concerning process maturity are in accordance to these results (see table 1). This can be a consequence of the greater business process awareness in companies. The number of respondents who reported that process improvement initiatives are always being able to identify are remove problems is higher in 2014, compared to 2012 study. This corresponds with higher process maturity level, which implies that processes are well documented, monitored and measured. with this situation, it is significantly easier to detect errors when they happen, as well as to react in short time and with greater accuracy, thus making problem solving more efficient.
1277
Companies in Serbia still do not have formal group for process work, and this can be a future task for our companies, especially because Chi-square test shows that companies which do not have formal BPI group are less successful in their process improvement program.
Regarding the main driver for business process change, there is significant difference between results, since companies are less oriented on improving customer satisfaction, and more on cost reduction and QMS certification. Chi-square test shows that QMS certification as driver for process change is more typical for manufacturing companies than services. The number of companies engaged in core process redesign increased in 2014, while number of companies engaged in incremental improvement activities, such as Lean, Six Sigma, or Kaizen, decreased.
Situation that might concern practitioners is growing lack of interest within top management for process improvements, especially in large companies. This is the main obstacle in starting with process improvement initiatives. The main cause of unsuccessfulness of BPI program is also lack of interest within top management. Companies in Serbia are also facing with the problem that management doesn’t want to invest in process change projects at this time, which can be attributed to different priorities in transitional economies. Companies that work longer than 5 years on process improvement have a problem with lack of resources for realisation of multiple projects. It is encouraging that 5 companies stated that they do not have resistance at all, and that majority of companies reported that process improvement is part of normal work environment or that interest in process improvements was expanding.
The results show that more companies were engaged with business process architecture development, process modeling, and process measurement. This contributes to the higher overall level of process maturity in companies operating in Serbia. These projects established a foundation for future business process initiatives, which is why it is not surprising that these companies are expecting for process improvement to become everyday effort. This is why these companies, encouraged with positive results obtained at a lower level of process improvement, are ready to tackle greater projects regarding process improvement, such as core process redesign.
Continuous process improvement is traditionally focused on operations. However, there’s a trend of shifting continuous process improvement practices toward service sector. By combining continuous improvement practices with IT knowledge, new process improvement concepts, such as Lean IT and agile programming, emerged. This new body of knowledge made IT sector very appealing for process improvement initiatives, especially within service industry.
Majority of the companies had enterprise-wide deployments of process improvement work, what is reflective of the fact that majority of companies worked on those improvements more than 2 years. Average length of process improvement project is less than six months, which indicates that quick wins are necessary in order for bigger process improvement initiatives to gain acceptance. Survey shows that 25 of 26 companies which report that they were successful in BPI program deployed longer than two years BPI, so it can be concluded that past experience with process improvement projects plays a significant role in the success of improvement initiatives. Large companies are more oriented to enterprise wide deployment of BPI, while small companies implement BPI methodologies in specific business units (frequently marketing and sales).
5. CONCLUSION
Considering the results obtained from the comparison study, it can be concluded that companies in Serbia have greater process awareness now than in 2012, when this research was conducted for the first time. Companies in Serbia are at greater level of process maturity which is now closer to the leading global companies. In favour of this fact is that process specialists are able to solve the problems in companies. This higher level of process maturity helps companies to focus their process improvement efforts, thus making problems more manageable, and problem solving more efficient. Although quick wins are essential for maintaining the momentum of process improvement efforts, more companies recognize the need to advance to a higher level of business process management. This includes establishing enterprise-wide system for process measurement and management, as well as redesign of core processes.
Formal process groups are a major process improvement success factor, which is why one of first steps in embracing process improvement practice should be the formation of specialized process teams, dedicated solely to business process management promotion.
1278
Challenges for process improvement are also new, with lack of interest within top management being the most significant of them all. Top management should be the driving force behind all change initiatives, which is why their support is of the outmost importance. In order to obtain this support, an aggressive education policy is needed, in order to present all benefits that business process management might bring to companies strengthening business-academia connections should be one of key steps in this effort.
REFERENCES
Jeston, J., & Nelis, J. (2006). Business Process Management: Practical Gudelines to Successfull Implementations. Oxford: Elsevier Ltd.
Lientz, B. P., & Rea, K. P. (2001). Professional's guide to process improvement: maximizing profit, efficiency, and growth. Harcourt Professional Publishing.
Madison, D. (2005). Process Mapping, Process Improvement and Process Management. Paton Professional.
Process Excellence Network (2012). Trends and Success Factors in Business Process Excellence. Retrieved from http://www.processexcellencenetwork.com/lean-six-sigma-business-transformation/white-papers/trends-and-success-factors-in-business-process.
Radović, M., Tomašević, I., Stojanović, D., & Simeunović, D. (2012). Inženjering procesa (2nd ed.). Belgrade, Serbia: Faculty of Organizational Sciences.
Siha, S. M., & Saad, G. H. (2008). Business Process Improvement: empirical assessment and extensions. Business Process Management Journal , 14 (6), 778-802, doi: 10.1108/14637150810915973
Skalle, H., Ramachandran, S., Schuster, M., Szaloky, V., & Antoun, S. (2009). Aligning Business Process Management, Service Oriented Architecture and Lean Six Sigma for Real Business Results . Retrieved from Red books IBM: http://www.redbooks.ibm.com/redpapers/pdfs/redp4447.pdf
Simeunović B., Tomašević I., Stojanović D., Radović M.,& Slović D. (2012, september) Lean Implementation in Transitional Countries: Case of Serbia. Paper presented at the Universidade Lusiada - Porto at International Conference IS2012 ˝Innovation fo Sustainability˝.
Stojanovic, D., Simeunovic, B. & Radovic., M. (2012a, September). Lean Thinking in Serbian Industry. Paper presented at the University of Novi Sad, Faculty of Technical Sciences, in 1nd International Scientific Conference On Lean Technologies.
Stojanović, D., Simeunović, B., & Tomašević, I. (2012b, May). Selection of Six Sigma business process improvement projects. Paper presented at Serbian Project Management Association in XVI International conference of project management.
Stojanović, D., Simeunović, B., & Tomašević, I. (2012c, Jun). The State of BPM in Companies in Serbia. Paper presedented at University of Belgrade, Faculty of organizational sciences in XII International Symposium of Organizacitional Sciences ˝Innovative Management & Business Performance˝.
Wolf, C., & Harmon, P. (2012). The State of Business Process Management 2012. Retrieved from http://www.bptrends.com/bpt/wp-content/surveys/2012-_BPT%20SURVEY-3-12-12-CW-PH.pdf
Zellner, G. (2011). A structured evaluation of business process improvement approaches. Business Process Management Journal, 17(2), 203-237. doi: 10.1108/14637151111122329
Abstract: First systematic operations management research agenda emerged in 1980, with subsequent updates and additions in 1981, 1987, 1989, and 1999. Since no similar research has been conducted in 2000’s, we believe it is time to assess operations management research in the 21
st century. In this paper, we
have studied the operations management output from eight academic journals in 4 years period (2009-2012), and compared the results with similar research conducted in the 1980’s and 1990’s, in regard to topics covered in operations management articles, and methodology used in operations management related research. The results show that there’s a significant difference in topical coverage of operations management research being performed in the 2000’s vs. the 1990’s and the 1980’s. Growth of interest in strategy is evident from the results, while modelling still stays dominant method in operations management research. However, a certain shift towards empirical research methodologies is present.
Keywords: Operations management, research topics, methodology, literature
1. INTRODUCTION
Operations management (OM) can be defined as a design, operation, and improvement of the systems that create and deliver company’s primary products and services (Chase et al., 2006) (p.9). The field of OM has been evolving for decades now, trying to distinct itself from the fields of operations research, management science, and industrial engineering by establishing its own body of knowledge and literature (Buffa, 1980; Meredith et al, 1989; Pilkington and Liston-Heyes, 1999). Operations management academics have researched OM related academic journals (Buffa, 1980; Chase, 1980; Miller and Graham, 1981; Hill et al., 1987; Amoako-Gyampah and Meredith, 1989; Meredith et al., 1989; Pennirselvam et al., 1999) in an attempt to establish a research agenda that will be in accordance with the needs of the industry.
In order to test if the proposed agendas have been followed, we’ve conducted the analysis of OM themed articles published in a four years period, from 2009 to 2012. The main goal was to study current trends regarding topical and methodological coverage of OM output, and compare it to trends and directions proposed in previous research. In order to compare the results of our research to research conducted in the 1980’s and 1990’s, we have modelled our study after the ones done by Amoako-Gyampah and Meredith (1989) and Pennirselvam et al. (1999).
The remainder of the paper is organized as follows: after the short review of similar research conducted in the past, methodology used in this study will be presented; after that, the results of the study will be presented; our results will be compared to the results from similar research performed in the 1980’s and the 1990’s; discussion and conclusions will follow.
2. LITERATURE REVIEW
The literature review will mainly be focused on studies similar to ours. Buffa (1980) proposed a first systematic OM research agenda. His agenda was aimed at solving real life problems in operations, and his predictions were that OM would move away from mathematical modelling. Buffa considered OM research to be narrow, based mostly on single-criterion quantitative models. He emphasized the importance of strategic planning decisions, and identified main topics to be manufacturing strategy and technological choice, job design, capacity planning, and facility location choice. Buffa also identified operations planning and control as an important topic to be addressed in the future, as well as operations in service systems.
Chase (1980) classified and evaluated OM research prior to 1980’s. His results show that inventory control and scheduling are two most frequent subjects in OM research, and that research was mainly oriented towards solving problems on a micro level. He identified the evident lack of integrative component of the research, which he thought was bad for the field. Model formulation and mathematical/computer manipulation of the model were identified as dominant research strategies, thus rendering OM research
rather abstract, and making it technique oriented instead of knowledge oriented. Chase also observed that operations management does not draw upon management theory, which he found to be very unfortunate, since managerial issues such as organizational structure might be constraining factors for OM application.
Miller et al. (1981) used Delphi-like procedure among researchers and practitioners in order to generate discussion of potential agenda for operations management. The authors identified four main areas of operations management research: operations policy, operations control, service systems, and productivity and technology. Miller et al. (1981) state that more application work and field based research is needed, but that the peer review process and time constraints stand as an obstacle to action oriented research. The authors also emphasize the need for more human and organizational oriented research.
Hill et al. (1987) analyzed if Miller et al. (1981) agenda was being followed by surveying dissertations in Business Administration and Management completed in the U.S.A. during the period 1980–1986. Their research reports that inventory control and scheduling are still most popular research topics. They also report the increase in popularity of process design, strategy and quality. Hill et al. (1987) identified the need for new research methodologies to address more managerial and macro-level issues.
Meredith et al. (1989) summarized previous research, and concluded that OM research failed at being integrative and useful to operations managers and practitioners. Authors proposed a framework for research methods, and applied the framework to operations management research. They have identified quality management and technology implementation as fertile areas for future research.
Amoako-Gyampah and Meredith (1989) analyzed articles in the field of operations management appearing in ten journals for the time period of 1982-1987. The authors compared their findings to pre 1980’s OM research, and concluded that work measurement significantly lost in popularity compared to previous research, while process design gained in popularity. Their research shows that inventory control has held high popularity in research topics. Amoako-Gyampah and Meredith (1989) also surveyed the proceedings of Decision Sciences Institute for 1986 and 1987, in order to compare published research with pipeline research. Inventory control and scheduling remained the most popular topics in pipeline research, while service system research has shown increase in popularity in pipeline research (14% of articles in pipeline research vs. 6% of articles in published research). The authors also surveyed the research approaches used in OM research, and the results show that modelling and simulation have been predominantly used as research methods.
Pennirselvam et al. (1999) compared the results of their study with the ones presented by Amoako-Gyampah and Meredith (1989). Their findings show significant changes in the kind of research being performed in the 1990’s compared to the research in the 1980’s, with greater interest in strategy and quality. The authors state the OM research is more integrative in nature in the 1990’s. Modelling is still dominant methodology used in research, while the expected increase in case study research was not met. The authors also conducted a study of pipeline research, and identified quality as most popular topic.
3. RESEARCH METHODOLOGY
In order to compare the results of our study with the ones presented by Amoako-Gyampah and Meredith (1989) and Pennirselvam et al. (1999), we analyzed the same journals covered in their studies. Impact factors analysis and journal categorization show that these journals are still relevant in the field of OM. Research that analyzes the relative importance of journals used in operations management back up this claim (Theoharakis et al., 2007; Machucha et al., 2007; Barman et al., 2001; Soteriou et al., 1999;). We have surveyed original seven journals covered in Pennirselvam et al. (1999) research: International Journal of Operations and Production Management (IJOPM), International Journal of Production Research (IJOPR), Journal of Operations Management (JOM), Production and Operations Management (POM), Decision Sciences (DS), Management Science (MS), and IIE Transactions (IIET). We added International Journal of Production Economics (IJPE) to our study, since it is perceived by OM academics as a high quality OM-related journal.
We classified the articles from the selected journals by topic areas and by research methodologies. The topic areas chosen were those used in similar research (Chase, 1980; Amoako-Gyampah and Meredith, 1989; Pennirselvam et al., 1999). This allowed us to compare our results to previous findings. First step in article analysis was to determine whether the article in question was and OM article or not. If the article is an OM article, OM topics areas were analyzed, as well as methodology used in the article. All doubts regarding OM/not OM classification, topic and method coverage were resolved by consensus between authors. Emerging topics, such as supply chain management, role of operations in sustainability, performance measurement and management, lean/agile operations, and new product/service design/development were
1281
identified, and fitting those articles into one of 17 OM topics category was quite a challenge. Some of the articles surveyed address more than one OM topic. In such cases, we counted each of the topics that were addressed because the objective of this research was to identify the current topics of interest. We also kept track of the type of topics that are studied in combination and the frequency of topic combination occurrences to look for trends in integrative research in OM. Also, multiple research methods were used in some articles. We have identified single methods, as well as combinations of methods.
4. RESULTS OF TOPIC/METHODS ANALYSIS
The following sections will cover the analysis of topical coverage and methodology used in OM output analyzed in this study.
4.1 Topical coverage
We have analyzed 4318 articles published between 2009 and 2012, and identified 2802 as OM articles. Total number of counted OM topics is given in Table 1.
Table 1: Total number of OM topics counted No of articles No of topics Topics counted
2324 1 2324 456 2 912
22 3 66 Total OM topics counted 3302
Table 2 presents the coverage of OM topics by journals. It shows that’s strategy has gained in popularity in recent years, accounting for 18.63%. Inventory control and scheduling are still positioned high, accounting for 17.84% and 15.35% respectively. Process design and quality are also positioned in the top part of the table, accounting for 9.96% and 8.03% respectively.
Last two columns in Table 2 show percentages of topics for periods 2009-2010 and 2011-2012. The results show that topics have held their positions for both time periods, although there was a decrease in percentage for strategy in 2011-2012 period, as well as a slight increase in percentage for scheduling for the same period. It can also be seen that topics occupy same positions in two-year time periods and in four year (cumulative) time period.
In order to look for integrative research in operations management, we have analyzed types of topics that are studied in combination, as well as the frequencies of their occurrence. The results show that most popular combination is inventory and control and scheduling, accounting for 7.11%. Combination of strategy and process design follows with 4.18%, followed by distribution and inventory control, and forecasting and inventory control with 3.14% for each combination. Besides combinations mentioned above, there are 142 more, but most of them have total count of 1 or 2.
During the study, we have also identified emerging topics in operations management, which were not covered by the original list of OM topics described by Chase (1980), and Amoako-Gyampah and Meredith (1989). Supply chain management (SCM) is by far the most common emerging topic, with total count of 573 (47.95%) occurrences. SCM is not that new of a field in OM research, but since it was not included in the original 17 topics, we have decided to count it as an emerging topic. SCM is followed by Role of operations in sustainability with total count of 100 (8.37%) occurrences, Performance measurement and management with total count of 99 (8.28%) occurrences, Lean/agile operations with total count of 91 (7.62%) of occurrences, and New product/service design/development with total count of 78 (6.52%) of occurrences. All other emerging topics comprise remaining 21.26%.
4.2 Research methods
Table 3 presents a matrix of methods used in OM research by journals. The matrix consists of single methods used in research, as well as combination of methods that we have encountered in our study. Methods are sorted by frequency of occurrence. The results in the table show that modeling is still used the most in OM research, with the account of 43.61% in total. The percentages are similar in periods 2009-2010 and 2011-2012, as can be seen from last two columns of the table.
1282
Table 2: Topical coverage of operations management research
It is interesting to note that case study is second most popular method used in OM research, accounted for 12.03%, which is a significant increase in popularity compared to study performed by Pennirselvam et al. (1999). Survey is very close, accounting for 11.99%, while simulation decreased from 17.84% in 1999 to 7.46%. Modelling is mostly used in inventory control and scheduling research, which in accordance with results from previous studies. Empirical methods, namely case study and survey, are predominantly used in research that is dealing with strategic issues of operations management. All other research methodologies account for less than 8%.
Modeling and simulation is the most popular combination used in OM research, accounting for 3.28%. It is also interesting to note the number of times a ―hard‖ methodology, such as modeling or simulation, is backed up with ―softer‖, empirical methodology, namely case study, field study, or survey. The results show that a total number of combinations of ―hard‖ and ―soft‖ research methods accounts for mere 3.53%.
5. COMPARISON WITH PREVIOUS STUDIES AND DISCUSSION
Our main goal was to study research topics and methodology used in operations management research, and to compare it with previous studies of similar type, in order to see whether the established research agendas are being followed, and to see if new trends arose in the 21st century. Table 4 shows comparison of findingsfrom our study, with findings presented by Amoako-Gyampah and Meredith (1989), and Pennirselvam et al. (1999) in their studies.
Table 4: Comparison of OM topics in 1980’s, 1990’s, and 2000’s
In order to test the proportions obtained from our research with the ones given by Amoako-Gyampah and Meredith (1989), and Pennirselvam et al. (1999), we have performed a chi-square test, and hypothesized that relative proportions from all three studies are the same. The results from the chi-square test indicate that the differences between the proportions from all three studies are significant, at an alpha level of 0.01.
The topic that contributes the most to the difference between the proportions is strategy. Our study shows that strategy is the most popular OM research topic, while it was ranked as 5th and 7th topic in Amoako-Gyampah and Meredith (1989), and Pennirselvam et al. (1999) studies, respectively. This rise in popularity was predicted by Amoako-Gyampah and Meredith (1989), and confirmed by Pennirselvam et al. (1999) study, as well as in our study. It is interested to note that growth in popularity of strategy corresponds to the growth of popularity of emerging topics. To test this, we have analyzed further the relationship of emerging topics with the traditional OM topics, and found out that in most of the cases emerging topics were included under strategy, where more than 50% of articles about supply chain management were dealing with strategic issues of operations management. The situation is even more indicative with lean/agile operations, where nearly 70% of the articles were included under strategy. Inventory control and scheduling are still positioned high on the list (2nd and 3rd place), as was the case with previous research. Inventory control and schedulingare two topics that are traditionally combined one with another, but what is interesting is the rise of combinations of inventory control with other OM topics, especially the ones that are dealing with logistical aspects of operations, namely purchasing and distribution. This is an encouraging fact, showing a sign of
1285
integrative approach of current OM research. Process design is also positioned high on the list, as was the case with previous research. It is frequently combined with strategy, which was also shown in Pennirselvam et al. (1999), but there’s an increase of process design/quality combinations compared with the mentioned study.
As far as methodology goes, modeling is still number one choice among OM researchers. This fact is unsettling, because it contributes to the fact that OM is perceived as an artificial discipline, detached from real-life problems, since modeling is still utilized more than empirical research. What gives hope is the fact that the results show the increase of survey and case study utilization in OM research. This corresponds to the rise of interest in strategic issues of operations, since survey and modeling are methods mostly used in strategy research. This deflection from artificial and axiomatic research is also noted by Craighead and Meredith (2008), but it is not enough to make a paradigm shift in operations management research. Although it wasn’t addressed explicitly in this study, action based research is still not used enough in OM research, whiles many scholar stress the importance of action oriented research, since it can contribute to knowledge as well as to practice (Coughlan and Coghlan, 2002; Näslund et al., 2010; Sheikhzadeh and Heidari, 2012). The popularity of modeling can be attributed to one of two factors. Firstly, high level of rigor is required in top-ranked scientific journals, which puts reviewers in a tough position. Reviewers are often unable to recognize the work properly executed with less-of-a-standard methodologies, while some reviewers perceiving case and action-based methodologies as less structured than traditional analytical modeling (Barratt et al., 2011). Secondly, in today’s ―publish or perish‖ environment, the authors are forced to walk the tested paths, and use ―proven‖ methods in their research. This saves their time, since they don’t have to spend months (or even years) in a real life environment trying to solve concrete problems, and grants them a better starting position in a review process, since they too are aware that a high level of rigor can more easily be followed by utilizing traditional research methods, such as mathematical optimization or simulation.
Pennirselvam et al. (1999) stated in their study that a new, more relevant list of OM topics might be needed, having in mind the rise of popularity of supply chain management and new product/service development/design. We concur with this point, as our study also shows the popularity of supply chain management, as well as other topics, such as lean/agile operations and performance measurement and management.
6. CONCLUSIONS AND FURTHER RESEARCH
The main goal of this study was to compare the current state of operations management research (topic- and methodology-wise) with similar research conducted in the past. The results have confirmed some conclusions from the past research, and have backed up some predictions regarding topical coverage of OM research. Two main problems still are the lack of integrative approach to OM research, and detachment of OM research from real-life problems. Although some advancement has been made, the number of articles which combine several topics in one research is still relatively small. Mathematical modelling is still dominant methodology used in OM research, although case study and survey gained in popularity. This gain is in correlation with the rise of popularity of strategic topics, since these two methodologies are most frequently used in this type of research.
An update of OM topics list is definitely needed, since it is hard to categorise some articles that are OM in nature by using the existing topic list. Some new topics have been noted in earlier research, such as supply management, new product development, and sustainability and environmental concerns. In the meantime, more topics have emerged, such as lean/agile operations and performance measurement and management.
Previous studies compared published research to pipeline research, and the result show differences both in topical coverage and in methodologies being utilized. The future of our research would be to cover more years with published research, and also to analyze conference proceedings in order to see if anything has changed regarding the relationship between published and pipeline research. It would also be interesting to see if new research methodologies are being used with the emerging topics, and to devote a special study to action-based research, and the way it is represented in top-tier OM related journals. Since action research is advocated by many OM scholars, we think that a separate study on action research in operations management is needed.
REFERENCES
Amoako-Gyampah, K., & Meredith, J. R. (1989). The operations management research agenda: an update. Journal of Operations Management, 8(3), 250-262.
Barman, S., Hanna, M. D., & LaForge, R. L. (2001). Perceived relevance and quality of POM journals: a decade later. Journal of Operations Management, 19(3), 367-385.
1286
Barratt, M., Choi, T. Y., & Li, M. (2011). Qualitative case studies in operations management: trends, research outcomes, and future research implications. Journal of Operations Management, 29(4), 329-342.
Buffa, E. S. (1980). Research in operations management. Journal of Operations Management, 1(1), 1-7. Chase, R. B. (1980). A classification and evaluation of research in operations management. Journal of
Operations Management, 1(1), 9-14. Chase, R., Jacobs, F., Aquilano, N. (2006). Operations Management for Competitive Advantage. McGraw-
Hill, New York. Coughlan, P., & Coghlan, D. (2002). Action research for operations management. International journal of
operations & production management, 22(2), 220-240. Craighead, C. W., & Meredith, J. (2008). Operations management research: evolution and alternative future
paths. International Journal of Operations & Production Management, 28(8), 710-726. Hill, A. V., Scudder, G. D., & Haugen, D. L. (1987). Production/Operations Management Agenda for the 80's:
A Progress Report. In Proceedings of the 1987 DSI Conference, Decision Sciences Institute, Boston, MA (pp. 840-842).
Machuca, J. A., González-Zamora, M. D. M., & Aguilar-Escobar, V. G. (2007). Service operations management research. Journal of Operations Management, 25(3), 585-603.
Meredith, J. R., Raturi, A., Amoako-Gyampah, K., & Kaplan, B. (1989). Alternative research paradigms in operations. Journal of operations management, 8(4), 297-326.
Miller, J. G., Graham, M. B., Freeland, J. R., Hottenstein, M., Maister, D. H., Meredith, J., & Schmenner, R. W. (1981). Production/operations management: agenda for the'80s. Decision Sciences, 12(4), 547-571.
Näslund, D., Kale, R., & Paulraj, A. (2010). Action research in supply chain management—a framework for relevant and rigorous research. Journal of Business Logistics, 31(2), 331-355.
Pannirselvam, G. P., Ferguson, L. A., Ash, R. C., & Siferd, S. P. (1999). Operations management research: an update for the 1990s. Journal of Operations Management, 18(1), 95-112.
Pilkington, A., & Liston-Heyes, C. (1999). Is production and operations management a discipline? A citation/co-citation study. International Journal of Operations & Production Management, 19(1), 7-20.
Sheikhzadeh, A., Heidari, H. (2012). Operations management research: a 10-year survey. In: Proceedings of the 2012 International Conference on Industrial Engineering and Operations Management, Istanbul, Turkey (pp. 2472-2481).
Soteriou, A. C., Hadjinicola, G. C., & Patsia, K. (1999). Assessing production and operations management related journals: the European perspective. Journal of Operations Management, 17(2), 225-238.
Theoharakis, V., Voss, C., Hadjinicola, G. C., & Soteriou, A. C. (2007). Insights into factors affecting Production and Operations Management (POM) journal evaluation. Journal of Operations Management, 25(4), 932-955.