60
Operations Management Managing Quality 1

Operations
Management
Managing Quality
1
Learning Objectives
¨ Identify or define:
¨ Quality
¨ Malcolm Baldrige National Quality Awards
¨ Demings, Juran, and Crosby
¨ Taguchi Technique
2

Learning Objectives - continued
¨ Describe or Explain:
¨ Why quality is important
¨ Total Quality Management (TQM)
¨ House of Quality
¨ Pareto charts
¨ Process charts
¨ Quality robust products
¨ Inspection
3

To Make the Quality Focus Work
Motorola:
¨ Aggressively began a worldwide education
program to be sure that employees understood
quality and statistical process control
¨ Established goals
¨ Established extensive employee participation
and employee teams
4
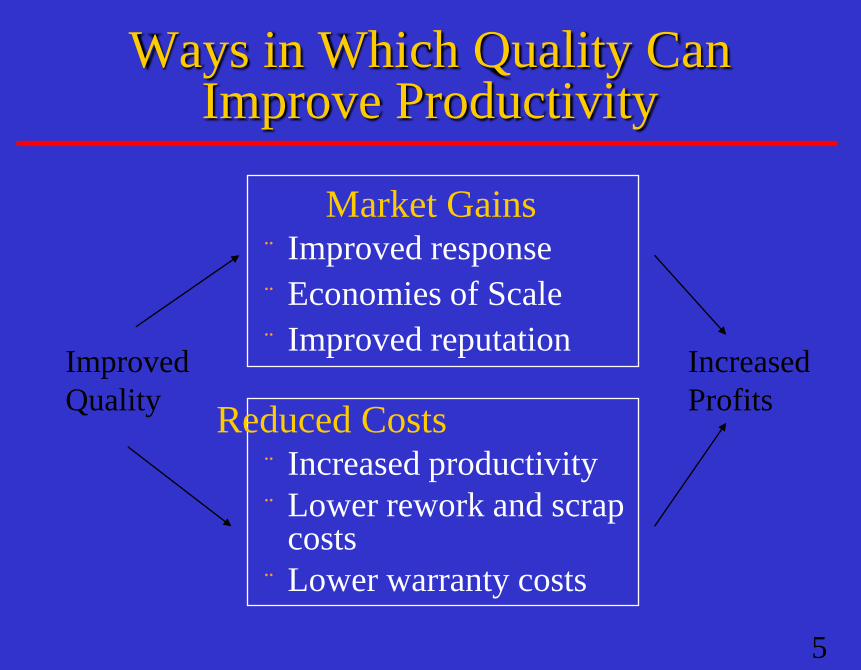
Ways in Which Quality Can Improve Productivity
Market Gains ¨ Improved response
¨ Economies of Scale
¨ Improved reputation
Reduced Costs ¨ Increased productivity
¨ Lower rework and scrap costs
¨ Lower warranty costs
Increased
Profits
Improved
Quality
5

Flow of Activities Necessary to Achieve Total Quality Management
¨ Organizational Practices
¨ Quality Principles
¨ Employee Fulfillment
¨ Customer Satisfaction
6
Organizational Practices
¨ Leadership
¨ Mission statement
¨ Effective operating procedure
¨ Staff support
¨ Training
Yields: What is important and what is to be
accomplished
7

Quality Principles
¨ Customer focus
¨ Continuous improvement
¨ Employee empowerment
¨ Benchmarking
¨ Just-in-time
¨ Tools of TQM
Yields: How to do what is important and to be
accomplished
8

Employment Fulfillment
¨ Empowerment
¨ Organizational commitment
Yields: Employees attitudes that can
accomplish what is important and to be
accomplished
9
Customer Satisfaction
¨ Meeting customer needs
¨ Repeat customers
Yields: An effective organization with a
competitive advantage
10

Definitions of Quality
¨ ASQC: Product characteristics & features
that affect customer satisfaction
¨ User-Based: What consumer says it is
¨ Manufacturing-Based: Degree to which a
product conforms to design specification
¨ Product-Based: Level of measurable
product characteristic
11
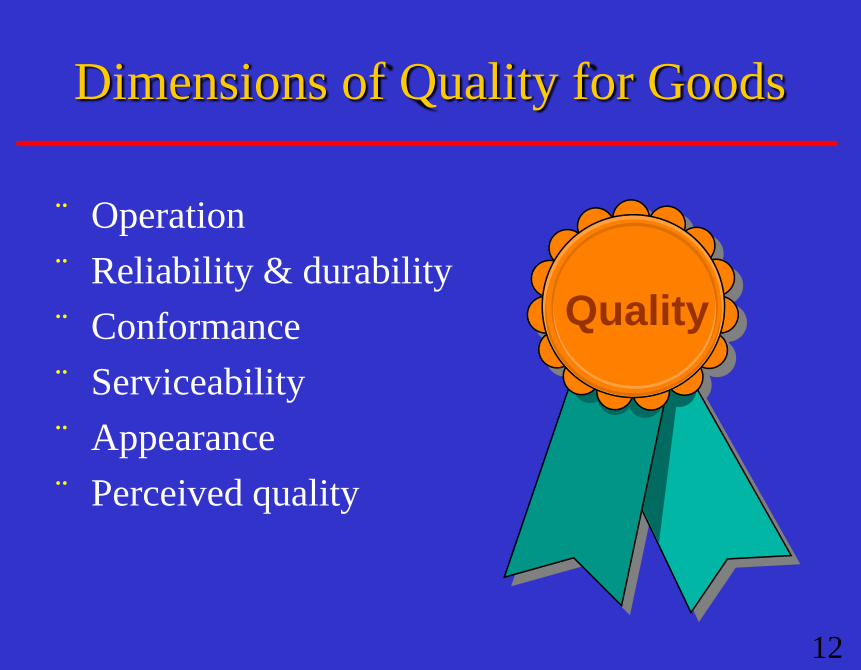
¨ Operation
¨ Reliability & durability
¨ Conformance
¨ Serviceability
¨ Appearance
¨ Perceived quality
Quality
Dimensions of Quality for Goods
12
Three Reasons Quality is Important
¨ Company reputation
¨ Product liability
¨ Global implications
13

Importance of Quality
¨ Company’s
reputation
¨ Product
liability
¨ International
implications
Increased
Profits
Lower Costs
Productivity
Rework/Scrap
Warranty
Market Gains
Reputation
Volume
Price
Improved
Quality
¨ Costs & market
share
14

International Quality Standards
¨ Industrial Standard Z8101-1981 (Japan)
¨ Specification for TQM
¨ ISO 9000 series (Europe/EC)
¨ Common quality standards for products sold
in Europe (even if made in U.S.)
¨ ISO 14000 series (Europe/EC)
¨ Standards for recycling, labeling etc.
¨ ASQC Q90 series; MILSTD (U.S.)
15

¨ Established in 1988 by the U.S. government
¨ Designed to promote TQM practices
¨ Some criteria
¨ Senior executive leadership; strategic planning;
management. of process quality
¨ Quality results; customer satisfaction
¨ Recent winners
¨ Corning Inc.; GTE; AT&T; Eastman Chemical.
Malcom Baldridge National Quality Award
16

EC Environmental Standard ISO 14000
Core Elements:
¨ Environmental management
¨ Auditing
¨ Performance evaluation
¨ Labeling
¨ Life-cycle assessment
17

Traditional Quality Process (Manufacturing)
Specifies
Need
Customer
Interprets
Need
Marketing
Designs
Product
Defines
Quality
Engineering
Produces
Product
Plans
Quality
Monitors
Quality
Operations
Quality is
customer driven!
18

TQM
Encompasses entire organization, from
supplier to customer
Stresses a commitment by management to
have a continuing company-wide drive
toward excellence in all aspects of products
and services that are important to the
customer.
19
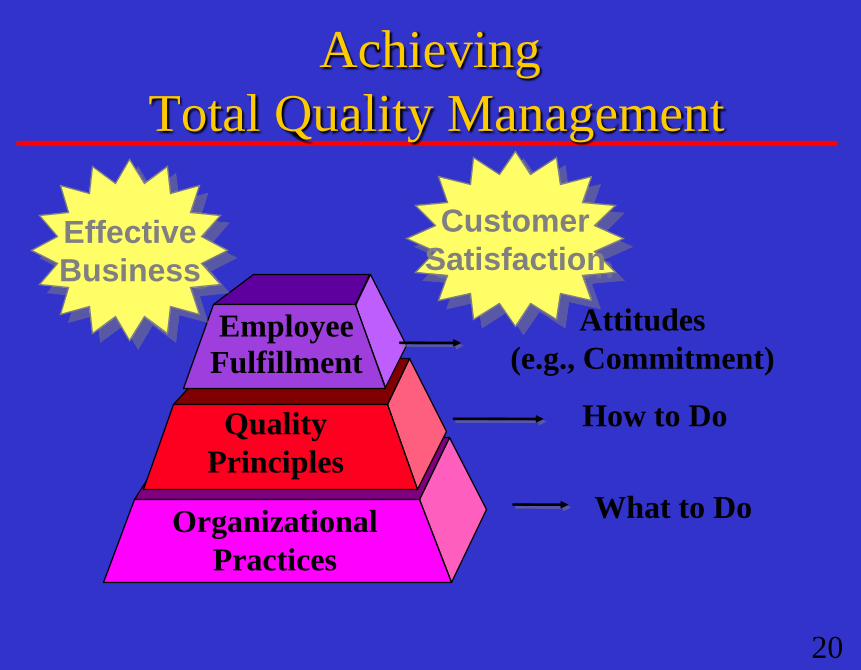
Organizational
Practices
Quality
Principles
Employee
Fulfillment
Attitudes
(e.g., Commitment)
How to Do
What to Do
Effective
Business
Customer
Satisfaction
Achieving
Total Quality Management
20

Concepts of TQM
¨ Continuous improvement
¨ Employee empowerment
¨ Benchmarking
¨ Just-in-time (JIT)
¨ Knowledge of tools
21
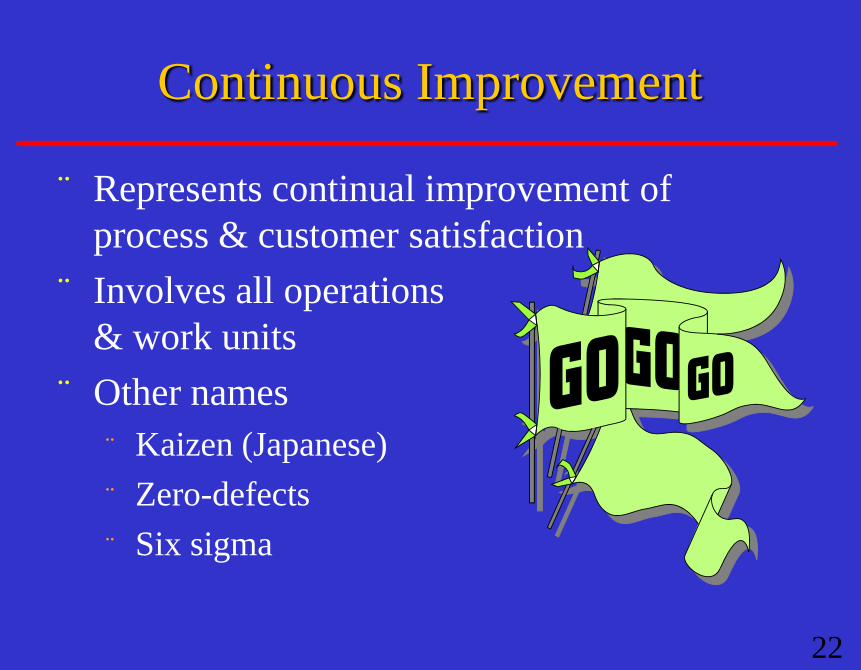
Continuous Improvement
¨ Represents continual improvement of
process & customer satisfaction
¨ Involves all operations
& work units
¨ Other names
¨ Kaizen (Japanese)
¨ Zero-defects
¨ Six sigma
22
Employee Empowerment
¨ Getting employees involved in product
& process improvements
¨ 85% of quality problems are due to
process & material
¨ Techniques
¨ Support workers
¨ Let workers make decisions
¨ Build teams & quality circles
© 1995 Corel Corp.
23

Quality Circles
¨ Group of 6-12 employees from same
work area
¨ Meet regularly to solve work-related
problems
¨ 4 hours/month
¨ Facilitator trains
& helps with
meetings
24
Deming’s Fourteen Points
1. Create consistency of purpose
2. Lead to promote change
3. Build quality into the products
4. Build long term relationships
5. Continuously improve product, quality, and service
6. Start training
7. Emphasize leadership
25

Deming’s Points - continued
8. Drive out fear
9. Break down barriers between departments
10. Stop haranguing workers
11. Support, help, improve
12. Remove barriers to pride in work
13. Institute a vigorous program of education and self-improvement
14. Put everybody in the company to work on the transformation
26
Benchmarking
Selecting best practices to use
as a standard for performance
¨ Determine what to benchmark
¨ Form a benchmark team
¨ Identify benchmarking partners
¨ Collect and analyze benchmarking information
¨ Take action to match or exceed the benchmark
27
Resolving Customer Complaints
¨ Make it easy for clients to complain
¨ Respond quickly to complaints
¨ Resolve complaints on the first contact
¨ Use computers to manage complaints
¨ Recruit the best for customer service jobs
28
Just-in-Time (JIT)
Relationship to quality:
¨ JIT cuts cost of quality
¨ JIT improves quality
¨ Better quality means less inventory and better,
easier-to-employ JIT system
29

Just-in-Time (JIT)
¨ ‘Pull’ system of production/purchasing
¨ Customer starts production with an order
¨ Involves ‘vendor partnership programs’ to
improve quality of purchased items
¨ Reduces all inventory levels
¨ Inventory hides process & material problems
¨ Improves process & product quality
30

Just-In-Time (JIT) Example
Scrap
Work in process inventory level
(hides problems)
Unreliable
Vendors
Capacity
Imbalances
31
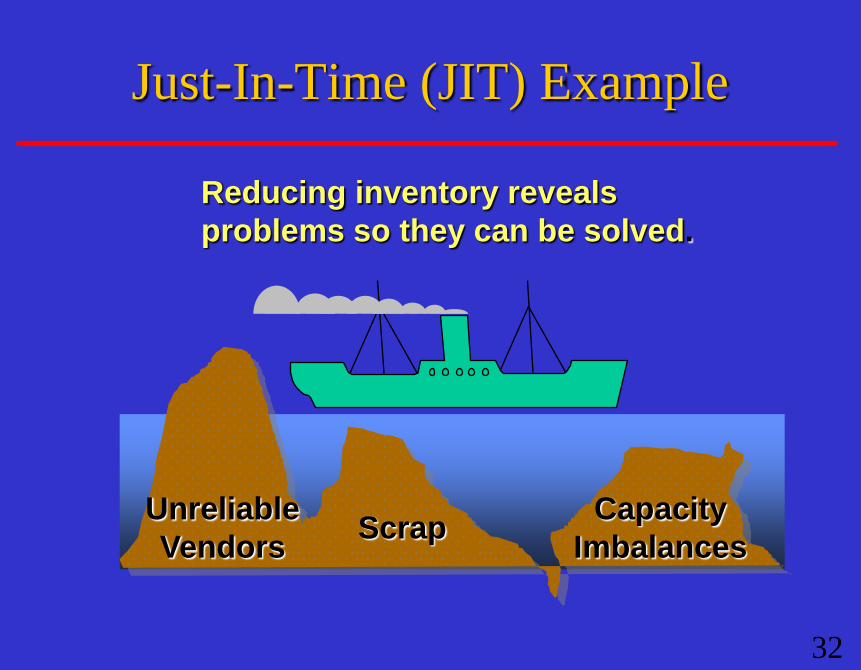
Just-In-Time (JIT) Example
Scrap
Reducing inventory reveals
problems so they can be solved.
Unreliable
Vendors
Capacity
Imbalances
32

Tools for TQM
1. Quality Function Deployment
House of Quality
2. Taguchi technique
3. Quality loss function
4. Pareto charts
5. Process charts
6. Cause-and-effect diagrams
7. Statistical process control
33

Quality Function Deployment (QFD)
¨ Determines what will satisfy the customer
¨ Translates those customer desires into the
target design
34
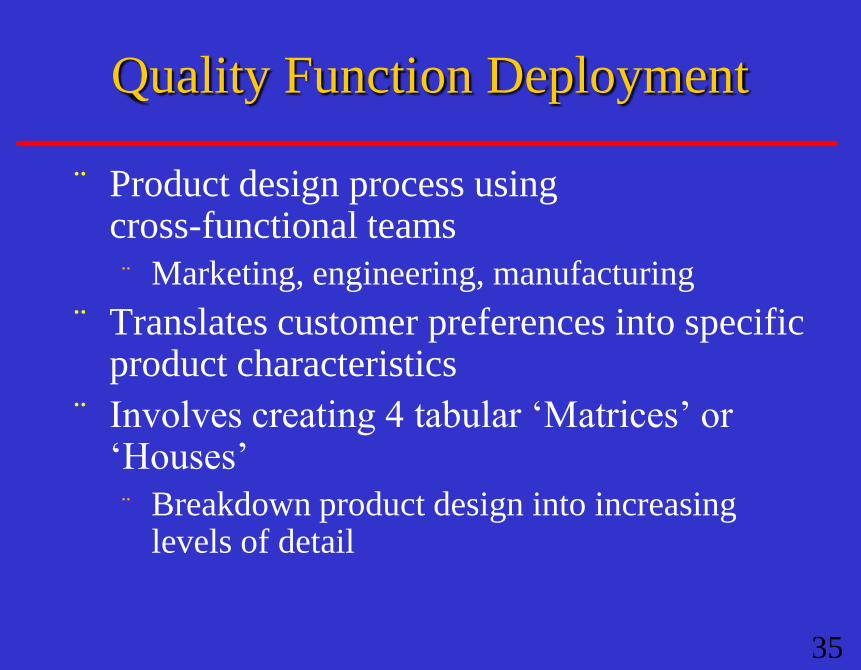
Quality Function Deployment
¨ Product design process using cross-functional teams
¨ Marketing, engineering, manufacturing
¨ Translates customer preferences into specific product characteristics
¨ Involves creating 4 tabular ‘Matrices’ or ‘Houses’
¨ Breakdown product design into increasing levels of detail
35
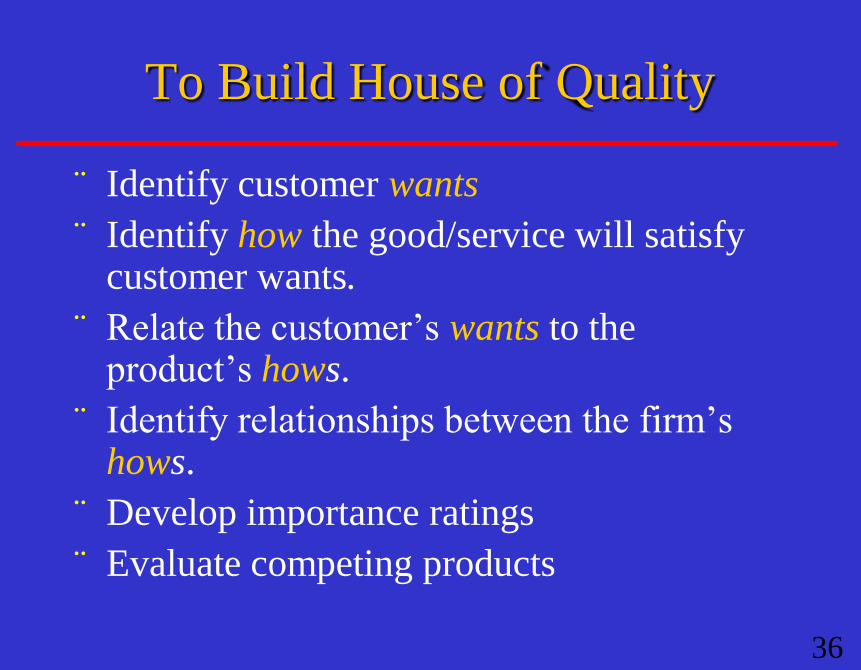
To Build House of Quality
¨ Identify customer wants
¨ Identify how the good/service will satisfy customer wants.
¨ Relate the customer’s wants to the product’s hows.
¨ Identify relationships between the firm’s hows.
¨ Develop importance ratings
¨ Evaluate competing products
36
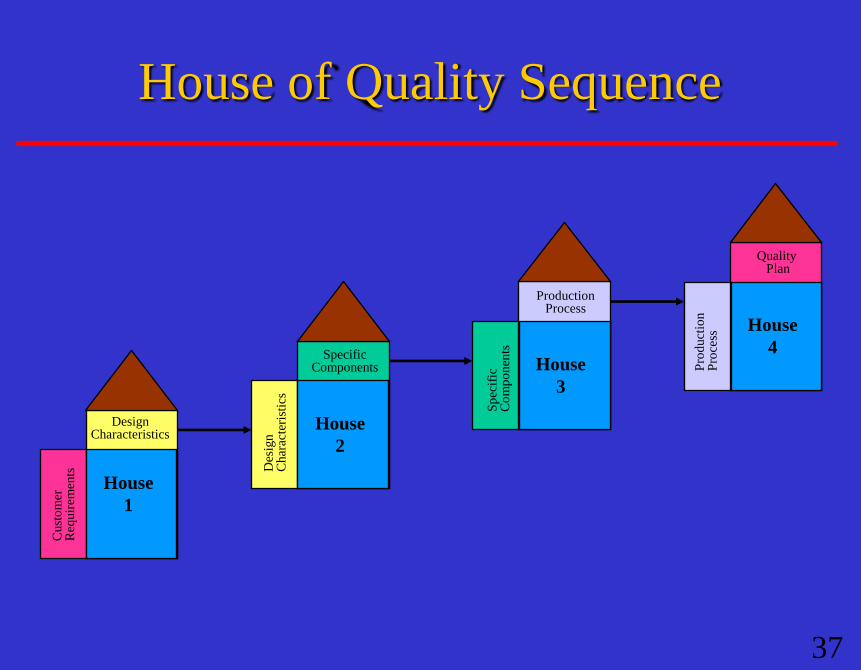
House of Quality Sequence
Design Characteristics
Quality Plan
Production Process
Specific Components
Des
ign
Char
acte
rist
ics
Sp
ecif
ic
Co
mp
onen
ts
Pro
duct
ion
Pro
cess
Cust
om
er
Req
uir
emen
ts
House
2
House
1
House
3
House
4
37
Taguchi Techniques
¨ Experimental design methods to improve
product & process design
¨ Identify key component & process variables
affecting product variation
¨ Taguchi Concepts
¨ Quality robustness
¨ Quality loss function
¨ Target specifications
38

¨ Ability to produce
products uniformly
regardless of
manufacturing
conditions
¨ Put robustness in
House of Quality
matrices besides
functionality © 1984-1994 T/Maker Co.
© 1995 Corel Corp.
Quality Robustness
39
¨ Shows social cost ($) of deviation from target
value
¨ Assumptions
¨ Most measurable quality characteristics (e.g.,
length, weight) have a target value
¨ Deviations from target value are undesirable
¨ Equation: L = D2 • C
¨ L = Loss ($); D = Deviation; C = Cost
Quality Loss Function
40
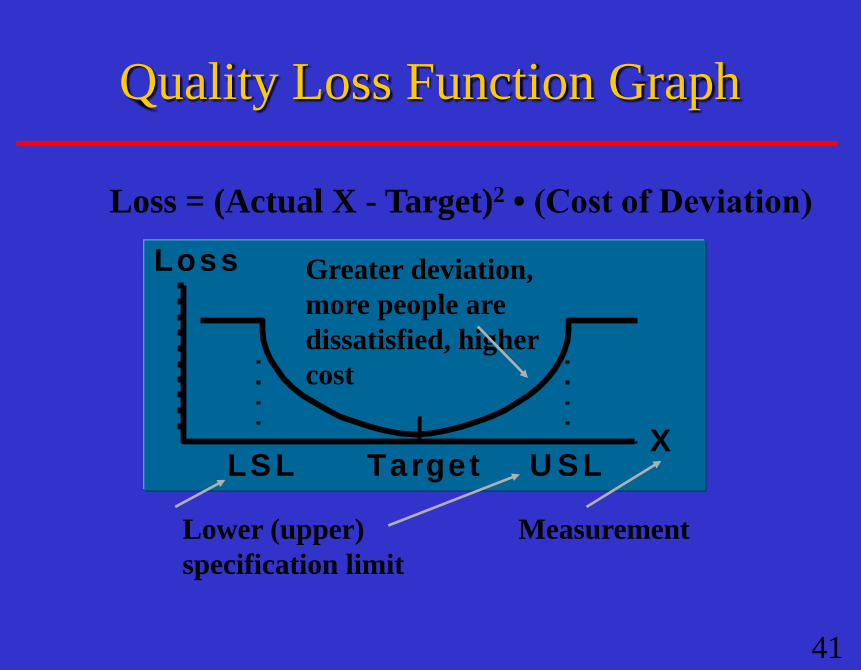
Loss
XTarget U SLLSL
Loss = (Actual X - Target)2 • (Cost of Deviation)
Lower (upper)
specification limit
Measurement
Greater deviation,
more people are
dissatisfied, higher
cost
Quality Loss Function Graph
41
The specifications for the
diameter of a gear are 25.00
± 0.25 mm.
If the diameter is out of
specification, the gear must
be scrapped at a cost of
$4.00. What is the loss
function?
© 1984-1994 T/Maker Co.
Quality Loss Function Example
42
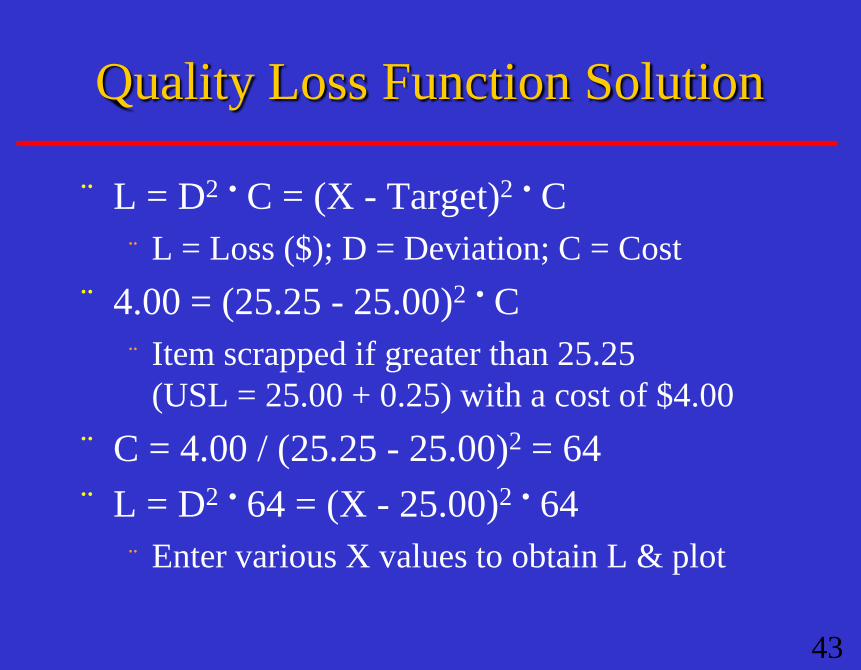
¨ L = D2 • C = (X - Target)2 • C
¨ L = Loss ($); D = Deviation; C = Cost
¨ 4.00 = (25.25 - 25.00)2 • C
¨ Item scrapped if greater than 25.25
(USL = 25.00 + 0.25) with a cost of $4.00
¨ C = 4.00 / (25.25 - 25.00)2 = 64
¨ L = D2 • 64 = (X - 25.00)2 • 64
¨ Enter various X values to obtain L & plot
Quality Loss Function Solution
43

Freq.
XTarget USLLSL
A study found U.S. consumers preferred Sony TV’s made in Japan to those made in the U.S. Both factories used the same designs & specifications. The difference in quality goals made the difference in consumer preferences.
Japanese factory (Target-oriented)
U.S. factory (Conformance-oriented)
Target Specification Example
44

Pareto Analysis of Wine Glass Defects
54
12
5 4 20
10
20
30
40
50
60
70
Scratches Porosity Nicks Contamination Misc
Causes, by percent of total defects
Fre
quen
cy (
num
ber
)
72% 16% 5% 4% 3%
45
¨ Shows sequence of events in process
¨ Depicts activity relationships
¨ Has many uses
¨ Identify data collection points
¨ Find problem sources
¨ Identify places for improvement
¨ Identify where travel distances can be reduced
Process Chart
46
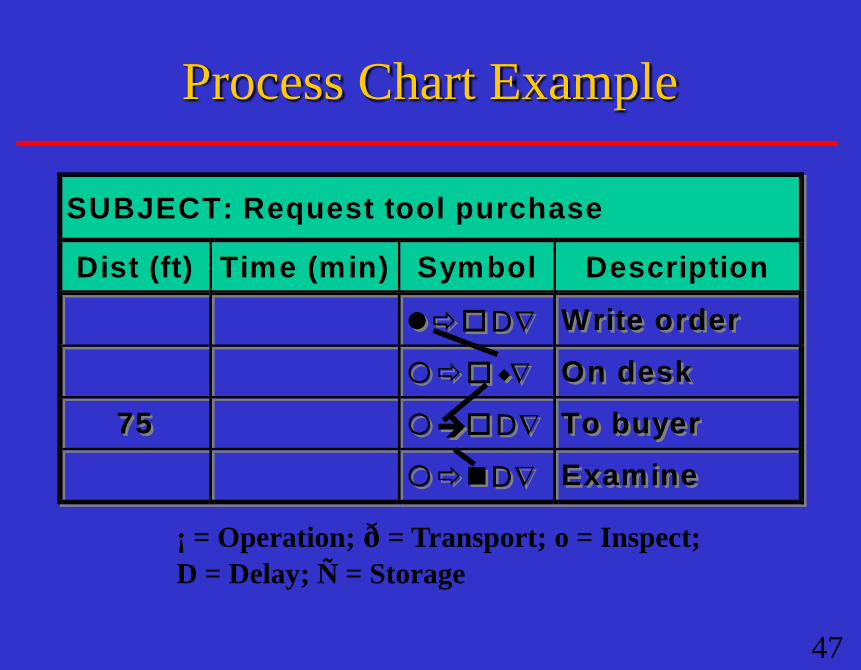
SUBJECT: Request tool purchase
Dist (ft) Time (min) Symbol Description
D Write order
On desk
75 D To buyer
D Examine
SUBJECT: Request tool purchase
Dist (ft) Time (min) Symbol Description
D Write order
On desk
75 D To buyer
D Examine
¡ = Operation; ð = Transport; o = Inspect;
D = Delay; Ñ = Storage
Process Chart Example
47
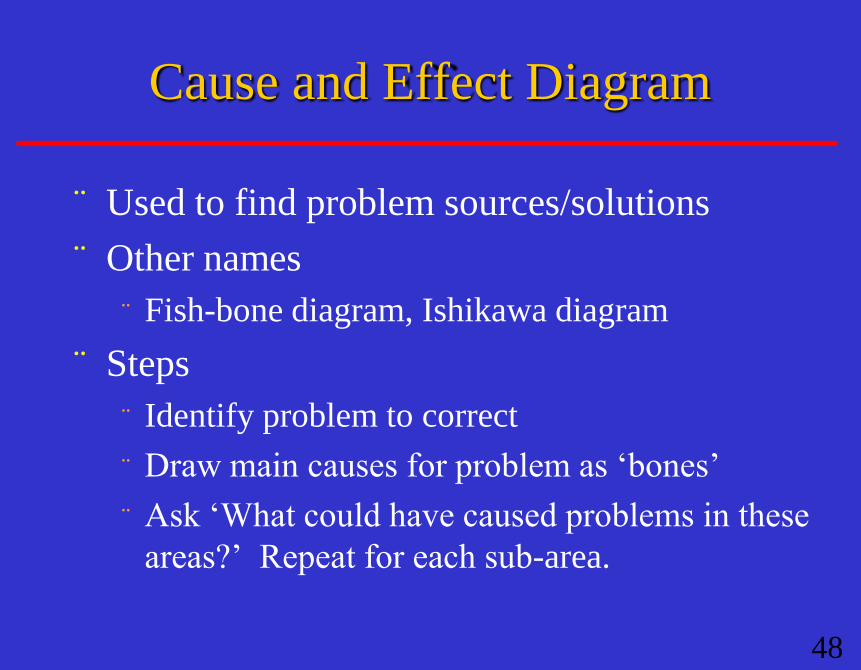
¨ Used to find problem sources/solutions
¨ Other names
¨ Fish-bone diagram, Ishikawa diagram
¨ Steps
¨ Identify problem to correct
¨ Draw main causes for problem as ‘bones’
¨ Ask ‘What could have caused problems in these
areas?’ Repeat for each sub-area.
Cause and Effect Diagram
48
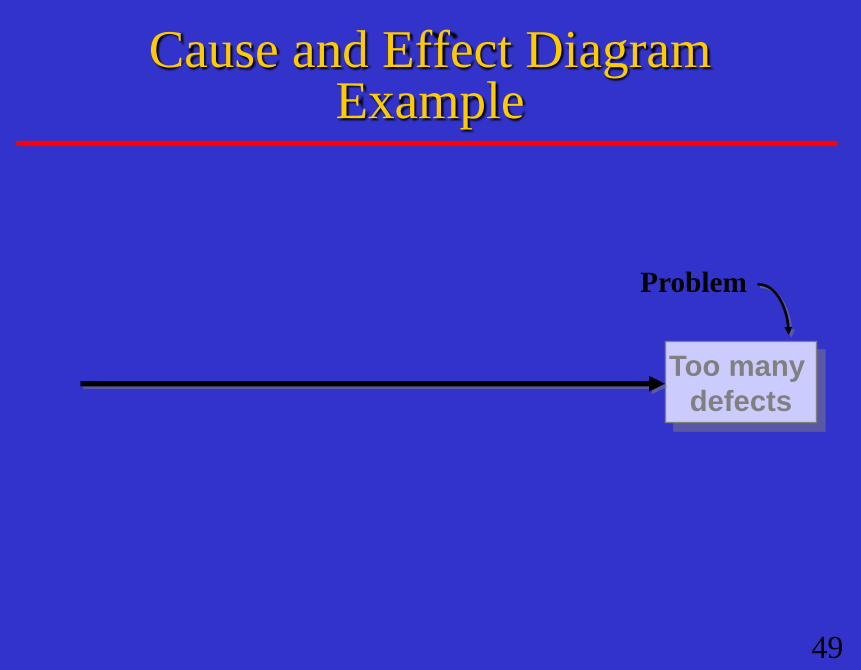
Too many
defects
Problem
Cause and Effect Diagram Example
49

Method Manpower
Material Machinery
Too many
defects
Main Cause
Main Cause
Cause and Effect Diagram Example
50

Method Manpower
Material Machinery
Drill Over Time
Steel
Wood
Lathe
Too many
defects
Sub-Cause
Cause and Effect Diagram Example
51
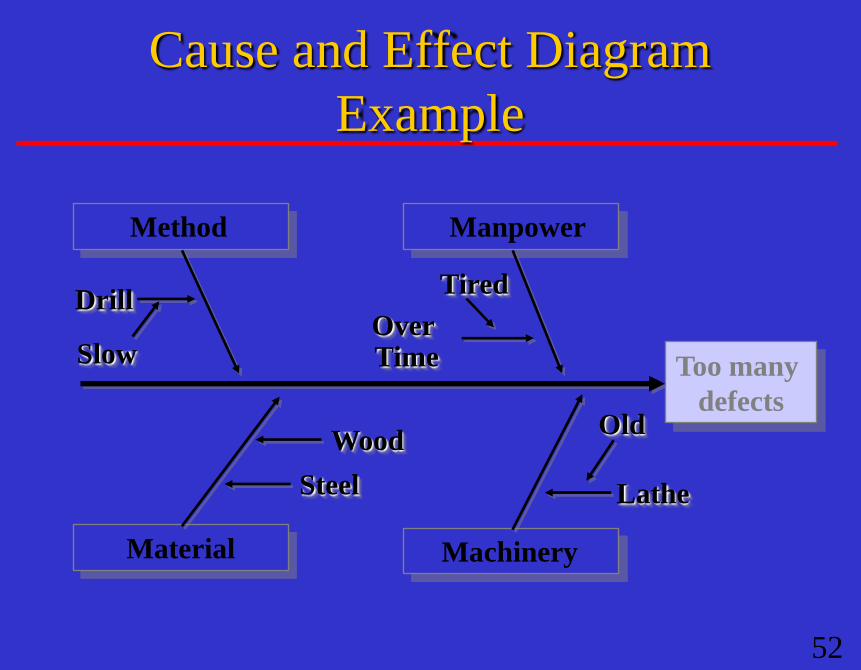
Method Manpower
Material Machinery
Drill Over Time
Steel
Wood
Lathe
Too many
defects
Tired
Old
Slow
Cause and Effect Diagram
Example
52
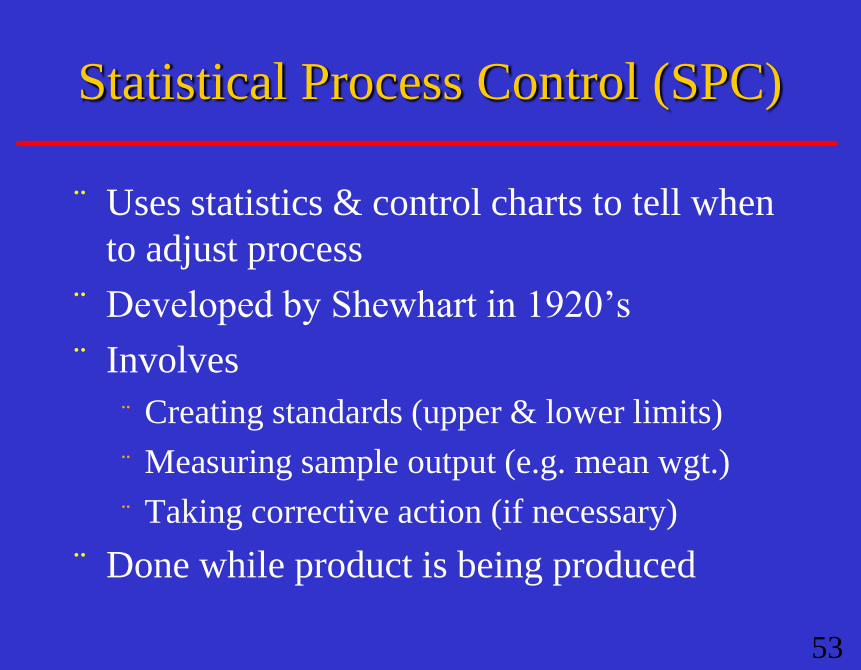
¨ Uses statistics & control charts to tell when
to adjust process
¨ Developed by Shewhart in 1920’s
¨ Involves
¨ Creating standards (upper & lower limits)
¨ Measuring sample output (e.g. mean wgt.)
¨ Taking corrective action (if necessary)
¨ Done while product is being produced
Statistical Process Control (SPC)
53
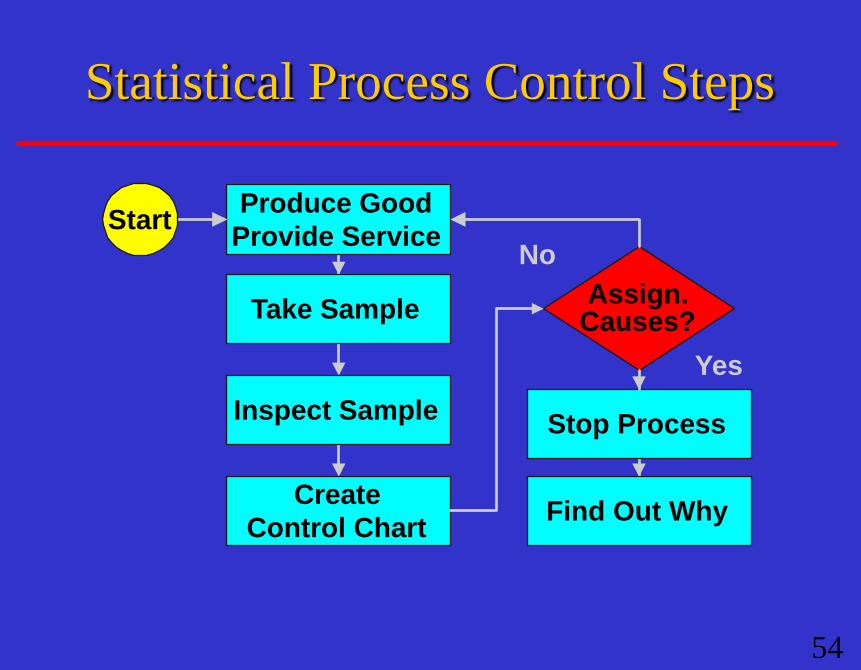
Produce Good
Provide Service
Stop Process
Yes
No
Assign. Causes? Take Sample
Inspect Sample
Find Out Why Create
Control Chart
Start
Statistical Process Control Steps
54
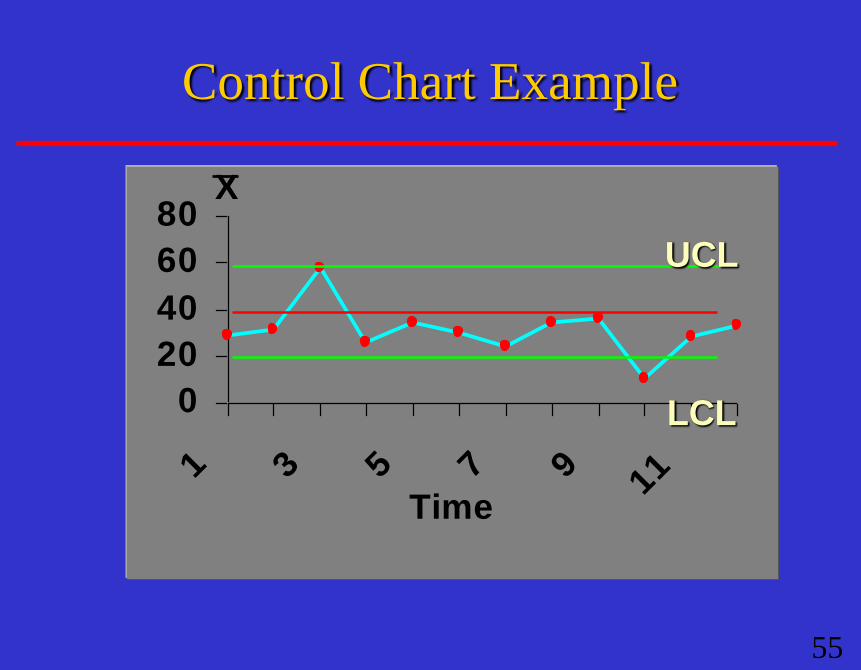
0
20
40
60
80
1 3 5 7 911
X
Time
UCL
LCL
Control Chart Example
55
¨ Involves examining items to see if an item
is good or defective
¨ Detect a defective product
¨ Does not correct deficiencies in process or
product
¨ Issues
¨ When to inspect
¨ Where in process to inspect
Inspection
56

When and Where to Inspect
¨ At the supplier’s plant while the supplier is
producing
¨ At your plant upon receipt of goods from the
supplier
¨ Before costly or irreversible processes
¨ During the step-by-step production processes
¨ When production is complete
¨ Before shipment from your plant
¨ At the point of customer contact
57

Bank Teller station Speed, courtesy
Checking Accuracy
Store Stockrooms Stock rotation
Display areas Attractiveness
Counters Courtesy,
knowledge
Business Where Variable
When and Where to Inspect in Services
58

¨ Service quality is more difficult to measure
than for goods
¨ Service quality perceptions depend on
¨ Expectations vs. reality
¨ Process & outcome
¨ Types of service quality
¨ Normal: Routine service delivery
¨ Exceptional: How problems are handled
TQM In Services
59
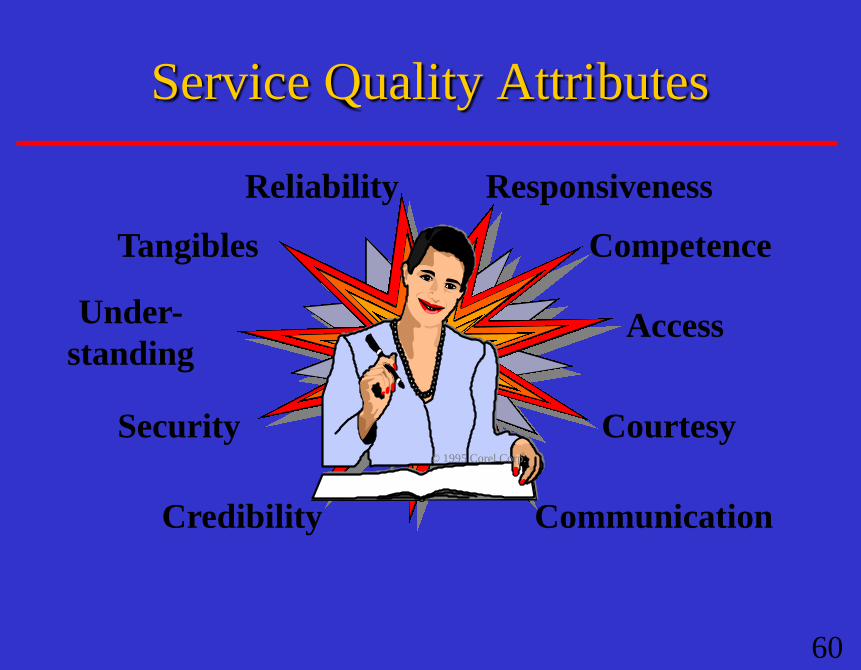
Under-
standing
Tangibles
Reliability
Communication Credibility
Security
Responsiveness
Competence
Courtesy
Access
© 1995 Corel Corp.
Service Quality Attributes
60


