Original Contributions Cover Story Opioid prescribing practices from 2010 through 2015 among dentists in the United States What do claims data tell us? Niodita Gupta, MD, MPH, PhD; Marko Vujicic, PhD; Andrew Blatz, MS ABSTRACT Background. Dentists wrote 6.4% of all opioid prescriptions in the United States in 2012. The purpose of this study was to examine opioid prescription rates, dosage of opioids prescribed, type of opioid drug prescribed, and type of dental visit at which dentists prescribe opioids. Methods. The authors used the 2010 through 2015 Truven Health Marketscan Research databases and the Prescription Drug Monitoring Program (PDMP) Training and Technical Assistance Center conversion data set. The authors conducted descriptive analyses for days’ supply, quantity pre- scribed, and daily morphine milligram equivalent dose. Results. The opioid prescription rate per 1,000 dental patients increased from 130.58 in 2010 to 147.44 in 2015. Approximately 68.41% of all opioids prescribed were during surgical dental visits and approximately 31.10% during nonsurgical dental visits. During nonsurgical dental visits at which dentists prescribed an opioid, most of the procedures were restorative. Conclusions. Among a population of dental patients with private insurance, opioid prescribing rates in the United States increased slightly from 2010 to 2015. The largest increase was among 11- through 18-year-olds. Almost one-third of opioid prescriptions written by dentists were associated with nonsurgical dental visits. Practical Implications. Use of PDMP resources and use of nonopioid analgesics could help reduce the number of opioid prescriptions in dentistry. Key Words. Opioids; prescriptions; dentists. JADA 2018:149(4):237-245 https://doi.org/10.1016/j.adaj.2018.01.005 T he United States is facing a severe opioid addiction epidemic. In 2015, approximately 12.5 million people misused prescription opioids. 1 Approximately 2.1 million people misused prescription opioids for the first time, and an estimated 2 million had a prescription opioid use disorder. 1 Opioid overdoses caused 33,091 deaths in 2015 alone. 1 The amount of opioids prescribed in 2010 was 782 morphine milligram equivalents (MMEs) per capita, which decreased to 640 MME per capita in 2015. 2 Investigators estimated the economic burden of opioid overdose, abuse, and dependence in 2013 to be $78.5 billion from a societal perspective. 3 In 1998, dentists were the top specialty prescribers of immediate-release opioids, accounting for 15.5% of all immediate-release opioid prescriptions. 4 However, by 2009, the amount of opioid prescriptions written by dentists decreased to 8% of all opioid prescriptions in the United States, 5 and by 2012, this amount further decreased to 6.4%. 6 More recent and detailed data are available in some states. For example, in South Carolina during 2012 and 2013, dentists accounted for only 8.9% of all opioid prescribers but prescribed 44.9% of the initial opioids dispensed to patients. 7 Patients younger than 21 years received 11.2% of the total amount of opioids that dentists pre- scribed. 7 Investigators conducted a study in Indiana and used 2011 data, and their results showed that access to dentists and pharmacists increased the availability of prescription opioids and that this This article has an accompanying online continuing education activity available at: http://jada.ada.org/ce/home. Copyright ª 2018 American Dental Association. All rights reserved. JADA 149(4) n http://jada.ada.org n April 2018 237
Transcript
Original Contributions
Cover StoryOpioid prescribing practices from 2010through 2015 among dentists in the UnitedStatesWhat do claims data tell us?
Niodita Gupta, MD, MPH, PhD; Marko Vujicic, PhD; Andrew Blatz, MS
ABSTRACT
Background. Dentists wrote 6.4% of all opioid prescriptions in the United States in 2012. Thepurpose of this study was to examine opioid prescription rates, dosage of opioids prescribed, type ofopioid drug prescribed, and type of dental visit at which dentists prescribe opioids.
Methods. The authors used the 2010 through 2015 Truven Health Marketscan Research databasesand the Prescription Drug Monitoring Program (PDMP) Training and Technical Assistance Centerconversion data set. The authors conducted descriptive analyses for days’ supply, quantity pre-scribed, and daily morphine milligram equivalent dose.
Results. The opioid prescription rate per 1,000 dental patients increased from 130.58 in 2010 to147.44 in 2015. Approximately 68.41% of all opioids prescribed were during surgical dental visitsand approximately 31.10% during nonsurgical dental visits. During nonsurgical dental visits atwhich dentists prescribed an opioid, most of the procedures were restorative.
Conclusions. Among a population of dental patients with private insurance, opioid prescribingrates in the United States increased slightly from 2010 to 2015. The largest increase was among 11-through 18-year-olds. Almost one-third of opioid prescriptions written by dentists were associatedwith nonsurgical dental visits.
Practical Implications. Use of PDMP resources and use of nonopioid analgesics could help reducethe number of opioid prescriptions in dentistry.
he United States is facing a severe opioid addiction epidemic. In 2015, approximately 12.5million people misused prescription opioids.1 Approximately 2.1 million people misused
This article has anaccompanying onlinecontinuing educationactivity available at:
http://jada.ada.org/ce/home.
Copyright ª 2018American Dental
Association. All rightsreserved.
Tprescription opioids for the first time, and an estimated 2 million had a prescription opioiduse disorder.1 Opioid overdoses caused 33,091 deaths in 2015 alone.1 The amount of opioidsprescribed in 2010 was 782 morphine milligram equivalents (MMEs) per capita, which decreased to640 MME per capita in 2015.2 Investigators estimated the economic burden of opioid overdose,abuse, and dependence in 2013 to be $78.5 billion from a societal perspective.3
In 1998, dentists were the top specialty prescribers of immediate-release opioids, accounting for15.5% of all immediate-release opioid prescriptions.4 However, by 2009, the amount of opioidprescriptions written by dentists decreased to 8% of all opioid prescriptions in the United States,5
and by 2012, this amount further decreased to 6.4%.6 More recent and detailed data are available insome states. For example, in South Carolina during 2012 and 2013, dentists accounted for only8.9% of all opioid prescribers but prescribed 44.9% of the initial opioids dispensed to patients.7
Patients younger than 21 years received 11.2% of the total amount of opioids that dentists pre-scribed.7 Investigators conducted a study in Indiana and used 2011 data, and their results showedthat access to dentists and pharmacists increased the availability of prescription opioids and that this
JADA 149(4) n http://jada.ada.org n April 2018 237
increased availability was associated with higher rates of opioid drug abuse.8 Investigators in 1 studyfound that patients did not use 54% of the opioids prescribed during dental surgery.9
Given the high prescription rates, the potential for drug misuse, and the severe ongoing opioidaddiction epidemic, it is important to understand opioid prescription practices and trends indentistry. The purpose of this study was to describe opioid prescription rates, dosage of opioidsprescribed, type of opioid drug prescribed, and type of dental visit at which dentists more frequentlyprescribe opioids in a large sample of people who are privately insured in the United States.
METHODS
Data sourceWe used integrated dental, pharmacy, and medical claims from Truven Health MarketscanResearch (Truven) databases.10 These databases contain claims from people who are privatelyinsured and are the largest convenience sample of the privately insured population. The data pri-marily are obtained from large employers.11 The Truven databases are large enough to be nationallyrepresentative of the privately insured population.10 We also used the Prescription Drug MonitoringProgram (PDMP) Training and Technical Assistance Center (TTAC) conversion data set tocalculate the daily MME dose.12 For example, Percocet (Endo Pharmaceuticals) is a combinationdrug of acetaminophen and oxycodone. According to the MME conversion factor, 1 milligram ofoxycodone is equivalent to 1.5 mg of morphine, so a Percocet tablet with 5 mg of oxycodone isequivalent to 7.5 mg of morphine or has a dose of 7.5 MME.
Study sampleWe selected patients younger than 65 years who had at least 1 prescription of opioids and at least 1dental claim from January 1, 2010, through December 31, 2015, and who were enrolled simulta-neously in a medical and dental plan. eTable 113,14 (available online at the end of this article) liststhe opioid drugs we considered for this study and their MME conversion factors. We compiled thelist of opioid drugs on the basis of the PDMP TTAC list13 and the Centers for Medicare & MedicaidServices list.14 Figures 1 and 2 outline the sample selection criteria. The sample populationconsisted of 1,558,446 opioid prescription claims from 1,135,344 patients.
MeasuresWe defined an opioid prescription as dental related if it occured within 3 days of a dental visit andthere was no inpatient or outpatient claim within those same 3 days. We calculated the number ofdental opioid prescriptions per 1,000 dental visits as the total number of dental opioid prescriptionsdivided by the total number of dental visits among patients enrolled in both a medical and dentalplan, and then we multiplied it by 1,000. We further calculated the number of dental opioidprescriptions per 1,000 dental patients according to age group as the total number of dental opioidprescriptions in an age group divided by the total number of dental patients in that age groupenrolled in both a medical and dental plan, and then we multiplied it by 1,000.
The Truven database reports the number of days of drug therapy covered by the prescription (days’supply), the number of units of drug dispensed (quantity), and the strength of the drug (strength). Weobtained the MME dose by merging the Truven data sets with the PDMP TTAC conversion data set.We calculated the daily dose as the total strength of number of drug units per day (daily dose ¼quantity� strength / days’ supply). We calculated the daily MME dose as the MME conversion factormultiplied by the daily dose.We calculated the average number of days’ supply, quantity prescribed, anddaily MME dose according to age group. We also identified the opioid drugs dentists most frequentlyprescribed. We used the sample population from Figure 1 to calculate the measures described.
We categorized each dental visit at which a dentist prescribed opioids as surgical, nonsurgical,presurgical, or postsurgical. We identified surgical procedures on the basis of the American DentalAssociation Current Dental Terminology codebook15-19 and expert opinion from researchers atacademic institutions. eTable 2 (available online at the end of this article) includes the list of allprocedures that we considered surgical. If a dental visit had any of the procedure codes that weconsidered surgical services, we considered that dental visit as a surgical visit for this study. If adental visit had none of the procedure codes that we considered surgical services, we considered thatdental visit as a nonsurgical visit. It is possible that patients who received an opioid prescription
All pharmacy claims from 1/1/2010 to 12/31/2015 (no. of claims = 359,128,562; no. ofpatients = 11,721,067)
Identifying all opioid pharmacy claims (no. of claims = 24,074,731; no. of patients = 4,991,985)
Retaining patients with opioid pharmacy claims and dental claims (no. of claims = 19,588,172;no. of patients = 4,029,025)
Retaining the opioid claims for the period during which the patient was enrolled in bothdental and medical plan (no. of claims = 19,360,120; no. of patients = 4,002,979)
Rolling up the opioid claims for the same NDC drug code for the same patient on the same day into1 opioid claim (no. of claims = 19,352,843; no. of patients = 4,002,979)
Eliminating invalid claims or claims with missing data (no. of claims = 18,922,877; no. ofpatients = 3,965,878)
Merging with the MME conversion factor data and retaining only those claims with nonmissingdata (no. of claims = 18,922,841; no. of patients = 3,965,876)
Merging with inpatient, outpatient, and dental claims data such that the date of the opioidprescription was within 3 days of the inpatient, outpatient, or dental visit and retaining only thoseopioid claims that had only 1 visit coinciding within 3 days of the prescription date (no. ofclaims = 10,496,250; no. of patients = 3,389,200). This number accounts for the initial fill onlyand not the refills.
Retaining only the opioid claims from a dental visit (no. of claims = 1,558,446; no. ofpatients = 1,135,344). This sample is used for Tables 1 and 2.
print&web4C=FPO
Figure 1. Sample selection criteria. MME: Morphine milligram equivalent. NDC: National Drug Code.
during a nonsurgical dental visit received opioids because they had planned surgical treatment thatwas not initiated during that particular visit. The opioids may have been a way to manage pain untildefinitive surgical treatment could be started. To adjust for this possibility, we classified nonsurgicalvisits with opioid prescriptions that preceded a surgical visit within 15 days as presurgical visits.Similarly, a patient may have prolonged pain after a surgical visit. We adjusted for this possibility bycategorizing those nonsurgical visits with opioid prescriptions that succeeded a surgical visit within15 days as postsurgical visits. We used a subset of the sample population to categorize dental visitsinto these 4 distinct categories as Figure 2 shows. The subsample population in our study consists of1,276,738 opioid prescription claims from 1,004,858 patients.
JADA 149(4) n http://jada.ada.org n April 2018 239
Using the sample population from Figure 1 (no. of claims = 1,558,446; no. of patients = 1,135,344)
Rolling up all opioid prescriptions for the same patient on the same day to calculate total dailydose of opioids (no. of claims = 1,541,508; no. of patients = 1,135,344)
Retaining only those claims such that the opioid prescription date is exactly the same as the dentalvisit date (no. of claims = 1,276,738; no. of patients = 1,004,858). This sample is used for Tables 3 and 4.
print&web4C=FPO
Figure 2. Criteria for selecting the subset of the sample.
240
We then calculated the rate of opioid prescriptions according to age group for surgical, presur-gical, and nonsurgical dental visits. We also calculated the number of days’ supply, quantity pre-scribed, and daily MME dose for surgical, presurgical, postsurgical, and nonsurgical dental visits.Furthermore, we calculated the rate of opioid prescriptions for each category of dental procedures(that is, restorative; endodontic; periodontic; prosthodontic: removable; maxillofacial prosthetics;implant services; prosthodontics: fixed; oral and maxillofacial surgery; orthodontic; and adjunctivegeneral services) separately for both surgical and nonsurgical dental visits. We counted each pro-cedure performed during a visit. For example, if the dentist performed an endodontic procedure andan adjunctive general service procedure during a nonsurgical dental visit associated with an opioidprescription, we counted both the endodontic and adjunctive general service procedures in theirrespective categories as procedures during a nonsurgical dental visit at which the dentist prescribedopioids. Each dental visit is likely to have a diagnostic or preventive procedure associated with it.Hence, we excluded the diagnostic and preventive procedures from the pool of procedures per-formed during surgical and nonsurgical dental visits.
Data analysesWe used statistical software (SAS 9.4, SAS Institute) for data analysis. We calculated descriptivestatistics for days’ supply, quantity prescribed, and daily MME dose. The data for days’ supply,quantity prescribed, and daily MME dose were skewed, so we provided the median and interquartilerange along with the mean and standard deviation.
RESULTSIn our sample of people who were privately insured, the number of opioid prescriptions written bydentists per 1,000 dental visits was 50.37 (95% confidence interval [CI], 50.17 to 50.58) in 2010,and it increased to 58.70 (95% CI, 58.48 to 58.92) in 2015. The number of opioid prescriptionswritten by dentists per 1,000 dental patients also increased from 130.58 (95% CI, 130.04 to 131.12)in 2010 to 147.44 (95% CI, 146.88 to 148.00) in 2015. There was a sharp increase in the number ofopioid prescriptions per 1,000 dental patients for the group aged 11 through 18 years from 99.71 in2010 to 165.94 in 2015. Table 1 presents the results for the number of opioid prescriptions per 1,000dental patients according to age group.
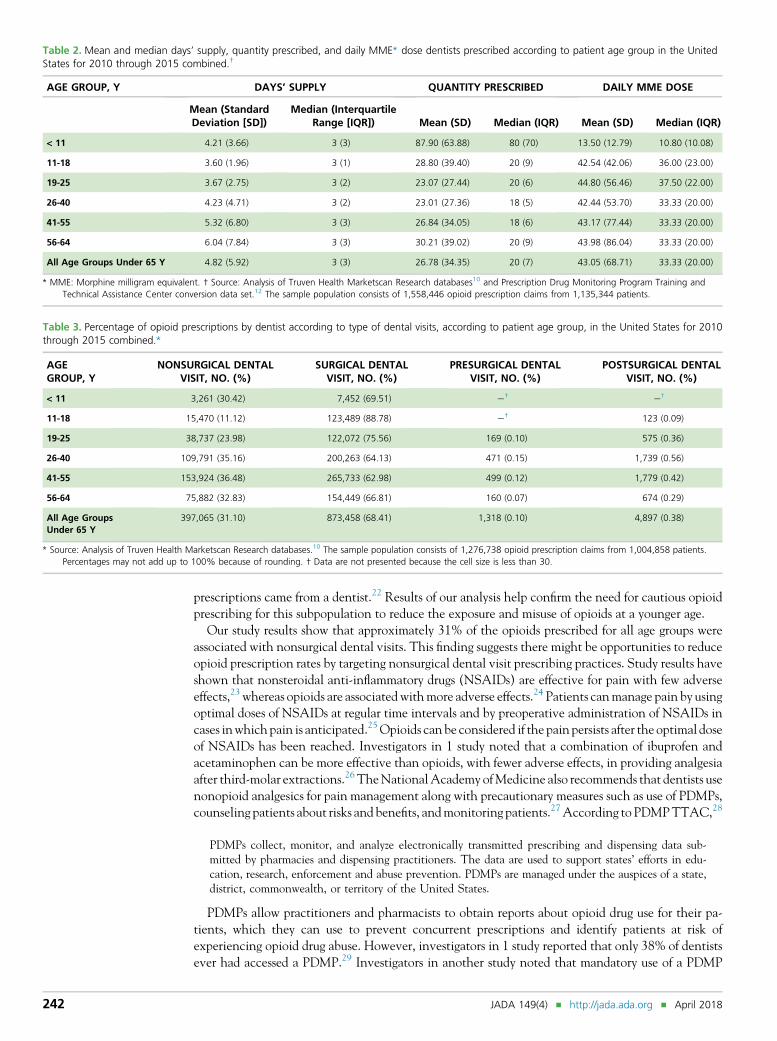
The median number of days’ supply of opioids dentists prescribed was 3 days for all age groups.The median quantity of opioids prescribed was highest (approximately 80) for the group youngerthan 11 years, but the median MME dose for patients younger than 11 years was only 10.80. Themedian quantity of opioids dentists prescribed was 20 for all age groups. The median daily MMEdose dentists prescribed was 33.33 for all age groups; however, the median daily MME doses forgroups aged 11 through 18 years and 19 through 25 years were 36.00 and 37.50, respectively.Table 2 summarizes the mean and median days’ supply, quantity of opioids, and daily MME dosethat dentists prescribed according to patient age group.
The 5 opioid drugs dentists most frequently prescribed were acetaminophen with hydrocodonebitartrate, acetaminophen with oxycodone hydrochloride, acetaminophen with codeine, hydro-codone bitartrate with ibuprofen, and tramadol hydrochloride. Acetaminophen with hydrocodone
Table 1. Number of opioid prescriptions written by dentist per 1,000 dental patients according to patient age group in the United States for 2010 through2015.*
AGEGROUP, Y
2010, NO.(95% CI†)
2011, NO.(95% CI)
2012, NO.(95% CI)
2013, NO.(95% CI)
2014, NO.(95% CI)
2015, NO.(95% CI)
< 11 23.78 (22.78 to24.78)
22.45 (21.49 to23.40)
22.42 (21.48 to23.35)
23.38 (22.34 to24.41)
24.72 (23.62 to25.82)
29.49 (28.09 to30.88)
11-18 99.71 (98.44 to100.97)
100.32 (99.08 to101.56)
99.69 (98.49 to100.89)
107.99 (106.66 to109.32)
124.91 (123.43 to126.40)
165.94 (163.98 to167.91)
19-25 214.18 (211.42 to216.94)
206.19 (203.87 to208.51)
182.88 (180.94 to184.83)
171.68 (169.79 to173.57)
171.79 (169.98 to173.60)
185.06 (183.05 to187.07)
26-40 153.31 (152.04 to154.58)
150.97 (149.78 to152.16)
145.90 (144.81 to146.99)
142.71 (141.59 to143.84)
150.44 (149.30 to151.58)
169.41 (168.06 to170.76)
41-55 131.99 (131.08 to132.91)
131.79 (130.91 to132.66)
126.38 (125.58 to127.18)
125.47 (124.65 to126.29)
127.38 (126.56 to128.20)
140.20 (139.26 to141.13)
56-64 127.24 (125.98 to128.49)
119.25 (118.14 to120.36)
115.73 (114.73 to116.72)
115.74 (114.74 to116.75)
116.13 (115.16 to117.10)
132.84 (131.75 to133.94)
All AgeGroups Under 65 Y
130.58 (130.04 to131.12)
129.70 (129.19 to130.20)
125.28 (124.82 to125.74)
125.04 (124.56 to125.52)
129.81 (129.33 to130.29)
147.44 (146.88 to148.00)
* Source: Analysis of Truven Health Marketscan Research databases.10 The sample population consists of 1,558,446 opioid prescription claims from 1,135,344 patients.† CI: Confidence interval.
bitartrate accounted for 70.21% of all opioid drugs dentists prescribed in 2010. This amountdecreased to 69.16% in 2014 and further to 63.36% in 2015. Acetaminophen with oxycodonehydrochloride accounted for 10.90% of all opioid drugs dentists prescribed in 2010 and increased to11.62% in 2015. Acetaminophen with codeine accounted for 10.56% of all opioid drugs dentistsprescribed in 2010 and increased to 14.28% in 2015. Hydrocodone bitartrate with ibuprofenaccounted for 3.09% of all opioid drugs dentists prescribed in 2010 and decreased to 1.89% in 2015.Tramadol hydrochloride accounted for 1.78% of all opioid prescriptions written by dentists in 2010and increased to 4.60% in 2015 (eTable 3, available online at the end of this article).
For all age groups, most dental visits at which dentists prescribed opioids were surgical dentalvisits (68.41%). The groups aged 11 through 18 years and 19 through 25 years had lower per-centages of opioid prescriptions for nonsurgical dental visits than did the other age groups. Table 3summarizes the percentages of opioid prescriptions according to age group and according to dentalvisit type (that is, surgical, presurgical, postsurgical, and nonsurgical dental visits).
For all age groups, the median days’ supply dentists prescribed was 3 days for all 4 types of dentalvisits. The median quantity of opioids dentists prescribed was 18 for nonsurgical visits, 20 forsurgical visits, 16 for presurgical visits, and 16 for postsurgical visits. The median daily MME dosedentists prescribed was 30.00 for nonsurgical visits, 33.33 for surgical dental visits, 37.50 for pre-surgical dental visits, and 33.33 for postsurgical dental visits.
After exclusion of diagnostic and preventive categories of procedures, restorative procedures consti-tuted 55.57% of all procedures performed during a nonsurgical dental visit at which dentists prescribedopioids, and oral and maxillofacial surgery accounted for 59.11% of all procedures performed during asurgical dental visit at which dentists prescribed opioids. Table 4 summarizes the breakdown of dentalprocedures performed during nonsurgical and surgical dental visits at which dentists prescribed opioids.
DISCUSSIONThe results of this study show that for people who were privately insured in the United States from2010 through 2015, the rate of opioid prescriptions per 1,000 dental patients has increased, especiallyfor the group aged 11 through 18 years. This age group also received a higher median daily MME dosecompared to the median daily MME dose for all age groups, and approximately 89% of the opioidsprescribed for this age group were associated with a surgical dental visit. Denisco and colleagues21
estimated that 3.5 million people with an average age of 20 years may have been exposed to opi-oids through dentistry. Volkow and colleagues5 reported that in 2009 dentists were the main pre-scribers of opioids for adolescents and young adults aged 10 through 19 years and prescribed 31% of allthe opioid prescriptions for this age group. In a study of high school seniors, 36.9% of nonmedical usersof prescription opioids used the drugs from their own previous prescriptions, and 27% of these
JADA 149(4) n http://jada.ada.org n April 2018 241
Table 2. Mean and median days’ supply, quantity prescribed, and daily MME* dose dentists prescribed according to patient age group in the UnitedStates for 2010 through 2015 combined.†
AGE GROUP, Y DAYS’ SUPPLY QUANTITY PRESCRIBED DAILY MME DOSE
Mean (StandardDeviation [SD])
Median (InterquartileRange [IQR]) Mean (SD) Median (IQR) Mean (SD) Median (IQR)
All Age Groups Under 65 Y 4.82 (5.92) 3 (3) 26.78 (34.35) 20 (7) 43.05 (68.71) 33.33 (20.00)
* MME: Morphine milligram equivalent. † Source: Analysis of Truven Health Marketscan Research databases10 and Prescription Drug Monitoring Program Training andTechnical Assistance Center conversion data set.12 The sample population consists of 1,558,446 opioid prescription claims from 1,135,344 patients.
Table 3. Percentage of opioid prescriptions by dentist according to type of dental visits, according to patient age group, in the United States for 2010through 2015 combined.*
* Source: Analysis of Truven Health Marketscan Research databases.10 The sample population consists of 1,276,738 opioid prescription claims from 1,004,858 patients.Percentages may not add up to 100% because of rounding. † Data are not presented because the cell size is less than 30.
242
prescriptions came from a dentist.22 Results of our analysis help confirm the need for cautious opioidprescribing for this subpopulation to reduce the exposure and misuse of opioids at a younger age.
Our study results show that approximately 31% of the opioids prescribed for all age groups wereassociated with nonsurgical dental visits. This finding suggests there might be opportunities to reduceopioid prescription rates by targeting nonsurgical dental visit prescribing practices. Study results haveshown that nonsteroidal anti-inflammatory drugs (NSAIDs) are effective for pain with few adverseeffects,23 whereas opioids are associated withmore adverse effects.24 Patients canmanage pain by usingoptimal doses of NSAIDs at regular time intervals and by preoperative administration of NSAIDs incases inwhich pain is anticipated.25Opioids can be considered if the pain persists after the optimal doseof NSAIDs has been reached. Investigators in 1 study noted that a combination of ibuprofen andacetaminophen can be more effective than opioids, with fewer adverse effects, in providing analgesiaafter third-molar extractions.26 TheNationalAcademy ofMedicine also recommends that dentists usenonopioid analgesics for pain management along with precautionary measures such as use of PDMPs,counseling patients about risks and benefits, andmonitoring patients.27According to PDMPTTAC,28
PDMPs collect, monitor, and analyze electronically transmitted prescribing and dispensing data sub-mitted by pharmacies and dispensing practitioners. The data are used to support states’ efforts in edu-cation, research, enforcement and abuse prevention. PDMPs are managed under the auspices of a state,district, commonwealth, or territory of the United States.
PDMPs allow practitioners and pharmacists to obtain reports about opioid drug use for their pa-tients, which they can use to prevent concurrent prescriptions and identify patients at risk ofexperiencing opioid drug abuse. However, investigators in 1 study reported that only 38% of dentistsever had accessed a PDMP.29 Investigators in another study noted that mandatory use of a PDMP
Table 4. Breakdown of dental procedures performed during dental visits at which dentists prescribed opioids in theUnited States for 2010 through 2015 combined.*
PROCEDURE CATEGORY NO. (%)
Nonsurgical Dental Visit
Restorative 118,471 (55.57)
Adjunctive general 43,554 (20.43)
Periodontics 24,091 (11.30)
Endodontics 13,529 (6.35)
Prosthodontics fixed 7,588 (3.56)
Prosthodontics removable 3,292 (1.54)
Implants 1,590 (0.75)
Orthodontics 1,024 (0.48)
Maxillofacial prosthetics 43 (0.02)
Oral and maxillofacial surgery 0 (0.00)
Total 213,182 (100.00)
Surgical Dental Visit
Oral and maxillofacial surgery 1,459,256 (59.11)
Adjunctive general 493,959 (20.01)
Endodontics 169,415 (6.86)
Restorative 158,794 (6.43)
Periodontics 98,695 (4.00)
Implants 49,045 (1.99)
Prosthodontics removable 21,493 (0.87)
Prosthodontics fixed 16,891 (0.68)
Orthodontics 595 (0.02)
Maxillofacial prosthetics 444 (0.02)
Total 2,468,587 (99.99)†
* Source: Analysis of Truven Health Marketscan Research databases.10 We excluded diagnostic and preventive procedures from thisanalysis. The sample population consists of 1,276,738 opioid prescription claims from 1,004,858 patients. † The percentages inthis column are rounded and, hence, add up to 99.99%.
caused a 78% decrease in the quantity of opioids prescribed and an increase in the use of nonopioidanalgesics.30 Increased use of PDMPs among dentists and other health care providers can helpidentify patients at risk of experiencing opioid misuse or abuse, prevent concurrent prescriptions, anddiscourage drug shoppers.
In our sample, the use of hydrocodone decreased from 2014 through 2015, and the use of otherdrugs such as codeine and tramadol increased during the same time frame, which could be a possibleeffect of the reclassification of drugs. In October 2014, the US Drug Enforcement Administrationreclassified hydrocodone as a schedule II drug from a schedule III drug.31 Oxycodone is a schedule IIdrug, codeine is a schedule III drug, and tramadol is a schedule IV drug.32 Schedule II drugs require awritten prescription, whereas schedule III and IV drugs can be telephoned in to pharmacies. Becauseschedule II drugs are controlled more strongly and schedule III and IV drugs are easier and moreconvenient to prescribe, it is possible that the reclassification of hydrocodone helped reducehydrocodone prescriptions while increasing the number of codeine and tramadol prescriptions;however, our study results do not establish causality. Nonetheless, hydrocodone still accounted foralmost 63% of all opioid prescriptions written by dentists in 2015.
LimitationsThere are several limitations to this study. This study is based on claims data for people who areprivately insured. Hence, we cannot generalize the results of this study to the entire US population.However, given that the opioid addiction epidemic affects all income groups,20 our sample may not
JADA 149(4) n http://jada.ada.org n April 2018 243
exhibit selection bias. The analysis is based on a large convenience sample of people who areprivately insured but may not necessarily be nationally representative.
To obtain a prescriber source, we restricted our opioid claims data set to initial prescription fillsonly and did not account for refills. Usually, prescriptions from dentists are short term, designed tolast a maximum of 5 days. Although it is possible that patients obtained refills, our data set does notaccount for those opioid claims. Therefore, our analyses could lead to underestimation of the rate ofopioid use among dental patients.
In our study, we assumed that if a dentist prescribed an opioid, the level of pain was high enoughto warrant filling that prescription within 3 days. It is possible that patients filled their prescriptionslater than our assumption of 3 days and that we excluded these patients from our analyses. Becausewe did not have a definite prescriber source and had to rely on visit date and prescription fill date,our assumption best identified the prescriber while excluding other potential overlaps and refills. Weacknowledge this as a limitation of our study.
CONCLUSIONSWithin a large population of people who were privately insured in the United States, the number ofopioid prescriptions per 1,000 dental patients increased from 2010 to 2015, especially for the groupaged 11 through 18 years. The number of days’ supply prescribed was the same for all age groups.The quantity of opioids prescribed was 20. The groups aged 11 through 18 years and 19 through 25years received higher daily MME doses than did the other age groups. Most opioids prescribed wereassociated with surgical dental visits. Although dentistry is accounting for less of the total volume ofopioid prescriptions in the United States, results of our analysis suggest important areas of focus forfurther managing opioid prescribing among dentists. n
SUPPLEMENTAL DATASupplemental data related to this article can be found at: https://doi.org/10.1016/j.adaj.2018.01.005.
Dr. Gupta is a health services researcher, Health Policy Institute, AmericanDental Association, 211 E. Chicago Ave. Chicago, IL 60611, [email protected]. Address correspondence to Dr. Gupta.Dr. Vujicic is the chief economist and the vice president, Health Policy
Institute, American Dental Association, Chicago, IL.Mr. Blatz is a research analyst, Health Policy Institute, American Dental
Association, Chicago, IL.
Disclosure. None of the authors reported any disclosures.
The authors thank Dr. Paul Moore, DMD, PhD, MPH, from University ofPittsburgh School of Dental Medicine for his feedback on opioid
prescriptions in dentistry and review of this manuscript. The authors alsothank Dr. Robert Amato, DMD, from Tufts University School of DentalMedicine, Dr. Gunnar Hasselgren, DDS, PhD, from Columbia UniversityCollege of Dental Medicine, and Dr. Joseph Heidelman, DDS, and Dr.Kenneth J. Spolnik, DDS, MSD, from Indiana University School of Dentistryfor their feedback on Current Dental Terminology codes and opioid pre-scriptions written by dentists. The authors also thank Ms. Brittany Harrison,MA, from the American Dental Association Health Policy Institute for hereditorial assistance.
1. US Department of Health and Human Services. Theopioid epidemic in the U.S. Available at: https://www.hhs.gov/sites/default/files/2017-opioids-infographic.pdf. AccessedJanuary 22, 2018.2. Guy GP Jr, Zhang K, Bohm MK, et al. Vital signs:
changes in opioid prescribing in the United States, 2006-2015.MMWRMorbMortalWklyRep. 2017;66(26):697-704.3. Florence CS, Zhou C, Luo F, Xu L. The economic
burden of prescription opioid overdose, abuse, anddependence in the United States, 2013. Med Care. 2016;54(10):901-906.4. Rigoni GC. Drug utilization for immediate and
modified release opioids in the U.S. Available at: www.fda.gov/ohrms/dockets/ac/03/slides/3978S1_05_Rigoni.ppt.Accessed December 20, 2017.5. VolkowND,McLellan TA, Cotto JH, KarithanomM,
Weiss SRB. Characteristics of opioid prescriptions in 2009.JAMA. 2011;305(13):1299-1301.6. Levy B, Paulozzi L, Mack KA, Jones CM. Trends in
opioid analgesic-prescribing rates by specialty, US, 2007-2012. Am J Prev Med. 2015;49(3):409-413.7. McCauley JL, Hyer JM, Ramakrishnan VR, et al.
Dental opioid prescribing and multiple prescriptions
among dental patients: administrative data from the SouthCarolina prescription drug monitoring program. JADA.2016;147(7):537-544.8. WrightER,KooremanHE,GreeneMS,ChambersAR,
Banerjee A, Wilson J. The iatrogenic epidemic of prescrip-tion drug abuse: county-level determinants of opioidavailability and abuse. Drug Alcohol Depend. 2014;138:209-215.9. Maughan BC, Hersh EV, Shofer FS, et al. Unused
opioid analgesics and drug disposal following outpatientdental surgery: a randomized controlled trial. Drug AlcoholDepend. 2016;168:328-334.10. Truven Health Analytics. Data for healthcareresearch. Available at: https://truvenhealth.com/Portals/0/assets/ACRS_11223_0912_MarketScanResearch_SS_Web.pdf. Accessed December 20, 2017.11. Hansen L, Chang S. Health Research Data for the RealWorld: The Marketscan Databases. Ann Arbor, MI: TruvenHealth Analytics; 2011.12. Prescription Drug Monitoring Program Training andTechnical Assistance Center. Technical assistance guideno. 01-13: calculating daily morphine milligram equiva-lents. Available at: http://www.pdmpassist.org/pdf/BJA_
JAD
performance_measure_aid_MME_conversion.pdf. AccessedDecember 20, 2017.13. National Center for Injury Prevention and Control.CDC compilation of benzodiazepines, muscle relaxants,stimulants, zolpidem,andopioid analgesicswithoralmorphinemilligram equivalent conversion factors, 2016 version.Available at: http://www.pdmpassist.org/pdf/Conversion%20Reference%20Table.xlsx. Accessed December 20, 2017.14. Centers for Medicare & Medicaid Services. Opioidmorphine equivalent conversion factors. Available at:https://www.cms.gov/Medicare/Prescription-Drug-Coverage/PrescriptionDrugCovContra/Downloads/Opioid-Morphine-EQ-Conversion-Factors-March-2015.pdf. Accessed December20, 2017.15. American Dental Association. Current Dental Termi-nology 2009-2010.Chicago, IL:AmericanDentalAssociation;2008.16. American Dental Association. Current Dental Termi-nology 2011-2012. Chicago, IL: American Dental Associa-tion; 2010.17. American Dental Association. Current Dental Termi-nology 2013. Chicago, IL: American Dental Association;2012.
18. American Dental Association. Current Dental Ter-minology 2014. Chicago, IL: American Dental Association;2013.19. American Dental Association. Current Dental Ter-minology 2015. Chicago, IL: American Dental Association,2014.20. Jones CM, Paulozzi LJ, Mack KA. Sources of pre-scription opioid pain relievers by frequency of past-yearnonmedical use, United States, 2008-2011. JAMA InternMed. 2014;174(5):802-803.21. Denisco RC, Kenna GA, O’Neil MG, et al. Pre-vention of prescription opioid abuse: the role of thedentist. JADA. 2011;142(7):800-810.22. McCabe SE, West BT, Boyd CJ. Leftover prescrip-tion opioids and nonmedical use among high school se-niors: a multi-cohort national study. J Adolesc Health.2013;52(4):480-485.23. Moore RA, Wiffen PJ, Derry S, Maguire T, Roy YM,Tyrrell L. Non-prescription (OTC) oral analgesics foracute pain: an overview of Cochrane reviews. CochraneDatabase Syst Rev. 2015;11:CD010794.
JADA 149(4) n http://jada.ada.org n April 2018
24. Moore RA, Derry S, Aldington D,Wiffen PJ. Adverseevents associated with single-dose oral analgesics for acutepostoperative pain in adults: an overview of Cochrane re-views. Cochrane Database Syst Rev. 2015;10:CD011407.25. Becker DE, Phero JC. Drug therapy in dental prac-tice: nonopioid and opioid analgesics. Anesth Prog. 2005;52(4):140-149.26. Moore PA, Hersh EV. Combining ibuprofen andacetaminophen for acute pain management after third-molar extractions: translating clinical research to dentalpractice. JADA. 2013;144(8):898-908.27. National Academy of Medicine. First, do no harm:marshaling clinician leadership to counter the opioidepidemic. Available at: https://nam.edu/wp-content/uploads/2017/09/First-Do-No-Harm-Marshaling-Clinician-Leadership-to-Counter-the-Opioid-Epidemic.pdf.Accessed December 20, 2017.28. Prescription Drug Monitoring Program Training andTechnical Assistance Center. Prescription drug moni-toring frequently asked questions (FAQ). Available at:http://www.pdmpassist.org/content/prescription-drug-
monitoring-frequently-asked-questions-faq. AccessedDecember 20, 2017.29. McCauley JL, Leite RS, Melvin CL, Fillingim RB,Brady KT. Dental opioid prescribing practices and riskmitigation strategy implementation: identification of po-tential targets for provider-level intervention. Subst Abus.2016;37(1):9-14.30. Rasubala L, Pernapati L, Velasquez X, Burk J,Ren YF. Impact of a mandatory prescription drug moni-toring program on prescription of opioid analgesics bydentists. PLoS One. 2015;10(8):e0135957.31. US Drug Enforcement Administration, DiversionControl Division. Final rule: rescheduling of hydrocodonecombination products from Schedule III to Schedule II.Available at: https://www.deadiversion.usdoj.gov/fed_regs/rules/2014/fr0822.htm. Accessed December 20, 2017.32. US Drug Enforcement Administration. Drug sched-ules. Available at: https://www.dea.gov/druginfo/ds.shtml.Accessed December 20, 2017.33. American Dental Association. Current Dental Terminol-ogy 2018. Chicago, IL: American Dental Association; 2018.
eTable 2. Current Dental Terminology codes (CDT) considered as surgical procedures.*
CDT CODE DESCRIPTION
D3220 Therapeutic pulpotomy (excluding final restoration) - removal of pulp coronal to the dentinocemental junction andapplication of medicament
D3221 Pulpal debridement, primary and permanent teeth
D3222 Partial pulpotomy for apexogenesis - permanent tooth with incomplete root development
D3230 Pulpal therapy (resorbable filling) e anterior, primary tooth (excluding final restoration)
D3240 Pulpal therapy (resorbable filling) e posterior, primary tooth (excluding final restoration)
D3310 Endodontic therapy, anterior tooth (excluding final restoration)
D3320 Endodontic therapy, bicuspid tooth (excluding final restoration)
D3330 Endodontic therapy, molar (excluding final restoration)
D3410 Apicoectomy - anterior
D3421 Apicoectomy - premolar (first root)
D3425 Apicoectomy - molar (first root)
D3426 Apicoectomy (each additional root)
D3427 Periradicular surgery without apicoectomy
D3428 Bone graft in conjunction with periradicular surgery e per tooth, single site
* Source: The American Dental Association Current Dental Terminology (CDT) code book,15-19 and expert opinion from researchersat academic institutions. The description of the CDT codes is based on the American Dental Association Current DentalTerminology (CDT) code book 2018.33
eTable 1. List of opioid drugs and their morphine milligram equivalent conversion factor.
OPIOID DRUG*MORPHINE MILLIGRAM EQUIVALENT
CONVERSION FACTOR
Buprenorphine† 30.00
Butorphanol 7.00
Codeine 0.15
Dihydrocodeine 0.25
Fentanyl† 0.13
Hydrocodone 1.00
Hydromorphone 4.00
Levomethadyl 8.00
Levorphanol 11.00
Meperidine 0.10
Methadone 3.00
Morphine 1.00
Nalbuphine 1.00
Opium 1.00
Oxycodone 1.50
Oxymorphone 3.00
Pentazocine 0.37
Tapentadol 0.40
Tramadol 0.10
* Strength in milligrams unless noted otherwise. Sources: National Center for Injury Prevention and Control13 and Centers forMedicare & Medicaid Services.14 † The conversion factor in the table for buprenorphine and fentanyl is for tablet form. Theconversion factor for buprenorphine transdermal patch (micrograms per hour) is 12.6 and buprenorphine film (micrograms) is0.03. The conversion factor for fentanyl film or oral spray (micrograms) is 0.18, for fentanyl nasal spray (micrograms) is 0.16,and for fentanyl transdermal patch (micrograms per hour) is 7.2.
245.e1 JADA 149(4) n http://jada.ada.org n April 2018
D3910 Surgical procedure for isolation of tooth with rubber dam
D3920 Hemisection (including any root removal), not including root canal therapy
D4210 Gingivectomy or gingivoplasty - four or more contiguous teeth or tooth bounded spaces per quadrant
D4211 Gingivectomy or gingivoplasty - one to three contiguous teeth or tooth bounded spaces per quadrant
D4212 Gingivectomy or gingivoplasty to allow access for restorative procedure, per tooth
D4230 Anatomical crown exposure - four or more contiguous teeth or bounded tooth spaces per quadrant
D4231 Anatomical crown exposure - one to three teeth or bounded tooth spaces per quadrant
D4240 Gingival flap procedure, including root planing - four or more contiguous teeth or tooth bounded spaces perquadrant
D4241 Gingival flap procedure, including root planing - one to three contiguous teeth or tooth bounded spaces per quadrant
D4245 Apically positioned flap
D4249 Clinical crown lengthening e hard tissue
D4260 Osseous surgery (including elevation of a full thickness flap and closure) e four or more contiguous teeth or toothbounded spaces per quadrant
D4261 Osseous surgery (including elevation of a full thickness flap and closure) e one to three contiguous teeth or toothbounded spaces per quadrant
D4263 Bone replacement graft e retained natural tooth e first site in quadrant
D4264 Bone replacement graft e retained natural tooth e each additional site in quadrant
D4265 Biologic materials to aid in soft and osseous tissue regeneration
D4266 Guided tissue regeneration - resorbable barrier, per site
D4267 Guided tissue regeneration - nonresorbable barrier, per site (includes membrane removal)
D4268 Surgical revision procedure, per tooth
D4270 Pedicle soft tissue graft procedure
D4271 Free soft tissue graft procedure (including donor site surgery)
D4273 Autogenous connective tissue graft procedure (including donor and recipient surgical sites) first tooth, implant, oredentulous tooth position in graft
D4274 Mesial/distal wedge procedure, single tooth (when not performed in conjunction with surgical procedures in the sameanatomical area)
D4275 Non-autogenous connective tissue graft (including recipient site and donor material) first tooth, implant, oredentulous tooth position in graft
D4276 Combined connective tissue and double pedicle graft, per tooth
D4277 Free soft tissue graft procedure (including recipient and donor surgical sites) first tooth, implant or edentulous toothposition in graft
D4278 Free soft tissue graft procedure (including recipient and donor surgical sites) each additional contiguous tooth,implant or edentulous tooth position in same graft site
D6010 Surgical placement of implant body: endosteal implant
D6011 Second stage implant surgery
D6012 Surgical placement of interim implant body for transitional prosthesis: endosteal implant
D6013 Surgical placement of mini implant
D6040 Surgical placement: eposteal implant
(continued)
JADA 149(4) n http://jada.ada.org n April 2018 245.e2
D6101 Debridement of a peri-implant defect or defects surrounding a single implant, and surface cleaning of the exposedimplant surfaces, including flap entry and closure
D6102 Debridement and osseous contouring of a peri-implant defect or defects surrounding a single implant and includessurface cleaning of the exposed implant surfaces, including flap entry and closure
D6103 Bone graft for repair of peri-implant defect e does not include flap entry and closure
D6104 Bone graft at time of implant placement
D7111 Extraction, coronal remnants e primary tooth