35
OPMA 5364 Project Management Part 6 Project Control
| Date post: | 23-Dec-2015 |
| Category: |
Documents |
| Upload: | erin-griffith |
| View: | 235 times |
| Download: | 0 times |

OPMA 5364Project Management
Part 6
Project Control

Part 6 - Project Control 2
Topic Outline: Project Control
• Project control steps• Measuring and monitoring system• Resource allocation and resource conflicts• Project accelerating/crashing• Resource loading and leveling• Project control exercise• Project tracking tools• Earned value analysis• Microsoft Project example• Scope creep and change control system

Part 6 - Project Control 3
Project Control
• Project control taking corrective actions to keep the project on target toward meeting its performance goals (time, cost, deliverables)
• The project manager has final responsibility for project control
• There are many ways to exert control; the PM must decide which is most appropriate– Resource allocations, funding decisions,
personnel assignments, change in priorities
Part 6 - Project Control 4
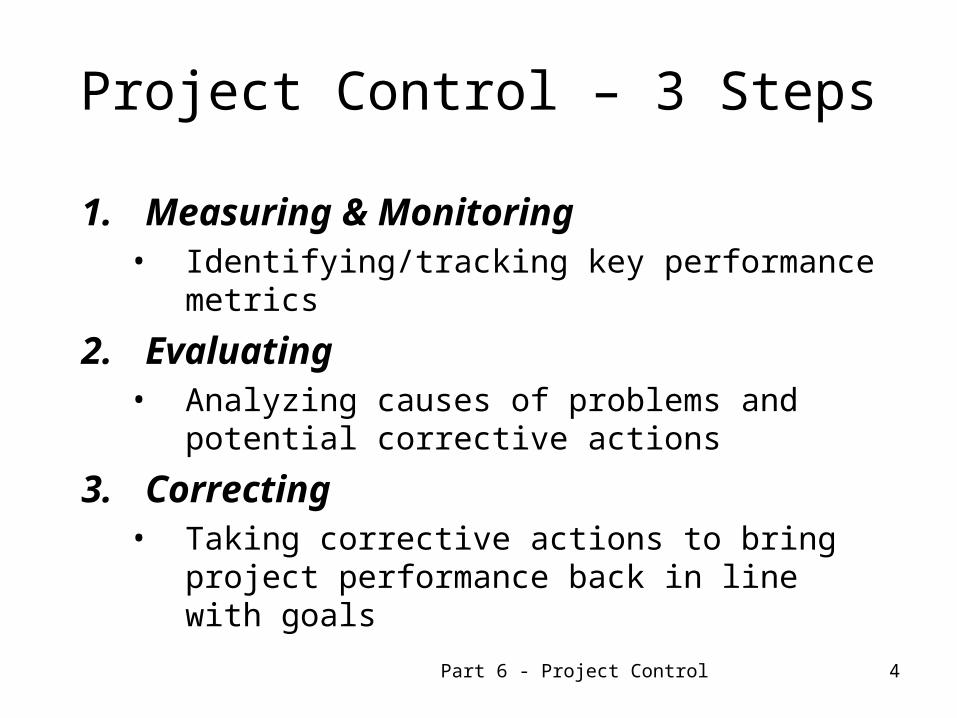
Project Control – 3 Steps
1. Measuring & Monitoring• Identifying/tracking key performance metrics
2. Evaluating• Analyzing causes of problems and potential
corrective actions
3. Correcting• Taking corrective actions to bring project
performance back in line with goals

Part 6 - Project Control 5
Measuring & Monitoring System
Many issues must be decided for a good measuring and monitoring system
• What should be measured and monitored?• How should it be measured?• Who should monitor it?• How should it be monitored?• When should it be monitored?• Where should info be stored?• Who should have access to info?
Part 6 - Project Control 6
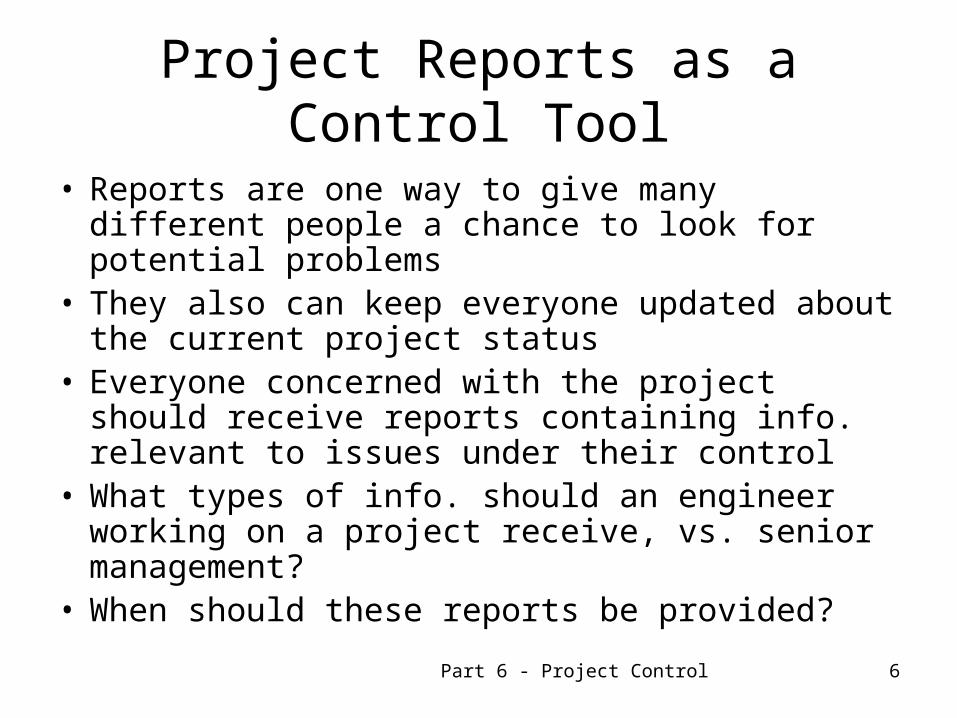
Project Reports as a Control Tool
• Reports are one way to give many different people a chance to look for potential problems
• They also can keep everyone updated about the current project status
• Everyone concerned with the project should receive reports containing info. relevant to issues under their control
• What types of info. should an engineer working on a project receive, vs. senior management?
• When should these reports be provided?
Part 6 - Project Control 7
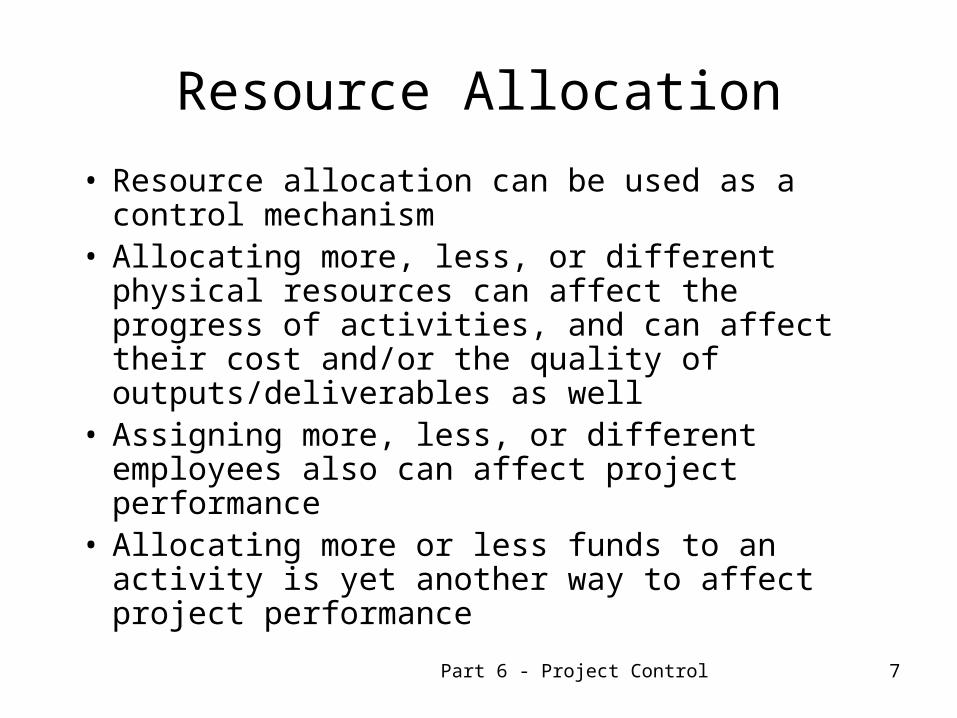
Resource Allocation
• Resource allocation can be used as a control mechanism
• Allocating more, less, or different physical resources can affect the progress of activities, and can affect their cost and/or the quality of outputs/deliverables as well
• Assigning more, less, or different employees also can affect project performance
• Allocating more or less funds to an activity is yet another way to affect project performance
Part 6 - Project Control 8
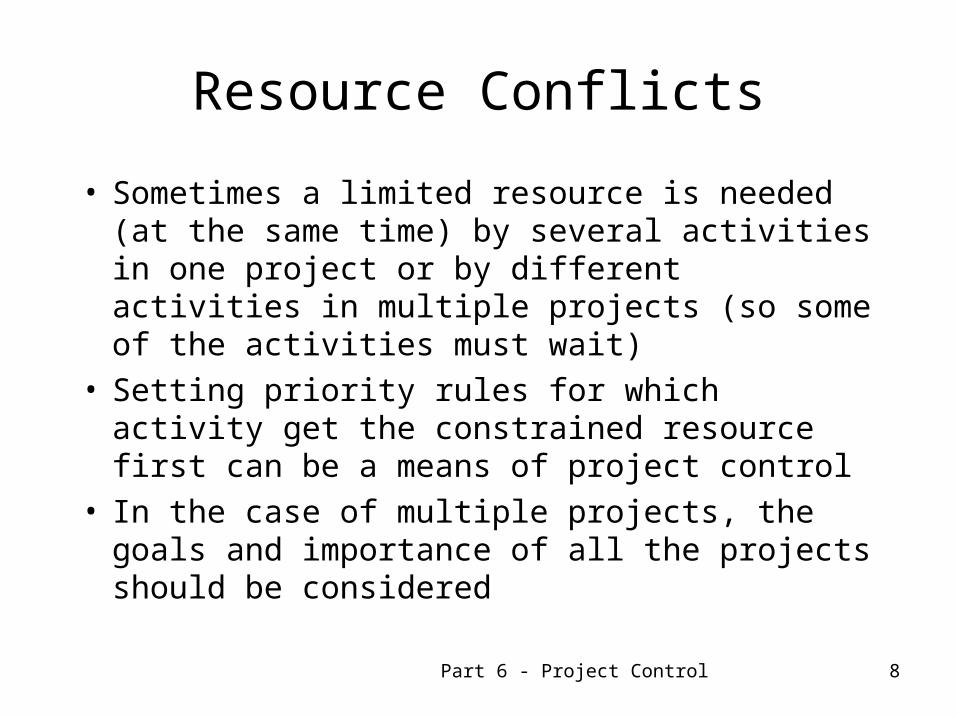
Resource Conflicts
• Sometimes a limited resource is needed (at the same time) by several activities in one project or by different activities in multiple projects (so some of the activities must wait)
• Setting priority rules for which activity get the constrained resource first can be a means of project control
• In the case of multiple projects, the goals and importance of all the projects should be considered
Part 6 - Project Control 9
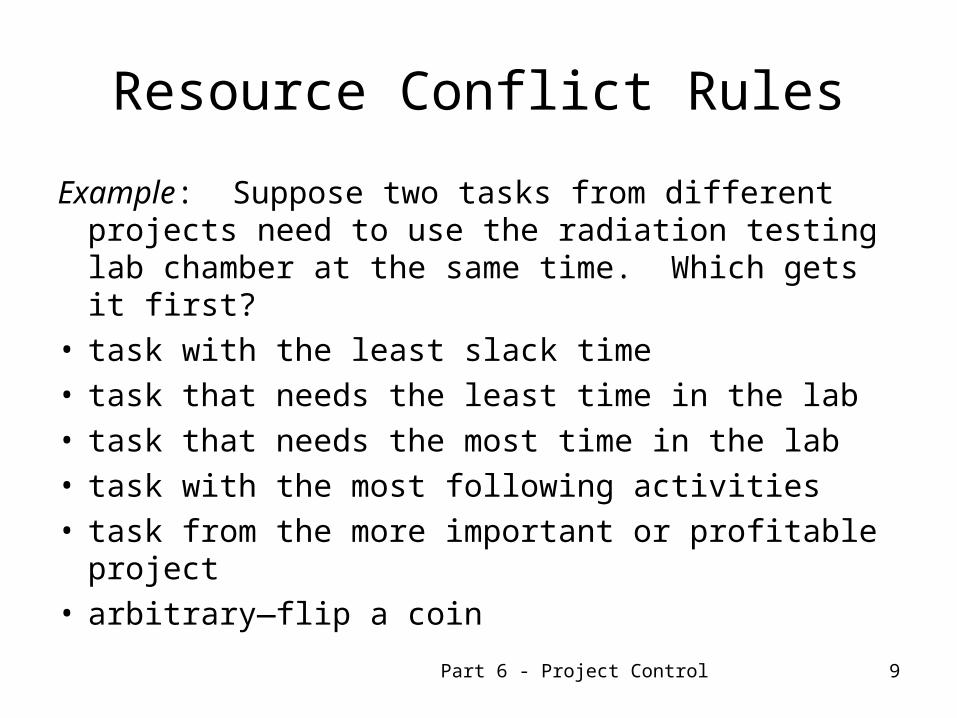
Resource Conflict Rules
Example: Suppose two tasks from different projects need to use the radiation testing lab chamber at the same time. Which gets it first?
• task with the least slack time• task that needs the least time in the lab• task that needs the most time in the lab• task with the most following activities• task from the more important or profitable project• arbitrary—flip a coin

Part 6 - Project Control 10
Project Accelerating/Crashing
• Project crashing (or accelerating a project) is another way to exert project control
• “Crashing” a project means shortening its duration, or speeding it up (doing it quicker)
• Unfortunately, this almost always costs more• Sometimes crashing is done because earlier
activities were delayed; other times it is done because the customer is willing to trade a higher cost for a shorter project time frame

Part 6 - Project Control 11
Project Crashing
Rules:• only crash critical activities• crash the cheapest critical activity first• assume each task can be crashed one day at a
time (simplifying assumption, but not necessary)• all critical paths must decrease by one day, in
order for the project duration to decrease by one day
Crashing example

Part 6 - Project Control 12
Resource Loading
• For each resource during each time period, determine the total amount of resource time required by all activities combined
• Compare this total time with the capacity of the resource during each time period
• Identify resources that are over-utilized (or overloaded) during any time period
• What should be done about it?
Part 6 - Project Control 13
Resource Leveling
• Re-scheduling some activities to eliminate resource overloading in certain time periods
• Try to delay activities that have extra slack time first—this will not delay the project
• If that doesn’t work, then activities must be delayed which will delay the project due date
• Popular project management software will identify resource overloading and will perform resource leveling automatically if requested
Part 6 - Project Control 14
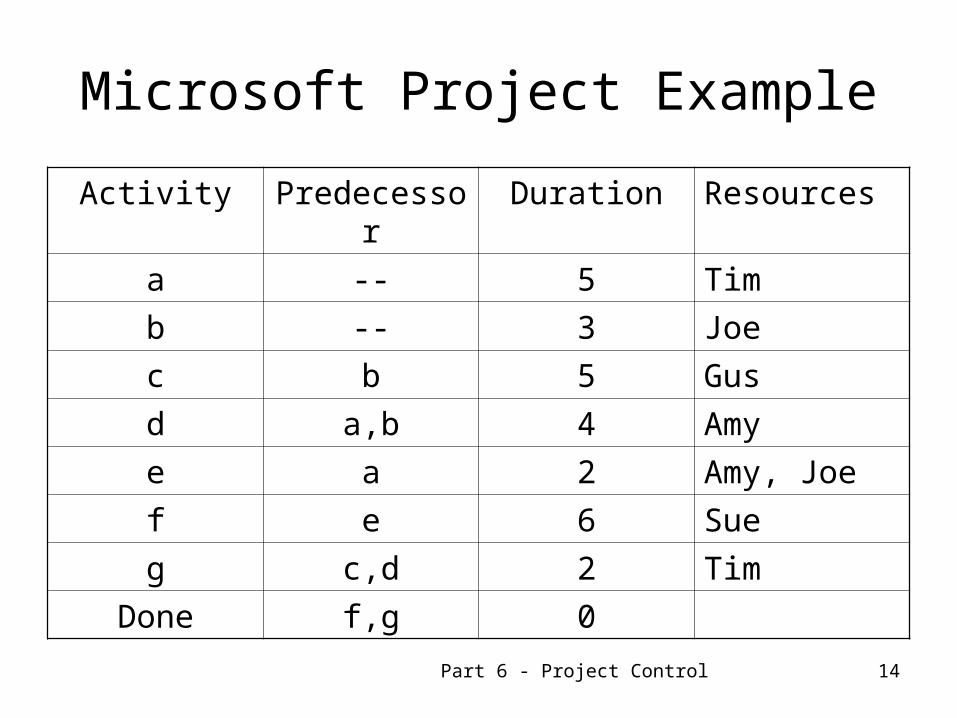
Microsoft Project Example
Activity Predecessor Duration Resources
a -- 5 Tim
b -- 3 Joe
c b 5 Gus
d a,b 4 Amy
e a 2 Amy, Joe
f e 6 Sue
g c,d 2 Tim
Done f,g 0

Part 6 - Project Control 15
Microsoft Project Example
a.) Enter all data
b.) Resource Loading: Look at Resource Sheet, Resource Usage, and Resource Graphs (Amy is the only overloaded resource)
c.) Perform resource leveling (Tools..Resource Leveling..Level Now)
What changed? Why?
d.) Suppose activity c needed Sue instead of Gus.
Do resource leveling again.
What changed? Why?

Part 6 - Project Control 16
Project Control Exercise
Envirosafe Project case (30 minutes)• Divide into small groups• Read case• Discuss why the project was late and over
budget; root causes• Recommend control procedures and other
changes that should prevent future problems

Part 6 - Project Control 17
Project Tracking Tools
• Popular project management software allows you to easily track cost and schedule performance as the project progresses
• This provides a useful tool for project control
• The current cost and schedule status must be entered routinely (daily or weekly)
• For each activity, you must estimate: actual cost so far, and percent complete
• Earned Value Analysis is a common tracking tool that provides performance metrics

Part 6 - Project Control 18
Earned Value Analysis
• Earned Value Analysis compares the current project status with the original (baseline) plan
• It computes several performance metrics for individual activities and for the entire project
• It focuses on cost and schedule performance• It’s a useful tool for project control• Popular project management software
computes these metrics
Part 6 - Project Control 19
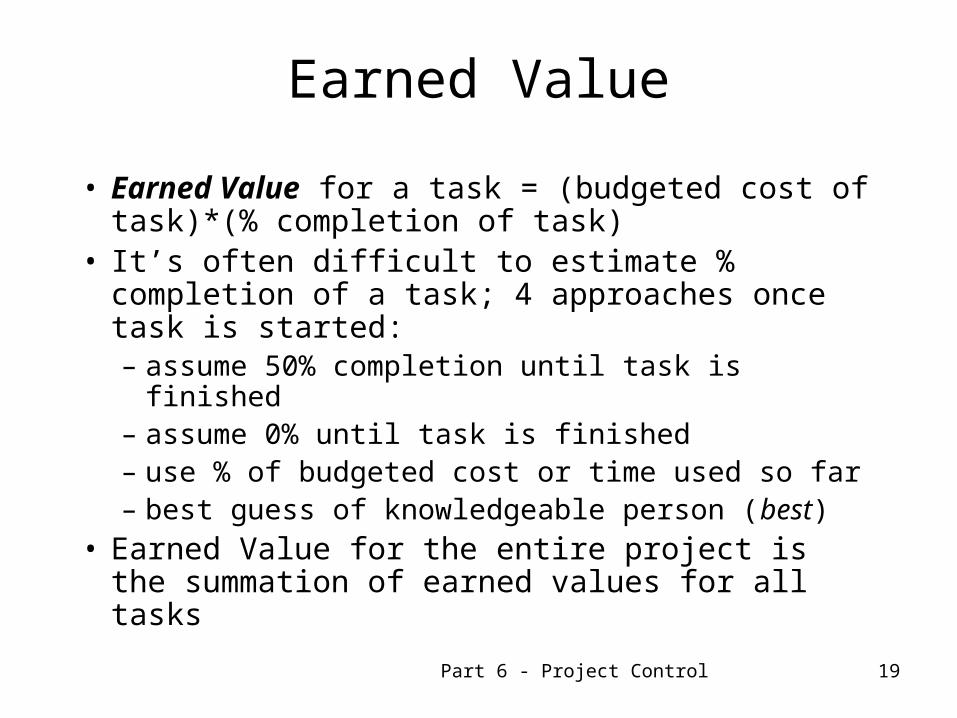
Earned Value
• Earned Value for a task = (budgeted cost of task)*(% completion of task)
• It’s often difficult to estimate % completion of a task; 4 approaches once task is started:– assume 50% completion until task is finished– assume 0% until task is finished– use % of budgeted cost or time used so far– best guess of knowledgeable person (best)
• Earned Value for the entire project is the summation of earned values for all tasks
Part 6 - Project Control 20
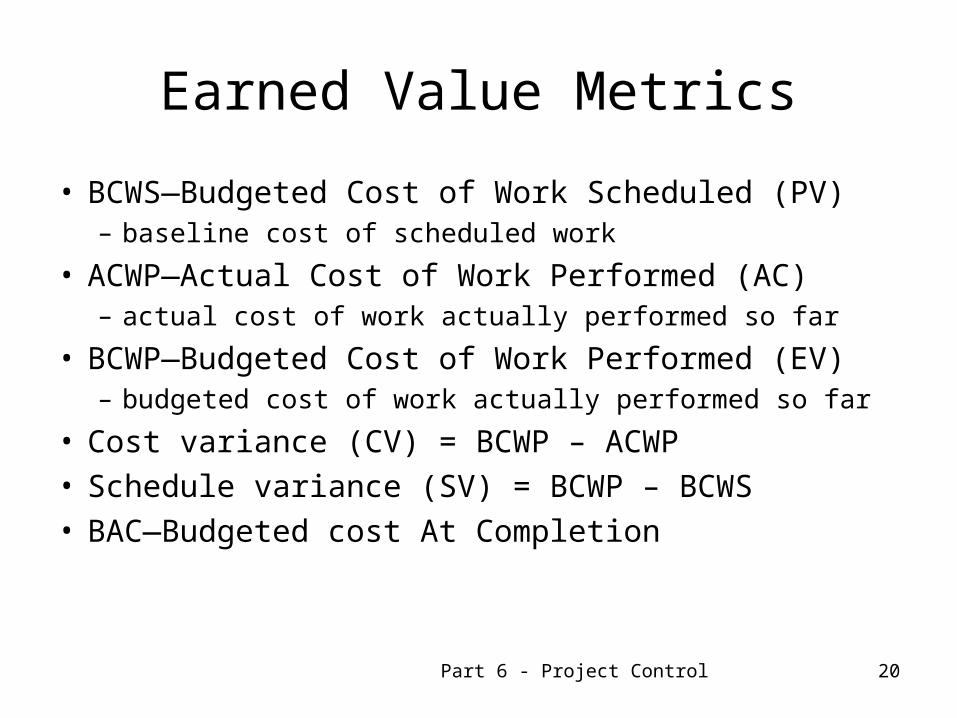
Earned Value Metrics
• BCWS—Budgeted Cost of Work Scheduled (PV)– baseline cost of scheduled work
• ACWP—Actual Cost of Work Performed (AC)– actual cost of work actually performed so far
• BCWP—Budgeted Cost of Work Performed (EV)– budgeted cost of work actually performed so far
• Cost variance (CV) = BCWP – ACWP• Schedule variance (SV) = BCWP – BCWS• BAC—Budgeted cost At Completion

Part 6 - Project Control 21
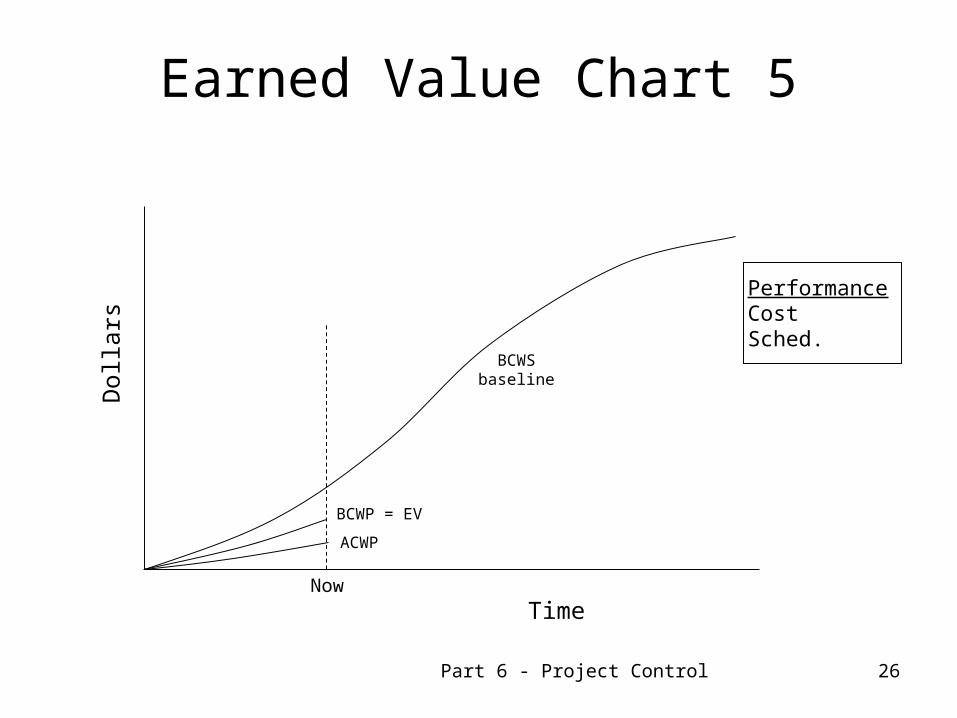
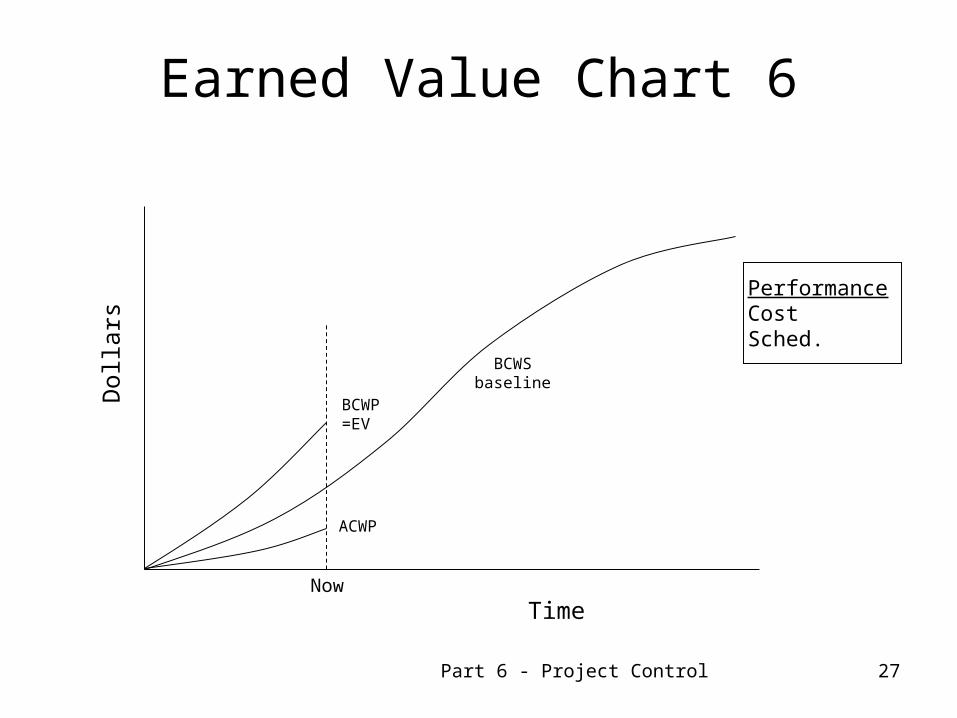
Earned Value Chart
• 3 lines on chart:– Baseline—planned cost over time (BCWS)– Actual Cost line (ACWP)– Earned Value line (BCWP)
• Schedule variance (negative is bad)• Cost variance (negative is bad)• Example chart on next slide
– describe project performance in this example

Part 6 - Project Control 22
Earned Value Chart 1
TimeNow
Dol
lars
Schedulevariance
Costvariance
Cost schedule plan(baseline)
ACWP
BCWP
BCWSActual cost
Value completed (Earned Value)
PerformanceCostSched.

Part 6 - Project Control 23
Earned Value Chart 2
TimeNow
Dol
lars
BCWSbaseline
ACWP
BCWP=EV
PerformanceCostSched.

Part 6 - Project Control 24
Earned Value Chart 3
TimeNow
Dol
lars
BCWSbaseline
ACWP
BCWP = EV
PerformanceCostSched.

Part 6 - Project Control 25
Earned Value Chart 4
TimeNow
Dol
lars
BCWSbaseline
ACWP
BCWP = EV
PerformanceCostSched.
Part 6 - Project Control 26
Earned Value Chart 5
TimeNow
Dol
lars
BCWSbaseline
ACWP
BCWP = EV
PerformanceCostSched.
Part 6 - Project Control 27
Earned Value Chart 6
TimeNow
Dol
lars
BCWSbaseline
ACWP
BCWP=EV
PerformanceCostSched.

Part 6 - Project Control 28
Earned Value Metrics
• BCWS—Budgeted Cost of Work Scheduled (PV)– baseline cost of scheduled work
• ACWP—Actual Cost of Work Performed (AC)– actual cost of work actually performed so far
• BCWP—Budgeted Cost of Work Performed (EV)– budgeted cost of work actually performed so far
• Cost variance (CV) = BCWP – ACWP• Schedule variance (SV) = BCWP – BCWS• BAC—Budgeted cost At Completion
Part 6 - Project Control 29
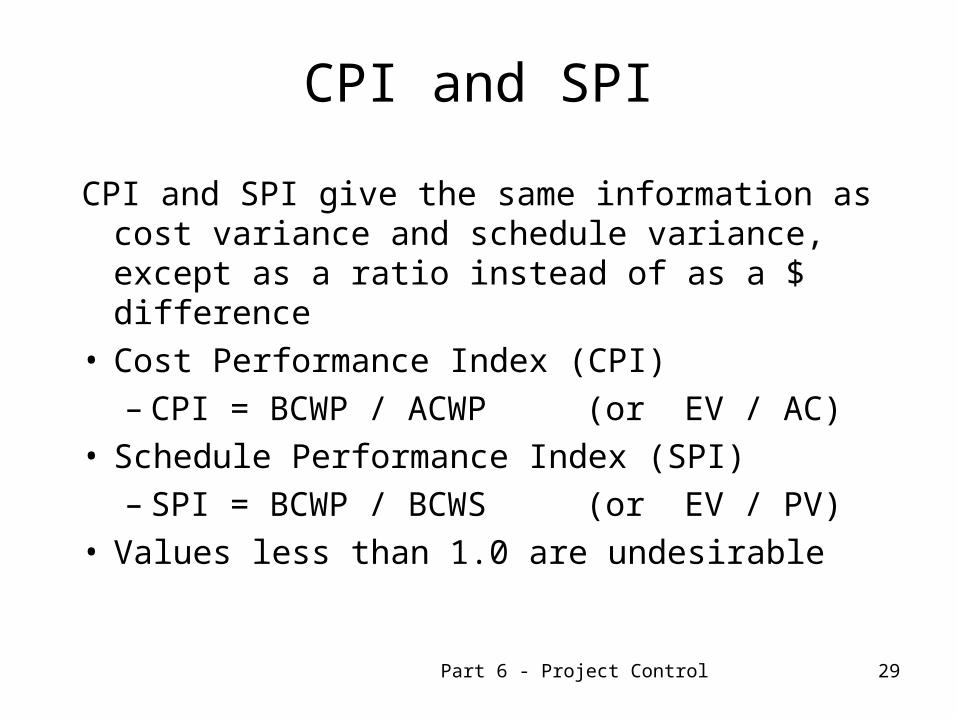
CPI and SPI
CPI and SPI give the same information as cost variance and schedule variance, except as a ratio instead of as a $ difference
• Cost Performance Index (CPI)– CPI = BCWP / ACWP (or EV / AC)
• Schedule Performance Index (SPI)– SPI = BCWP / BCWS (or EV / PV)
• Values less than 1.0 are undesirable

Part 6 - Project Control 30
Example
Example: Budgeted cost for finished task = $850;Actual cost to date = $550; Task is 70% complete,but was scheduled to be 80% complete by nowBCWS = 0.8*($850) = $680 PV
(baseline)BCWP = 0.7*($850) = $595 EVACWP = $550 ACCost variance = BCWP – ACWP = +$45 (good)Schedule variance = BCWP – BCWS = -$85 (bad)CPI = BCWP / ACWP = 1.082 (good)SPI = BCWP / BCWS = 0.875 (bad)

Part 6 - Project Control 31
ETC and EAC
Two more cost metrics are ETC and EAC• Estimated (remaining cost) To Completion
– ETC = (BAC – BCWP) / CPI• (note: Microsoft Project does not divide by CPI)
– BAC = budgeted cost at completion = $850– ETC = (850 – 595) / 1.082 = $235.67
• Estimated (total cost) At Completion– EAC = ETC + ACWP– EAC = 235.67 + 550 = $785.67

Part 6 - Project Control 32
Microsoft Project Example
ActivityPrede-cessors
Duration (weeks)
Budget ($)
Actual Cost ($)
% Complete
a -- 2 300 400 100
b -- 3 200 180 100
c a 2 250 300 100
d a 5 600 400 20
e b,c 4 400 200 20
It is currently the end of week 6, so activity d should be 80% complete and activity e should be 50% complete

Part 6 - Project Control 33
Microsoft Project Example
a.) Input activities, durations, and predecessors
b.) Set the project start date at 1/5/04 (Project..Project Information)
c.) Enter the budgeted cost of each activity as the Fixed Cost on the cost view of MS Project (View..Table: Cost)
d.) Save the baseline information (Tools..Tracking..Save Baseline)
e.) Update the project to show work completed through 2/15/04 (Tools..Tracking..Update Project)
f.) Update each task to show % completion (View..Table: Tracking)
g.) Enter the actual cost for each activity as of 2/15/04 in the Cost view of MS Project. To do this you will need to uncheck the option button that reads ‘Actual costs are always calculated by Microsoft Project’ (Tools..Options..Calculation)
i.) Print the Earned Value report (View..Reports..Costs..Earn.Val.)

Part 6 - Project Control 34
Scope Creep• PM must be cautious of scope creep. Why?• Most common cause is due to the client or project
team wanting to enhance the project’s deliverables• The later that changes are made, the more difficult
and costly they become• Scope creep is welcome if it lowers costs or
enhances the firm’s competitiveness• A change control system allows the PM to assess
the impacts and desirability of potential changes before deciding to implement them

Part 6 - Project Control 35
Change Control System
• Review suggested changes• Assess all impacts to project goals• Evaluate advantages and disadvantages• Consider alternative changes that are better• Allow responsible parties to make decision in
light of all information• Communicate changes to everyone involved• Implement changes• Summarize all changes and impacts in report


