Copyright 2014 by the Center for Collaborative Education and the Annenberg Institute for School Reform at Brown University. All rights reserved. Opportunity and Equity: Enrollment and Outcomes of Black and Latino Males in Boston Public Schools
Transcript
Copyright 2014 by the Center for Collaborative Education and the Annenberg Institute for School Reform at Brown University. All rights reserved.
Opportunity and Equity: Enrollment and Outcomes of Black and Latino Males in Boston Public Schools
Copyright 2014 by the Center for Collaborative Education and the Annenberg Institute for School Reform at Brown University. All rights reserved.
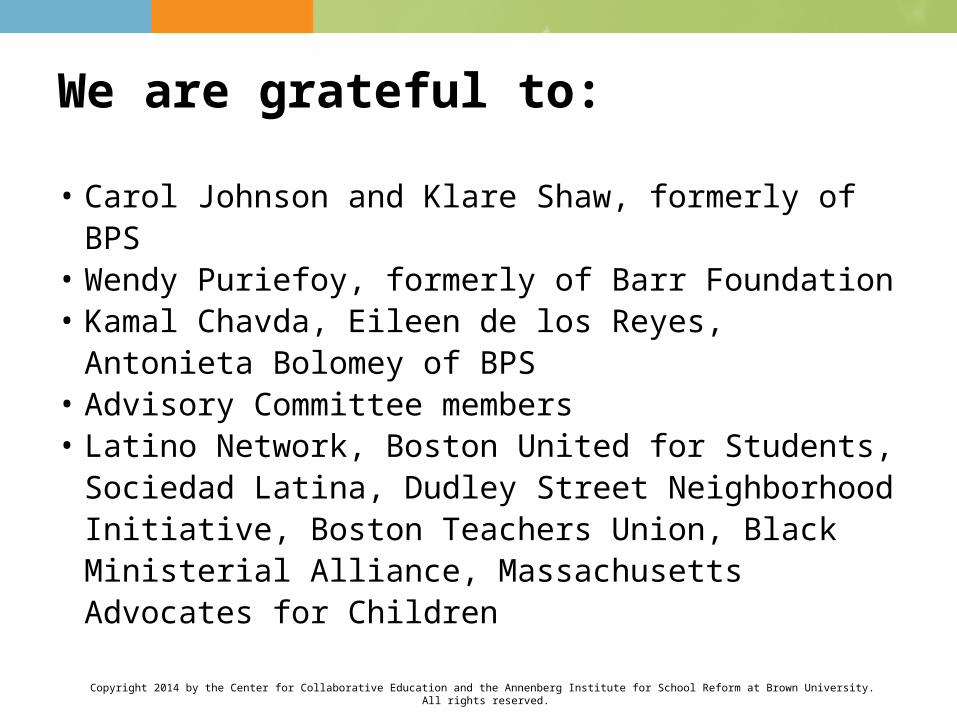
Partners • Center for Collaborative Education
• Annenberg Institute for School Reform at Brown University
• Boston Public Schools
• Barr Foundation
• Black & Latino Male Study Advisory Committee
Copyright 2014 by the Center for Collaborative Education and the Annenberg Institute for School Reform at Brown University. All rights reserved.
Context: National Outcomes for Black and Latino Males
• Special education disproportionalities
• Higher suspension and expulsion rates
• Less access to rigorous courses and programs
• Lower graduation and bachelor’s degree rates
• Lower employment rates and earnings
• Higher poverty and unemployment rates
Copyright 2014 by the Center for Collaborative Education and the Annenberg Institute for School Reform at Brown University. All rights reserved.
Purpose of Study
• To examine the enrollment and outcomes of Black and Latino male students
• To acknowledge the diversity of Black and Latino male students by geographic origin and race
Copyright 2014 by the Center for Collaborative Education and the Annenberg Institute for School Reform at Brown University. All rights reserved.
Data and Methods
• BPS student-level data (SY2009-2012)
• Enrollment, opportunity and attainment indicators
Copyright 2014 by the Center for Collaborative Education and the Annenberg Institute for School Reform at Brown University. All rights reserved.
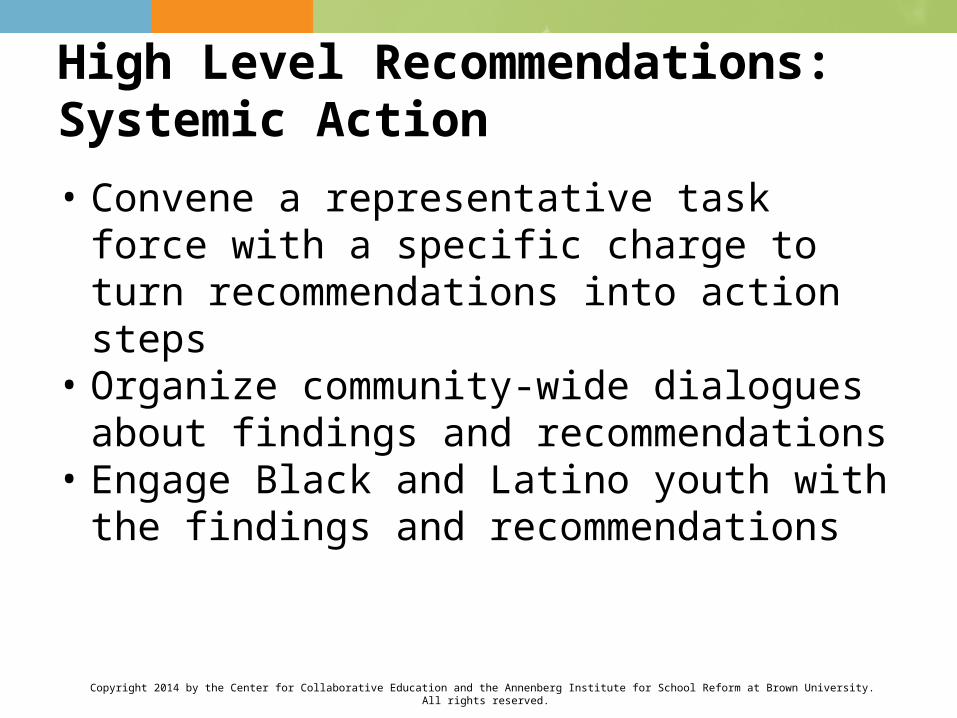
Three Stories: Story 1
1. Diversity of Black and Latino males in BPS
2. Access to educational opportunity
3. Educational attainment
Copyright 2014 by the Center for Collaborative Education and the Annenberg Institute for School Reform at Brown University. All rights reserved.
Black and Latino Racial/Ethnic Categories
Select:Latino Not Latino
✓ LatinoWhite Black
Other ✓ Not Latino
White BlackAsian Other
Copyright 2014 by the Center for Collaborative Education and the Annenberg Institute for School Reform at Brown University. All rights reserved.
BPS Male Enrollment by Race/Ethnicity SY2012 (N=28,777)
WhiteLatino Black
12.9
38.139.7
Asian
8.4
77.8%
Copyright 2014 by the Center for Collaborative Education and the Annenberg Institute for School Reform at Brown University. All rights reserved.
Racial-Ethnic-Geographic Framework
South America
0.2%
Central America
0.1%Africa 11.5%
Caribbean13.6%
North America 74.3%
Caribbean14.0%
South America
1.9%
Central America
4.5%
North America 79.2%
Note: Percentages may not add up to 100% due to rounding.
LATINO MALES BY GEOGRAPHYBLACK MALES BY GEOGRAPHY
Copyright 2014 by the Center for Collaborative Education and the Annenberg Institute for School Reform at Brown University. All rights reserved.
Racial-Ethnic-Geographic Framework
Latino-White 65.3%
Latino-Black 29.9%
Latino-Other 4.8%
Latino-White N.Am.51.8%
Latino-Black Caribbean 5.4%
Latino-Other Caribbean 0.6%
Latino-Other N.Am. 3.8%
Latino-White S.Am. 1.7%
Latino-Black S.Am. 0.1%Latino-Other S.Am. 0.1%
Latino-White C.Am. 3.6%
Latino-Black C.Am. 0.7%
Latino-Other C.Am. 0.2%
Latino-Black N.Am. 23.5%
LATINO MALES BY RACE LATINO MALES BY RACE & GEOGRAPHY
Note: Percentages may not add up to 100% due to rounding.
Latino-White Caribbean 8.1%
Copyright 2014 by the Center for Collaborative Education and the Annenberg Institute for School Reform at Brown University. All rights reserved.
Story 2
1. Diversity of Black and Latino males in BPS
2. Access to educational opportunity
3. Educational attainment
Copyright 2014 by the Center for Collaborative Education and the Annenberg Institute for School Reform at Brown University. All rights reserved.
Access to Educational Opportunities for Black and Latino Males in BPS
• Substantially separate special education placement rates
• Enrollment in Advanced Work Classes (Gr. 4-6)
• Enrollment in Exam Schools (Gr. 7-12)
• MassCore completion rates
Copyright 2014 by the Center for Collaborative Education and the Annenberg Institute for School Reform at Brown University. All rights reserved.
Males in Substantially Separate Special Education Placements by Race/Ethnicity
EG MG HSG
20.0
32.6 32.626.2
33.942.139.6 41.4 40.2
31.0
45.940.7
White Asian Black Latino
Perc
ent
Copyright 2014 by the Center for Collaborative Education and the Annenberg Institute for School Reform at Brown University. All rights reserved.
Males in Substantially Separate Special Education Placements by Race/Ethnicity and Geography
MG HSG HSGRace / Ethnicity
9/20 Latino Males 8/20 Black Males 8/20 Latino Males
+ Geograph
y
10/20 Latino Caribbean & Latino North American Males
11/20 Black Caribbean Males
9/20 Latino North American Males
Copyright 2014 by the Center for Collaborative Education and the Annenberg Institute for School Reform at Brown University. All rights reserved.
Disproportionality in Access to Advanced Work Classes for Males by Race/Ethnicity (Gr. 4-6)
AsianWhite LatinoBlack
Copyright 2014 by the Center for Collaborative Education and the Annenberg Institute for School Reform at Brown University. All rights reserved.
Disproportionality in Access to Exam Schools for Males by Race/Ethnicity (Gr. 7-12)
AsianWhite LatinoBlack
Copyright 2014 by the Center for Collaborative Education and the Annenberg Institute for School Reform at Brown University. All rights reserved.
6th Gr. Male AWC Participants in 2011 who Enrolled in Exam HS in 7th Gr. in 2012 by Race/Ethnicity
AsianWhite LatinoBlack
Copyright 2014 by the Center for Collaborative Education and the Annenberg Institute for School Reform at Brown University. All rights reserved.
Disproportionality in MassCore Completion by Male Graduates by Race/Ethnicity
AsianWhite LatinoBlack
Copyright 2014 by the Center for Collaborative Education and the Annenberg Institute for School Reform at Brown University. All rights reserved.
Males Enrolled in Exam Schools by Race/Ethnicity and Geography (%)
Black Black Caribbean Black African
8.6 7.5 5.3
Perc
ent
Latino Latino Black Latino Caribbean
8.04.8 2.7Pe
rcen
t
Copyright 2014 by the Center for Collaborative Education and the Annenberg Institute for School Reform at Brown University. All rights reserved.
Black and Latino Males
Higher: • Substantially separate special education
placements
Lower: • AWC enrollment• Exam school enrollment• AWC to Exam School rates• MassCore completion
Copyright 2014 by the Center for Collaborative Education and the Annenberg Institute for School Reform at Brown University. All rights reserved.
Black Males by Geography
Black Caribbean MalesHighest: • Substantially separate special education
placements (EG, HSG)
Black African & Black Caribbean MalesLowest: • AWC enrollment• Exam school enrollment•MassCore completion
Copyright 2014 by the Center for Collaborative Education and the Annenberg Institute for School Reform at Brown University. All rights reserved.
Latino Males by Race and Geography
Latino-Black & Latino Caribbean MalesHighest: • Substantially separate special education
placements
Lowest: • AWC enrollment• Exam school enrollment•MassCore completion
Copyright 2014 by the Center for Collaborative Education and the Annenberg Institute for School Reform at Brown University. All rights reserved.
Story 3
1. Diversity of Black and Latino males in BPS
2. Access to educational opportunity
3. Educational attainment
Copyright 2014 by the Center for Collaborative Education and the Annenberg Institute for School Reform at Brown University. All rights reserved.
Educational Attainment of Black and Latino Males in BPS
• Out-of-school suspension rates
• MCAS English Language Arts proficiency
• Cohort dropout rates
• Declining educational attainment
Copyright 2014 by the Center for Collaborative Education and the Annenberg Institute for School Reform at Brown University. All rights reserved.
Suspension Risks for Black and Latino Males Compared to White Males
• EG: Black males = 3.2 times higherLatino males = 1.7 times higher
• MG: Black males = 3.9 times higherLatino males = 2.9 times higher
• HSG: Black males = 3.2 times higherLatino males = 2.1 times higher
Copyright 2014 by the Center for Collaborative Education and the Annenberg Institute for School Reform at Brown University. All rights reserved.
Suspension Rates by Race/Ethnicity and Geography (%)
EG MG HSG
2.9
106.8
3.3
10.47.5
11.6Black
Black North American
Black African
Perc
ent
EG MG HSG
1.5
7.34.4
2.0
11.5
6.4
2.2
8.36.6
4.5
Latino
Latino Caribbean
Latino-Black
Latino North American
Perc
ent
Copyright 2014 by the Center for Collaborative Education and the Annenberg Institute for School Reform at Brown University. All rights reserved.
MCAS ELA Proficiency for White Males Compared to Black and Latino Males
• EG: 2.6 times higher than Black males 2.3 times higher than Latino males
• MG: 1.9 times higher than Black males1.7 times higher than Latino males
• HSG: 1.3 times higher than Black and Latino males
Copyright 2014 by the Center for Collaborative Education and the Annenberg Institute for School Reform at Brown University. All rights reserved.
MCAS ELA Proficiency Rates by Race/Ethnicity and Geography (%)
EG MG HSG
22.132.2
59.7
20.730.5
55.1
18.628.0
Black
Black Caribbean
Black AfricanPerc
ent
EG MG HSG
24.935
58.4
21.730.1
52.1
15.825.2
40.2Latino
Latino-Black
Latino CaribbeanPerc
ent
Copyright 2014 by the Center for Collaborative Education and the Annenberg Institute for School Reform at Brown University. All rights reserved.
Cohort Dropout Risks for Black and Latino Males Compared to White Males
• Black males = 1.7 times higher
• Latino males = 1.8 times higher
Copyright 2014 by the Center for Collaborative Education and the Annenberg Institute for School Reform at Brown University. All rights reserved.
4-Year Cohort Dropout Rates by Race/Ethnicity and Geography (%)
Series1
27.5 28.4Black
Black North American
Perc
ent
Series1
28.0 29.7 30.5 31.2 Latino
Latino North Amer-ican
Latino Caribbean
Latino-Black
Perc
ent
Copyright 2014 by the Center for Collaborative Education and the Annenberg Institute for School Reform at Brown University. All rights reserved.
100100 100100
9185 6067
7563 3643
4237 812
Start kindergarten
Graduate HS in 4 years
Enroll in college
Earn a degree after 7 years
AsianWhite LatinoBlackMales:
Copyright 2014 by the Center for Collaborative Education and the Annenberg Institute for School Reform at Brown University. All rights reserved.
Black and Latino Males
Lower: • MCAS ELA proficiency rates
Higher: • Risk of being suspended; Black males had
the highest• Cohort dropout rates; Latino males had the
highest
Copyright 2014 by the Center for Collaborative Education and the Annenberg Institute for School Reform at Brown University. All rights reserved.
Black Males by Geography
Black North American MalesHighest:• Suspension rates• Cohort dropout rates
Black African & Black Caribbean MalesLowest:•MCAS ELA proficiency rates
Copyright 2014 by the Center for Collaborative Education and the Annenberg Institute for School Reform at Brown University. All rights reserved.