26
Opportunities and challenges in the manganese alloy industry Kevin Fowkes Managing Consultant Metal Bulletin 14 th Asian Ferroalloys Conference Hong Kong, 27 th March 2012
Opportunities and challenges in the manganese alloy industry
Kevin FowkesManaging Consultant
Metal Bulletin 14th Asian Ferroalloys Conference
Hong Kong, 27th March 2012

1. Brief overview of recent developments in Mn alloy markets
2. Focus on India
3. Focus on Mn metal
Structure
1. Brief overview of recent developments in Mn alloy markets
2. Focus on India
3. Focus on Mn metal
Structure

• Manganese is the world’s fourth most heavily consumed metal
• Global mine output of 16 million Mn units in 2012 – over 90% goes into steel
• All steels contain manganese
• Manganese is used to remove sulphur from liquid steel(sulphur causes steel to crack)
What is manganese?
(sulphur causes steel to crack)
• There is no viable substitute for manganese as a de-sulphuriser
• Manganese is also used to improve the strength of certain steels(structural steels, high strength flat steels)
• Non-steel consumption of manganese includes de-polarisation of dry-cell batteries, and as an additive in certain aluminium and copper alloys

10
12
14
16
18
Global consumption of Mn alloys(million tonnes, gross weight basis)
HC FeMn
MLC FeMn
11%
9%
25%
Global demand for Mn alloys rose in 2012, despite a generally poor year.Long-term trend has been towards SiMn, away from HC FeMn
Mn metal
17.4
9%
8%
0
2
4
6
8
10
SiMn
48%
58%
9%
41%
8.1
9%
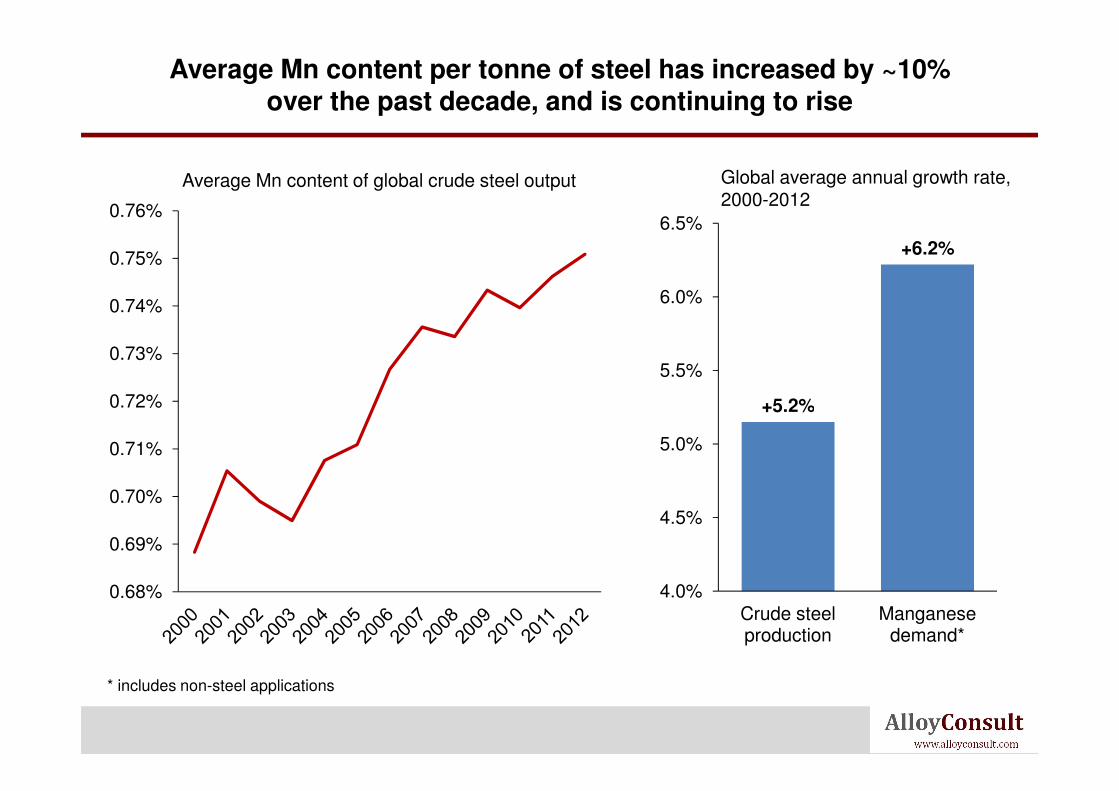
Average Mn content of global crude steel output
0.72%
0.73%
0.74%
0.75%
0.76%
Average Mn content per tonne of steel has increased by ~10% over the past decade, and is continuing to rise
+5.2%
+6.2%
5.5%
6.0%
6.5%
Global average annual growth rate, 2000-2012
0.68%
0.69%
0.70%
0.71%
0.72% +5.2%
4.0%
4.5%
5.0%
Crude steel production
Manganese demand*
* includes non-steel applications
10
12
14
16
18
Rest of world
Other Asia
11%
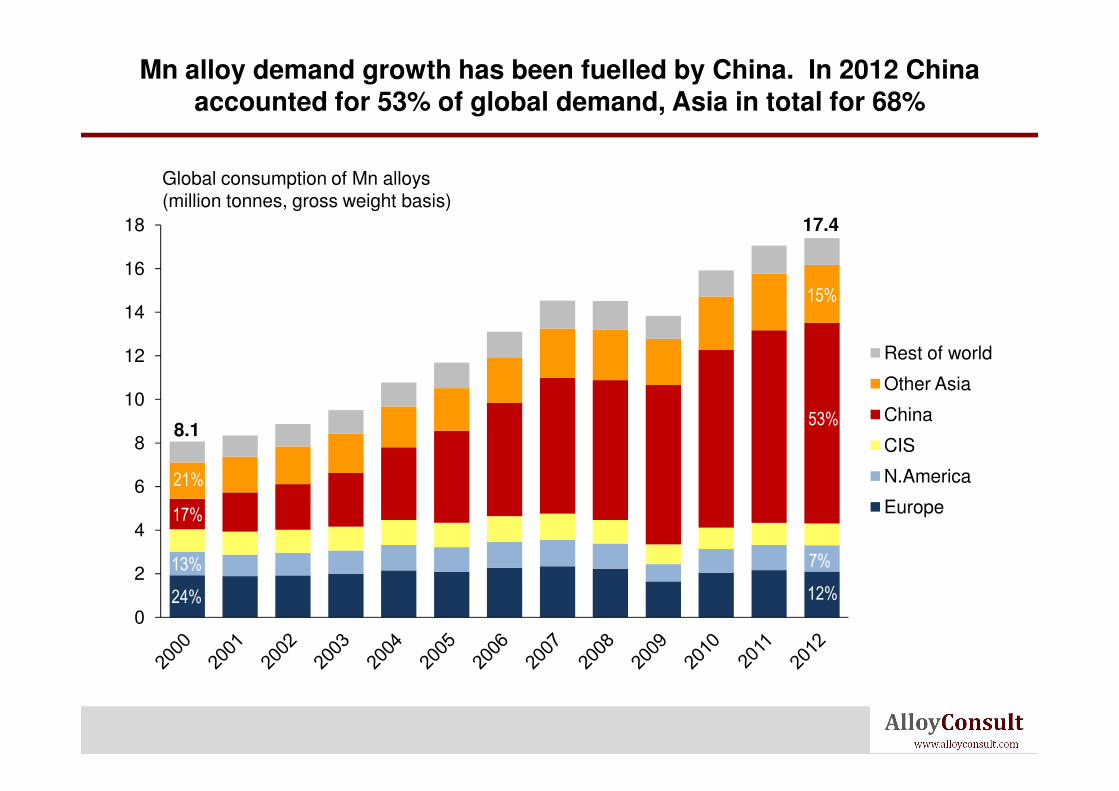
Mn alloy demand growth has been fuelled by China. In 2012 China accounted for 53% of global demand, Asia in total for 68%
Global consumption of Mn alloys(million tonnes, gross weight basis)
15%
17.4
0
2
4
6
8
10China
CIS
N.America
Europe
24%
13%
17%
21%
12%
7%
53%8.1

50%
55%
60%
65%
0.73%
0.74%
0.75%
0.76%
BRICs share
Average Mn content of global crude steel
output(left axis)
There are good reasons to expect that the average Mn content of steel will continue to rise
Structural steels require strength,
so tend to have a high manganese
content
Developing countries focus more on
structural steel consumption – for
infrastructure and buildings
Chinese building / earthquake
25%
30%
35%
40%
45%
0.68%
0.69%
0.70%
0.71%
0.72%BRICs share
of global steel output(right axis)
Chinese building / earthquake
resistance standards will continue
to tighten, leading to higher Mn
content in steel (especially rebar)
Strong demand potential from India
and other early-stage developing
nations
Increasing use of high-strength
steels in automotive sector

2000
2500
3000
3500
HC FeMnUS$ per tonne
Mn alloy prices have not shown any consistent improvementfrom the floor reached in Q4-2012
1500
2000
2500
3000
SiMnUS$ per tonne
0
500
1000
1500
EU US Japan China domestic
0
500
1000
1500
EU US Japan China domestic

12
14
16
18
20
2,500
3,000
3,500
Mn ore
Modest increases in Mn ore prices, if they are sustained, will most likely filter through to Mn alloy prices in the coming months
Mn ore and Mn alloy prices are
so well correlated because Mn
ore prices impact production
costs for non-integrated, higher
cost production
Filters directly into Chinese prices
– into Europe & elsewhere mostly
through Indian imports
EU SiMn spot price(US$ per tonne)
Mn ore bench spot price(US$ per dmtu)
0
2
4
6
8
10
500
1,000
1,500
2,000Mn ore
(right axis)
SiMn(left axis)
through Indian imports
Recent modest improvements
in Mn ore prices have not yet
been much reflected in Mn
alloy prices but if higher Mn
ore prices are sustained then
this is likely to changeR-squared correlation = 92.52%

1. Brief overview of recent developments in Mn alloy markets
2. Focus on India
3. Focus on Mn metal
Structure

1.5
2.0
2.5
MLCFeMn
HCFeMn
SiMn
India Mn alloy output by type(million tonnes, gross weight basis)
1.5
2.0
2.5
Exported
Consumed domestically
India Mn alloy output by consuming market(million tonnes, gross weight basis)
Indian Mn alloy output has risen fourfold over the past decade (~75% of output is SiMn). The growth has been driven by rising exports
0.0
0.5
1.0
1.5
0.0
0.5
1.0
12

600
700
800
900
1,000Other
MOIL
India Mn ore output by company(thousand tonnes, contained Mn basis)
1.2
1.4
1.6
1.8
2.0Imported
Domestic mines
India Mn ore supply by source(kt gross weight)
The growth of Indian Mn alloy output has been fuelled by imported ore. Indian Mn ore production has been quite stable for several years
0
100
200
300
400
500
600
0.0
0.2
0.4
0.6
0.8
1.0
1313

India has now supplanted both China and Ukraineas the leading global net exporter of SiMn
+200
+400
+600
+800
+1000India
CIS
China
Africa & Mid East
NET EXPORTER
Net exports of SiMn(thousand tonnes)
-800
-600
-400
-200
+0
+200
Europe
N.America
Other Asia & Oceania
Africa & Mid East
S.America
NET IMPORTER

200
300
India crude steel production(million tonnes)
2
3
India Mn alloy consumption(million tonnes, gross weight basis)
It is anticipated that Indian steel production will rise threefold by 2030, resulting in a similar increase in domestic demand for Mn alloys
SiMn
0
100
0
1
15Source: Hatch Consulting
HC FeMn
MLC FeMn

• India’s crude steel production is forecast to grow from 76 million tonnes in 2012 to ~270 million tonnes in 2030 (Source: Hatch, 2013)
• This will result in similar growth in Indian Mn alloy consumption:SiMn + 1.6 million tonnesHC FeMn +560,000 tonnesMLC FeMn +270,000 tonnes
In the longer term, India may be unable to sustain its exports ofMn alloys due to the strong growth of domestic demand
• The question is whether India will be able to maintain current Mn alloy export levels in the long-term(maybe will follow China’s path – exports end suddenly)
• Another parallel with China – India’s Mn alloy production is generally not low cost, despite rapid capacity expansion(increasing reliance on imported ore, captive power mostly based on coal & oil)
ShyamMICL
Hira
Nava Bharat
Maithan
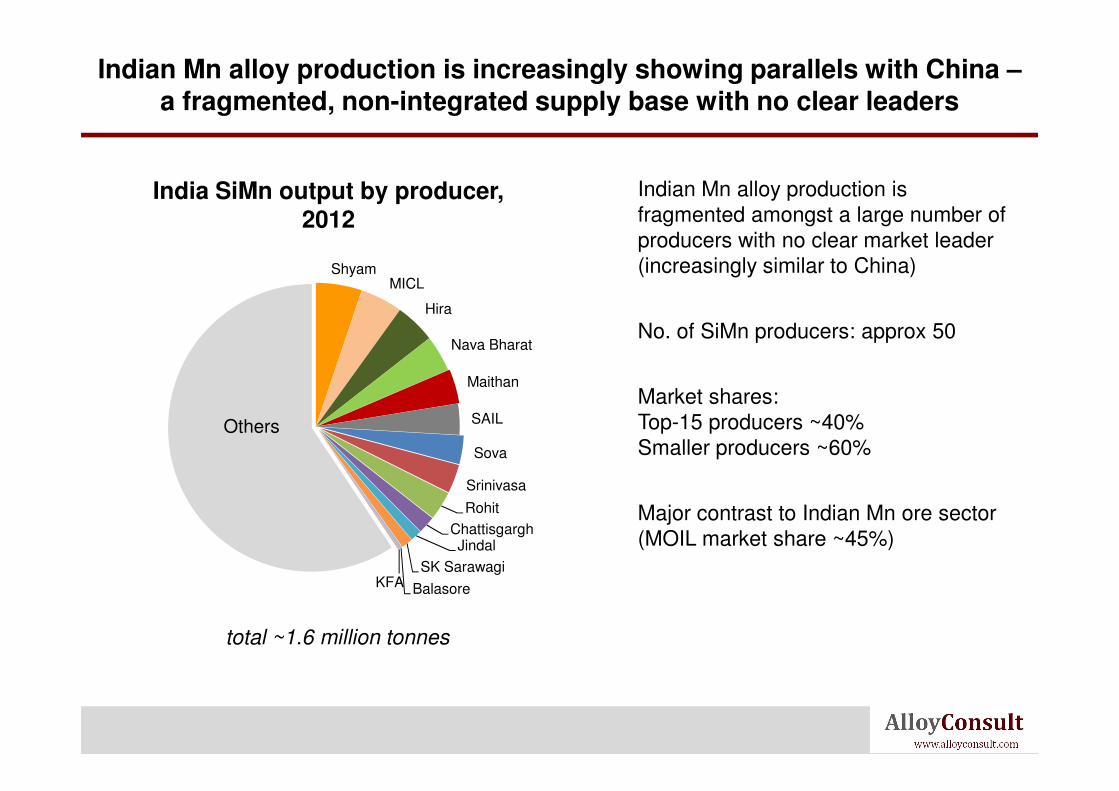
India SiMn output by producer,2012
Indian Mn alloy production is increasingly showing parallels with China –a fragmented, non-integrated supply base with no clear leaders
Indian Mn alloy production is fragmented amongst a large number of producers with no clear market leader(increasingly similar to China)
No. of SiMn producers: approx 50
Market shares:SAIL
Sova
Srinivasa
Rohit
ChattisgarghJindal
SK Sarawagi
BalasoreKFA
Others
total ~1.6 million tonnes
Market shares:Top-15 producers ~40%Smaller producers ~60%
Major contrast to Indian Mn ore sector(MOIL market share ~45%)

1,500
Ind
ia a
vera
ge
SiMn cash cost curve, 2012 (US$/tonne FOB)
Ch
ina a
vera
ge
Indian suppliers are amongst the highest cost, yet are still in the most competitive half of the cost curve (due to the size of Chinese output)
00 2 4 6 8 10 12
Ind
ia a
vera
ge
Production, million tonnes ( gross weight basis)*
Ch
ina a
vera
ge
*includes SiMn remelted in the manufacture of MLC FeMn

Average power prices in Mn alloy production, 2012
Despite rising captive power generation, India has amongst the highest power rates in the Mn industry. However its cheap labour is an advantage
Global average~$65/MWh
Global average~$300/tonne
Average total labour-related costs inSiMn production, 2012*
85% 67%
36%50%
85%
36%50%
* includes all maintenance, R&D and overhead costs
1. Brief overview of recent developments in Mn alloy markets
2. Focus on India
3. Focus on Mn metal
Structure

World Mn metal consumption, 2012
Mn metal is the only Mn alloy with a large non-steel demand segment (~30%). China accounts for ~70% of global demand
by region by end-use
Europe
N.AmericaRest of world
Al / Cu alloys
China
Oth. Asia
SS-200
SS-300/400
Carbon steel
MLC FeMnfeed
Al / Cu alloys& other

1.0
1.2
1.4
1.6
Other
China
11%
Mn metal production grew very strongly between 2000 and 2010, since when it has stabilised. China produces 97% of the world’s Mn metal
Global production of Mn metal by country(million tonnes)
0.0
0.2
0.4
0.6
0.8
13%
17%
21%
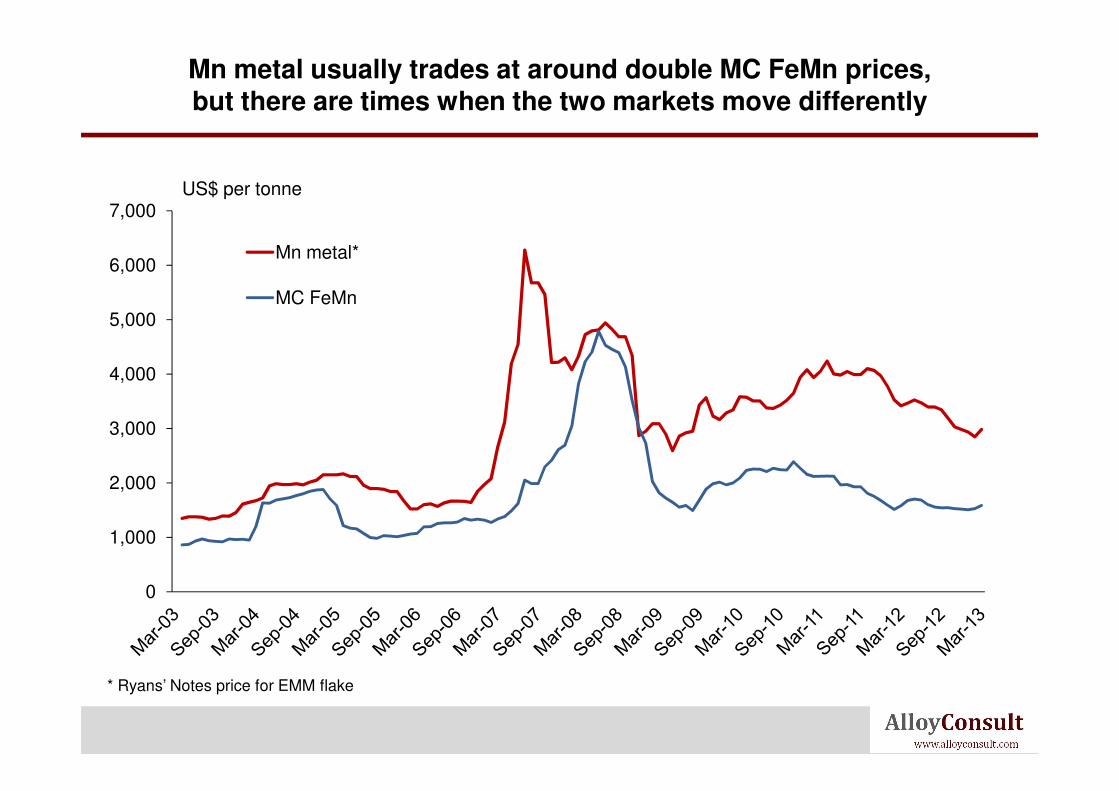
US$ per tonne
4,000
5,000
6,000
7,000
Mn metal*
MC FeMn
Mn metal usually trades at around double MC FeMn prices, but there are times when the two markets move differently
0
1,000
2,000
3,000
* Ryans’ Notes price for EMM flake

• Mn metal production can be considered extremely harmful to both the environment and worker health, due to use and disposal of toxic acids in the production process. This is a major reason why 97% of global output now takes place in China
• Rising environmental awareness and stricter legislation will make it increasingly difficult to build new Mn metal capacity in China – already production seems to have plateaued somewhat since 2010
Due to environmental and worker safety issues, it will become increasingly difficult to build new Mn metal capacity in China
have plateaued somewhat since 2010
• Chinese Mn metal output increasingly using imported carbonate ores due to deteriorating quality of domestic Mn ore
• Some new Mn metal projects springing up outside China (Gabon, N.America, Malaysia), based on less polluting technology
• Also expect growth in demand from high-end steels to increasingly be based on refined alloys (LC SiMn, LC FeMn, ULC FeMn) rather than Mn metal

40%
50%
60%
Scrap charge in Chinese stainless steel production
Anticipated trends in Chinese stainless scrap availability will make it easier to substitute refined alloys for Mn metal in the long term
Rising availability and use of stainless steel scrap in China will increase steelmakers’ flexibility to use other alloys in place of Mnmetal (LC SiMn, LC FeMn, ULC
10%
20%
30%
Source: Hatch Consulting
metal (LC SiMn, LC FeMn, ULC FeMn) because scrap contains fewer impurities (Si, C) than virgin raw materials

Opportunities and challenges in the manganese alloy industry
Thank you for your attentionThank you for your attention


