Opportunities in Domestic Equities Presented by: Fred Schaefer Schroders Investment Management North America September 23, 2010 For Financial Intermediary, Institutional and Consultant Use Only. Not for Redistribution Under any Circumstances. Schroder Investment Management North America Inc. 875 Third Avenue, New York, NY 10022 (212) 641-3800 Things you know and maybe one or two things you don’t know
Transcript
Opportunities in Domestic Equities
Presented by:
Fred Schaefer
Schroders Investment Management North America
September 23, 2010
For Financial Intermediary, Institutional and Consultant Use Only. Not for Redistribution Under any Circumstances.
Schroder Investment Management North America Inc.875 Third Avenue, New York, NY 10022
(212) 641-3800
Things you know and maybe one or two things you don’t know
2
Agenda
Topics I will cover:
• Why invest in US Equities?
• General overview of the US equity market
• SMID Cap – an unrecognized opportunity in US equities
Why Invest in the US?
4
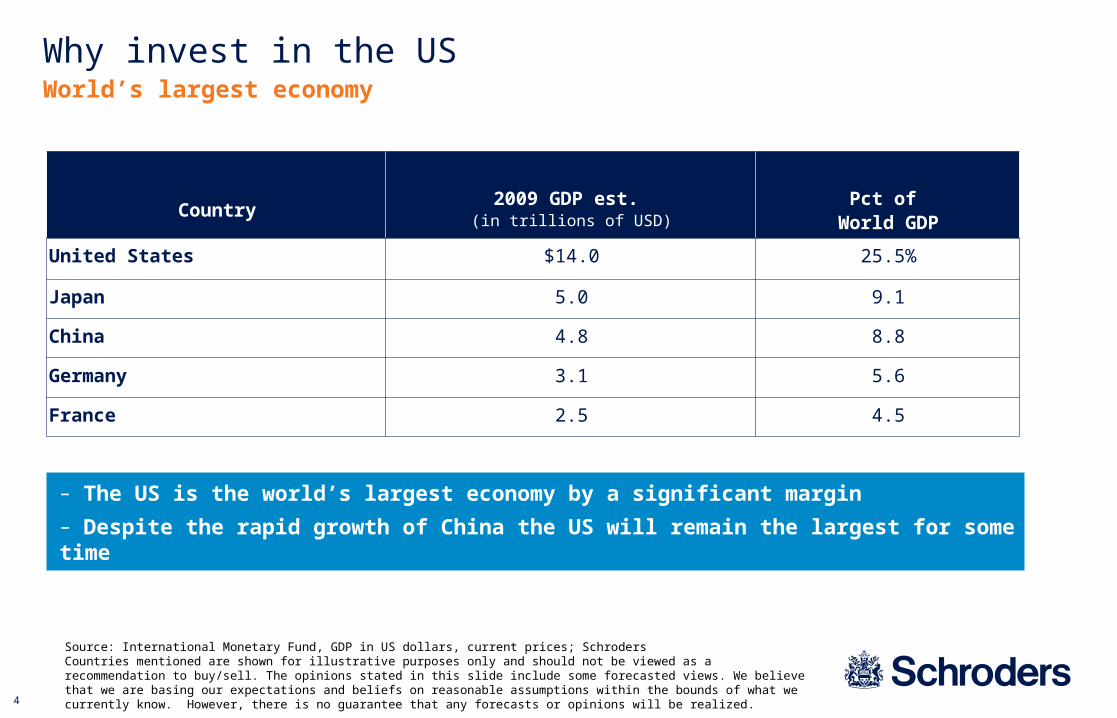
Why invest in the US
Country2009 GDP est. (in trillions of USD)
Pct of World GDP
United States $14.0 25.5%
Japan 5.0 9.1
China 4.8 8.8
Germany 3.1 5.6
France 2.5 4.5
Source: International Monetary Fund, GDP in US dollars, current prices; SchrodersCountries mentioned are shown for illustrative purposes only and should not be viewed as a recommendation to buy/sell. The opinions stated in this slide include some forecasted views. We believe that we are basing our expectations and beliefs on reasonable assumptions within the bounds of what we currently know. However, there is no guarantee that any forecasts or opinions will be realized.
– The US is the world’s largest economy by a significant margin
– Despite the rapid growth of China the US will remain the largest for some time
World’s largest economy
5
Country2010 Stock Market Capitalization
(in trillions of USD)Pct of Global Market
Capitalization
United States $13.2 32.0%
China 3.6 8.8
Japan 3.3 8.0
United Kingdom 2.5 6.0
France 1.5 3.6
Source: FactSetCountries mentioned are shown for illustrative purposes only and should not be viewed as a recommendation to buy/sell.
– The US is almost 1/3 of world market cap
– For a diversified investor this is too much of the world to ignore
Why invest in the US World’s largest equity market
6
Favorable median age demographicsWhy invest in the US
The US has a structural demographic advantage over Europe and Japan:
– Median age is increasing more slowly than Europe and Japan
– By 2050 the US median age will be younger than China’sSource: United Nations Department of Economic and Social Affairs, Population Division: "World Population Aging: 1950-2050“.Countries mentioned are shown for illustrative purposes only and should not be viewed as a recommendation to buy/sell.
The opinions stated in this slide include some forecasted views. We believe that we are basing our expectations and beliefs on reasonable assumptions within the bounds of what we currently know. However, there is no guarantee that any forecasts or opinions will be realized.
Median population age projections
22
28.8
20.6
32.1 30.426.5
35.5
30
37.741.2
32
39.3 39
45.4
50
36.2
40.743.8
49.553.1
0
10
20
30
40
50
60
World US China Europe Japan
1975 2000 2025 2050
7
Better older age demographicsWhy invest in the US
Older age populations becoming increasingly large in Europe and Japan
– This will create a significant drag on societal resources
– AND Europe and Japan will have a smaller labor force to support this group
Source: United Nations Department of Economic and Social Affairs, Population Division: "World Population Aging: 1950-2050“.Countries mentioned are shown for illustrative purposes only and should not be viewed as a recommendation to buy/sell.
The opinions stated in this slide include some forecasted views. We believe that we are basing our expectations and beliefs on reasonable assumptions within the bounds of what we currently know. However, there is no guarantee that any forecasts or opinions will be realized.
Percentage of population over age 65
5.7
10.5
4.4
11.4
7.96.9
12.3
6.9
14.717.2
10.4
18.5
13.2
21.5
28.9
15.6
21.122.7
29.2
36.4
0
5
10
15
20
25
30
35
40
World US China Europe Japan
1975 2000 2025 2050
8
66.364.3
58.5 57.6
61.4
66.9 282724
2118
16
50
55
60
65
70
75
2000 2010 2020 2030 2040 2050
0
5
10
15
20
25
30
35
40
Western Europe 15-64 Western Europe 65-99
70.6
67.6
59.5
68.1
73.4
62.6
27
7 9
12
17
24
50
55
60
65
70
75
2000 2010 2020 2030 2040 2050
0
5
10
15
20
25
30
35
40
China 15-64 China 65-99
66.2 66.9
64 60.660.761.2
12
19 2016
13
20
50
55
60
65
70
75
2000 2010 2020 2030 2040 2050
0
5
10
15
20
25
30
35
40
US 15-64 US 65-99
68.1
64.1
60.459.1
54.752.1
37
3430
2823
17
50
55
60
65
70
75
2000 2010 2020 2030 2040 2050
0
5
10
15
20
25
30
35
40
Japan 15-64 Japan 65-99
Why invest in the USAge group demographics
• Old age population increases in all markets save the US, where it flattens after 2030
• Relative size of the labor age work force declines in all four markets, but smallest decline is in the US
Source: United Nations Department of Economic and Social Affairs, Population Division: "World Population Ageing: 1950-2050“. Countries mentioned are shown for illustrative purposes only and should not be viewed as a recommendation to buy/sell.The opinions stated in this slide include some forecasted views. We believe that we are basing our expectations and beliefs on reasonable assumptions within the bounds of what we currently know. However, there is no guarantee that any forecasts or opinions will be realized.
Europe US
China Japan
9
Net in-migrationWhy invest in the US
The pattern of net immigration into the US is unique
• Immigration to Europe is lower than the US and will decline after 2020
• There is no appreciable immigration into Japan
• Net out-migration from China
Source: United Nations Department of Economic and Social Affairs, Population Division: "World Population Ageing: 1950-2050“.Countries mentioned are shown for illustrative purposes only and should not be viewed as a recommendation to buy/sell.The opinions stated in this slide include some forecasted views. We believe that we are basing our expectations and beliefs on reasonable assumptions within the bounds of what we currently know. However, there is no guarantee that any forecasts or opinions will be realized.
Net migration projections: 2010 to 2050
4.7
1.8
-0.3 -0.3 -0.3 -0.3 -0.2
4.64.54.3 4.3
2.62.3
2.02.1
0.0 0.0 0.0 0.0 0.0
-1
0
1
2
3
4
5
2010 2020 2030 2040 2050
China US Europe Japan
10
Why invest in the US
– Favorable net migration patterns for the US
– Most US immigrants are of labor force age
– This both supplements the US workforce and increases population diversity
Most immigrants of working age
Source: Department of Homeland Security as of June 30, 2010
Over 50% of legal immigrants are of working age
23.3%
53.4%
18.1%
5.2%
0.0%
10.0%
20.0%
30.0%
40.0%
50.0%
60.0%
Under 20 20-44 45-64 65+
11
Why invest in the US
The US is a strong source of innovation– Largest share of Triadic patents (issued
by US, Japan and European patent authorities)
– Largest share of Information and Communications Technology (ICT) Triadic patents
Innovation
1
Total Triadic and ICT Patents Issued by Region of Inventor
0.0%
5.0%
10.0%
15.0%
20.0%
25.0%
30.0%
35.0%
40.0%
US Japan EU BRIICS Other
Total Triadic Patents ICT patents
Source: OECD Compendium of Patent Statistics as of June 30, 2010Countries mentioned are shown for illustrative purposes only and should not be viewed as a recommendation to buy/sell.
12
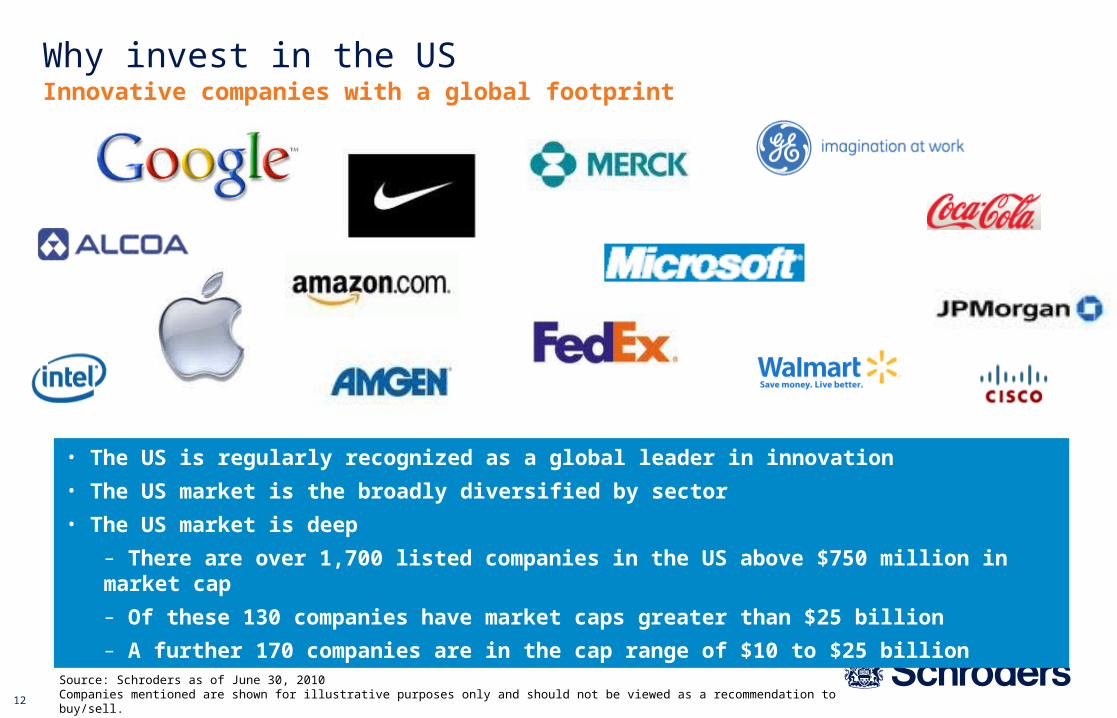
Why invest in the USInnovative companies with a global footprint
• The US is regularly recognized as a global leader in innovation
• The US market is the broadly diversified by sector
• The US market is deep
– There are over 1,700 listed companies in the US above $750 million in market cap
– Of these 130 companies have market caps greater than $25 billion
– A further 170 companies are in the cap range of $10 to $25 billion
Source: Schroders as of June 30, 2010Companies mentioned are shown for illustrative purposes only and should not be viewed as a recommendation to buy/sell.
13
Why invest in the US
The FT Global 500 has more US companies than any other country
US Companies are still globally dominant
Number of companies Pct of total Market Value
US 163 36.8%
UK 32 8.0
China 23 7.5
Japan 42 6.1
France 27 5.2
Source: Financial Times; data as of March 31, 2010Countries mentioned are shown for illustrative purposes only and should not be viewed as a recommendation to buy/sell.
14
– World’s largest economy and market
– Home to significant global innovation and strong global companies
– Perhaps the most flexible economy in the world
– Demographics favor the US over Europe and Japan
– ‘Not dead yet’
Lots going for the US
Investing in the US
Why invest in the US
Source: Schroders
Overview of the US equity market
16
– Capitalization
– Style
– Active vs. Passive
Investing in the US
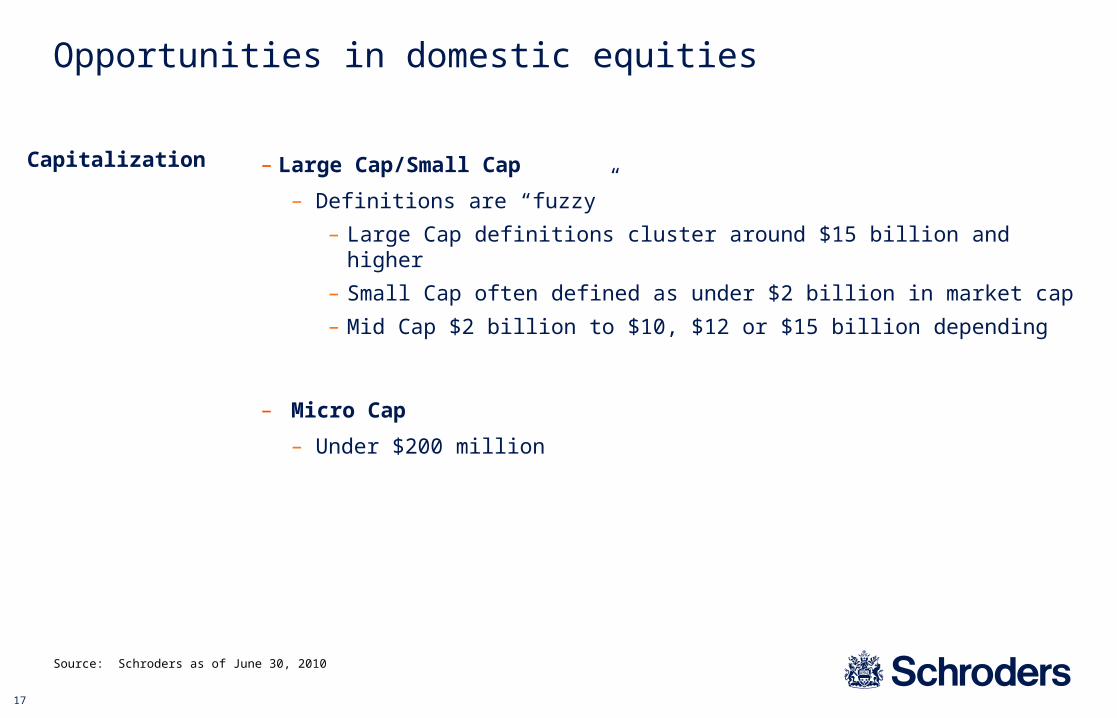
Opportunities in domestic equities
17
– Large Cap/Small Cap
– Definitions are “fuzzy”
– Large Cap definitions cluster around $15 billion and higher
– Small Cap often defined as under $2 billion in market cap
– Mid Cap $2 billion to $10, $12 or $15 billion depending
– Micro Cap
– Under $200 million
Capitalization
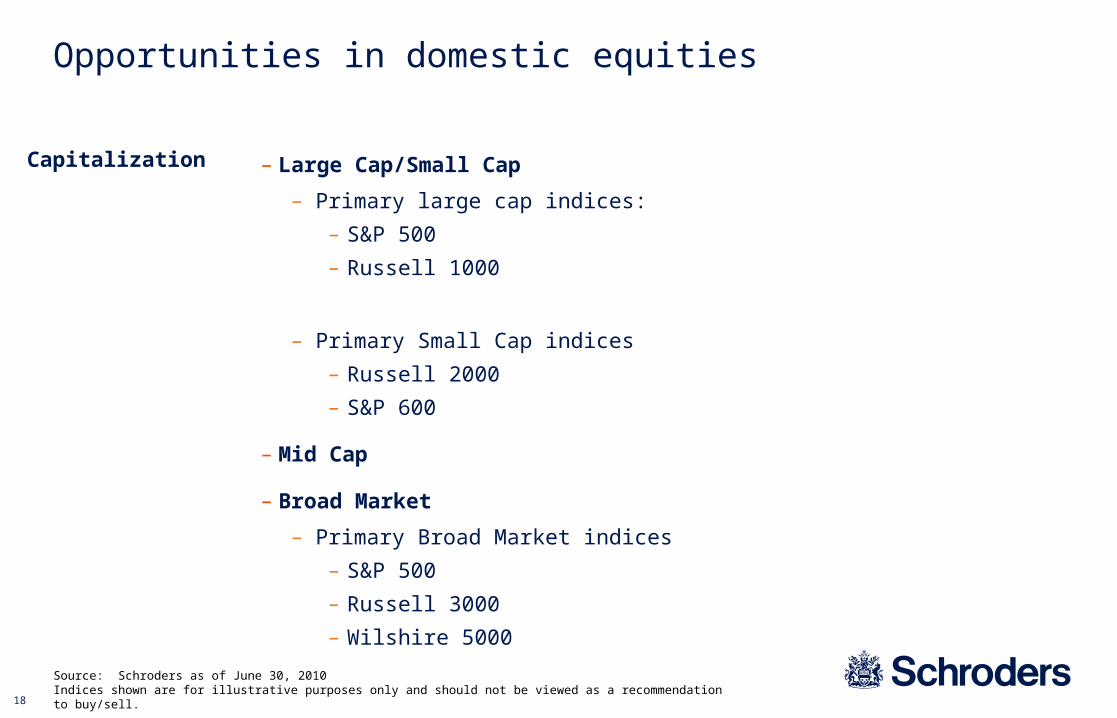
Opportunities in domestic equities
Source: Schroders as of June 30, 2010
18
– Large Cap/Small Cap
– Primary large cap indices:
– S&P 500
– Russell 1000
– Primary Small Cap indices
– Russell 2000
– S&P 600
– Mid Cap
– Broad Market
– Primary Broad Market indices
– S&P 500
– Russell 3000
– Wilshire 5000
Capitalization
Opportunities in domestic equities
Source: Schroders as of June 30, 2010Indices shown are for illustrative purposes only and should not be viewed as a recommendation to buy/sell.
19
S&P 500Risk/return
Returns (%) Standard Deviation (%)
S&P 500 11.03 15.49
Russell 2000 11.03 19.96
Source: Zephyr to June 2010Performance shown is past performance. Past performance is not necessarily a guide to future performance. The value of investments can go down as well as up and is not guaranteed.
January 1979 to June 2010Returns (%)
Standard Deviation (%)
12.0
9.0
6.0
3.0
0.010.0 14.0 20.012.0 18.0 22.0
15.0
S&P 500 Index
Russell 2000
20
The US equity market
― Large Cap
― Tend to be more well known companies
― Generally well established
― Multi product
― Followed by a large number of Wall Street (or “sell side”) analysts
― Returns: higher than bonds (the “safe” asset class)
― Riskier than bonds
― Arguably an efficient asset class
― Therefore harder to “beat the market”
General characteristics
Source: Schroders as of June 30, 2010
21
Top ten holdings – June 30, 2010
Source: FactSet as of June 30, 2010.Securities mentioned are for illustrative purposes only and should not be viewed as a recommendation to buy/sell.
Company %
Exxon Mobil 3.13
Apple 2.46
Microsoft 1.88
Procter & Gamble 1.85
AT&T 1.75
International Business Machines 1.70
Johnson & Johnson 1.65
General Electric 1.56
Chevron 1.55
JPMorgan Chase & Co. 1.53
Total 19.06
S&P 500
22
The US equity market
― Small Cap
― Unknown or relatively unknown companies
― This space contains mixture of newer and older companies
― Single or limited product lines
― Followed by a small number of Wall Street (or “sell side”) analysts (if followed at all)
― Coverage often by regional brokers rather than the national firms
― Some argue there is a “small cap cycle” (7 years or so) of outperformance vs. large caps
― Arguably an inefficient asset class
― Therefore more opportunity to “beat the market”
General characteristics
Source: Schroders as of June 30, 2010
23
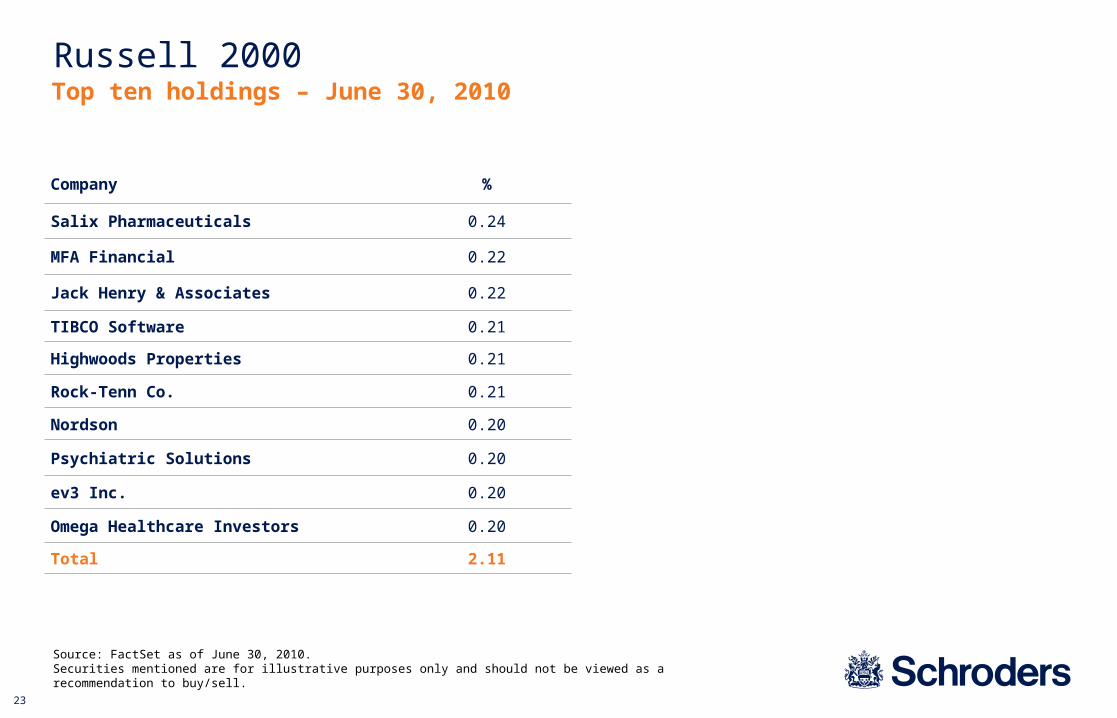
Top ten holdings – June 30, 2010
Source: FactSet as of June 30, 2010. Securities mentioned are for illustrative purposes only and should not be viewed as a recommendation to buy/sell.
Company %
Salix Pharmaceuticals 0.24
MFA Financial 0.22
Jack Henry & Associates 0.22
TIBCO Software 0.21
Highwoods Properties 0.21
Rock-Tenn Co. 0.21
Nordson 0.20
Psychiatric Solutions 0.20
ev3 Inc. 0.20
Omega Healthcare Investors 0.20
Total 2.11
Russell 2000
SMID – under recognized opportunity
25
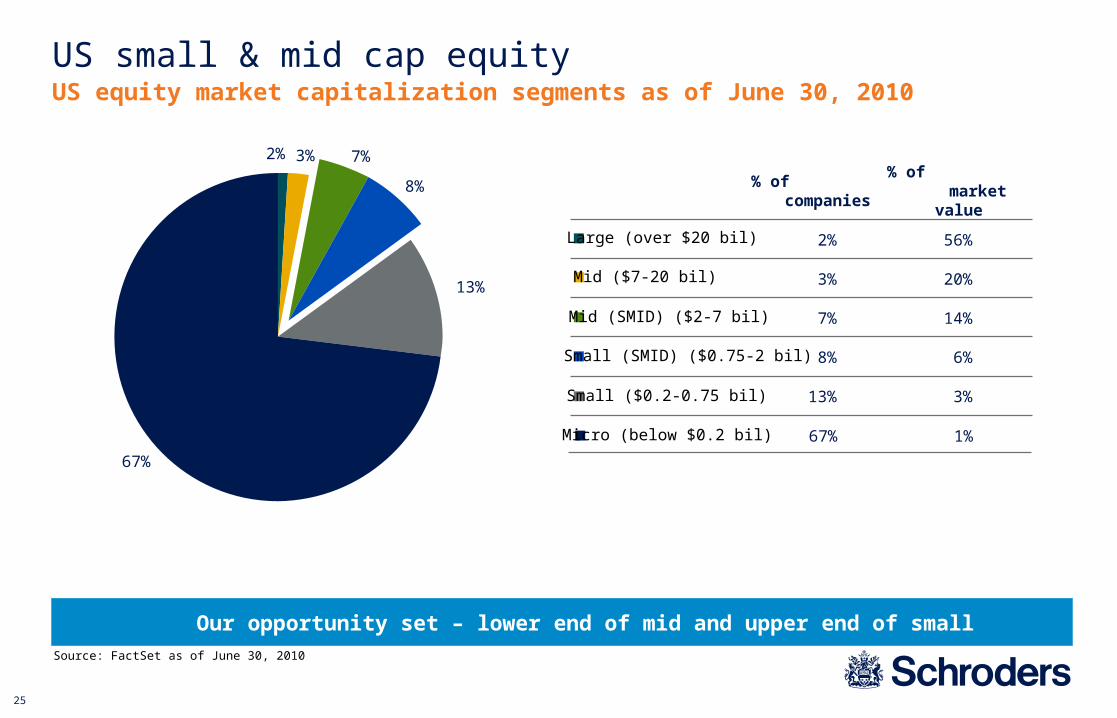
US small & mid cap equityUS equity market capitalization segments as of June 30, 2010
Source: FactSet as of June 30, 2010
Our opportunity set – lower end of mid and upper end of small
Micro (below $0.2 bil)
% of companies
2%
3%
7%
8%
13%
Large (over $20 bil)
Mid ($7-20 bil)
Mid (SMID) ($2-7 bil)
Small (SMID) ($0.75-2 bil)
Small ($0.2-0.75 bil)
67%
% of market value
56%
20%
14%
6%
3%
1%
7%
8%
13%
67%
3%2%
26
Russell 2500 vs. Russell 2000: Dec 1978 – Dec 2009
― Over the past 31 years, the Russell 2500 Index (SMID) has generated a higher return than the Russell 2000 (Small) at a lower level of risk.1
― SMID also has outperformed the S&P 500 (large cap) although at a higher risk level.1
― SMID has regularly outperformed small cap in rolling 3-year observations, and always at a lower risk level.2
― SMID cap in combination with large cap enables an investor to generate an attractive risk/return profile for their US equity exposure.3
― Small cap combined with large cap has not generated an improvement in return or risk for the total portfolio.
― SMID has been the superior option for investors seeking to add excess return to their US large cap exposure.
SMID Offers superior risk/reward profile to small cap
Source: Schroders1 See slide 262 See slide 283 See slide 31
27
0
10
20
30
0 10 20 30
S&P 500 (large) Russell 2500 (smid) Russell 2000 (small)
SMID – 31 years of outperforming SmallHistorical risk/return profile of indices: December 31, 1978 – June 30, 2010
% Annualized Return
Source: Zephyr. Data to June 30, 2010. Performance shown is past performance. Past performance is not necessarily a guide to future performance. The value of investments can go down as well as up and is not guaranteed. Indices shown are for illustrative purposes only and should not be viewed as a recommendation to buy/sell.
Risk (%) Return (%)
S&P 500 (large) 15.49 11.03
Russell 2500 (smid) 18.58 12.38
Russell 2000 (small) 19.96 11.03
% Risk (Standard Deviation)
Large
SMID
Small
SMID – higher return and higher risk than large cap
Small – higher risk than large without the performance premium
28
-6
-4
-2
0
2
4
6
8
1979 1983 1987 1991 1995 1999 2003 2007
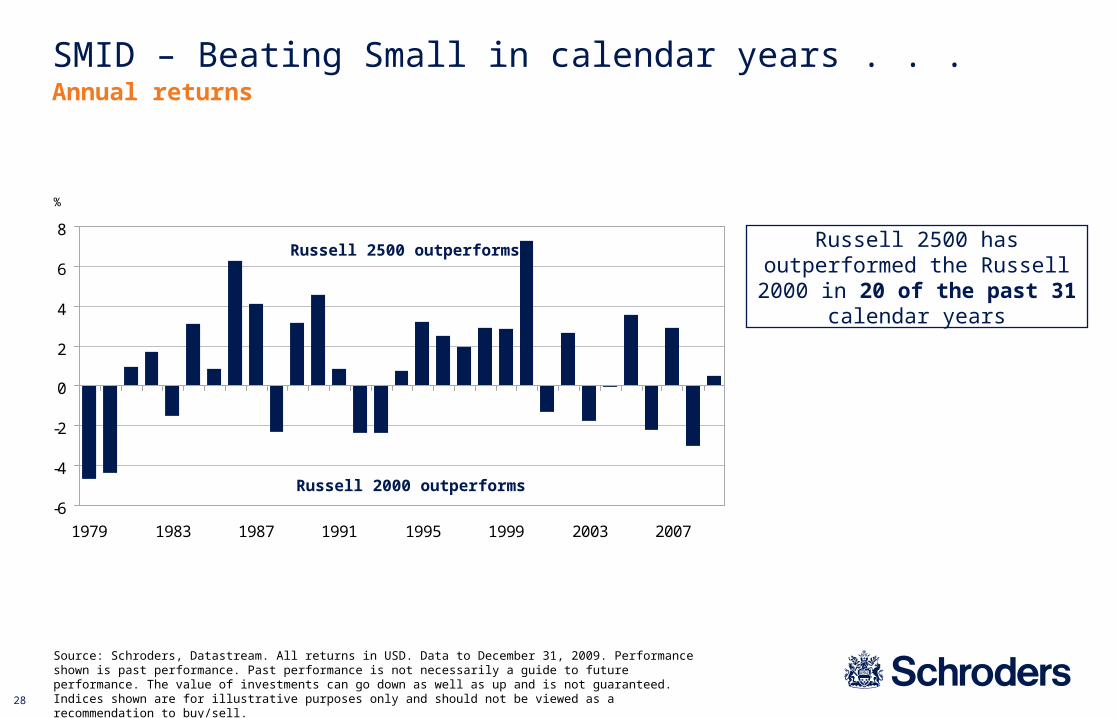
SMID – Beating Small in calendar years . . .Annual returns
%
Source: Schroders, Datastream. All returns in USD. Data to December 31, 2009. Performance shown is past performance. Past performance is not necessarily a guide to future performance. The value of investments can go down as well as up and is not guaranteed. Indices shown are for illustrative purposes only and should not be viewed as a recommendation to buy/sell.
Russell 2500 has outperformed the Russell 2000 in 20 of the past 31
calendar years
Russell 2500 outperforms
Russell 2000 outperforms
29
-3
-2
-1
0
1
2
3
4
5
1981 1984 1987 1990 1993 1996 1999 2002 2005 2008
SMID – Beating Small in rolling three years . . .Rolling three-year returns
%
Source: Schroders, Datastream. All returns in USD. Data to December 31, 2009. Performance shown is past performance. Past performance is not necessarily a guide to future performance. The value of investments can go down as well as up and is not guaranteed. Indices shown are for illustrative purposes only and should not be viewed as a recommendation to buy/sell.
Russell 2500 has outperformed the Russell 2000 23 out of 29 times
over 3 year rolling periods
30
Annual periods Rolling 3-year periods (calendar basis)
Number of observations 31 29
Number of times Small returns were higher than SMID
(R2000 beat the R2500)
11 6
Number of times SMID returns were higher than Small
(R2500 beat the R2000)
20 23
SMID: largest lag (4.68%) (2.32%)
SMID: largest outperformance 7.29% 4.48%
Comments:
– In annual periods, SMID beat Small 65% of the time
– In rolling 3-year periods, SMID beat Small 79% of the time
Russell 2500 vs. Russell 2000 (SMID vs. Small) – Returns analysis
Returns study December 1978 – December 2009
Source: Schroders, Datastream. All returns in USD. Data to December 31, 2009. Performance shown is past performance. Past performance is not necessarily a guide to future performance. The value of investments can go down as well as up and is not guaranteed. Indices shown are for illustrative purposes only and should not be viewed as a recommendation to buy/sell.
US SMID vs Small Cap: returns
31
Rolling 3-year periods (calendar basis)
Number of observations 29
Number of times Small had lower standard deviation than SMID
(R2000 lower than R2500)
0
Number of times SMID had lower standard deviation than Small
(R2500 lower than R2000)
29
Average difference (1.49%)
Comments:
– In rolling 3-year periods, SMID always had a lower standard deviation than Small Cap
– On average, the SMID standard deviation was 1.47% lower than Small Cap’s
Russell 2500 vs. Russell 2000 (SMID vs. Small) – analysis of standard deviation
Risk study December 1980 – December 2009
Source: Schroders, Datastream. All returns in USD. Data to December 31, 2009. Performance shown is past performance. Past performance is not necessarily a guide to future performance. The value of investments can go down as well as up and is not guaranteed. Indices shown are for illustrative purposes only and should not be viewed as a recommendation to buy/sell.
US SMID vs small cap: risk
32
― Using a Mean Variance Optimizer we have studied the addition of small and Smid to a large cap US portfolio. This is also known as an efficient frontier analysis. The output from the optimizer indicates:
• SMID cap in combination with large cap enables an investor to generate an attractive risk/return profile for their US equity exposure. Portfolio efficiency as measured by Sharpe ratio increased with the addition of Smid.
• Small cap combined with large cap has not generated an improvement in return or risk for the total portfolio. Overall portfolio efficiency declined using small cap.
• This is due to the superior risk/return characteristics of SMID vs. Small.
• SMID has been the superior option for investors seeking to add excess return to their US large cap exposure.
SMID Offers superior portfolio construction in combination with large capRussell 2500 vs. Russell 2000: Dec 1978 – Dec 2009
Source: Schroders
33
SMID – The new small
― Since inception, the Russell 2500 Index (SMID) has generated a higher return than the Russell 2000 (Small) at a lower level of risk
― SMID has regularly outperformed small cap, and always at a lower risk level
― SMID cap in combination with large cap enables an investor to generate a more attractive risk/return profile for their US equity exposure. Small cap has not generated that benefit.
Recap:
Source: Schroders
34
Important information
Risks associated with Schroder Small and Mid Cap: All investments involve risks including the risk of possible loss of principal. The market value of a portfolio may decline as a result of a number of factors, including adverse economic and market conditions, prospects of stocks in the portfolio, changing interest rates, and real or perceived adverse competitive industry conditions. Investments in small and medium capitalization companies generally carry greater risk than is customarily associated with larger capitalization companies, which may include, for example, less public information, more limited financial resources and product lines, greater volatility, higher risk of failure than larger companies, and less liquidity.
The views and forecasts contained herein are those of the US Small and SMID Cap Equity team and are subject to change. The information and opinions contained in this document have been obtained from sources we consider to be reliable. No responsibility can be accepted for errors of facts obtained from third parties. Reliance should not be placed on the views and information in the document when taking individual investment and/or strategic decisions.
Performance shown is past performance. Past performance is not necessarily a guide to future performance. The value of investments can go down as well as up and is not guaranteed.
The opinions stated in this presentation include some forecasted views. We believe that we are basing our expectations and beliefs on reasonable assumptions within the bounds of what we currently know. However, there is no guarantee that any forecasts or opinions will be realized.
This document is intended to be for informational purposes only and is not intended as promotional material in any respect. The material is not intended as an offer or solicitation for the purchase or sale of any financial instrument. The material is not intended to provide, and should not be relied on for, accounting, legal or tax advice, or investment recommendations.
Schroder Investment Management North America Inc.875 Third Avenue, New York, NY 10022-6225(212) 641-3800www.schroders.com/us