48
SHOCKS 17 16 15 OPPORTUNITY $ ! FORECAST Fit for the future Boosting resilience in the face of uncertainty State of the State New Zealand 2017

SHOCKS
17
16
15
OPPORTUNITY
$
!
FORECAST
Fit for the futureBoosting resilience in the face of uncertaintyState of the State New Zealand 2017

State of the State 2017
Thomas Pippos Chief Executive Deloitte
Girol Karacaoglu Head of School of Government Victoria University of Wellington
Foreword
In State of the State 2016 we looked at how a social investment approach can improve the outcome of the long term wellbeing of New Zealanders.
In the 2017 report we widen the lens to look at the theme of household resilience and wellbeing. Not only is this relevant to all New Zealanders, it is topical for our current Government given recent pre-Budget announcements. Household resilience is concerned with how Kiwis preserve their quality of life in the face of change.
The whakatauki that opens our report draws on the proverbial saying “me he tokatū moana” meaning “like a boulder weathering the elements”. This saying underscores the importance of strong households as a source of resilience for New Zealand as we face future disruptions and change.
We care about resilience not just because it enables us to withstand life’s disruptions, but to measure the extent to which New Zealanders can adapt, grow and even thrive in the face of change. Never has it been more important to think about how households cope with change – and how government can best support them.
There is no crystal ball for what impact things like advances in technology, shifts in international politics or changing demographics will have on New Zealand households. But the one thing everyone agrees on is that more – and faster – change is a fact of life for future generations.
As with our 2016 report, some of New Zealand’s brightest thinkers and most senior leaders generously gave their time to talk to us on this topic. We interviewed people from the public sector, business, non-government, media and academia. The experience and reach of the people we talked to is testament both to how complex this topic is, and how much consensus there is on its importance.
For New Zealand households to flourish, and for the next generation to have the quality of life that they desire, we all have a role to play.
We hope our State of the State report provides you with valuable insights into how we can further develop and improve the resilience and wellbeing of households in New Zealand.
Dave Farrelly Lead Partner, Public Sector Deloitte

State of the State 2017
3
Executive summary 1
Understanding resilient households 8
A framework for assessing household resilience 14
Resilience in New Zealand 17
Recommendations 31
End notes 37
Bibliography 39
Contacts 43
Key contributors 44

State of the State 2017 | Executive summary
1
SHOCKS
17
16
15
OPPORTUNITY
$
!
FORECAST
Executive summaryResilience underpins the security of our wellbeing. Boosting household resilience in the face of uncertainty will help ensure we are fit for the future.
Life in New Zealand is pretty good. We have one of the best performing economies in the developed world and enjoy comparatively high levels of social cohesion and connectedness. We are buoyed by strong institutions built on solid governance. And we boast a vibrant business environment.
Together these factors underpin our wellbeing – our quality of life. We recognise that Kiwi values such as fairness, connection with our natural surroundings, whānau and community, lie at the heart of what makes New Zealand one of the best places in the world to live.
If wellbeing is our quality of life, then resilience is how secure that quality of life is.
We experience a surprising amount of change. New Zealanders from all backgrounds suffer economic loss, health problems or adverse changes in the lives of those closest to them. For example, 70% of New Zealanders experienced a major life change in 2014. And in any given year, one in nine working age Kiwis will suffer from a significant fall in income. Given all of this change, it is not surprising that New Zealanders rank resilience higher than many other aspects of wellbeing.

State of the State 2017 | Executive summary
2
SHOCKS
17
16
15
OPPORTUNITY
$
!
FORECAST
State of the State 2017 | Executive summary
3
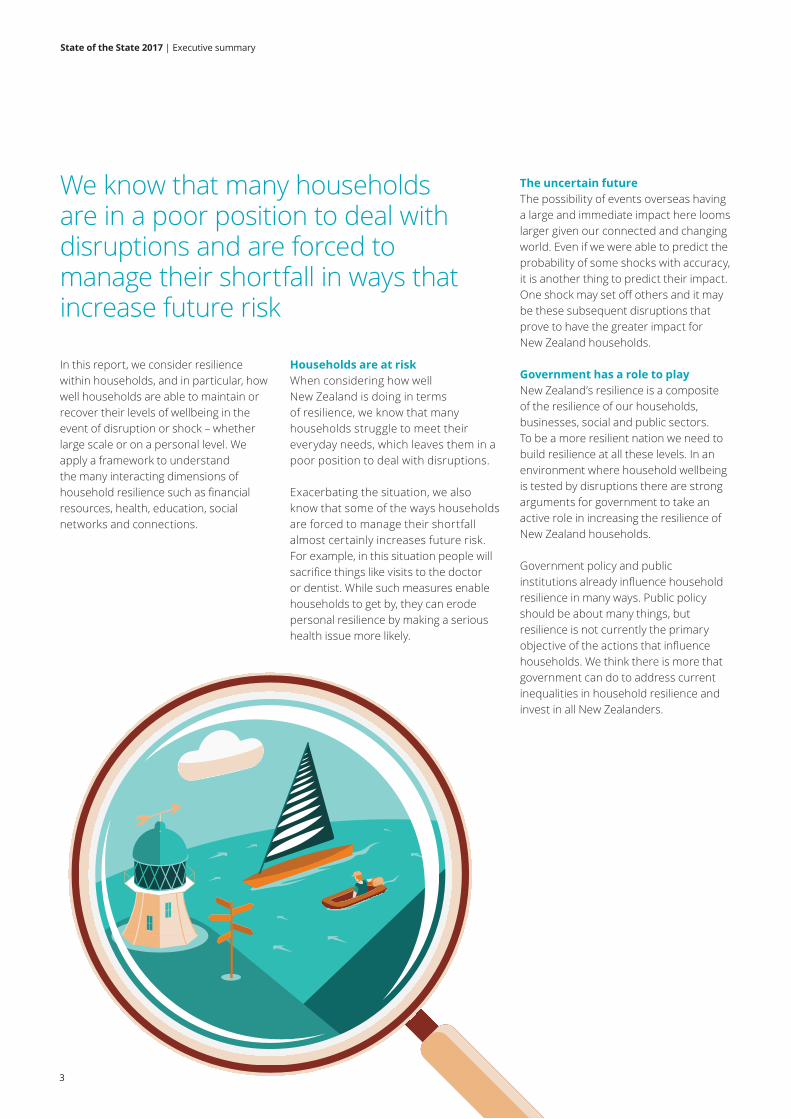
Households are at risk When considering how well New Zealand is doing in terms of resilience, we know that many households struggle to meet their everyday needs, which leaves them in a poor position to deal with disruptions.
Exacerbating the situation, we also know that some of the ways households are forced to manage their shortfall almost certainly increases future risk.For example, in this situation people will sacrifice things like visits to the doctor or dentist. While such measures enable households to get by, they can erode personal resilience by making a serious health issue more likely.
In this report, we consider resilience within households, and in particular, how well households are able to maintain or recover their levels of wellbeing in the event of disruption or shock – whether large scale or on a personal level. We apply a framework to understand the many interacting dimensions of household resilience such as financial resources, health, education, social networks and connections.
The uncertain future The possibility of events overseas having a large and immediate impact here looms larger given our connected and changing world. Even if we were able to predict the probability of some shocks with accuracy, it is another thing to predict their impact. One shock may set off others and it may be these subsequent disruptions that prove to have the greater impact for New Zealand households.
Government has a role to play New Zealand’s resilience is a composite of the resilience of our households, businesses, social and public sectors. To be a more resilient nation we need to build resilience at all these levels. In an environment where household wellbeing is tested by disruptions there are strong arguments for government to take an active role in increasing the resilience of New Zealand households.
Government policy and public institutions already influence household resilience in many ways. Public policy should be about many things, but resilience is not currently the primary objective of the actions that influence households. We think there is more that government can do to address current inequalities in household resilience and invest in all New Zealanders.
We know that many households are in a poor position to deal with disruptions and are forced to manage their shortfall in ways that increase future risk

State of the State 2017 | Executive summary
4
3. Strengthen our public institutions’ focus on resilience
We recommend government establishes a Resilience Unit within one of the central agencies with end-to-end accountability for ensuring that public institutions and policy are actively boosting resilience, from strategy and policy through to operations and coordination.
A centralised unit will be accountable for, and measured on, whole-of-system resilience. It will ensure a drive to increase resilience in one aspect of the system would not have a disproportionate impact on others. And it will provide a counterpoint to efficiency objectives that may reduce government’s ability to respond and adapt to disruption.
The Resilience Unit should have a role in identifying current and future trends, analysing the likely impact on New Zealand, and instigating change and adaptations that will put us in the best position to anticipate and respond to disruptions.
4. Engage with New Zealanders to build a wellbeing and resilience index
We recommend government engages with New Zealanders to describe the aspects of wellbeing and resilience that are important, identifies appropriate indicators to measure them, and uses these indicators to guide and evaluate policy-making and government services.
Having the right measures in place will tell us how households are doing, where we should target interventions, and enables us to evaluate the evidence for resilience and the impact of investments. We recommend that measures reflect the values of our communities and consider qualitative and quantitative measures across economic, social and cultural dimensions.
In an environment where household wellbeing is tested by disruptions, there are strong arguments for government to take an active role in increasing household resilience
We make four recommendations to boost resilience and ensure New Zealand is fit for the future
1. A resilience outcome from universal social services
We recommend government explicitly applies and evaluates resilience objectives in health, education and housing policy.
Taken together, these three areas represent government’s primary means of influencing the personal and household resilience of all New Zealanders. Explicitly targeting resilience in policy development will result in a wider – or different – set of options being considered.
2. Explore policy interventions that address income factors for household resilience
We recommend government progress interventions to address income factors for household resilience, advancing trials to build household resilience through a social investment approach and income support.
There is a group of households for which income levels and volatility are the primary barriers to their resilience. For these households, there are limitations to existing assistance, including that while they would benefit from support to build their resilience (and ensure their long-term wellbeing), they may not be eligible for targeted social assistance based on current needs.
We propose running evaluated trials applying both social investment and income approaches.

87.8%of Kiwis rated their
health as excellent, very good or good*
*The 2016 New ZealandHealth Survey
But it’s not all plain sailing
Life in New Zealand is pretty good
Luckily, there are things we can rely on – like whānau, our income, or government help – that boost our resilience
Resilienceis how secure our
wellbeing is
These shocks can erode households’ wellbeing
Global trends can also impact households
We are exposed to individual and systemic shocks – all of which are experienced at the household level
Fit for the future
Household
[Definition]
People residing together, often – but not always – as a family unit, who have shared resources and an inter-dependent standard of living
Wellbeing
[Definition]
Wellbeing is our quality of life. Kiwi values lie at the heart of our perceptions of wellbeing
Resilience
[Definition]
The ability to absorb, bounce back from or adapt to disruption without compromising wellbeing
70% of Kiwis experienced
a major change in 2014, positive and negative*
*Statistics New Zealand
97%of Kiwis have at least one family member
who can provide them with support*
*Statistics New Zealand
Kiwis rankedresilience higher than
many essential aspectsof wellbeing including
housing, income, personal safety, culture and
education**The New Zealand Treasury
5

We are only as resilient as our people, our
businesses, and our social infrastructure
How well we respond to future uncertainty relies on ensuring resilience at all of these levels, individually and together
Not all households have enough, or the right, resources to
draw upon when faced with shocks
Government already does a lot that impacts the resilience of New Zealanders
We believe there is more government can do to ensure we stay fit for the future
Predictableincome
Essentials
Disposableincome
1/9working age
New Zealanders will suffer a significant fall
in income in any given year
14% of Kiwi kids live in
households that go without seven or more
things they need*
*Child Poverty Monitor
Māori & Pasifika populations experience
a gap in tertiary education attainment compared to the general population*
*Education Counts NZ
28% of households
spend more than 30% of disposable income
on housing*
*Ministry of Social Development
Education
6

State of the State 2017
7
Ko tōku kāinga tōku tumu herenga waka, ko tōku waka ko tōku oranga, ko tōku oranga ko tōku whānau, ko taku whānau taku tokatū moana My home is the mooring for my vessel, my vessel is indeed my life force, my life force is my family, my family is my immovable object, my foundation

8
State of the State 2017 | Understanding resilient households
Understanding resilient households
Today we often hear it in community and environmental contexts such as the response to natural disasters and climate change. Resilience in these contexts is well explored and this report does not seek to add to the wealth of material available in these areas.This report considers resilience within households, as a part of the broader conversation about the role of public policy, in improving the wellbeing of New Zealanders.
In particular, we focus on how well households are able to maintain or recover their levels of wellbeing in the event of a disruption. We define household more specifically than people who live together and share facilities. Our focus is on what is sometimes called an “income-sharing unit”, or people who have shared resources and a common standard of living.
Wellbeing: a life that Kiwis value In New Zealand, Kiwi values lie at the heart of our perceptions of wellbeing. We recognise that values such as fairness, connection with our natural surroundings, whānau and community are part of what makes New Zealand one of the best places in the world to live. As a country and as individuals we value – and pride ourselves on – more than just income.
Internationally, efforts have been made to broaden how society’s wellbeing is measured beyond the traditional measure of income growth. It is widely recognised that access to clean water, a quality education, meaningful work, safe and stable housing, public safety and a secure retirement are all measures of wellbeing that are just as important as income. And economic growth alone is not always enough to ensure them.
The Global Financial Crisis (GFC) furthered this movement away from a narrow focus on income as an objective of public policy. In part, because it revealed how fragile incomes and growth were and how susceptible the world’s economies are to shocks. Furthermore, income did not give a reliable indication of how well individuals, households and national economies were able to weather major shifts in the system.1
HouseholdPeople residing together, often – but not always – as a family unit, who have shared resources and an inter-dependent standard of living
Resilience: the security of wellbeing If wellbeing is our quality of life, resilience is how secure that quality of life is.
Unexpected disruptions are a fact of life. Looking back, some of New Zealand’s biggest shocks in the last decade have come from very different quarters: the Christchurch earthquakes and the GFC. Looking ahead, trends towards a more protectionist global trading system, the changing nature of our relationship with Asia (the fastest growing economic region), the impact of technology and greater automation on jobs, and the threat of further economic turmoil are all global factors which could result in big changes for us.
In this environment, resilience is our ability to maintain or recover the wellbeing that New Zealand households value in the face of disruption. It is also, given the inevitability of shocks, how well we can react positively to changing circumstances.
The evidence actually suggests that New Zealanders put a lot of emphasis on resilience. The New Zealand Treasury’s survey into what aspects of wellbeing Kiwis value showed that resilience was the second most important quality for individuals, behind good health.2
Resilience is the ability of an eco-system to either absorb or bounce back from a disruption.
ResilienceThe ability of New Zealand households to absorb, bounce back from, or adapt to disruption without compromising their long term wellbeing
State of the State 2017 | Understanding resilient households
9
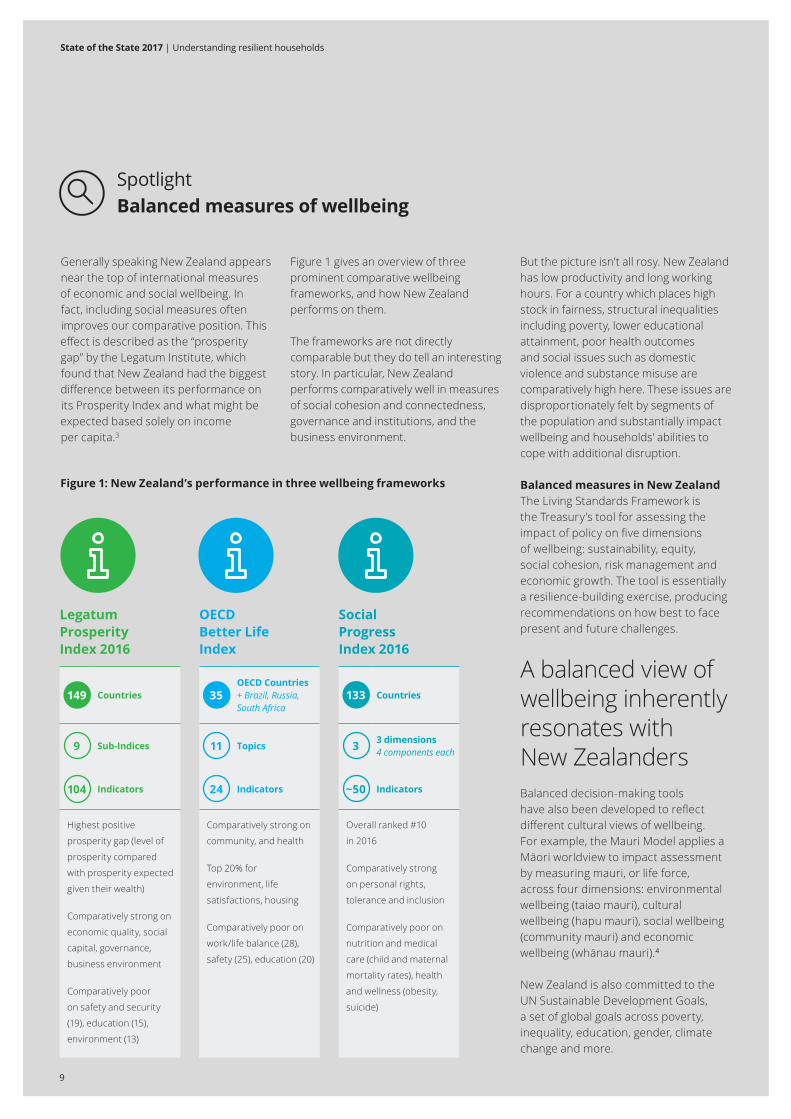
Legatum Prosperity Index 2016
OECD Better Life Index
Social Progress Index 2016
149 Countries 35OECD Countries+ Brazil, Russia, South Africa
133 Countries
9 Sub-Indices 11 Topics 3 3 dimensions 4 components each
104 Indicators 24 Indicators ~50 Indicators
Highest positive
prosperity gap (level of
prosperity compared
with prosperity expected
given their wealth)
Comparatively strong on
economic quality, social
capital, governance,
business environment
Comparatively poor
on safety and security
(19), education (15),
environment (13)
Comparatively strong on
community, and health
Top 20% for
environment, life
satisfactions, housing
Comparatively poor on
work/life balance (28),
safety (25), education (20)
Overall ranked #10
in 2016
Comparatively strong
on personal rights,
tolerance and inclusion
Comparatively poor on
nutrition and medical
care (child and maternal
mortality rates), health
and wellness (obesity,
suicide)
Figure 1: New Zealand’s performance in three wellbeing frameworks
Spotlight Balanced measures of wellbeing
But the picture isn’t all rosy. New Zealand has low productivity and long working hours. For a country which places high stock in fairness, structural inequalities including poverty, lower educational attainment, poor health outcomes and social issues such as domestic violence and substance misuse are comparatively high here. These issues are disproportionately felt by segments of the population and substantially impact wellbeing and households’ abilities to cope with additional disruption.
Balanced measures in New Zealand The Living Standards Framework is the Treasury’s tool for assessing the impact of policy on five dimensions of wellbeing: sustainability, equity, social cohesion, risk management and economic growth. The tool is essentially a resilience-building exercise, producing recommendations on how best to face present and future challenges.
A balanced view of wellbeing inherently resonates with New Zealanders Balanced decision-making tools have also been developed to reflect different cultural views of wellbeing. For example, the Mauri Model applies a Māori worldview to impact assessment by measuring mauri, or life force, across four dimensions: environmental wellbeing (taiao mauri), cultural wellbeing (hapu mauri), social wellbeing (community mauri) and economic wellbeing (whānau mauri).4
New Zealand is also committed to the UN Sustainable Development Goals, a set of global goals across poverty, inequality, education, gender, climate change and more.
Generally speaking New Zealand appears near the top of international measures of economic and social wellbeing. In fact, including social measures often improves our comparative position. This effect is described as the “prosperity gap” by the Legatum Institute, which found that New Zealand had the biggest difference between its performance on its Prosperity Index and what might be expected based solely on income per capita.3
Figure 1 gives an overview of three prominent comparative wellbeing frameworks, and how New Zealand performs on them.
The frameworks are not directly comparable but they do tell an interesting story. In particular, New Zealand performs comparatively well in measures of social cohesion and connectedness, governance and institutions, and the business environment.
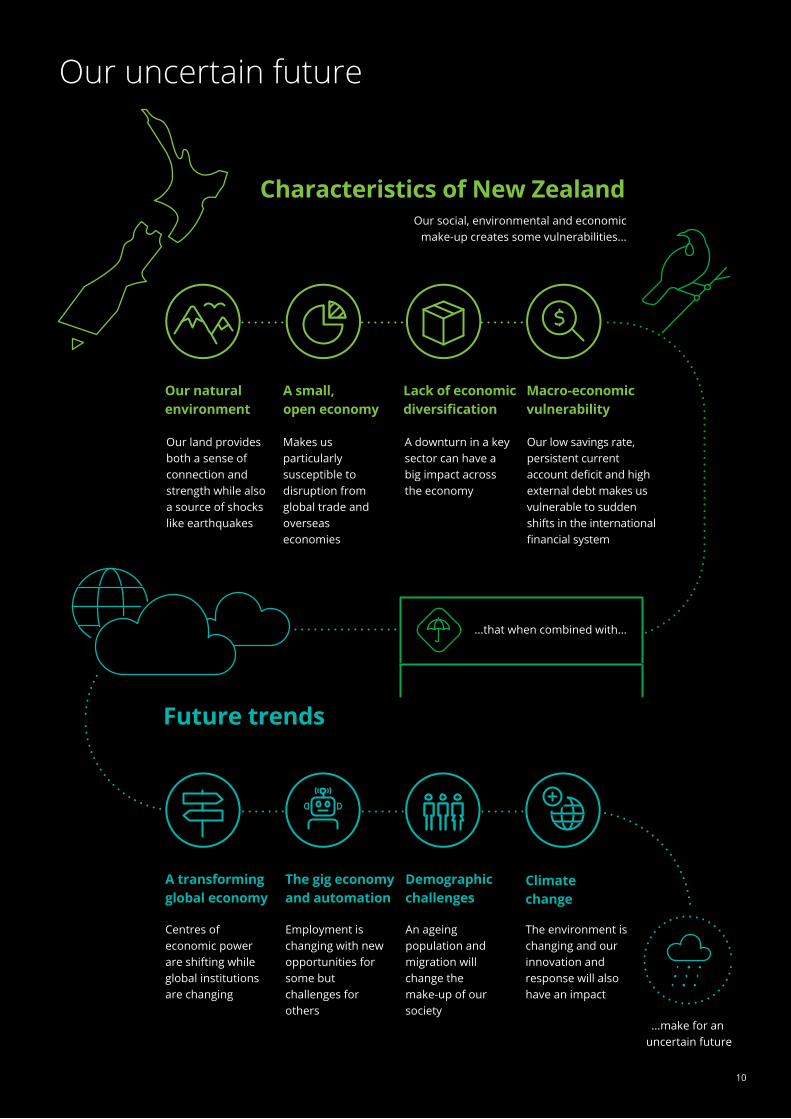
Our uncertain future
Characteristics of New Zealand
Future trends
Centres of economic power are shifting while global institutions are changing
Our natural environment
A small, open economy
Our land provides both a sense of connection and strength while also a source of shocks like earthquakes
Makes us particularly susceptible to disruption from global trade and overseas economies
Lack of economic diversification
A downturn in a key sector can have a big impact across the economy
Macro-economic vulnerability
Our low savings rate, persistent current account deficit and high external debt makes us vulnerable to sudden shifts in the international financial system
A transforming global economy
Employment is changing with new opportunities for some but challenges for others
The gig economy and automation
An ageing population and migration will change the make-up of our society
Demographic challenges
The environment is changing and our innovation and response will also have an impact
Climatechange
Our social, environmental and economic make-up creates some vulnerabilities...
...make for an uncertain future
...that when combined with...
10

State of the State 2017 | Understanding resilient households
11
National and systemic events Ultimately, the adequacy of our sources of resilience will depend on the nature of the shock that we face.
On page 10, we highlight some of the unique characteristics of New Zealand and some of the global trends which may shape our future. This gives us some pointers to the types of systemic shocks we might expect. Anticipating and assessing these risks will shape our decisions on where we should invest for the future.5
Figure 2 shows a risk assessment, as viewed by officials from the Department of the Prime Minister and Cabinet (DPMC), of New Zealand’s most likely system-level shocks mapped according to probability and perceived impact.*
All shocks are household shocks Given our recent history, it is natural for these sort of large, systemic events to be at the forefront of our minds when considering resilience. However, if our focus is on enhancing the wellbeing of New Zealanders, we should in fact be concerned with shocks of any scale that threaten that wellbeing.
In any given year, New Zealanders will suffer economic loss, health problems, or adverse changes in the lives of those closest to them. Findings from Statistics New Zealand’s 2014 General Social Survey found that almost 70% of all New Zealanders had experienced a major change in the previous 12 months, both positive and negative.
From a wellbeing perspective, these events can have as great an impact as any national-level or systemic shocks.
Figure 2: National Risk Matrix; DPMC6
Relative Consequences
Ann
ual L
ikel
ihoo
d
Minor Moderate Major Catastrophic
Social Other Technological ConflictBiological MeteorologicalGeophysical
Cyber attacksdata
confidentiality
Severeweather
Large flood
Cyber attacksinfrastructure
Globalconflict
Sustained drought
Terrorism
Globalfinancial crisis
Largeurban flood
Very largetsunami
Systemicfailure
Very largeeruption
Asia interstateconflict
Major transportaccident
Major infrastructurefailure
Large urban earthquake
Human pandemic
Aucklanderuption
FailedPacificstate
Food safety
Sustained volcanicash eruption
Major pest / diseaseoutbreak
Moderateearthquake
Sovereignty threat to NZ
0.1%
1%
10%
0.01%
100%
*The vertical axis is logarithmic, so that each measured point increases by a factor of 10. The difference between a once a year event and once a decade event is depicted as the same as that between a once a century and once a millennium event.
12
State of the State 2017 | Understanding resilient households
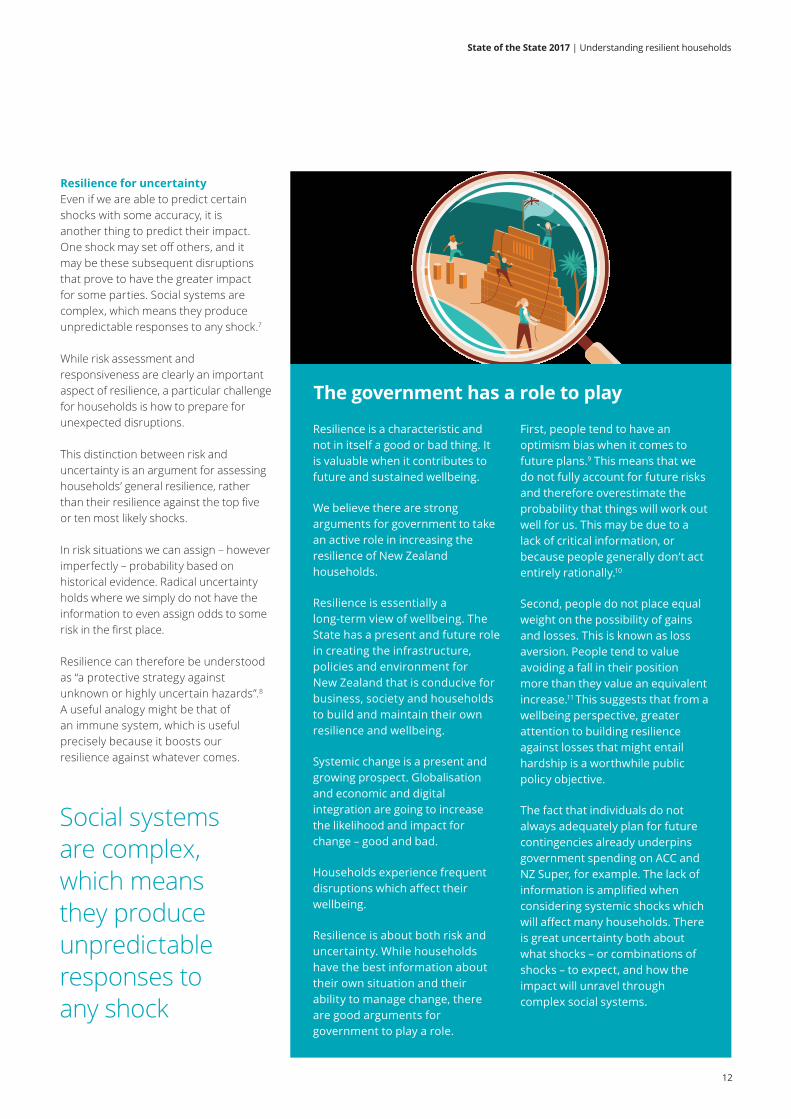
Resilience for uncertainty Even if we are able to predict certain shocks with some accuracy, it is another thing to predict their impact. One shock may set off others, and it may be these subsequent disruptions that prove to have the greater impact for some parties. Social systems are complex, which means they produce unpredictable responses to any shock.7
While risk assessment and responsiveness are clearly an important aspect of resilience, a particular challenge for households is how to prepare for unexpected disruptions.
This distinction between risk and uncertainty is an argument for assessing households’ general resilience, rather than their resilience against the top five or ten most likely shocks.
In risk situations we can assign – however imperfectly – probability based on historical evidence. Radical uncertainty holds where we simply do not have the information to even assign odds to some risk in the first place.
Resilience can therefore be understood as “a protective strategy against unknown or highly uncertain hazards”.8 A useful analogy might be that of an immune system, which is useful precisely because it boosts our resilience against whatever comes.
Social systems are complex, which means they produce unpredictable responses to any shock
Resilience is a characteristic and not in itself a good or bad thing. It is valuable when it contributes to future and sustained wellbeing.
We believe there are strong arguments for government to take an active role in increasing the resilience of New Zealand households.
Resilience is essentially a long-term view of wellbeing. The State has a present and future role in creating the infrastructure, policies and environment for New Zealand that is conducive for business, society and households to build and maintain their own resilience and wellbeing.
Systemic change is a present and growing prospect. Globalisation and economic and digital integration are going to increase the likelihood and impact for change – good and bad.
Households experience frequent disruptions which affect their wellbeing.
Resilience is about both risk and uncertainty. While households have the best information about their own situation and their ability to manage change, there are good arguments for government to play a role.
First, people tend to have an optimism bias when it comes to future plans.9 This means that we do not fully account for future risks and therefore overestimate the probability that things will work out well for us. This may be due to a lack of critical information, or because people generally don’t act entirely rationally.10
Second, people do not place equal weight on the possibility of gains and losses. This is known as loss aversion. People tend to value avoiding a fall in their position more than they value an equivalent increase.11 This suggests that from a wellbeing perspective, greater attention to building resilience against losses that might entail hardship is a worthwhile public policy objective.
The fact that individuals do not always adequately plan for future contingencies already underpins government spending on ACC and NZ Super, for example. The lack of information is amplified when considering systemic shocks which will affect many households. There is great uncertainty both about what shocks – or combinations of shocks – to expect, and how the impact will unravel through complex social systems.
The government has a role to play
FORECAST
FORECAST
Figure 2: National Risk Matrix; DPMC6
Relative Consequences
Ann
ual L
ikel
ihoo
d
Minor Moderate Major Catastrophic
Social Other Technological ConflictBiological MeteorologicalGeophysical
Cyber attacksdata
confidentiality
Severeweather
Large flood
Cyber attacksinfrastructure
Globalconflict
Sustained drought
Terrorism
Globalfinancial crisis
Largeurban flood
Very largetsunami
Systemicfailure
Very largeeruption
Asia interstateconflict
Major transportaccident
Major infrastructurefailure
Large urban earthquake
Human pandemic
Aucklanderuption
FailedPacificstate
Food safety
Sustained volcanicash eruption
Major pest / diseaseoutbreak
Moderateearthquake
Sovereignty threat to NZ
0.1%
1%
10%
0.01%
100%

Dimensions of resilience
Whānau & support networks
Financialresources
Employment
Personal resilience
Government
Social &cultural capital
Public institutions
When faced with an unexpected challenge, whether economic, social or environmental, all households have a variety of potential resources to call upon in order to manage it.
A framework for assessing household resilience
To assess the resilience of households to shocks we need to consider all of these dimensions together, and understand how they interact with one another.
13

State of the State 2017 | A framework for assessing household resilience
14
Financial resources
Immediate financial resources in the form of income, savings, assets and credit lines, provide individuals with a buffer against disruption. Even shocks of a non-financial origin will also entail economic loss – for instance where an illness leads to an inability to work.
Whānau and support networks
Whānau and support networks provide social and practical support for individuals and households. Whanaungatanga, or strong reciprocal relations and a sense of connection, is a source of resilience and a safety net in times of need. Relatively small forms of assistance – a grandparent helping with childcare, a neighbour to share a ride with when a car breaks down – can all help with household disruptions.
Personal resilience
Personal resilience of individuals in the household is the starting point for household resilience. Beyond personal characteristics that mean people will deal with the same situation differently (for example, whether someone is risk averse and how they plan),12 we look at two specific aspects of personal resilience: health (mental and physical), and human capital.
Health, in particular mental health, influences how well individuals deal with the stress, change and uncertainty that accompanies disruption. Human capital, or our skills and competencies, contributes to resilience through higher incomes. Education also has some less obvious effects on resilience, such as greater social mobility, better outcomes for children and greater social cohesion.13
A framework for assessing household resilience
Relatively small forms of assistance – a grandparent helping with childcare, a neighbour to share a ride with when a car breaks down – can all help with household disruptions
State of the State 2017 | A framework for assessing household resilience
15
Employment
Business plays many roles in New Zealand's resilience. The risks businesses are exposed to – and how well they manage them – as well as how they innovate and contribute to GDP growth and development all affect the economic conditions in which households operate. For households, businesses predominantly contribute to resilience as employers.
Social and cultural capital provides support for individuals and communities in good times and in bad. Cultural connection, including connection to history, language and stories, was identified by several interviewees as a core aspect of personal, whānau and community resilience. Examples of social networks as a source of resilience in the face of disruption include iwi or marae-led housing, the Student Volunteer Army and social enterprises like Eat My Lunch.
Government
Government traditionally provides a social safety net and investment in public goods. Social welfare is usually conditional on particular categories of need (disability, low income, health) and therefore rigid in a way that other aspects of resilience are not. This is balanced by universal investments in areas such as health and education. This system balances various policy objectives and considerations – not the least of which is the resilience of government finances. Government also plays a key role in mitigating system-level shocks through macroeconomic policy including financial regulation, trade policy, investment in infrastructure and the exercise of monetary and fiscal policy.
Another important aspect is the resilience of government organisations themselves. Systemic shocks can affect the state just as much as they can the private sector and the continued ability for government agencies to meet the needs of citizens is hugely important.
Public institutions
Finally, our public institutions, the rules and norms underpinning the structure of society, are also a source of resilience. It has been argued that societies with greater political participation have been found to be better at adjusting to shocks.14
Institutions are subject to systemic shocks just as households are. Their ability to continue to deliver their core functions and provide certainty to households during disruption – for example through the rule of law and property rights – underpins the whole system of resilience. How well they can promote forward-looking decision-making and adapt to change, including anticipating what problems society may face in the future, will influence how well and how quickly households themselves adapt.
Social and cultural capital
It has been argued that societies with greater political participation are better at adjusting to shocks

State of the State 2017 | A framework for assessing household resilience
16
Understanding resilience this way – as a set of inter-related dimensions – brings into focus several considerations for government action The system is only as resilient as its constituent parts. New Zealand’s resilience is a composite of the resilience of its households (and the individuals in them), its businesses and its public sector. A more resilient New Zealand requires that we are resilient in each of these dimensions.
Some households have more than others. Households are not experiencing equal starting points in health (both physical and mental), education, social networks and connections. And certainly not in financial resources.
Some of these factors can be exhausted, such as income. For others, there are limitations and trade-offs. For example, there are only so many hours we can work in a week, and devoting more time to work may lead to higher stress levels or less time to invest in social sources of resilience such as family relations.
During the course of this research, we heard evidence of the social costs associated with financial stress in particular – including increased rates of relationship break-ups, domestic violence and other social ills.
This is a good reminder that assessing how well a household copes with a shock is difficult to quantify. For example, a household may not lose their home, but the cost of that episode on other dimensions of life can be immeasurable.
The upshot is that improving systemic resilience may have the effect of shifting risk from one part of the system to another, which may be less well placed to bear that risk. For example, a focus on income might come at the expense of health and social factors, or a focus on public debt might be at the expense of households that rely on particular public services.
Different sources of resilience may be more or less effective in the face of different shocks. And they can be exhausted. Systemic shocks may overwhelm resources, for example a disruption affecting a regional community will call on the same social and community networks.
Managing resilience as a whole
State of the State 2017 | Resilience in New Zealand
17
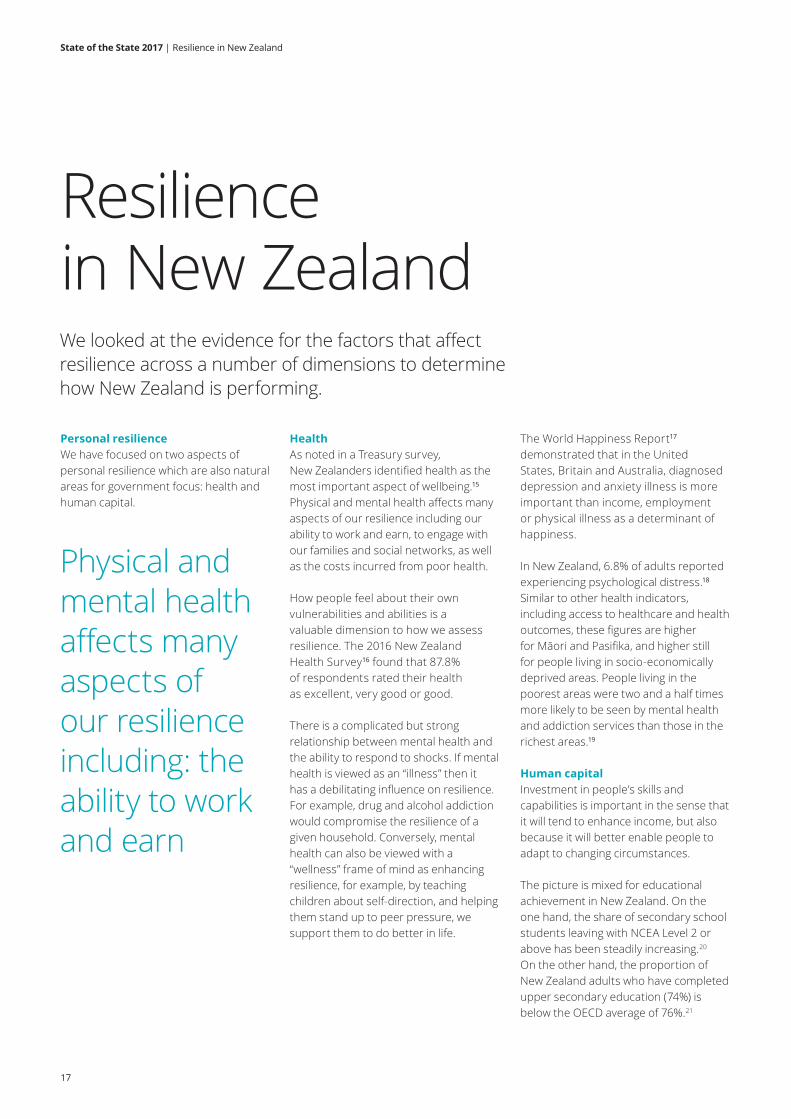
Resilience in New ZealandWe looked at the evidence for the factors that affect resilience across a number of dimensions to determine how New Zealand is performing.
Personal resilience We have focused on two aspects of personal resilience which are also natural areas for government focus: health and human capital.
Health As noted in a Treasury survey, New Zealanders identified health as the most important aspect of wellbeing.15 Physical and mental health affects many aspects of our resilience including our ability to work and earn, to engage with our families and social networks, as well as the costs incurred from poor health.
How people feel about their own vulnerabilities and abilities is a valuable dimension to how we assess resilience. The 2016 New Zealand Health Survey16 found that 87.8% of respondents rated their health as excellent, very good or good.
There is a complicated but strong relationship between mental health and the ability to respond to shocks. If mental health is viewed as an “illness” then it has a debilitating influence on resilience. For example, drug and alcohol addiction would compromise the resilience of a given household. Conversely, mental health can also be viewed with a “wellness” frame of mind as enhancing resilience, for example, by teaching children about self-direction, and helping them stand up to peer pressure, we support them to do better in life.
The World Happiness Report17 demonstrated that in the United States, Britain and Australia, diagnosed depression and anxiety illness is more important than income, employment or physical illness as a determinant of happiness.
In New Zealand, 6.8% of adults reported experiencing psychological distress.18 Similar to other health indicators, including access to healthcare and health outcomes, these figures are higher for Māori and Pasifika, and higher still for people living in socio-economically deprived areas. People living in the poorest areas were two and a half times more likely to be seen by mental health and addiction services than those in the richest areas.19
Human capital Investment in people’s skills and capabilities is important in the sense that it will tend to enhance income, but also because it will better enable people to adapt to changing circumstances.
The picture is mixed for educational achievement in New Zealand. On the one hand, the share of secondary school students leaving with NCEA Level 2 or above has been steadily increasing.20 On the other hand, the proportion of New Zealand adults who have completed upper secondary education (74%) is below the OECD average of 76%.21
Physical and mental health affects many aspects of our resilience including: the ability to work and earn

State of the State 2017 | Resilience in New Zealand
18
Figure 3: Cumulative inflation for selected household groupsHousehold living-costs price index, Quarterly, June 2008 – September 201627
SuperannuitantLowest expenditure group
Beneficiary
MāoriAll–households
Highest expenditure group
Statistics New Zealand
2008 2009 2010 2011 2012 2013 2014 2015 2016
15
20
10
5
0
Perc
enta
ge
And while New Zealand’s comparative test scores under the Programme for International Student Assessment (PISA) remain above OECD averages, our 2016 results were the lowest scores since testing began in 2000.22 At the tertiary level, participation has been declining since 2005, falling from 13.5% to 10.2% in 2014.23
Equality of educational attainment is also a stubborn issue for New Zealand. Socio-economic background remains highly correlated with educational attainment, with lower decile schools seeing much lower rates of school leavers reaching NCEA Level 2 or equivalent.24 In tertiary education, Māori and Pasifika populations experience a persistent gap in tertiary education compared to the general population.25
Beyond education levels there is a question around whether we have the right mix of skills for a changing future. Many of those we interviewed expressed concerns around the potential impact of technology as a substitution for employees, which would undermine the previous investments people have made in their skills and education.
Financial resources As each generation of New Zealanders has enjoyed higher incomes relative to their parents, the general trend ought to be that in this aspect we are becoming more resilient over time.
For resilience, we are particularly interested in two aspects. What the buffer is between income and costs (particularly non-discretionary costs), which represents a household’s ability to respond financially to a disruption. And how consistent income is (income volatility), which influences how reliable the buffer is at any given time and is critical for effective planning.
Inequality of income buffers On average, real incomes – that is taking consideration of inflation – have risen in New Zealand by 31% between 1982 and 2015.26
However, Figure 3 shows that when we look behind the averages at the household experience of cost rises, certain groups – including the lowest expenditure group – of New Zealand households are experiencing cumulative inflation greater than the average. Inflation is actually lowest for the highest expenditure households.

State of the State 2017 | Resilience in New Zealand
19
+50%
0
-50%
2006 2007 2008 2009 2010 2011 2012 2013 2014 2015 2016
Early childhood education (ECE) (-12%)
Actual rentals for housing (+25%)
Education (excl. ECE) (+53%)
Healthcare (+30%)
Cellphones (-90%)
AV & computing equipment (-74%)
Home ownership (+52%)
Figure 4: Divergence in selected CPI Components June quarter 2006 to December quarter 2016
Statistics New Zealand
Overall inflationQ2 2006–Q4 2016: (+21%)
A reason for this is the price changes of the components that make up what households are spending on. Figure 4 shows that inflation over the period of 2006 to 2016 totalled 21% on the Consumer Price Index. However, necessities, such as health, housing and education are “dragging up” inflation, while luxuries, particularly electronics, have kept the overall rate down.28
By their very nature, these necessities are difficult for households to substitute or avoid altogether and to do so would have an impact on immediate and future wellbeing. They are also likely to make up a larger proportion of spending for lower income groups.
The trend for early childhood education is an interesting illustration of the effects of government policy. Costs plummeted following the introduction of 20 hours government-funded care per week in 2007. However, increased costs since that point (+31%) have eaten into those gains considerably. Costs have also risen for both primary and secondary education (+58%) and tertiary and other post-school education (+48%).
Looking at the impact of just one of these necessities brings the disparity between households into focus. Ministry of Social Development figures show that the share of New Zealand households paying in excess of 30% of disposable income on housing has increased from 11% to 28% between 1988 and 2015.29 This increase was strongly concentrated in the lower and middle income groups.*
*From 16% to 43% for the lowest 20% of income earners; from 13% to 27% for the next 20%; and from 10% to 30% for the median 20%.

State of the State 2017 | Resilience in New Zealand
20
+50%
0
-50%
2006 2007 2008 2009 2010 2011 2012 2013 2014 2015 2016
Early childhood education (ECE) (-12%)
Actual rentals for housing (+25%)
Education (excl. ECE) (+53%)
Healthcare (+30%)
Cellphones (-90%)
AV & computing equipment (-74%)
Home ownership (+52%)
Figure 4: Divergence in selected CPI Components June quarter 2006 to December quarter 2016
Statistics New Zealand
Overall inflationQ2 2006–Q4 2016: (+21%)
60
50
40
30
20
10
0
Ministry of Social Development
Hou
sing
cos
ts a
s a
% o
f inc
ome
1985 1990 1995 2000 2005 2010 2015
Figure 5: Housing costs as a percentage of income by income quintile
(D2)
Q1
Q1: Lowest income quintile (20%)
D2: second to bottom income decile (10%)
Q2
Q3
Q4
Q5
As Figure 5 shows, the share of disposable income going to housing costs is now in excess of 50% for the average household in the bottom 20% for income.30
As a result, when we look at changes in income after housing costs we see that while the median New Zealand household has experienced an increase in disposable income of 32%, it hasn’t grown at all for the bottom 10% of New Zealand households. In fact, they had a slightly higher real income in 1982 than they did in 2015 ($11,256 vs $11,200), while households at the 90th percentile have experienced growth of 62%.31
Income volatility An unexpected decline in income relative to expenses tests the resilience of households as much as an unexpected bill. Unpredictable income also lowers resilience by impairing a household’s ability to plan and make long-term investments.
Income volatility is a growing area of international research, with many United States studies finding that the share of households experiencing a fall in income year-to-year has increased markedly since the 1970s.32 One study noted that for all the recent attention on income inequality, the instability of incomes had actually risen faster.33
To get an idea of the degree of volatility of New Zealanders’ incomes we looked at Statistics New Zealand data on the share of the population who fell two or more income deciles from one year to the next between 2000 and 2014.*
As an example, this would be someone in the top 10% of income earners one year whose income fell to somewhere in the bottom 80% in the second year, or someone in decile 5 (between 40% and 50% points of the income distribution) who fell into the bottom three deciles (the lowest 30%).
*For a fuller discussion on the data and methodology see the Income Volatility Methodology Paper available to download at https://www2.deloitte.com/nz/en/pages/public-sector/articles/the-state-of-the-state-2017.html.
State of the State 2017 | Resilience in New Zealand
21
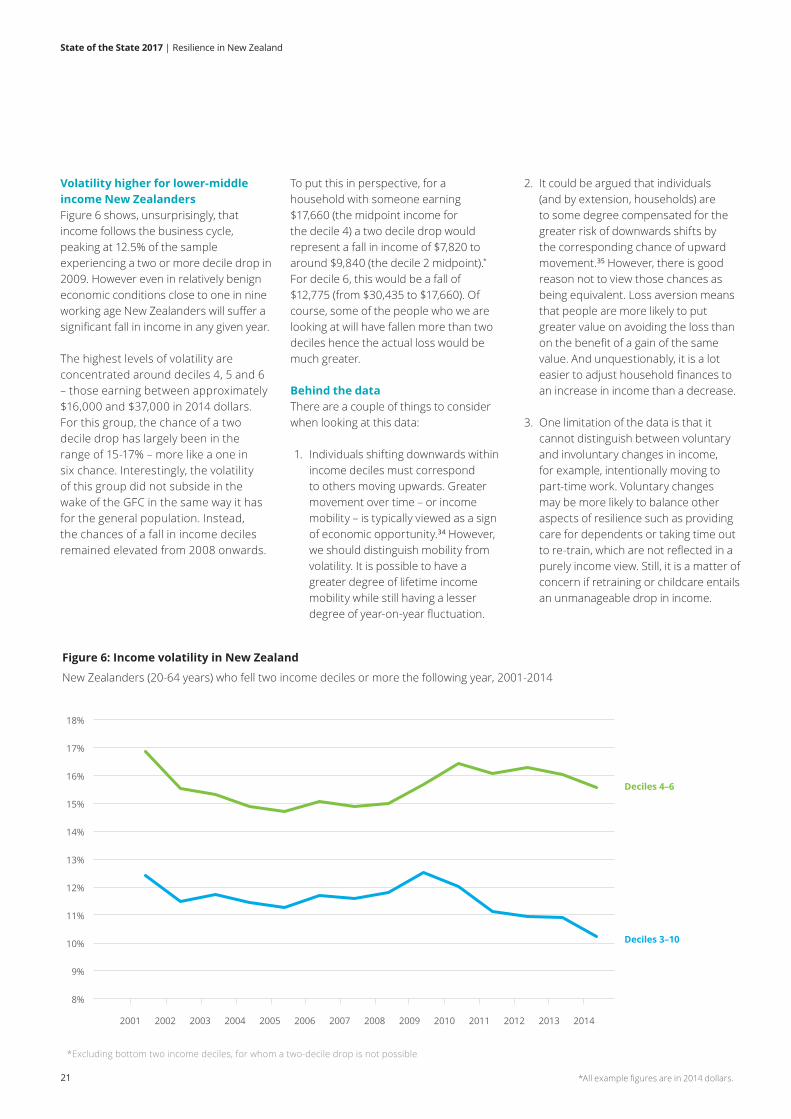
Volatility higher for lower-middle income New Zealanders Figure 6 shows, unsurprisingly, that income follows the business cycle, peaking at 12.5% of the sample experiencing a two or more decile drop in 2009. However even in relatively benign economic conditions close to one in nine working age New Zealanders will suffer a significant fall in income in any given year.
The highest levels of volatility are concentrated around deciles 4, 5 and 6 – those earning between approximately $16,000 and $37,000 in 2014 dollars. For this group, the chance of a two decile drop has largely been in the range of 15-17% – more like a one in six chance. Interestingly, the volatility of this group did not subside in the wake of the GFC in the same way it has for the general population. Instead, the chances of a fall in income deciles remained elevated from 2008 onwards.
2. It could be argued that individuals (and by extension, households) are to some degree compensated for the greater risk of downwards shifts by the corresponding chance of upward movement.35 However, there is good reason not to view those chances as being equivalent. Loss aversion means that people are more likely to put greater value on avoiding the loss than on the benefit of a gain of the same value. And unquestionably, it is a lot easier to adjust household finances to an increase in income than a decrease.
3. One limitation of the data is that it cannot distinguish between voluntary and involuntary changes in income, for example, intentionally moving to part-time work. Voluntary changes may be more likely to balance other aspects of resilience such as providing care for dependents or taking time out to re-train, which are not reflected in a purely income view. Still, it is a matter of concern if retraining or childcare entails an unmanageable drop in income.
To put this in perspective, for a household with someone earning $17,660 (the midpoint income for the decile 4) a two decile drop would represent a fall in income of $7,820 to around $9,840 (the decile 2 midpoint).* For decile 6, this would be a fall of $12,775 (from $30,435 to $17,660). Of course, some of the people who we are looking at will have fallen more than two deciles hence the actual loss would be much greater.
Behind the data There are a couple of things to consider when looking at this data:
1. Individuals shifting downwards within income deciles must correspond to others moving upwards. Greater movement over time – or income mobility – is typically viewed as a sign of economic opportunity.34 However, we should distinguish mobility from volatility. It is possible to have a greater degree of lifetime income mobility while still having a lesser degree of year-on-year fluctuation.
Figure 6: Income volatility in New Zealand
New Zealanders (20-64 years) who fell two income deciles or more the following year, 2001-2014
*Excluding bottom two income deciles, for whom a two-decile drop is not possible
8%
9%
10%
11%
12%
13%
14%
15%
16%
17%
18%
2001 2002 2003 2004 2005 2006 2007 2008 2009 2010 2011 2012 2013 2014
Deciles 3–10
Deciles 4–6
*All example figures are in 2014 dollars.

State of the State 2017 | Resilience in New Zealand
22
It is not surprising that many households are in a poor position to deal with disruptions.
Forty percent of respondents to the Household Economic Survey for the year ending in June 2015 said that their income was not enough, or only just enough, to meet their everyday needs.40
Nineteen percent of respondents in the Ministry of Social Development’s assessment of material hardship for New Zealand children reported they could not pay an unexpected $500 bill within a month without borrowing.41
Exacerbating the situation, we know that some of the ways households are forced to manage shortages almost certainly increase future risk. The scarcity mind-set means that we focus on the present scarcity and take decisions that put our future wellbeing at risk.42
For instance 12% of respondents said that they could not afford home contents insurance, meaning that damage or theft of their possessions would be a more catastrophic event. As a result of having to pay for other essentials, 10% reported that they put up with feeling cold to save on heating costs, while 11% postponed a visit to the doctor and 26% postponed a visit to the dentist. Such measures enable households to get by, but they erode personal resilience by making a serious health issue more likely (with flow-on effects to income loss and so forth).43
Therefore, low- and middle-income New Zealanders are most likely to have worse wellbeing outcomes and be more vulnerable to disruptions.
Cash and credit Households facing unexpected financial expenses are likely to first turn to their savings, or otherwise look to cover the shortfall through debt. Households’ ability to ‘smooth’ fluctuations in this way is also unequal. In terms of savings, the poorest 40% of New Zealanders have less than $3,100 in cash on average.36
As of November 2016, household debt was at 165% of income, surpassing its previous peak in June 2009. As in many advanced countries this has built up in the last few decades, increasing steadily since the late-1980s when the level was closer to 50%.37 For the bottom 10% of New Zealanders in particular, the assets they have on average (mainly home equity and household chattels) are often dwarfed by mortgage liabilities, bank loans, overdrafts and credit card debt.38
It is important to keep this increase in household debt to income in context. With the official cash rate currently at an all-time low of 1.75% (as at March 2017), debt servicing costs are at 8.4% of disposable income. This is well down from the pre-GFC peak of 14% in 2008.39 However, debt repayment obligations reduce discretionary income and do not go away when a shock disrupts a household’s ability to repay. Therefore, for resilience debt, it is both a useful tool and a potential vulnerability.
There are households with very little financial resilience
Low- and middle-income New Zealanders are most likely to be more vulnerable to shocks and disruptions
$

State of the State 2017
23
Much has been written about the unaffordability of housing in New Zealand. Our analysis does not seek to set out the causes of this situation or propose specific fixes. We are instead focused on the twin roles that housing plays in the resilience of New Zealand households.
In our interviews, the importance of having a safe, secure and warm home was a common theme. Interviewees talked about the positive impact that not having to move schools or doctors has on children, of the importance of good housing on health, and of the social benefits of having a safe place to go home to and a connection to the wider community. This is true for both renters and home owners.
But home ownership in and of itself is a major resilience factor for households, acting as a private safety net for many New Zealanders; a source of wealth and a key component of many people’s retirement plans.44 The idea of housing as an investment, not just a place to live, has a number of impacts on household and national resilience.
Some households are putting themselves at greater risk to own a home. Around 87% of New Zealand’s debt is mortgage-related, with the remainder divided between consumer debt and student loans.45 Those who have high levels of debt relative to income will find it harder to make repayments in the event of a shock or a rise in interest rates. They will also be more at risk of negative equity wiping out investments in the event of a fall in house prices.
Some households are getting shut out of ownership altogether. Home ownership has fallen dramatically in the last generation, from 75% in the early 1990s to below 65%. Not only are these households deprived of a house as a resilience asset, but the long-term rental market suffers issues such as the lack of security of tenure, an inadequate stock of social housing and the low quality of some rental properties.46
Taken together, we are seeing an overall transfer of resilience from some households to others. Those unable, or taking on high levels of debt, to buy a house are experiencing a reduction in resilience. These households are predominantly younger, Māori and Pasifika.47 Those who have been able to buy a house prior to price rises will be in a better position to ride out shocks as a result of rising real estate prices. And these households are predominantly older or have access to other forms of support – particularly parents and family.48
The cost of housing is one of the biggest national issues New Zealand faces and the reasons are complex. Government interventions have approached this issue from a number of directions. For example, the Reserve Bank’s loan-to-value ratio restrictions (though principally targeting the resilience of the banking sector) have had the effect of building resilience among home buyers by reducing the number of highly-leveraged mortgages. And the Social Housing Reform Programme has multiple objectives, including increasing overall housing supply – particularly social and affordable housing.
Rising house prices are a major driver of New Zealand’s aggregate net wealth, and taxation settings continue to contribute to property being a favourable investment for New Zealanders.49 As a result, housing continues to be a source of inequality for New Zealanders.
$390,000 average mortgage for a first home buyer in 201651
-32% fall in share of Maori population living in a home owned by the household between 1991 and 201353
-38% fall in share of Pasifika population living in a home owned by the household between 1991 and 201354
35% of disposable income. Estimated debt servicing ratio for recent home-buyers55
45-50% of income. Estimated debt servicing ratio for Auckland home-buyers56
$750 billion has been added to the value of New Zealand’s housing stock since 200250
8.2% average increase in house prices above rate of inflation, 2002-201652
Spotlight The home: the bastion of Kiwi resilience
Key housing facts
State of the State 2017 | Resilience in New Zealand
24
Whānau and support networks In 2015, Statistics New Zealand found that nearly all adults (97%) had at least one family member who provided them with support. Nearly half of those (46%) had five or more supportive family members. A study of Māori wellbeing showed that whānau relationships are particularly important to Māori and their sense of wellbeing.57
Some households have less family resilience. Single parents and those not living in a family nucleus were much less likely to have large family support networks.58
And there are households which experience social factors that have been shown to be risk factors for wellbeing and resilience. Issues such as family violence, alcohol and substance misuse are difficult to measure but are areas of major focus for New Zealand. For example, Child Youth and Family received 150,905 notifications from agencies or the public with concerns about the safety and treatment of children in 2015, a figure which has been relatively steady since 2011.59
Employment Stable employment contributes to resilience by providing households with security and predictability in meeting their basic needs. New Zealand has performed relatively well on this front in recent years. The ability to bounce back from the GFC, and avoid the levels of unemployment seen particularly in the Eurozone countries, is evidence that New Zealand is more resilient to global economic shocks than many others in the OECD.
One corollary to this good performance on employment growth has been poor productivity growth. New Zealand’s GDP per capita lags behind the OECD average by around 20%,60 and since 1990 increases in New Zealand’s per capita incomes have largely come from increased hours worked rather than increased output per hour.61 Higher productivity would contribute to a more resilient system in its own right. However, the fact that income growth has been occurring largely as a result of higher hours worked may mean that this is coming at the expense of other aspects of resilience, for instance, by contributing to higher levels of stress or reducing time spent at leisure or building social connections.62
Although the gig economy, that includes companies such as Uber or AirBnB, has not had the same impact here as it has overseas, it brings with it pros and cons for household resilience. The opportunity for flexible income with low barriers to participation may offer households extra income in a time of need, or even an alternative to unemployment.
However the fact that these forms of employment lack the protections of a traditional employment relationship such as annual leave, sick leave or protections against unjustified dismissal deprives households of important factors for household resilience. These models of work have also been associated with greater use of payday loans, credit cards and pawn shops.63
New Zealand has already experienced a notable transformation in the nature of work. From 1985 to 2000, the share of part-time workers increased from around 17% of all workers to over 23% and has remained in the low-20s ever since. Combined with temporary and self-employed workers, non-standard employment accounts for a third of the working population.64
The gig economy brings with it pros and cons for household resilience
State of the State 2017
25
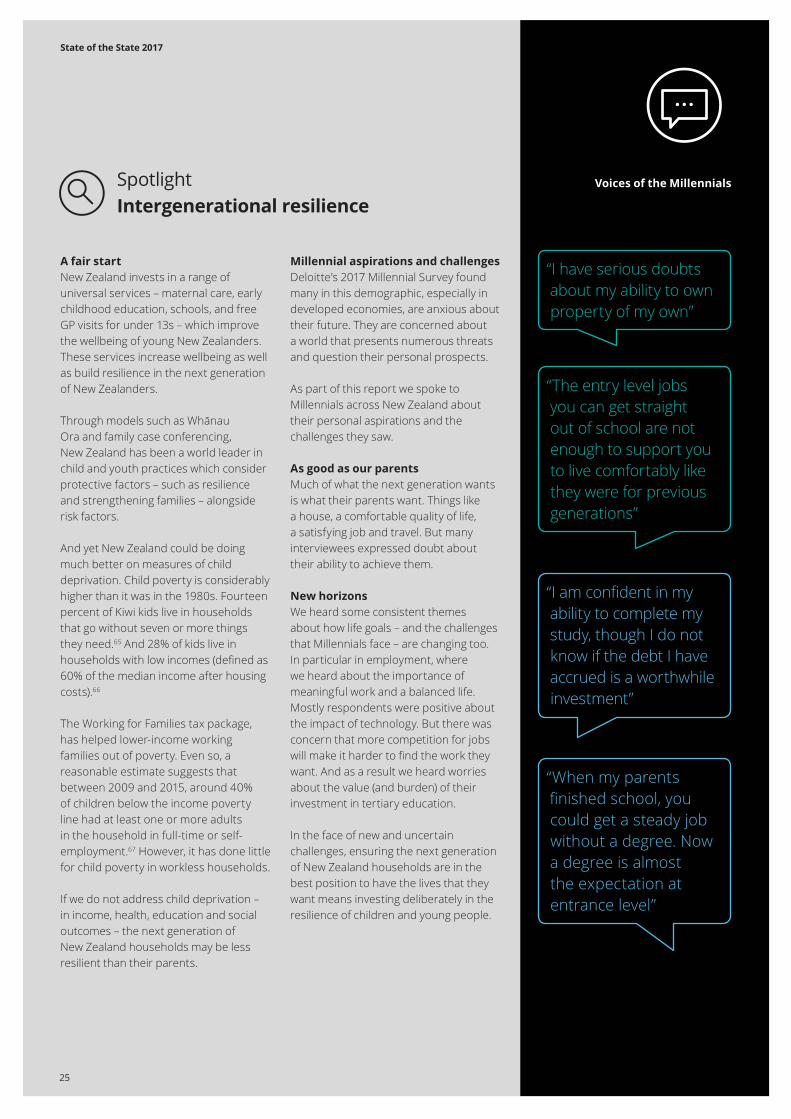
“I have serious doubts about my ability to own property of my own”
“I am confident in my ability to complete my study, though I do not know if the debt I have accrued is a worthwhile investment”
“The entry level jobs you can get straight out of school are not enough to support you to live comfortably like they were for previous generations”
“When my parents finished school, you could get a steady job without a degree. Now a degree is almost the expectation at entrance level”
A fair start New Zealand invests in a range of universal services – maternal care, early childhood education, schools, and free GP visits for under 13s – which improve the wellbeing of young New Zealanders. These services increase wellbeing as well as build resilience in the next generation of New Zealanders.
Through models such as Whānau Ora and family case conferencing, New Zealand has been a world leader in child and youth practices which consider protective factors – such as resilience and strengthening families – alongside risk factors.
And yet New Zealand could be doing much better on measures of child deprivation. Child poverty is considerably higher than it was in the 1980s. Fourteen percent of Kiwi kids live in households that go without seven or more things they need.65 And 28% of kids live in households with low incomes (defined as 60% of the median income after housing costs).66
The Working for Families tax package, has helped lower-income working families out of poverty. Even so, a reasonable estimate suggests that between 2009 and 2015, around 40% of children below the income poverty line had at least one or more adults in the household in full-time or self-employment.67 However, it has done little for child poverty in workless households.
If we do not address child deprivation – in income, health, education and social outcomes – the next generation of New Zealand households may be less resilient than their parents.
Millennial aspirations and challenges Deloitte’s 2017 Millennial Survey found many in this demographic, especially in developed economies, are anxious about their future. They are concerned about a world that presents numerous threats and question their personal prospects.
As part of this report we spoke to Millennials across New Zealand about their personal aspirations and the challenges they saw.
As good as our parents Much of what the next generation wants is what their parents want. Things like a house, a comfortable quality of life, a satisfying job and travel. But many interviewees expressed doubt about their ability to achieve them.
New horizons We heard some consistent themes about how life goals – and the challenges that Millennials face – are changing too. In particular in employment, where we heard about the importance of meaningful work and a balanced life. Mostly respondents were positive about the impact of technology. But there was concern that more competition for jobs will make it harder to find the work they want. And as a result we heard worries about the value (and burden) of their investment in tertiary education.
In the face of new and uncertain challenges, ensuring the next generation of New Zealand households are in the best position to have the lives that they want means investing deliberately in the resilience of children and young people.
Voices of the MillennialsSpotlight Intergenerational resilience

State of the State 2017 | Resilience in New Zealand
26
Social and cultural capital In a cohesive and inclusive society, individuals can call on resources beyond their own immediate reserves in order to help them successfully manage a variety of shocks.
Interviewees for this report identified that cultural connectedness – providing a relationship to community through language, history and social structures – is also a fundamental dimension to social capital. Statistics New Zealand found that for Māori, the more important that people felt it was to be involved in Māori culture, the higher their levels of life satisfaction.68
Internationally, New Zealand performs well on measures of social capital. In a measure used in both the OECD Better Life Index and the Social Progress Index, 99% of New Zealanders believed they know someone they could rely on in a time of need.69 Our high levels of social capital are evidenced by high levels of volunteerism, and social trust. We also typically rate highly in areas such as education and home ownership, both of which are associated with high levels of social capital.70
Recent experiences show us how social capital can provide a source of resilience. Examples include the work of the Student Volunteer Army and the response of Ngai Tahu in the wake of the Canterbury earthquakes, the response of Takahanga Marae in the aftermath of the more recent Kaikōura earthquake and the action of Te Puea Memorial Marae in response to concerns over higher levels of homelessness in Auckland.71
But there are limitations to social capital. For example, networks are often concentrated in particular regions, industries or communities, and may have similar vulnerabilities to shocks which affect many households. This means that organisations that we assumed might be there to help us in times of need might find themselves overwhelmed.
Government Policy influences household resilience in a wide range of ways. Although they are not always explicitly described in this way, many of the core functions of government serve to build resilience among households.
Redistribution Government has a poverty relief function through the welfare state. This takes the form of measures including job-seekers support, social housing and a public health system. These help households to manage shocks they may not be able to manage on their own.
Another core function is to act as a system of insurance and of redistribution across people’s lifetimes, for example by taxing us during our working years and providing for us in retirement. This helps people to manage shocks that due to risk and uncertainty may not be well managed by individuals.72
Both of these functions increase the resources, and therefore resilience, of individuals in the event of particular shocks. The extent of redistribution can have a notable effect on the equality of household income growth. When discussing the $1.6 billion transferred to low and middle income households with children as part of the Working for Families tax credit, one Ministry for Social Development report noted that the 2004 to 2007 period was the only one in the 25 years to 2007 in which the incomes of low- to middle-income households grew more quickly than those of households above the median.73
Universal and targeted services In addition, government provides universal services that, while primarily directed at other objectives, build personal resilience factors – through skills and wellbeing – of all New Zealanders.
Support that is targeted to groups with specific needs can increase the resilience of households. For example, the Whānau Ora model is explicitly building resilience with whānau. And progress in implementing social investment, with its focus on better outcomes for New Zealanders most in need, provides the opportunity to further build resilience into targeted provision.
Support that is targeted to groups with specific needs can increase the resilience of households
99% of New Zealanders know someone they can rely on in a time of need
State of the State 2017 | Resilience in New Zealand
27
Managing the economy Government has a macro-level role in responding to systemic shocks. The Legatum Prosperity Index explicitly focuses its assessment on “stable, sound economics” – in other words the resilience of the economic sector. Using this methodology New Zealand ranks number one in economic quality (and overall) in 2016.
The primary tool for stabilising the economy is monetary policy, which is set in accordance with the Reserve Bank’s mandate for ensuring the soundness of the financial system and targeting stable prices in the medium term. With global interest rates on a downward trend in recent decades, central banks are likely to have less room to cut rates in the event of a shock. This suggests that there will be a greater role for fiscal policy like stimulus spending, working together with monetary policy, to respond to shocks.74
The New Zealand Government has used stimulus spending effectively as a discretionary tool in response to adverse circumstances.75
A positive feature of New Zealand’s economic performance in recent times has been low public debt. The dual shocks of the GFC and Christchurch earthquakes showed that large-scale crises can quickly lead to a deterioration in public finances. Paying down debt in the good times will mean that future governments will be much less constrained in their actions when faced with a systemic shock.
The Government's recently announced plans to pay down net debt to 10–15% of GDP by 2025 have been explained explicitly in terms of enhancing resilience and putting New Zealand in a better position to respond to multiple shocks.76
While restoring this fiscal buffer is a worthwhile objective in the medium term, taking a broader view of resilience raised some additional issues. One sector of the economy paying down debt must be matched by another sector doing the opposite.77 We might hope our trading partners pick up this slack but still-weak global demand makes that uncertain. The risk of a focus on improving government's resilience is that we may shift further risk onto households who, as we discussed on page 23, are already experiencing a high debt-to-income ratio.
The balance of paying for government services out of current taxation (Pay as You Go) or accumulated funds (Save as You Go) has implications for national resilience in terms of funding future liabilities from future revenue. However, they also concern the predictability of income for households that rely on them. For instance, defined-benefit social programmes, such as the New Zealand Superannuation scheme, transfer risk from the individual to the rest of society by not having individual’s entitlements subject to the performance of a fund, as under a defined contribution scheme.
The trade-off is that prefunded, defined contribution schemes (such as Kiwisaver) allow the contributions to be invested in a diverse portfolio of assets.78 As a defined contribution scheme, ACC also has the benefit of paying injured claimants a fixed share of their income, thereby matching the level of support more closely with that party’s non-discretionary expenses.
Regulation Regulation can also decrease individual risk in a variety of ways, such as imposing standards and minimum entitlements in employment relationships (under the Employment Relations Act 2000), restricting some activities in the interest of public health and safety (e.g. the Hazardous Substances and New Organisms Act 1996) or enforcing property rights (the Property Law Act 2007).
The Government's plans to pay down net debt are explained explicitly to enhance resilience and put New Zealand in a better position to respond to multiple shocks
New Zealand ranks #1 in economic quality in the 2016 Legatum Prosperity Index

State of the State 2017 | Resilience in New Zealand
28
Institutions Institutions, meaning both informal norms and formal rules of governance, underpin the wider social system in which households operate. It follows that the more households can rely on a society’s institutions, and the better those institutions can manage and adapt to change, the easier it will be for households to do the same.
Trust and engagement: a measure of quality Trust in collective processes can better enable resilience-building to be pursued ahead of narrow individual interests. Examples include restricting bank lending or rebuilding the Natural Disaster Fund. And engagement with decision-making processes can help ensure that such decisions are informed by the experiences of households and are responsive to changes at that level.79
New Zealand has not experienced the levels of populist disillusionment and discontent currently being felt elsewhere that are fuelling political upheaval like the UK’s decision to leave the European Union and the 2016 United States election results.
Despite this, the picture of how New Zealanders view their public institutions is relatively mixed. On the one hand New Zealand is above the OECD average for voter turnout,80 and in 2016 returned to the joint-top ranking in Transparency International’s Corruption Perception Index. But on the other hand a 2016 survey by Victoria University of Wellington’s Institute for Governance and Policy Study found trust varied substantially across institutions, and New Zealanders as a whole did not agree that citizens’ interests are equally and fairly considered by government.
Resilient institutions The resilience of our institutions – their ability to continue to deliver core functions and adapt to change in the face of disruption – underpins the resilience of our social system, including that of households and of business.
Public institutions which can deliver through disruption Ensuring resilient institutions, which are able to operate in the face of shocks, requires a different mode of thinking than the ways in which we typically assess the public sector. The values associated with designing organisations for resilience (adaptivity, high levels of slack, diversity, multiple objectives) are not the same as those associated with efficiency.81 As Brian Walker of the Resilience Alliance has argued, “most losses in resilience are the unintended consequences of narrowly focused optimisation”.82
An area of strength for New Zealand has been our resilience to macroeconomic shocks. In March 2017, Moody’s noted that New Zealand’s exchange rate and monetary policy regimes allowed the country to bounce back well from recent shocks. A proactive Reserve Bank, the effective use of fiscal policy and strong public finances were also strong points, offsetting our dependence on agriculture and reliance on foreign capital.83
Public institutions which can adapt to change Adaptive institutions that can continue to serve the interests of households in the face of changing circumstances exhibit two key characteristics.
First, institutional capability to shape incentives means that they can effectively lock people into ways of living that are not sustainable or that do not fit with changing conditions.84 Resilience is likely to be enhanced by institutions that allow for an openness to experimentation and innovation and that effectively incorporate new information from diverse sources.85
Second, the capability to think and act intergenerationally enables institutions to consider long term consequences and impacts. Long-term thinking is built into many of our public sector institutions including ACC, the Ministry for Vulnerable Children, Oranga Tamariki and the recently announced Social Investment Agency. Many other government departments report on future concerns as a matter of course, as do public offices with specifically future-focused mandates such as the Commissioners for the Environment, Retirement and Children.86
Thinking and acting intergenerationally enables institutions to consider long term consequences and impacts

State of the State 2017 | Resilience in New Zealand
29
Analysis and decision-making focused on anticipating future challenges includes the requirement that the Treasury considers the long term (40 year) fiscal position every four years,87 and the work done by the Department of the Prime Minister and Cabinet (DPMC) on future risks for New Zealand. The stewardship requirement of the State Sector Act 1988 now requires chief executives of government departments to consider the “active planning and management of medium-and long-term interests” with regard to their organisations as a whole, the assets held and the legislation administered.88 As was noted previously, Treasury’s living standards framework attempts to operationalise a model of wellbeing centred on four capital stocks (economic, natural, social and human).89
Despite these measures, there are questions as to their adequacy. Victoria University of Wellington’s Jonathan Boston notes that many future-oriented objectives lack clarity on implementation, adequate resources or measures to ensure compliance.90 On the specific issue of risk, he notes that New Zealand lacks a unified approach to the identification, monitoring and reduction of risk.91
Government policy and public institutions already influence household resilience.
Good public policy should be about many things, but resilience is not currently the primary, or even a stated, objective of the actions which influence households.
This means that we might undervalue resilience when we choose what to invest in. For example, we need evidence of the value of being able to react quickly in order to better assess where short-term efficiency gains may reduce an institution’s capacity to respond to a disruption.
We also need to consider where policy will have unintended consequences for the resilience of New Zealand households, and therefore their future wellbeing. For example, a trend towards more casual work may provide new employment opportunities, but if people are putting off a doctor’s appointment because they have no paid sick leave, the impact may be felt in greater health problems and demands on the public health system in the long run.
Additionally, we should consider how policy can shape the distribution of risk and resilience between households, for example, the appreciating financial position of outright home owners against the increased vulnerability of a household with a small deposit on a new home.
Partly as a result of this, the overall impact of government is a mixed picture. Improvements, and declines, in resilience are often by-products of policy. While the existing system of government support is integral to the resilience of New Zealand households, there is more that government can do to help those households who will struggle to successfully adapt to change.
Evaluating resilience as an explicit objective of policy and decision-making, together with a conscious focus on those households with the least resilience, are necessary to ensure that more New Zealand households are fit for the future.
A greater government focus on resilience
Resilience is not currently the primary, or even a stated, objective of government actions which influence households

Boosting resilience
Staying on track
Resilience underpins the security of our wellbeing. We make four recommendations for boosting household resilience to ensure we are fit for the future.
A resilient future
Engage New Zealanders to build an index of wellbeing and resilience
Public institutions’ focus on resilience
Targeted household interventions
A resilience outcome for universal services
Resilience at the heart of long-term policy
1
2
3
4
30

State of the State 2017 | Recommendations
31
Doing so will result in a wider – or different – set of options being considered. By incorporating a resilience objective, government can recognise that building strengths in all Kiwis to bounce back from shocks contributes to the greater wellbeing of society and a more robust economy. This is particularly true where services have an indirect or long-term effect on wellbeing. Examples include the impact of free and subsidised GP visits and universal services such as improved literacy and numeracy, access to quality childcare and investment in research and development.
The emphasis on resilience is particularly useful given the role of health, education and housing in helping households absorb and adapt to the global and systemic trends that the next generation is likely to face. Prominent New Zealanders we interviewed agreed, reflecting on the importance of an education sector taking action now in anticipation of the impact of technology and automation, a health system preparing for our changing demographics and a housing policy addressing affordability to relieve pressure on demand for social housing.
But international and domestic experience has also taught us how precarious our wellbeing can be and, as we have shown, New Zealand households are facing numerous challenges.
We recommend government takes the following actions to address circumstances affecting household resilience and put resilience at the heart of long-term policy:
RecommendationsThere is plenty that New Zealand gets right. We have learned a lot about resilience from our recent experiences, particularly in infrastructure, community and disaster preparedness.
A resilience outcome from universal social services
We have identified that government intervention through core universal services – particularly health, education and housing – has a foundational impact on the resilience of households. Taken together these three areas represent government’s primary means of influencing the personal and household resilience of all New Zealanders.
We recommend government explicitly applies and evaluates resilience objectives in health, education and housing policy.
In State of the State 2016 we identified social investment as an approach with the potential to recognise lifetime costs and benefits of early and preventative interventions. This approach promotes targeted investment in vulnerable families and individuals at risk of poor outcomes.
While we support this approach, we believe it must be complemented by explicitly targeting household resilience as a key factor to be considered for policy development.
1Incorporate resilience as an outcome for investment in health, education, housing and other universal services that contribute to household resilience
2Explore policy interventions that specifically address key areas of inequality for those households with the least resilience
3Strengthen our public institutions’ focus on resilience as a policy objective
4Engage with New Zealanders to build an index of wellbeing and resilience
1

State of the State 2017 | Recommendations
32
Explore policy interventions that address income factors for household resilience
We have identified a group of households for whom income levels and volatility are the primary barriers to their resilience.
While social assistance is available for many of these households, we identified two limitations on existing assistance approaches when viewed through a resilience lens:
• There are households who are not eligible for targeted social assistance based on current needs but would benefit from income support to build their resilience
• There is a long term benefit of a resilient household that maintains its wellbeing in the face of disruption, which is not currently taken into account in policy making
There are challenges to targeting and evaluating resilience as an outcome. Many of the factors of resilience, like good mental health, are difficult to measure objectively and the interplay between them is complex.
And by definition greater resilience is measured by costs avoided. A resilient household maintains its wellbeing in the face of disruption and we may never know what the impact might have been if a household were less resilient. Any intervention should evaluate the factors we have identified in this report (levels of income buffers, evidence of planning, etc.), and last long enough to evaluate the household resilience being tested.
We recommend government progress interventions to address income factors for household resilience, advancing trials to build household resilience through a social investment approach and income support.
A social investment approach to household resilience In the 2016 State of the State report we defined social investment as government activity undertaken on the basis of a return on investment justification. Social investment is a people-centred, customised approach, which identifies interventions that work based on evidence.
Any social investment approach to improve resilience should consider interventions across multiple Crown agencies (including housing, family support, and child and youth services) that are tailored to the household. Successful interventions will be measured by the greater wellbeing of individual households across generations and by a better return on investment for government.
While there are challenges to a social investment approach for resilience, we believe it is possible to progress interventions that take resilience into account through the long term security of wellbeing.
We propose a ‘positive returns’ approach – where the investment is made on the basis of where the greatest social returns will be gained – as opposed to reducing lifetime Crown expenditure. This may fit most logically with health (particularly mental health) or education, which are the areas where existing evidence shows the greatest potential increases in resilience. Examples could include things like cognitive behaviour therapy or investment in problem-solving in early childhood.
Enough is known about the factors that contribute to resilience. There is plenty of research on risk factors and, increasingly (from fields such as youth and social work, mental health and education), on protective factors that contribute to resilience.
We can use information on the frequency and impact of household disruptions (divorce, moving house, starting a family) and an increasing understanding of how households access government services in these events. This means it is possible to put a conservative estimate on the average costs of disruption to a household, and in particular the difference in costs between households that are more, or less, resilient. Costs and outcome measures should be amended and refined as richer local data becomes available.
There is also enough information about specific cohorts of New Zealanders to get started. This includes the Integrated Data Infrastructure (IDI), which is building an economic and social data ecosystem to support decision- and policy-makers. No doubt the evolving and expanding practice of social investment will show links between factors that we don’t readily see today. These could inform additional measures of resilience over time.
2
State of the State 2017 | Recommendations
33
Income support interventions A level of income security can enable better decisions and planning at a household level as well as reduce the impact of disruption. Income support interventions will allow households to plan and allocate resources in the way that they believe will best improve their current and future wellbeing.
Recently, there has been much attention on the idea of a universal basic income (UBI). In other words a cash payment to all citizens over a certain age. However, a pure UBI that replaces all needs-based assistance could be at the expense of the resilience of households that previously would have qualified for greater assistance.
We recommend government runs evaluated trials on the impact of targeted income interventions on household resilience.
We propose two potential options for consideration. These would explore the impact of guaranteed and means-tested income interventions while continuing to target households with poorer resilience.
(i) Child benefit for all New Zealanders: testing a universal approach As we have noted, New Zealand’s child poverty levels remain unacceptably high. There is also a perceptible shift away from investment in younger people towards older people, for example through rising relative investment in health and reduced per capita funding in education.
New Zealand had a universal child benefit until 1991, and its absence is somewhat out of step with international practices. Twenty-three out of thirty-four OECD countries have some form of universal child payment.92
Trialling a child benefit, available to the primary caregiver in all households with children of a certain age, would test the impact of a universally administered benefit while continuing to direct assistance toward households with vulnerable dependents.
(ii) Guaranteed minimum income for households experiencing high income volatility: testing a targeted income support A guaranteed minimum income is a means-tested income supplement. Households whose incomes fell below an idenitified threshold would be entitled to an effective top up of income rather than a tax liability for the income they earned. There are some shortcomings from a resilience perspective – particularly that means-testing still results in some uncertainty about income and a potential delay in receiving assistance due to the qualification assessment. However, it allows for greater targeting.
A randomised controlled trial would need to identify an appropriate cohort considering households at higher risk of material hardship and income volatility. It would also consider what an appropriate level of assistance would be to make a material impact to households’ ability to cope with disruptions, but not be so high that it could not be scaled affordably if successful. Consideration should also be given to what other financial support this would replace or complement.
New Zealand’s child poverty levels remain unacceptably high
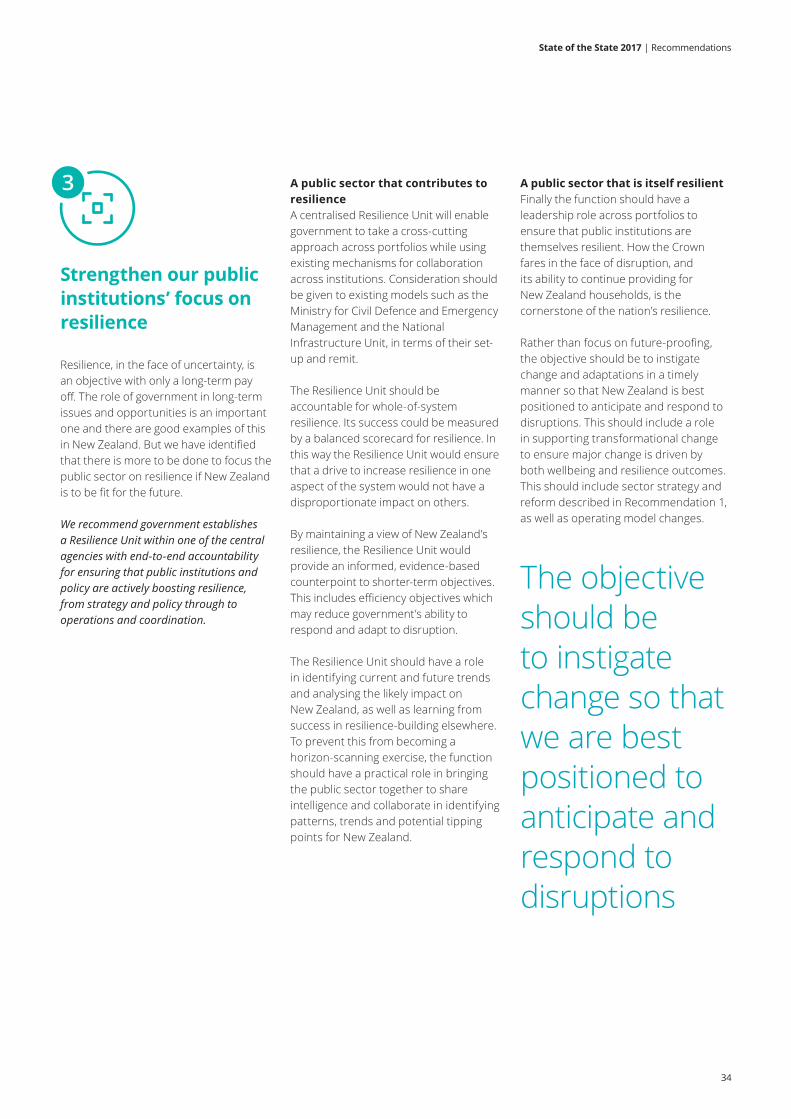
State of the State 2017 | Recommendations
34
Strengthen our public institutions’ focus on resilience
Resilience, in the face of uncertainty, is an objective with only a long-term pay off. The role of government in long-term issues and opportunities is an important one and there are good examples of this in New Zealand. But we have identified that there is more to be done to focus the public sector on resilience if New Zealand is to be fit for the future.
We recommend government establishes a Resilience Unit within one of the central agencies with end-to-end accountability for ensuring that public institutions and policy are actively boosting resilience, from strategy and policy through to operations and coordination.
A public sector that contributes to resilience A centralised Resilience Unit will enable government to take a cross-cutting approach across portfolios while using existing mechanisms for collaboration across institutions. Consideration should be given to existing models such as the Ministry for Civil Defence and Emergency Management and the National Infrastructure Unit, in terms of their set-up and remit.
The Resilience Unit should be accountable for whole-of-system resilience. Its success could be measured by a balanced scorecard for resilience. In this way the Resilience Unit would ensure that a drive to increase resilience in one aspect of the system would not have a disproportionate impact on others.
By maintaining a view of New Zealand’s resilience, the Resilience Unit would provide an informed, evidence-based counterpoint to shorter-term objectives. This includes efficiency objectives which may reduce government’s ability to respond and adapt to disruption.
The Resilience Unit should have a role in identifying current and future trends and analysing the likely impact on New Zealand, as well as learning from success in resilience-building elsewhere. To prevent this from becoming a horizon-scanning exercise, the function should have a practical role in bringing the public sector together to share intelligence and collaborate in identifying patterns, trends and potential tipping points for New Zealand.
The objective should be to instigate change so that we are best positioned to anticipate and respond to disruptions
A public sector that is itself resilient Finally the function should have a leadership role across portfolios to ensure that public institutions are themselves resilient. How the Crown fares in the face of disruption, and its ability to continue providing for New Zealand households, is the cornerstone of the nation’s resilience.
Rather than focus on future-proofing, the objective should be to instigate change and adaptations in a timely manner so that New Zealand is best positioned to anticipate and respond to disruptions. This should include a role in supporting transformational change to ensure major change is driven by both wellbeing and resilience outcomes. This should include sector strategy and reform described in Recommendation 1, as well as operating model changes.
3

State of the State 2017 | Recommendations
35
Internationally, there are good examples of countries engaging with communities to understand what aspects to measure. For example the Canadian Index of Wellbeing93 is built on public consultation on what matters to people.
New Zealand already has plenty to build on, for example the Quality of Life surveys run across a number of councils and frameworks that build a cultural view of what is important, including the Mauri model of decision-making,94 the Markers of Flourishing framework,95 and the Te Whare Tapa Whā model of health and wellness.96
Any framework should consider qualitative and quantitative measures across economic, social and cultural dimensions.
Engage with New Zealanders to build a wellbeing and resilience index
We recommend government engages with New Zealanders to describe the aspects of wellbeing and resilience that are important, identify appropriate indicators to measure them and use these indicators to guide and evaluate policy-making and government services.
In this report we have laid out a picture of what New Zealand’s resilience landscape looks like. Being able to measure resilience is critical to the previous recommendations. Having the right measures in place will tell us how households are doing, where we should target interventions, and enable us to evaluate the evidence for resilience and the impact of investments.
What resilience means also varies between households, communities, and even regions. We have shown how differently households build and deploy resilience, influenced by economic, social and cultural factors. As our demographics change we will have more interpretations not fewer. New Zealand measures of resilience should reflect the values of its communities.
4
Having the right measures in place will tell us how households are doing, where we should target interventions, and enable us to evaluate investments
FORECAST
SHOCKS
$
!
36
How well we respond to uncertainty relies on resilience at all levels, individually and together, ensuring we stay fit for the future
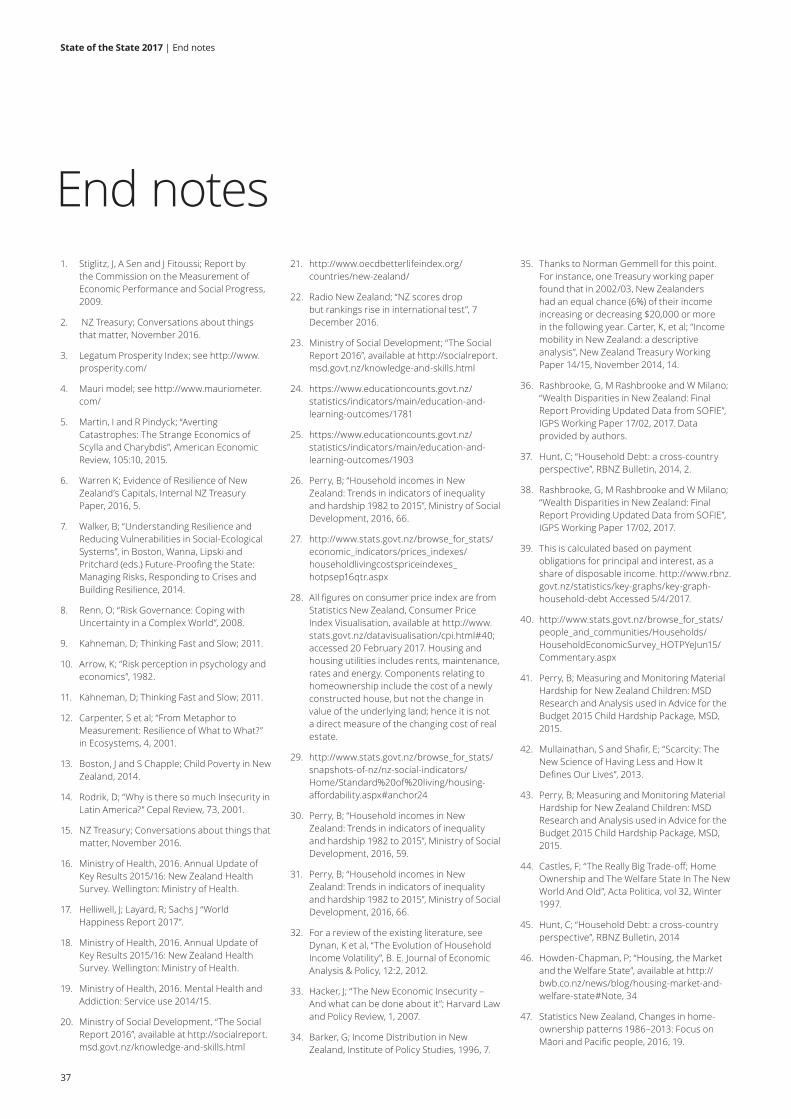
State of the State 2017 | End notes
37
End notes1. Stiglitz, J, A Sen and J Fitoussi; Report by
the Commission on the Measurement of Economic Performance and Social Progress, 2009.
2. NZ Treasury; Conversations about things that matter, November 2016.
3. Legatum Prosperity Index; see http://www.prosperity.com/
4. Mauri model; see http://www.mauriometer.com/
5. Martin, I and R Pindyck; “Averting Catastrophes: The Strange Economics of Scylla and Charybdis”, American Economic Review, 105:10, 2015.
6. Warren K; Evidence of Resilience of New Zealand’s Capitals, Internal NZ Treasury Paper, 2016, 5.
7. Walker, B; “Understanding Resilience and Reducing Vulnerabilities in Social-Ecological Systems”, in Boston, Wanna, Lipski and Pritchard (eds.) Future-Proofing the State: Managing Risks, Responding to Crises and Building Resilience, 2014.
8. Renn, O; “Risk Governance: Coping with Uncertainty in a Complex World”, 2008.
9. Kahneman, D; Thinking Fast and Slow; 2011.
10. Arrow, K; “Risk perception in psychology and economics”, 1982.
11. Kahneman, D; Thinking Fast and Slow; 2011.
12. Carpenter, S et al; “From Metaphor to Measurement: Resilience of What to What?” in Ecosystems, 4, 2001.
13. Boston, J and S Chapple; Child Poverty in New Zealand, 2014.
14. Rodrik, D; “Why is there so much Insecurity in Latin America?” Cepal Review, 73, 2001.
15. NZ Treasury; Conversations about things that matter, November 2016.
16. Ministry of Health, 2016. Annual Update of Key Results 2015/16: New Zealand Health Survey. Wellington: Ministry of Health.
17. Helliwell, J; Layard, R; Sachs J “World Happiness Report 2017”.
18. Ministry of Health, 2016. Annual Update of Key Results 2015/16: New Zealand Health Survey. Wellington: Ministry of Health.
19. Ministry of Health, 2016. Mental Health and Addiction: Service use 2014/15.
20. Ministry of Social Development, “The Social Report 2016”, available at http://socialreport.msd.govt.nz/knowledge-and-skills.html
21. http://www.oecdbetterlifeindex.org/countries/new-zealand/
22. Radio New Zealand; “NZ scores drop but rankings rise in international test”, 7 December 2016.
23. Ministry of Social Development; “The Social Report 2016”, available at http://socialreport.msd.govt.nz/knowledge-and-skills.html
24. https://www.educationcounts.govt.nz/statistics/indicators/main/education-and-learning-outcomes/1781
25. https://www.educationcounts.govt.nz/statistics/indicators/main/education-and-learning-outcomes/1903
26. Perry, B; “Household incomes in New Zealand: Trends in indicators of inequality and hardship 1982 to 2015”, Ministry of Social Development, 2016, 66.
27. http://www.stats.govt.nz/browse_for_stats/economic_indicators/prices_indexes/householdlivingcostspriceindexes_hotpsep16qtr.aspx
28. All figures on consumer price index are from Statistics New Zealand, Consumer Price Index Visualisation, available at http://www.stats.govt.nz/datavisualisation/cpi.html#40; accessed 20 February 2017. Housing and housing utilities includes rents, maintenance, rates and energy. Components relating to homeownership include the cost of a newly constructed house, but not the change in value of the underlying land; hence it is not a direct measure of the changing cost of real estate.
29. http://www.stats.govt.nz/browse_for_stats/snapshots-of-nz/nz-social-indicators/Home/Standard%20of%20living/housing-affordability.aspx#anchor24
30. Perry, B; “Household incomes in New Zealand: Trends in indicators of inequality and hardship 1982 to 2015”, Ministry of Social Development, 2016, 59.
31. Perry, B; “Household incomes in New Zealand: Trends in indicators of inequality and hardship 1982 to 2015”, Ministry of Social Development, 2016, 66.
32. For a review of the existing literature, see Dynan, K et al, “The Evolution of Household Income Volatility”, B. E. Journal of Economic Analysis & Policy, 12:2, 2012.
33. Hacker, J; “The New Economic Insecurity – And what can be done about it”; Harvard Law and Policy Review, 1, 2007.
34. Barker, G; Income Distribution in New Zealand, Institute of Policy Studies, 1996, 7.
35. Thanks to Norman Gemmell for this point. For instance, one Treasury working paper found that in 2002/03, New Zealanders had an equal chance (6%) of their income increasing or decreasing $20,000 or more in the following year. Carter, K, et al; “Income mobility in New Zealand: a descriptive analysis”, New Zealand Treasury Working Paper 14/15, November 2014, 14.
36. Rashbrooke, G, M Rashbrooke and W Milano; “Wealth Disparities in New Zealand: Final Report Providing Updated Data from SOFIE”, IGPS Working Paper 17/02, 2017. Data provided by authors.
37. Hunt, C; “Household Debt: a cross-country perspective”, RBNZ Bulletin, 2014, 2.
38. Rashbrooke, G, M Rashbrooke and W Milano; “Wealth Disparities in New Zealand: Final Report Providing Updated Data from SOFIE”, IGPS Working Paper 17/02, 2017.
39. This is calculated based on payment obligations for principal and interest, as a share of disposable income. http://www.rbnz.govt.nz/statistics/key-graphs/key-graph-household-debt Accessed 5/4/2017.
40. http://www.stats.govt.nz/browse_for_stats/people_and_communities/Households/HouseholdEconomicSurvey_HOTPYeJun15/Commentary.aspx
41. Perry, B; Measuring and Monitoring Material Hardship for New Zealand Children: MSD Research and Analysis used in Advice for the Budget 2015 Child Hardship Package, MSD, 2015.
42. Mullainathan, S and Shafir, E; “Scarcity: The New Science of Having Less and How It Defines Our Lives”, 2013.
43. Perry, B; Measuring and Monitoring Material Hardship for New Zealand Children: MSD Research and Analysis used in Advice for the Budget 2015 Child Hardship Package, MSD, 2015.
44. Castles, F; “The Really Big Trade-off; Home Ownership and The Welfare State In The New World And Old”, Acta Politica, vol 32, Winter 1997.
45. Hunt, C; “Household Debt: a cross-country perspective”, RBNZ Bulletin, 2014
46. Howden-Chapman, P; “Housing, the Market and the Welfare State”, available at http://bwb.co.nz/news/blog/housing-market-and-welfare-state#Note, 34
47. Statistics New Zealand, Changes in home-ownership patterns 1986–2013: Focus on Māori and Pacific people, 2016, 19.
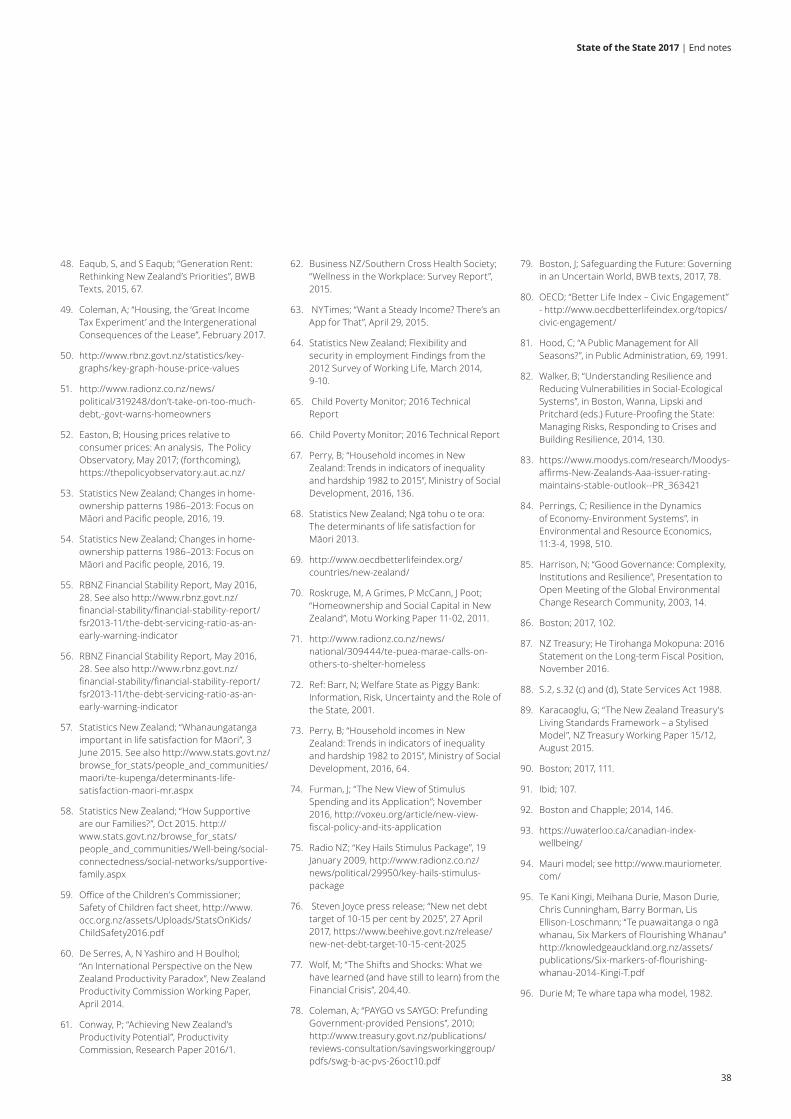
State of the State 2017 | End notes
38
48. Eaqub, S, and S Eaqub; “Generation Rent: Rethinking New Zealand’s Priorities”, BWB Texts, 2015, 67.
49. Coleman, A; “Housing, the ‘Great Income Tax Experiment’ and the Intergenerational Consequences of the Lease”, February 2017.
50. http://www.rbnz.govt.nz/statistics/key-graphs/key-graph-house-price-values
51. http://www.radionz.co.nz/news/political/319248/don’t-take-on-too-much-debt,-govt-warns-homeowners
52. Easton, B; Housing prices relative to consumer prices: An analysis, The Policy Observatory, May 2017; (forthcoming), https://thepolicyobservatory.aut.ac.nz/
53. Statistics New Zealand; Changes in home-ownership patterns 1986–2013: Focus on Māori and Pacific people, 2016, 19.
54. Statistics New Zealand; Changes in home-ownership patterns 1986–2013: Focus on Māori and Pacific people, 2016, 19.
55. RBNZ Financial Stability Report, May 2016, 28. See also http://www.rbnz.govt.nz/financial-stability/financial-stability-report/fsr2013-11/the-debt-servicing-ratio-as-an-early-warning-indicator
56. RBNZ Financial Stability Report, May 2016, 28. See also http://www.rbnz.govt.nz/financial-stability/financial-stability-report/fsr2013-11/the-debt-servicing-ratio-as-an-early-warning-indicator
57. Statistics New Zealand; “Whanaungatanga important in life satisfaction for Māori”, 3 June 2015. See also http://www.stats.govt.nz/browse_for_stats/people_and_communities/maori/te-kupenga/determinants-life-satisfaction-maori-mr.aspx
58. Statistics New Zealand; “How Supportive are our Families?”, Oct 2015. http://www.stats.govt.nz/browse_for_stats/people_and_communities/Well-being/social-connectedness/social-networks/supportive-family.aspx
59. Office of the Children’s Commissioner; Safety of Children fact sheet, http://www.occ.org.nz/assets/Uploads/StatsOnKids/ChildSafety2016.pdf
60. De Serres, A, N Yashiro and H Boulhol; “An International Perspective on the New Zealand Productivity Paradox”, New Zealand Productivity Commission Working Paper, April 2014.
61. Conway, P; “Achieving New Zealand’s Productivity Potential”, Productivity Commission, Research Paper 2016/1.
62. Business NZ/Southern Cross Health Society; “Wellness in the Workplace: Survey Report”, 2015.
63. NYTimes; “Want a Steady Income? There’s an App for That”, April 29, 2015.
64. Statistics New Zealand; Flexibility and security in employment Findings from the 2012 Survey of Working Life, March 2014, 9-10.
65. Child Poverty Monitor; 2016 Technical Report
66. Child Poverty Monitor; 2016 Technical Report
67. Perry, B; “Household incomes in New Zealand: Trends in indicators of inequality and hardship 1982 to 2015”, Ministry of Social Development, 2016, 136.
68. Statistics New Zealand; Ngā tohu o te ora: The determinants of life satisfaction for Māori 2013.
69. http://www.oecdbetterlifeindex.org/countries/new-zealand/
70. Roskruge, M, A Grimes, P McCann, J Poot; “Homeownership and Social Capital in New Zealand”, Motu Working Paper 11-02, 2011.
71. http://www.radionz.co.nz/news/national/309444/te-puea-marae-calls-on-others-to-shelter-homeless
72. Ref: Barr, N; Welfare State as Piggy Bank: Information, Risk, Uncertainty and the Role of the State, 2001.
73. Perry, B; “Household incomes in New Zealand: Trends in indicators of inequality and hardship 1982 to 2015”, Ministry of Social Development, 2016, 64.
74. Furman, J; “The New View of Stimulus Spending and its Application”; November 2016, http://voxeu.org/article/new-view-fiscal-policy-and-its-application
75. Radio NZ; “Key Hails Stimulus Package”, 19 January 2009, http://www.radionz.co.nz/news/political/29950/key-hails-stimulus-package
76. Steven Joyce press release; “New net debt target of 10-15 per cent by 2025”, 27 April 2017, https://www.beehive.govt.nz/release/new-net-debt-target-10-15-cent-2025
77. Wolf, M; “The Shifts and Shocks: What we have learned (and have still to learn) from the Financial Crisis”, 204,40.
78. Coleman, A; “PAYGO vs SAYGO: Prefunding Government-provided Pensions”, 2010; http://www.treasury.govt.nz/publications/reviews-consultation/savingsworkinggroup/pdfs/swg-b-ac-pvs-26oct10.pdf
79. Boston, J; Safeguarding the Future: Governing in an Uncertain World, BWB texts, 2017, 78.
80. OECD; “Better Life Index – Civic Engagement” - http://www.oecdbetterlifeindex.org/topics/civic-engagement/
81. Hood, C; “A Public Management for All Seasons?”, in Public Administration, 69, 1991.
82. Walker, B; “Understanding Resilience and Reducing Vulnerabilities in Social-Ecological Systems”, in Boston, Wanna, Lipski and Pritchard (eds.) Future-Proofing the State: Managing Risks, Responding to Crises and Building Resilience, 2014, 130.
83. https://www.moodys.com/research/Moodys-affirms-New-Zealands-Aaa-issuer-rating-maintains-stable-outlook--PR_363421
84. Perrings, C; Resilience in the Dynamics of Economy-Environment Systems”, in Environmental and Resource Economics, 11:3-4, 1998, 510.
85. Harrison, N; “Good Governance: Complexity, Institutions and Resilience”, Presentation to Open Meeting of the Global Environmental Change Research Community, 2003, 14.
86. Boston; 2017, 102.
87. NZ Treasury; He Tirohanga Mokopuna: 2016 Statement on the Long-term Fiscal Position, November 2016.
88. S.2, s.32 (c) and (d), State Services Act 1988.
89. Karacaoglu, G; “The New Zealand Treasury’s Living Standards Framework – a Stylised Model”, NZ Treasury Working Paper 15/12, August 2015.
90. Boston; 2017, 111.
91. Ibid; 107.
92. Boston and Chapple; 2014, 146.
93. https://uwaterloo.ca/canadian-index-wellbeing/
94. Mauri model; see http://www.mauriometer.com/
95. Te Kani Kingi, Meihana Durie, Mason Durie, Chris Cunningham, Barry Borman, Lis Ellison-Loschmann; “Te puawaitanga o ngā whanau, Six Markers of Flourishing Whānau” http://knowledgeauckland.org.nz/assets/publications/Six-markers-of-flourishing-whanau-2014-Kingi-T.pdf
96. Durie M; Te whare tapa wha model, 1982.

State of the State 2017 | Bibliography
39
BibliographyAcument Republic. (2016). 2016 Acument
Edelman Trust Barometer: New Zealand Report. Acument Republic. Retrieved from https://www.acumenrepublic.com/CDF_ModuleNews/Display/Details/226?NewsSetId=62&PageId=23531
Adger, W. N. (2000). Social and ecological resilience: are they related? Progress in Human Geography, 24(3), 347-364.
Akerlof, G. A., & Shiller, R. J. (2009). Animal spirits: How human psychology drives the economy, and why it matters for global capitalism. Princeton: Princeton University Press.
Arrow, K. J. (1982). Risk perception in psychology and economics. Economic inquiry, 20(1), 1-9.
Autor, D. H., Dorn, D., & Hanson, G. H. (2016). The China Shock: Learning from Labor-Market Adjustment to Large Changes in Trade. Annual Review of Economics, 8, 205-240.
Aven, T. (2010). On Some Recent Definitions and Analysis Frameworks for Risk, Vulnerability, and Resilience. Risk Analysis, 31(4), 515-522.
Barker, G. (1996). Income Distribution in New Zealand. Wellington: Institute of Policy Studies, Victoria University of Wellington.
Barr, N. (2001). The Welfare State as Piggy Bank: Information, Risk, Uncertainty, and the Role of the State. Oxford: Oxford University Press.
Boston, J. (2017). Safeguarding the Future: Governing in an Uncertain World. Wellington: BWB Texts.
Boston, J., & Chapple, S. (2014). Child Poverty in New Zealand. Wellington: Bridget Williams Books.
Brynjolfsson, E., & McAfee, A. (2014). The Second Machine Age: Work, Progress, and Prosperity in a Time of Brilliant Technologies. New York: W. W. Norton & Company, Inc.
Bughin, J., & Mischke, J. (2016, November 28). Exploding Myths About the Gig Economy. Retrieved from VOX: CEPR's Policy Portal: http://voxeu.org/article/exploding-myths-about-gig-economy
Business NZ and Southern Cross health Society. (2015). Wellness in the Workplace. Wellington: Business NZ. Retrieved from https://www.businessnz.org.nz/__data/assets/pdf_file/0013/108400/Wellness-in-the-Workplace-Survey-Report-2015.pdf
Carpenter, S., Walker, B., Anderies, J. M., & Abel, N. (2001). From Metaphor to Measurement: Resilience of What to What? Ecosystems , 4(8), 765-781.
Castles, F. G. (1998). The Really Big Trade-off: Home Ownership and the Welfare State in the New World and the Old. Acta politica, 33, 5-19.
Cetorelli, N., & Goldberg, L. S. (2011). Global Banks and International Shock Transmission: Evidence from the Crisis. IMF Economic Review, 59(1), 41-76.
Chartered Accountants Australia and New Zealand. (2015). Future [Inc]: Disruptive Technologies, Risks, Opportunities - Can New Zealand Make the Most of Them? Chartered Accountants Australia and New Zealand.
Claessens, S., Dell'Ariccia, G., Igan, D., & Laeven, L. (2010). Cross-country Experiences and Policy Implications from the Global Financial Crisis. Economic Policy, 25(62), 267-293.
Coleman, A. (2010). PAYGO vs SAYGO: Prefunding Government-provided Pensions. Wellington: Savings Working Group. Retrieved from http://www.treasury.govt.nz/publications/reviews-consultation/savingsworkinggroup/pdfs/swg-b-ac-pvs-26oct10.pdf
Collins, B. (2016, November 30). Don't Take On Too Much Debt, Govt Warns Homeowners. Retrieved from Radio New Zealand: http://www.radionz.co.nz/news/political/319248/don't-take-on-too-much-debt,-govt-warns-homeowners
Conway, P. (2016). Achieving New Zealand's Productivity Potential. Wellington: New Zealand Productivity Commission. Retrieved from http://www.productivity.govt.nz/research-paper/achieving-new-zealands-productivity-potential
Cullen, M. (2016). The Great Moderation and the Great Confusion. Guest Lecture: Sir Michael Cullen. Wellington: The Treasury. Retrieved from http://www.treasury.govt.nz/publications/media-speeches/guestlectures/cullen-jul16
de Serres, A., Yashiro, N., & Boulhol, H. (2014). An International Perspective on the New Zealand Productivity Paradox. Wellington: New Zealand Productivity Commission. Retrieved from http://www.productivity.govt.nz/working-paper/an-international-perspective-on-the-new-zealand-productivity-paradox
Dizikes, P. (2012, June 2). Explained: Knightian Uncertainty. Retrieved from MIT News: http://news.mit.edu/2010/explained-knightian-0602
Dobbs, R., Manyika, J., & Woetzel, J. (2015, April). The Four Global Forces Breaking All the Trends. Retrieved from McKinsey & Company: http://www.mckinsey.com/business-functions/strategy-and-corporate-finance/our-insights/the-four-global-forces-breaking-all-the-trends
Dynan, K., Elmendorf, D., & Sichel, D. (2012). The Evolution of Household Income Volatility. The B.E. Journal of Economic Analysis and Policy, 12(2), 1-40.
Eaqub, S., & Eaqub, S. (2015). Generation Rent: Rethinking New Zealand's Priorities. Wellington: Bridget Williams Books.
Easton, B. H. (1996). The post-war welfare state. Social Policy Journal of New Zealand, 7, 17-28.
Easton, B. H. (2017: Forthcoming, April 10). Housing Prices Relative to Consumer Prices: An Analysis. Auckland: The Policy Observatory. Retrieved from Brian Easton: https://thepolicyobservatory.aut.ac.nz/
Eaton, J. (1988). Foreign-Owned Land. The American Economic Review, 78(1), 76-88.
Etile, F., Frijters, P., Johson, D. W., & Shields, M. A. (2017). Modelling Heterogeneity in the Resilience to Major Socioeconomic Life Events. PSE Working Papers n2017-09. Retrieved from https://halshs.archives-ouvertes.fr/halshs-01485989/document
Farrell, D., & Greig, F. (2016). Paychecks, Paydays, and the Online Platform Economy: Big Data on Income Volatility. Online: JPMorgan Chase & Co. Institute. Retrieved from https://www.jpmorganchase.com/corporate/institute/report-paychecks-paydays-and-the-online-platform-economy.htm
Frey, C. B., & Osborne, M. A. (2013). The Future of Employment: How Susceptible are Jobs to Computerisation? Oxford: University of Oxford.
Furman, J. (2016, November 02). The New View of Fiscal Policy and its Application. Retrieved from VOX: CEPR's Policy Portal: http://voxeu.org/article/new-view-fiscal-policy-and-its-application
Gerritsen, J. (2016, December 7). NZ scores drop but rankings rise in international test. Retrieved from Radio New Zealand: http://www.radionz.co.nz/news/national/319783/nz-scores-drop-but-rankings-rise-in-international-test

State of the State 2017 | Bibliography
40
Giridharadas, A. (2015, May 3). Want a Steady Income? There's an App for That: A Silicon Valley start-up wants to put workers on an even keel. New York Times, p. MM66. Retrieved from https://www.nytimes.com/2015/05/03/magazine/want-a-steady-income-theres-an-app-for-that.html?_r=0
Gordon, R. J. (2012). Is U.S. Economic Growth Over? Faltering Innovation Confronts the Six Headwinds. Cambridge, MA: National Bureau of Economic Rearch. Retrieved from http://www.nber.org/papers/w18315
Grimes, A., & Hyland, S. (2015). The Material Wellbeing of New Zealand Households. Wellington: Motu Economic and Public Policy Research, Note 21. Retrieved from http://motu.nz/our-work/wellbeing-and-macroeconomics/well-being-and-sustainability-measures/material-wellbeing-of-new-zealand-households/
Hacker, J. S. (2007). The New Economic Insecurity An What Can Be Done about It. Harvard Law Policy Review, 111-126.
Harris, S. (2016, November 20). Takahanga marae Serves Last Dinner After Kaikoura Quake as Red Cross Sets Up Centre. Retrieved from Nzherald.co.nz: http://www.nzherald.co.nz/nz/news/article.cfm?c_id=1&objectid=11751819
Harrison, N. (2003). Good Governance: Complexity, Institutions, and Resilience. Presentation at the Open Meeting of the Global Environmental Change. Montreal: SEDAC, CIESIN, Columbia University. Retrieved from http://sedac.ciesin.org/openmtg/docs/Harrison.pdf
Hickey, B. (2017, March 19). It's the Productivity, Stupid. Retrieved from Newsroom.co.nz: https://www.newsroom.co.nz/@boardroom/2017/03/18/15717/its-the-productivity-stupid
Holling, C. (1973). Resilience and Stability of Ecological Systems. Annual Review of Ecological Systems, 4(1), 1-23.
Holpuch, A. (2016, September 21). UN Meeting Tackles the 'Fundamental Thread' of Antibiotic-resistant Superbugs. Retrieved from The Guardian: https://www.theguardian.com/society/2016/sep/20/un-declaration-antibiotic-drug-resistance
Hood, C. (1991). A Public Management for All Seasons? Public Administration, 69(1), 3-19.
Hoverd, W. J. (2008). No Longer a Christian Country? Religious Demographic Change in New Zealand 1966-2006. New Zealand Sociology, 23(1), 41-65.
Howden-Chapman, P. (2016, May 30). Housing, the market and the welfare state - Philippa Howden-Chapman. Retrieved from Bridget Williams Books: http://bwb.co.nz/news/blog/housing-market-and-welfare-state
Hunt, C. (2014, October). Household Debt: A Cross-Country Perspective. Bulletin, 77(4), 1-13. Retrieved from http://www.rbnz.govt.nz/-/media/ReserveBank/Files/Publications/Bulletins/2014/2014oct77-4.pdf
IGPS and Colmar Brunton. (2016). Who do we Trust? Wellington: Institute for Governance and Policy Studies.
James, C. (2013). Making Big Decisions for the Future. Policy Quarterly, 9(4), 21-28. Retrieved from http://igps.victoria.ac.nz/publications/files/a0d623166aa.pdf
Joyce, S. (2017, April 27). New Net Debt Target of 10-15 Per Cent by 2025. Retrieved from https://www.beehive.govt.nz/release/new-net-debt-target-10-15-cent-2025
Kahneman, D. (2011). Thinking Fast and Slow. New York: Farrar, Straus and Giroux.
Karacaoglu, G. (2016). The New Zealand Treasury's Living Standards Framework - Exploring a Stylised Model. Wellington: Treasury. Retrieved from http://www.treasury.govt.nz/publications/research-policy/wp/2015/15-12/twp15-12.pdf
King, M. (2016). The End of Alchemy: Money, Banking, and the Future of the Global Economy. WW Norton & Company.
Kingi, T. K., Durie, M., Durie, M., Cunningham, C., Borman, B., & Ellison-Loschmann, L. (2014). Te Puawaitanga o ngā Whānau: Six Markers of Flourishing Whānau. Office of the Assistant Vice Chancellor, Māori and Pasifika. Palmerson North: Massey University.
Mani, A., Mullainathan, S., Shafir, E., & Zhao, J. (2013). Poverty Impedes Cognitive Function. Science, 976-980.
Martin, I. W., & Pindyck, R. S. (2015). Averting catastrophes: The strange economics of Scylla and Charybdis. The American Economic Review, 105(10), 2947-2985.
McLeod, J. (2017). The New Zealand Cause Report: Shape of the Charity Sector. JB Were. Retrieved from https://www.jbwere.co.nz/assets/Uploads/JBWereNZ-CauseReport-March2017-DigitalVersion.pdf
Ministry of Education. (2016). School Leavers with NCEA Level 2 or Above. Education Counts. Retrieved from https://www.educationcounts.govt.nz/statistics/indicators/main/education-and-learning-outcomes/1781
Ministry of Education. (2017). Educational Attainment in the Adult Population. Education Counts. Retrieved from https://www.educationcounts.govt.nz/statistics/indicators/main/education-and-learning-outcomes/1903
Ministry of Health. (2016). Annual Update of Key Results 2015/2016: New Zealand Health Survey. Wellington: Ministry of Health. Retrieved from http://www.health.govt.nz/publication/annual-update-key-results-2015-16-new-zealand-health-survey
Ministry of Health. (2016, November 23). Mental Health and Addiction: Service Use 2014/15. Retrieved from Ministry of Health: http://www.health.govt.nz/publication/mental-health-and-addiction-service-use-2014-15
Ministry of Social Development. (2016). The Social Report 2016. Wellington: Ministry of Social Development. Retrieved from http://socialreport.msd.govt.nz/documents/2016/msd-the-social-report-2016.pdf
Moody's. (2017, March 24). Rating Action: Moody's Affirms New Zealand's Aaa Issuer Rating; Maintains Stable Outlook. Retrieved from Moody's: https://www.moodys.com/research/Moodys-affirms-New-Zealands-Aaa-issuer-rating-maintains-stable-outlook--PR_363421
Mullainathan, S., & Shafir, E. (2013). Scarcity: Why Having So Little Means So Much. New York: Times Books.
Nana, G. (2014, April 28). Live Chat: Ignoring Economic Diversity the Road to Ruin. Retrieved from NZHerald.co.nz: http://www.nzherald.co.nz/element-magazine/news/article.cfm?c_id=1503340&objectid=11245524
NCH. (2007). Literature Review: Resilience in Children and Young People. London: NCH. Retrieved from https://www.actionforchildren.org.uk/media/3420/resilience_in_children_in_young_people.pdf
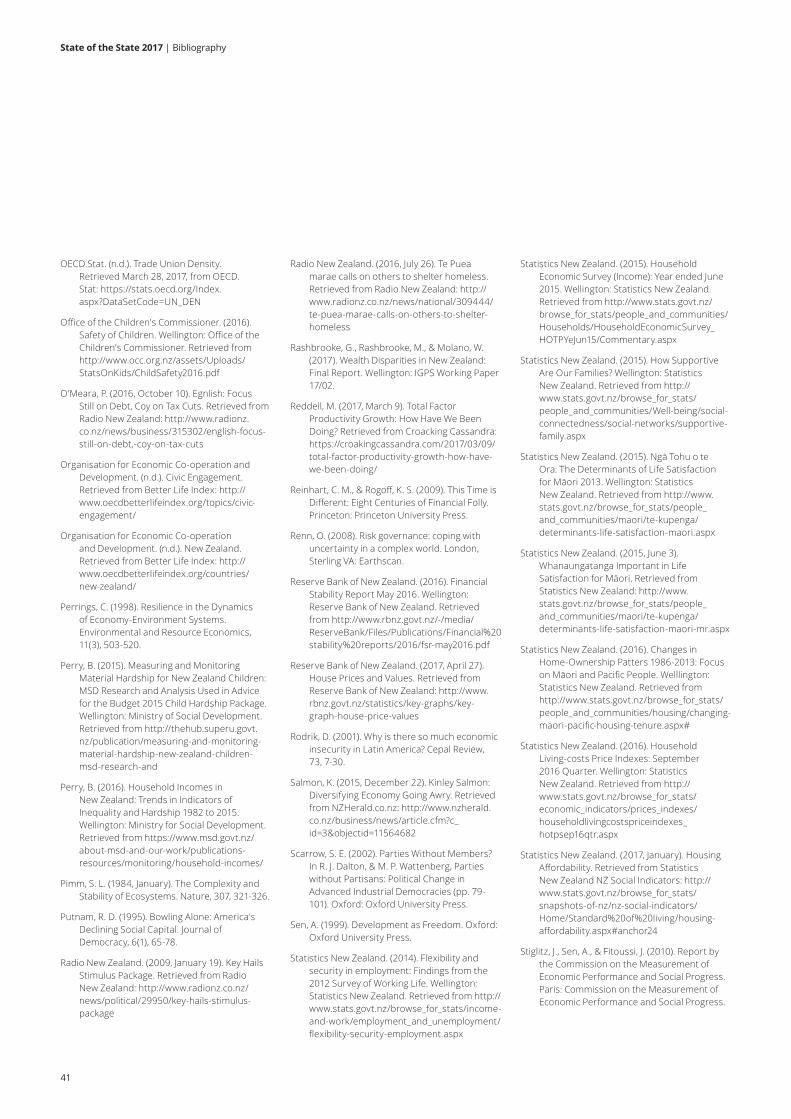
State of the State 2017 | Bibliography
41
OECD.Stat. (n.d.). Trade Union Density. Retrieved March 28, 2017, from OECD.Stat: https://stats.oecd.org/Index.aspx?DataSetCode=UN_DEN
Office of the Children's Commissioner. (2016). Safety of Children. Wellington: Office of the Children's Commissioner. Retrieved from http://www.occ.org.nz/assets/Uploads/StatsOnKids/ChildSafety2016.pdf
O'Meara, P. (2016, October 10). Egnlish: Focus Still on Debt, Coy on Tax Cuts. Retrieved from Radio New Zealand: http://www.radionz.co.nz/news/business/315302/english-focus-still-on-debt,-coy-on-tax-cuts
Organisation for Economic Co-operation and Development. (n.d.). Civic Engagement. Retrieved from Better Life Index: http://www.oecdbetterlifeindex.org/topics/civic-engagement/
Organisation for Economic Co-operation and Development. (n.d.). New Zealand. Retrieved from Better Life Index: http://www.oecdbetterlifeindex.org/countries/new-zealand/
Perrings, C. (1998). Resilience in the Dynamics of Economy-Environment Systems. Environmental and Resource Economics, 11(3), 503-520.
Perry, B. (2015). Measuring and Monitoring Material Hardship for New Zealand Children: MSD Research and Analysis Used in Advice for the Budget 2015 Child Hardship Package. Wellington: Ministry of Social Development. Retrieved from http://thehub.superu.govt.nz/publication/measuring-and-monitoring-material-hardship-new-zealand-children-msd-research-and
Perry, B. (2016). Household Incomes in New Zealand: Trends in Indicators of Inequality and Hardship 1982 to 2015. Wellington: Ministry for Social Development. Retrieved from https://www.msd.govt.nz/about-msd-and-our-work/publications-resources/monitoring/household-incomes/
Pimm, S. L. (1984, January). The Complexity and Stability of Ecosystems. Nature, 307, 321-326.
Putnam, R. D. (1995). Bowling Alone: America's Declining Social Capital. Journal of Democracy, 6(1), 65-78.
Radio New Zealand. (2009, January 19). Key Hails Stimulus Package. Retrieved from Radio New Zealand: http://www.radionz.co.nz/news/political/29950/key-hails-stimulus-package
Radio New Zealand. (2016, July 26). Te Puea marae calls on others to shelter homeless. Retrieved from Radio New Zealand: http://www.radionz.co.nz/news/national/309444/te-puea-marae-calls-on-others-to-shelter-homeless
Rashbrooke, G., Rashbrooke, M., & Molano, W. (2017). Wealth Disparities in New Zealand: Final Report. Wellington: IGPS Working Paper 17/02.
Reddell, M. (2017, March 9). Total Factor Productivity Growth: How Have We Been Doing? Retrieved from Croacking Cassandra: https://croakingcassandra.com/2017/03/09/total-factor-productivity-growth-how-have-we-been-doing/
Reinhart, C. M., & Rogoff, K. S. (2009). This Time is Different: Eight Centuries of Financial Folly. Princeton: Princeton University Press.
Renn, O. (2008). Risk governance: coping with uncertainty in a complex world. London, Sterling VA: Earthscan.
Reserve Bank of New Zealand. (2016). Financial Stability Report May 2016. Wellington: Reserve Bank of New Zealand. Retrieved from http://www.rbnz.govt.nz/-/media/ReserveBank/Files/Publications/Financial%20stability%20reports/2016/fsr-may2016.pdf
Reserve Bank of New Zealand. (2017, April 27). House Prices and Values. Retrieved from Reserve Bank of New Zealand: http://www.rbnz.govt.nz/statistics/key-graphs/key-graph-house-price-values
Rodrik, D. (2001). Why is there so much economic insecurity in Latin America? Cepal Review, 73, 7-30.
Salmon, K. (2015, December 22). Kinley Salmon: Diversifying Economy Going Awry. Retrieved from NZHerald.co.nz: http://www.nzherald.co.nz/business/news/article.cfm?c_id=3&objectid=11564682
Scarrow, S. E. (2002). Parties Without Members? In R. J. Dalton, & M. P. Wattenberg, Parties without Partisans: Political Change in Advanced Industrial Democracies (pp. 79-101). Oxford: Oxford University Press.
Sen, A. (1999). Development as Freedom. Oxford: Oxford University Press.
Statistics New Zealand. (2014). Flexibility and security in employment: Findings from the 2012 Survey of Working Life. Wellington: Statistics New Zealand. Retrieved from http://www.stats.govt.nz/browse_for_stats/income-and-work/employment_and_unemployment/flexibility-security-employment.aspx
Statistics New Zealand. (2015). Household Economic Survey (Income): Year ended June 2015. Wellington: Statistics New Zealand. Retrieved from http://www.stats.govt.nz/browse_for_stats/people_and_communities/Households/HouseholdEconomicSurvey_HOTPYeJun15/Commentary.aspx
Statistics New Zealand. (2015). How Supportive Are Our Families? Wellington: Statistics New Zealand. Retrieved from http://www.stats.govt.nz/browse_for_stats/people_and_communities/Well-being/social-connectedness/social-networks/supportive-family.aspx
Statistics New Zealand. (2015). Ngā Tohu o te Ora: The Determinants of Life Satisfaction for Māori 2013. Wellington: Statistics New Zealand. Retrieved from http://www.stats.govt.nz/browse_for_stats/people_and_communities/maori/te-kupenga/determinants-life-satisfaction-maori.aspx
Statistics New Zealand. (2015, June 3). Whanaungatanga Important in Life Satisfaction for Māori. Retrieved from Statistics New Zealand: http://www.stats.govt.nz/browse_for_stats/people_and_communities/maori/te-kupenga/determinants-life-satisfaction-maori-mr.aspx
Statistics New Zealand. (2016). Changes in Home-Ownership Patters 1986-2013: Focus on Māori and Pacific People. Welllington: Statistics New Zealand. Retrieved from http://www.stats.govt.nz/browse_for_stats/people_and_communities/housing/changing-maori-pacific-housing-tenure.aspx#
Statistics New Zealand. (2016). Household Living-costs Price Indexes: September 2016 Quarter. Wellington: Statistics New Zealand. Retrieved from http://www.stats.govt.nz/browse_for_stats/economic_indicators/prices_indexes/householdlivingcostspriceindexes_hotpsep16qtr.aspx
Statistics New Zealand. (2017, January). Housing Affordability. Retrieved from Statistics New Zealand NZ Social Indicators: http://www.stats.govt.nz/browse_for_stats/snapshots-of-nz/nz-social-indicators/Home/Standard%20of%20living/housing-affordability.aspx#anchor24
Stiglitz, J., Sen, A., & Fitoussi, J. (2010). Report by the Commission on the Measurement of Economic Performance and Social Progress. Paris: Commission on the Measurement of Economic Performance and Social Progress.
State of the State 2017 | Bibliography
42
Superu. (2015). In Focus: Family Resilience. Wellington: Superu. Retrieved from http://www.superu.govt.nz/sites/default/files/In%20Focus%20Family%20Resilience%202015.pdf
The Economist. (2017, January 11). The Curious Case of Missing Global Productivity Growth. Retrieved from The Economist: http://www.economist.com/blogs/buttonwood/2017/01/light-bulb-moment
Treasury. (2013). Affording Our Future: Statement on New Zealand's Long-term Fiscal Position. Wellington: Treasury. Retrieved from http://www.treasury.govt.nz/government/longterm/fiscalposition/2013/affordingourfuture
Treasury. (2013). Living Standards Background Note: 'Social Infrastructure'. Wellington: Treasury. Retrieved from http://www.treasury.govt.nz/abouttreasury/higherlivingstandards
Treasury. (2013, January). Special Topic: New Zealand's External Debt - An International Comparison. Retrieved from The Treasury: http://www.treasury.govt.nz/economy/mei/jan13/03.htm
Treasury. (2016). Conversations About Things That Matter. Wellington: Treasury. Retrieved from http://www.treasury.govt.nz/government/longterm/fiscalposition/2016/ltfs-16-bg-conv.pdf
Treasury. (2016). He Tirohanga Mokopuna: 2016 Statement on the Long-term Fiscal Position. Wellington: Treasury.
Walker, B. (2014). Understanding Resilience and Reducing Future Vulnerabilities in Social-Ecological Systems. In J. Boston, J. Wanna, V. Lipski, & J. Pritchard (Eds.), Future-Proofing the State (pp. 123-134). Wellington: ANU Press.
Wolf, M. (2015). The Shifts and the Shocks: What We've Learned - and Have Still to Learn - from the Financial Crisis. New York: Penguin.
Zuccollo, J., Maani, S., Kay-Blake, B., & Zeng, L. (2013). Private Returns to Tertiary Education: How Does New Zealand Compare to the OECD? Wellington: Treasury.

State of the State 2017 | Contact
43
Leaders
Linda Meade Partner, Economics practice Deloitte
Tel: +64 (4) 470 3788 Email: [email protected]
Adithi Pandit Partner, Social Impact practice Deloitte
Tel: +64 (4) 470 3871 Email: [email protected]
Michael Macaulay Associate Dean, Professional Education, Victoria Business School Victoria University of Wellington
Tel: +64 (4) 463 9672 Email: [email protected]
Dave Farrelly Lead Partner, Public Sector Deloitte
Tel: +64 (4) 470 3623 Email: [email protected]
To continue the conversation, please contact:
Key contributors
Acknowledgements
Deloitte and the School of Government at Victoria University of Wellington would like to thank all those who contributed to this report, including those who generously gave their time to be interviewed, or who provided feedback and advice during its development.
Special thanks to Nero Panapa (Te Arawa, Ngāti Tūwharetoa, Ngāti Whātua, Mataatua) for gifting us the whakatauki which opens this report.
Authors
State of the State 2017 authors include:
Cassandra Favager Principal Author Deloitte
Toby Moore Principal Author Victoria University of Wellington
Jeff Brandt Deloitte
Jason Tabarias Deloitte

Deloitte refers to one or more of Deloitte Touche Tohmatsu Limited, a UK private company limited by guarantee (“DTTL”), its network of member firms, and their related entities. DTTL and each of its member firms are legally separate and independent entities. DTTL (also referred to as “Deloitte Global”) does not provide services to clients. Please see www.deloitte.com/about for a more detailed description of DTTL and its member firms.
Deloitte provides audit, consulting, financial advisory, risk management, tax and related services to public and private clients spanning multiple industries. Deloitte serves four out of five Fortune Global 500® companies through a globally connected network of member firms in more than 150 countries bringing world-class capabilities, insights, and high-quality service to address clients’ most complex business challenges. To learn more about how Deloitte’s approximately 245,000 professionals make an impact that matters, please connect with us on Facebook, LinkedIn, or Twitter.
Deloitte New Zealand brings together more than 1200 specialist professionals providing audit, tax, technology and systems, strategy and performance improvement, risk management, corporate finance, business recovery, forensic and accounting services. Our people are based in Auckland, Hamilton, Rotorua, Wellington, Christchurch and Dunedin, serving clients that range from New Zealand’s largest companies and public sector organisations to smaller businesses with ambition to grow. For more information about Deloitte in New Zealand, look to our website www.deloitte.co.nz.
This communication contains general information only, and none of Deloitte Touche Tohmatsu Limited, its member firms, or their related entities (collectively, the “Deloitte network”) is, by means of this communication, rendering professional advice or services. No entity in the Deloitte network shall be responsible for any loss whatsoever sustained by any person who relies on this communication.
© 2017. For information, contact Deloitte Touche Tohmatsu Limited.
Go onlineFor more information on State of the State please visit:
www.deloitte.com/nz/stateofthestate The website includes:
• State of the State 2017 video
• State of the State 2017 infographics
• State of the State 2017 methodology document
• State of the State 2016: Social investment for our future


