2
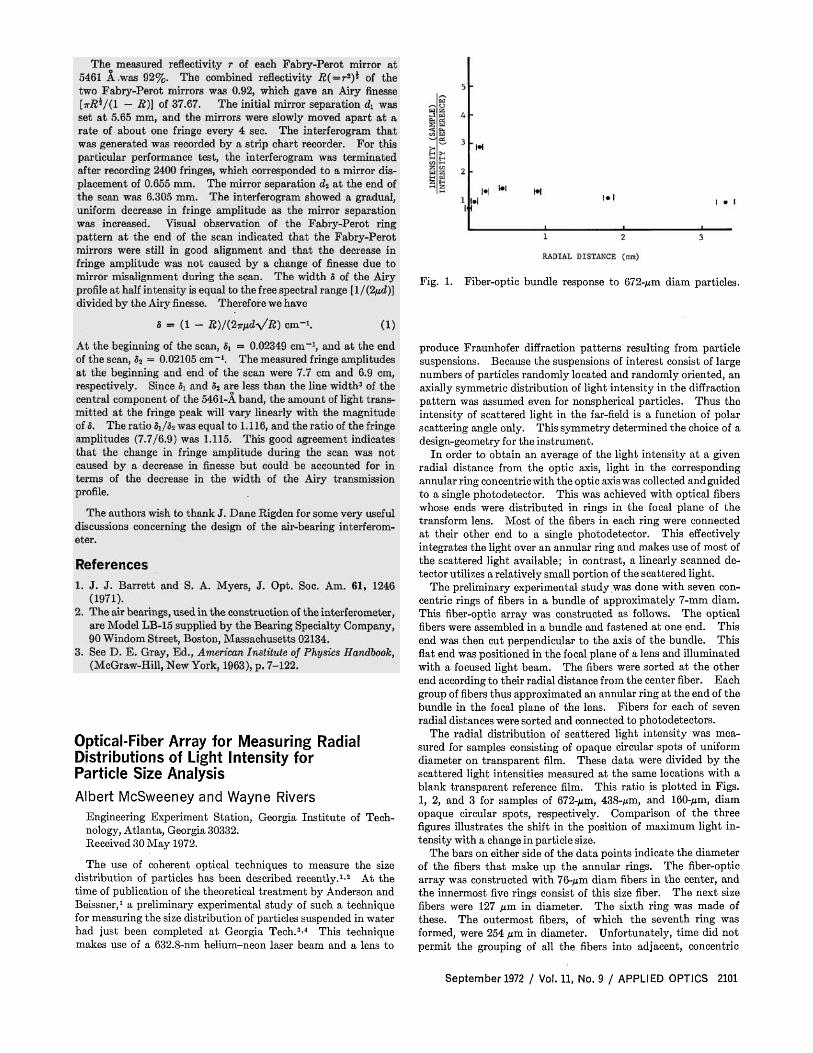
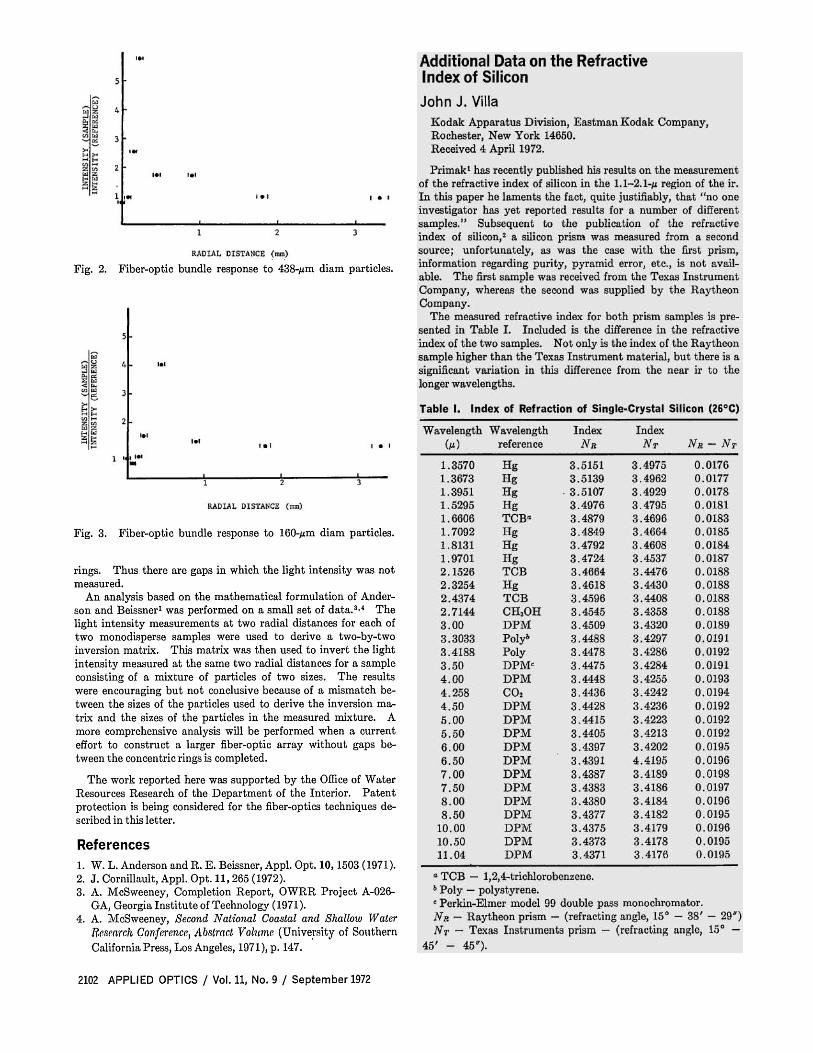
Optical-Fiber Array for Measuring Radial Distributions of Light Intensity for Particle Size Analysis Albert McSweeney and Wayne Rivers Engineering Experiment Station, Georgia Institute of Tech- nology, Atlanta, Georgia 30332. Received 30 May 1972. The use of coherent optical techniques to measure the size distribution of particles has been described recently. 1 - 2 At the time of publication of the theoretical treatment by Anderson and Beissner, 1 a preliminary experimental study of such a technique for measuring the size distribution of particles suspended in water had just been completed at Georgia Tech. 3 - 4 This technique makes use of a 632.8-nm helium-neon laser beam and a lens to Fig. 1. Fiber-optic bundle response to 672-μm diam particles. produce Fraunhofer diffraction patterns resulting from particle suspensions. Because the suspensions of interest consist of large numbers of particles randomly located and randomly oriented, an axially symmetric distribution of light intensity in the diffraction pattern was assumed even for nonspherical particles. Thus the intensity of scattered light in the far-field is a function of polar scattering angle only. This symmetry determined the choice of a design-geometry for the instrument. In order to obtain an average of the light intensity at a given radial distance from the optic axis, light in the corresponding annular ring concentric with the optic axis was collected and guided to a single photodetector. This was achieved with optical fibers whose ends were distributed in rings in the focal plane of the transform lens. Most of the fibers in each ring were connected at their other end to a single photodetector. This effectively integrates the light over an annular ring and makes use of most of the scattered light available; in contrast, a linearly scanned de- tector utilizes a relatively small portion of the scattered light. The preliminary experimental study was done with seven con- centric rings of fibers in a bundle of approximately 7-mm diam. This fiber-optic array was constructed as follows. The optical fibers were assembled in a bundle and fastened at one end. This end was then cut perpendicular to the axis of the bundle. This flat end was positioned in the focal plane of a lens and illuminated with a focused light beam. The fibers were sorted at the other end according to their radial distance from the center fiber. Each group of fibers thus approximated an annular ring at the end of the bundle in the focal plane of the lens. Fibers for each of seven radial distances were sorted and connected to photodetectors. The radial distribution of scattered light intensity was mea- sured for samples consisting of opaque circular spots of uniform diameter on transparent film. These data were divided by the scattered light intensities measured at the same locations with a blank transparent reference film. This ratio is plotted in Figs. 1, 2, and 3 for samples of 672-μm, 438-μm, and 160-μm, diam opaque circular spots, respectively. Comparison of the three figures illustrates the shift in the position of maximum light in- tensity with a change in particle size. The bars on either side of the data points indicate the diameter of the fibers that make up the annular rings. The fiber-optic array was constructed with 76-μm diam fibers in the center, and the innermost five rings consist of this size fiber. The next size fibers were 127 μm in diameter. The sixth ring was made of these. The outermost fibers, of which the seventh ring was formed, were 254 μm in diameter. Unfortunately, time did not permit the grouping of all the fibers into adjacent, concentric September 1972 / Vol. 11, No. 9 / APPLIED OPTICS 2101