Optical properties of solution-chemically derived thin film Ni–Al 2 O 3 composites and Si, Al and Si–Ti oxides This article has been downloaded from IOPscience. Please scroll down to see the full text article. 2006 J. Phys.: Condens. Matter 18 7737 (http://iopscience.iop.org/0953-8984/18/32/021) Download details: IP Address: 35.8.11.2 The article was downloaded on 09/03/2013 at 14:29 Please note that terms and conditions apply. View the table of contents for this issue, or go to the journal homepage for more Home Search Collections Journals About Contact us My IOPscience
Transcript
Optical properties of solution-chemically derived thin film Ni–Al2O3 composites and Si, Al and
Si–Ti oxides
This article has been downloaded from IOPscience. Please scroll down to see the full text article.
2006 J. Phys.: Condens. Matter 18 7737
(http://iopscience.iop.org/0953-8984/18/32/021)
Download details:
IP Address: 35.8.11.2
The article was downloaded on 09/03/2013 at 14:29
Please note that terms and conditions apply.
View the table of contents for this issue, or go to the journal homepage for more
Home Search Collections Journals About Contact us My IOPscience
Received 28 April 2006, in final form 13 July 2006Published 31 July 2006Online at stacks.iop.org/JPhysCM/18/7737
AbstractThe refractive index in the wavelength range 350–2500 nm of solar absorbingand anti-reflecting thin films was determined from reflectance and transmittancemeasurements. Knowing the refractive indices of such films was importantwhen designing an optimized spectrally selective surface for solar thermalusage. The absorbing thin films were made of nickel–alumina composites witha nickel content varying from 20 to 80%. The anti-reflecting films were madeof silica, hybrid-silica, alumina and silica–titania composites.
(Some figures in this article are in colour only in the electronic version)
1. Introduction
This work is related to preceding studies of highly spectrally selective and durable solution-chemically derived solar thermal absorbers. Advantages of this novel technique to manufacturethin film nickel–alumina composites are that it is simple and easy to control, the coatingcan be manufactured under ambient pressure conditions, and the process is low in materialconsumption. The method seems promising and could hopefully reduce production costsfor spectrally selective absorbers and hence make them less expensive and more readilyavailable. The produced selective absorber belongs to a group of absorbers called metal–dielectric composite/metal tandem, which normally consists of selectively absorbing thin filmswith metal nanoparticles embedded in a dielectric matrix applied on a highly reflecting metalsurface [1]. The studied selectively absorbing films are composed of nickel nanoparticles in asurrounding dielectric matrix of alumina, with varying proportions. In this case the optimizedsolar absorber is constructed out of an aluminium substrate that is coated with three layers:a highly absorbing nickel–alumina film at the base, a medium absorbing nickel–alumina filmin the middle and an anti-reflecting (AR) film at the top. The AR materials were made fromsilica, hybrid-silica or silica–titania mixtures. The solution-chemical routes to produce thesematerials are described in previous papers [2, 3].
In order to design the optimal three-layer combination a thin film simulation programCODE (Coating Designer) [4] was utilized. But to be able to use the program the opticalconstants of the thin film materials in question have to be known. Since the selectivelyabsorbing nickel–alumina material is newly invented there exist no refractive index dataon it. Wavelength dependent refractive index data on silica–titania materials were alsonot to be found. The program can however use empirical reflectance and transmittancemeasurement data of thin films coated on glass substrates to fit the corresponding refractiveindex [5]. The derivation of optical constants of transparent or semitransparent thin films on atransparent substrate is a well known method from a theoretical and practical point of view [6].Semitransparent thin selectively absorbing films of about 50–100 nm in thickness consisting ofdifferent volume percentages of nickel, ranging from 0 to 80%, were coated on glass and thereflectance and transmittance spectra between 350 and 2500 nm were measured. Equally thinAR films made of silica, hybrid-silica and silica–titania mixtures were also characterized usingthe same method. Silica is well known to be a very resilient but static material. In order tomake silica more flexible an organic compound can be incorporated into the structure and thenthe resulting material is called hybrid-silica [7].
A selective absorber is characterized by the two parameters normal solar absorptance andnormal thermal emittance [8]. The solar absorptance should ideally be 1, meaning that all solarenergy is absorbed. The thermal emittance value should ideally be 0, meaning that no heat islost through thermal radiation from the absorber surface. The optimized solution-chemicallyderived patented selective absorber achieves a very high efficiency, a normal solar absorptanceof 0.97 and a normal thermal emittance of 0.05 [3].
This paper focuses on deriving the optical properties of the absorbing and AR thin filmmaterials which were necessary to be able to design an optimized three-layer nickel–aluminaabsorber. The design of the optimized three-layer absorber was published earlier [3] but theoptical constants on which the optimized absorber was based were not, and the purpose of thispaper is thus to publish the optical constants of the novel nickel–alumina composite. The ARsilica/titania mixture material is not novel but there exist no published wavelength dependentrefractive index data and thus we publish these data as well. The refractive index of silica (andhybrid-silica) is of course well known but is included for comparison and discussion.
2. Method
Several approaches can be pursued [9] but the method used in this paper was to simultaneouslyfit reflectance and transmittance spectra using a thin film fitting program. In this case the pro-gram utilizes measured reflectance and transmittance spectra of thin films coated on transparent500 µm thick, type 7059 Corning glass substrates to fit the corresponding complex refractive in-dex. In order to avoid a sharp absorption peak at λ < 320 nm originating from the Corning glasssubstrate, the fitting of all prepared samples was performed in the wavelength interval 350–2500 nm. White light interferometry shows that the Corning glass has an rms value of 0.85 nm.
The normal reflectance and transmittance was measured by a Perkin-Elmer Lambda 900spectrophotometer equipped with an integrating sphere of diameter 150 mm, and a circularbeam entrance with reflectance and transmittance sample ports of 19 and 25 mm respectively.Spectralon was used as a reference substrate. The measurement reproducibility of the Lambda900 is within 99.8%. Other measurement errors deriving from the geometry of the sphere andthe surface structure of the sample are less than 0.5%.
Roughness and reference thickness measurements of the thin film samples were madeusing a White Light Interferometer (WLI) of type Wyko NT-1100. An area of about 2 ×2 mm2
could be viewed when using the 2.5× objective.
Optical properties of Ni–Al2O3 composites and Si, Al and Si–Ti oxides 7739
2.1. Dispersion models
The first step in order to derive the optical constants using a refractive index fitting program isto define dispersion models for the various studied materials, including the glass substrate.
2.1.1. Corning glass. The decaying Cauchy dispersion model was used for the substrateglass [10]; see equation (1). By avoiding absorption peaks in the infrared and ultraviolet fromthe crystalline silica and only looking in the interval 350–2500 nm, ε2 is equal to 0.
ε1 = c1 + c2
λ2. (1)
The variable c1 represents the constant level in the long wavelength range of the interval, and c2
fits the decay rate of ε1. The Corning glass substrate was hence fitted using two free variables,c1 and c2; the thickness d was fixed to 500 µm.
2.1.2. Oxides. We are aware of that we use a mathematical model (equation (2)) where ε1
and ε2 are independent of each other. These models are applicable when analysing the opticalproperties in the wavelength side of strong absorption due to interband transitions. For thematerials in question the long wavelength range is λ > 300 nm.
The dispersion model, see equation (2), for the alumina, silica, hybrid-silica, and twosilica–titania oxide composites is not based on physically describing model; it is rather anempirical mathematical dispersion model [5]. Equation (2) is very similar to the widespread andaccepted Cauchy model which also utilizes a non-correlated ε1 and ε2 model. The mathematicalmodel presented here is motivated since it gives a better fit compared to the Cauchy model.These models are applicable when analysing the optical properties for the materials in questionin the long wavelength side of strong absorption related to interband transitions, that is forλ > 300 nm. When deriving the refractive index in such a narrow wavelength interval, 350–2500 nm, it is very difficult to make a reliable Kramers–Kronig transformation.
ε1 = c1 exp((350 − λ)/c2) + c3. (2a)
ε2 = c4 exp((350 − λ)/c5) + c6. (2b)
The variables c1 and c4 fit the function values for ε1 and ε2 respectively, at a wavelength λ
between 350 and 2500 nm. c2 and c5 fit the decay rates of each function. c3 and c6 are theconstant levels in the long wavelength range of the interval. The previously derived refractiveindex for the Corning glass according to equation (1) was imported and added as the basesubstrate when determining the refractive index of the dielectric oxides. These oxides werethus fitted using seven free variables, c1–c6 and the thickness, d .
2.1.3. Nickel–alumina composite. Scanning and transmission electron microscopy (SEM andTEM) studies have shown that the nickel particle size is of the order of 5–10 nm [2, 3]. Theaggregates are thus much smaller than the wavelength of the light in the studied wavelengthinterval. The alumina and nickel composite could consequently be considered as an effectivemedium component according to the Bruggeman model [11]:
(1 − f )εAl2O3 − εeff
εAl2O3 + 2εeff+ f
εNi − εeff
εNi + 2εeff= 0 (3)
where εNi is the complex dielectric function for nickel, taken from the literature [12], andεAl2O3 is the complex dielectric function for alumina. Note that the derived refractive index forpure alumina was not used; instead the alumina in each nickel–alumina composite was refittedaccording to equation (2). The effective medium dielectric function of the composite film
Figure 1. Reflectance and transmittance example graphs of the nickel–alumina composites studied.
is denoted εeff and the volume fraction nickel is denoted f . The previously derived refractiveindex for the Corning glass according to equation (1) was however also imported here and addedas the base substrate. The nickel–alumina composite was consequently the most complex, beingfitted with eight free variables, c1–c6, d and the volume fraction, f .
2.2. Reflectance and transmittance spectra
Reflectance and transmittance spectra were measured for the semitransparent thin films coatedon Corning glass. The films were either selectively absorbing thin films consisting of differentvolume percentages of nickel ranging from 20 to 80% or AR films made of silica, hybrid-silica, alumina and silica–titania mixtures. Examples of reflectance and transmittance graphsof nickel–alumina films can be seen in figure 1.
2.3. Fitting procedure
Reflectance and transmittance data were imported into the fitting program (CODE). Theprogram utilizes a least deviation method to calculate the free variables. After reasonable startvalues are found manually, an automatic fit function can be activated. The automatic parameterfit for each parameter set is done by a routine that utilizes a downhill simplex algorithm. Thedownhill simplex method is a simple but stable algorithm that minimizes the sum of squarederrors, i.e. the fit deviation [13, 14].
In almost all cases this method will find the next local minimum of the fit deviation. Thereis, however, no guarantee that this is the global minimum as well. The risk of getting anincorrect solution was minimized by selecting good starting values close to the global minimumand by inspecting the final solution carefully. A list of the fitted parameter values can befound in table A.1 in the appendix (the nomenclature N40A60 is explained in the caption). Anexample of fitted reflectance and transmitted data for an N40A60 film can be seen in figure 2.
Optical properties of Ni–Al2O3 composites and Si, Al and Si–Ti oxides 7741
1000 2000Wavelength [nm]
0.12
0.16
0.20
Ref
lect
ance
1000 2000Wavelength [nm]
0.5
0.6
0.7
0.8
0.9
Tra
nsm
ittan
ce
Figure 2. Fitted reflectance and transmitted data for a 56 nm N40A60 film: the jagged linerepresents the spectrophotometer data and the smooth line the fit. Observe the high resolutionscale especially on the reflectance graph.
Table 1. Thickness (d) and volume fraction ( f ) of nickel derived from the fitting program for thevarious thin films studied. S = silica, HS = hybrid-silica (80 mol% silica and 20 mol% hybrid-silica), A = alumina, SxxTyy = silica–titania (xx mol% silica and yy mol% titania), NxxAyy =nickel–alumina (xx vol% nickel and yy vol% alumina). The subscript refers to the sample number(i.e. for N40A60 there are 3 samples).
Material S/HS A S70T30 S50T50 N20A80 N40A60 N60A40 N65A35 N80A20
The solution-chemical route for the alumina and a nickel precursor solution is under a patentingprocess and can therefore not be described. The silica and hybrid-silica sol–gel productionroutes originate from a paper by Tadanaga et al [7]. The silica–titania mixtures were producedwith a sol–gel technique originating from Dawnay et al [15]. The exact recipes that were usedin this paper are described in [3]. The spin coated films are very uniform and homogenous withan rms value of around 3 nm.
4. Results
4.1. Volume fraction and thickness
The volume fractions found by the fitting program are presented in table 1. CODE in thiscase uses the Bruggeman approximation and the volume fraction according to equation (3). Atleast two samples with varying thicknesses were prepared for all material compositions studied;see table 1. The refractive index was obtained through the fitting process for each individual
7742 T K Bostrom and E Wackelgard
sample. The error limits, shown as grey lines in the graphs, were derived from calculating thestandard deviation between the two to four samples for each material.
Reference thickness measurements were performed using the WLI. The WLI thicknessesobtained normally correlated very well (±5 nm) with the derived thicknesses from the thinfilm program. There was however an exception for silica/hybrid-silica samples and for sampleswith 65% nickel or more: here CODE typically overestimates the thicknesses by up to 20%.Thicknesses in table 1 with an asterisk indicate that the WLI obtained value was used and thenfixed when deriving the refractive index.
4.2. Corning 7059 glass
The refractive index was found to be 1.57 at 350 nm, 1.55 at 436 nm, 1.53 at 644 nm and 1.52at 2500 nm. The imaginary part is equal to zero over the whole spectrum. The tabled refractiveindex of crystalline type αSiO2 is equal to 1.57 at 350 nm, 1.55 at 436 nm, 1.54 at 644 nm and1.51 at 2500 nm [12]. The alkali level in the 7059 Corning glass is less than 0.3%, making itvery close to pure crystalline SiO2. Vin Karola Instruments state a refractive index of the 7059Corning glass of 1.54 at 436 nm and 1.53 at 644 nm [16]. The refractive index found in thisstudy for 7059 Corning glass thus matches the tabled and stated values very well.
Table A.1 in the appendix shows the parameter values from the dispersion model used,equation (1). These values were fixed in the following fits having the Corning glass as substrate.
4.3. Nickel–alumina
Table A.1 in the appendix shows the parameter values c1–c6 for the alumina related to the useddispersion model; see equation (2). All samples in this section were annealed to 550 ◦C.
4.3.1. Pure alumina. Shamala et al have determined the real part of the refractive index tobe 1.61 and 1.58 at 500 nm for an evaporated and a spray-pyrolysed amorphous alumina thinfilm, respectively [17]. Shamala et al have however not stated or mentioned anything about theimaginary part. Eriksson et al have investigated amorphous evaporated alumina, also only forthe real part of the refractive index but in the interval 400–2100 nm, where the refractive indexwas measured to be 1.62 and 1.57 at 400 and 2100 nm, respectively [18]. The real part of therefractive index for the solution-chemically derived alumina films in this study seen in figure 3is 1.64±0.02 at 400 nm, 1.63±0.02 at 500 nm and 1.58 at 2100 nm. The corresponding valuesfor the imaginary part seen in figure 4 are 0.05 ± 0.02, 0.03 ± 0.01 and 0.00. Previous x-raydiffraction studies have shown that the solution-chemically derived alumina is amorphous [2].
4.3.2. Nickel–alumina composites. As the nickel content gradually increases, both the realand imaginary refractive index increase. The nickel nanoparticles are heavily absorbing,especially in the solar spectrum. The extinction coefficient exhibits a peak around 500 nmwhich originates from the absorptive nickel nanoparticles. The absorption peak, seen infigure 4, shifts from 400 nm for samples with 20% nickel to 600 nm for samples with 65%nickel. This shift in the absorption peak can be derived from the Bruggeman formula and hasbeen reported earlier [19]. The composite can be characterized as a dielectric material with adecreasing complex refractive index with wavelength in the near-infrared wavelength range fornickel contents between 20 and 60%; see figure 4.
Composites with 65% nickel are on the verge of becoming metallic, still showing adecrease in k but now with a steady increase in n in the near-infrared wavelength range; seefigures 3 and 4. For composites with 80% nickel, see figure 5, k as well as n increases withincreasing wavelength, implying an optically metallic behaviour; there is conclusively a gradual
Optical properties of Ni–Al2O3 composites and Si, Al and Si–Ti oxides 7743
0
0.5
1
1.5
2
2.5
3
3.5
500 1000 1500 2000 2500
n - An - N20A80n - N40A60n - N60A40n - N65A35
Ref
ract
ive
inde
x (n
)
Wavelength (nm)
Figure 3. The real part (n) of the average refractive index of pure alumina (A) to 65%nickel–35%alumina (N65A35) thin film samples; the grey lines represent the standard deviation.
0
0.2
0.4
0.6
0.8
1
500 1000 1500 2000 2500
k - Ak - N20A80k - N40A60k - N60A40k - N65A35
Ref
ract
ive
inde
x (k
)
Wavelength (nm)
Figure 4. The imaginary part (k) of the average refractive index of pure alumina (A) to 65%nickel–35%alumina (N65A35) thin film samples; the grey lines represent the standard deviation.
transition to a more metallic behaviour of the nickel–alumina composite somewhere between anickel percentage of 65–80. However, an absorption bulge can still be seen but at 700 nm, seefigure 5, for the 80% nickel samples, which indicates that the nickel particles are still separatedand have not agglomerated completely. Transmission electron microscopy studies pending
7744 T K Bostrom and E Wackelgard
0
0.5
1
1.5
2
2.5
3
3.5
500 1000 1500 2000 2500
n - 80%nickel-20%aluminak - 80%nickel-20%alumina
Ref
ract
ive
inde
x
Wavelength (nm)
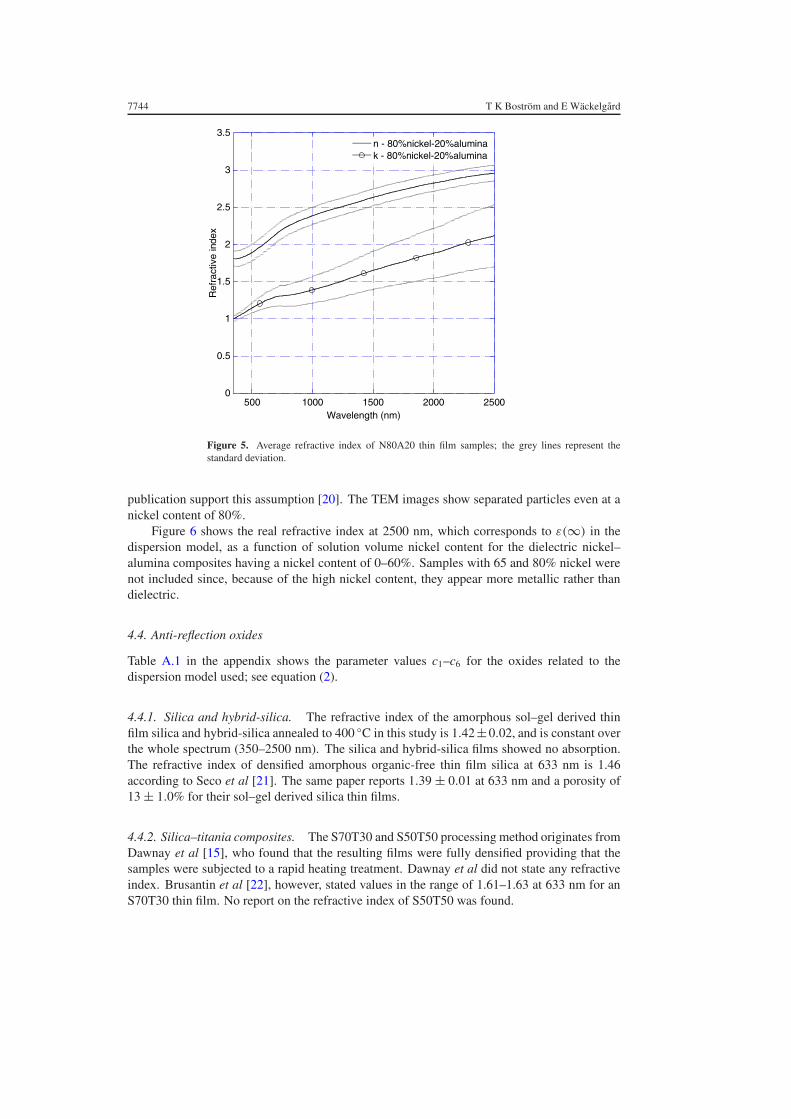
Figure 5. Average refractive index of N80A20 thin film samples; the grey lines represent thestandard deviation.
publication support this assumption [20]. The TEM images show separated particles even at anickel content of 80%.
Figure 6 shows the real refractive index at 2500 nm, which corresponds to ε(∞) in thedispersion model, as a function of solution volume nickel content for the dielectric nickel–alumina composites having a nickel content of 0–60%. Samples with 65 and 80% nickel werenot included since, because of the high nickel content, they appear more metallic rather thandielectric.
4.4. Anti-reflection oxides
Table A.1 in the appendix shows the parameter values c1–c6 for the oxides related to thedispersion model used; see equation (2).
4.4.1. Silica and hybrid-silica. The refractive index of the amorphous sol–gel derived thinfilm silica and hybrid-silica annealed to 400 ◦C in this study is 1.42±0.02, and is constant overthe whole spectrum (350–2500 nm). The silica and hybrid-silica films showed no absorption.The refractive index of densified amorphous organic-free thin film silica at 633 nm is 1.46according to Seco et al [21]. The same paper reports 1.39 ± 0.01 at 633 nm and a porosity of13 ± 1.0% for their sol–gel derived silica thin films.
4.4.2. Silica–titania composites. The S70T30 and S50T50 processing method originates fromDawnay et al [15], who found that the resulting films were fully densified providing that thesamples were subjected to a rapid heating treatment. Dawnay et al did not state any refractiveindex. Brusantin et al [22], however, stated values in the range of 1.61–1.63 at 633 nm for anS70T30 thin film. No report on the refractive index of S50T50 was found.
Optical properties of Ni–Al2O3 composites and Si, Al and Si–Ti oxides 7745
0
0.5
1
1.5
2
2.5
0 10 20 30 40 50 60
Ref
ract
ive
inde
x (n
) at
250
0 nm
Volume per cent nickel
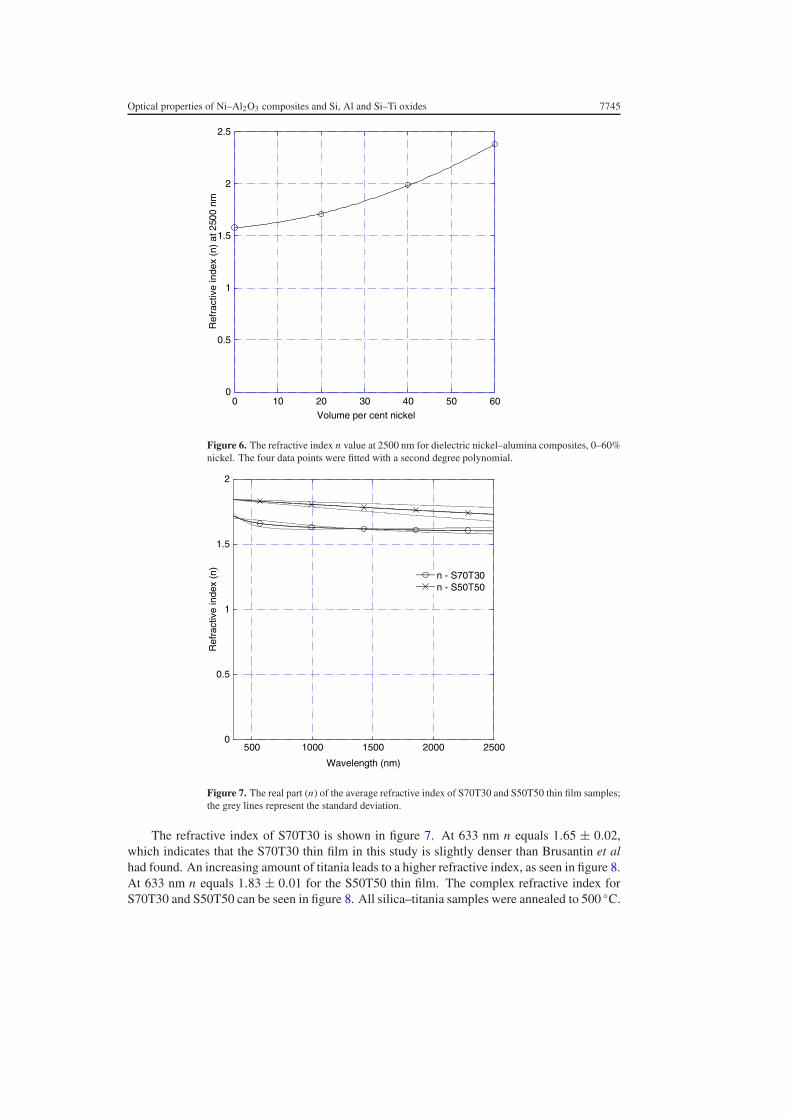
Figure 6. The refractive index n value at 2500 nm for dielectric nickel–alumina composites, 0–60%nickel. The four data points were fitted with a second degree polynomial.
0
0.5
1
1.5
2
500 1000 1500 2000 2500
n - S70T30n - S50T50
Ref
ract
ive
inde
x (n
)
Wavelength (nm)
Figure 7. The real part (n) of the average refractive index of S70T30 and S50T50 thin film samples;the grey lines represent the standard deviation.
The refractive index of S70T30 is shown in figure 7. At 633 nm n equals 1.65 ± 0.02,which indicates that the S70T30 thin film in this study is slightly denser than Brusantin et alhad found. An increasing amount of titania leads to a higher refractive index, as seen in figure 8.At 633 nm n equals 1.83 ± 0.01 for the S50T50 thin film. The complex refractive index forS70T30 and S50T50 can be seen in figure 8. All silica–titania samples were annealed to 500 ◦C.
7746 T K Bostrom and E Wackelgard
0
0.05
0.1
0.15
500 1000 1500 2000 2500
k - S70T30k - S50T50
Ref
ract
ive
inde
x (k
)
Wavelength (nm)
Figure 8. The imaginary part (k) of the average refractive index of S70T30 and S50T50 thin filmsamples; the grey lines represent the standard deviation.
5. Discussion
5.1. Optical constants
It would be interesting to make a Kramers–Kronig transformation of the results and hencecheck the reliability of the optical constants. However, since the refractive index informationwas only derived in such a short wavelength interval, 350–2500 nm, it is very difficult to makea reliable Kramers–Kronig transformation, and thus it was not done.
The derived optical constants for the silica, hybrid-silica, alumina and silica–titania thinfilm materials were, however, verified through references; see section 4. The solution-chemicalprocessing method for the nickel–alumina composite presented here is novel but it is ofinterest to compare the optical properties of this material to similar nickel–alumina compositesmanufactured through other thin film deposition techniques.
What could be easily verified were the derived thicknesses from the thin film program.Reference white light interferometry thickness measurements normally showed a very goodagreement, ±3 nm. However, CODE seemed to slightly overestimate thicknesses of sampleswith 65 or 80% nickel, by up to 10 nm.
5.1.1. Nickel–alumina. Craighead et al [23] produced nickel–alumina composites usingcoevaporation of metal and dielectric. The nickel particles can be seen in transmission electronmicroscope images and the size is in the range 1–10 nm. Sathiaraj et al [24] manufacturednickel–alumina composites using RF sputtering with two composite targets. These sputterednickel particles were very fine, too small to be resolved in an electron microscope. However,Sathiaraj et al do have confirmed crystalline nickel in the composite, verified by an electrondiffractogram. The solution-chemically derived nickel–alumina composite studied in this paperhas nickel particles ranging from about 5–10 nm and is hence more similar to the evaporatedrather than the sputtered composite. Both Craighead et al and Sathiaraj et al have derived their
Optical properties of Ni–Al2O3 composites and Si, Al and Si–Ti oxides 7747
optical constants, separately at each measured wavelength in the interval 300–2500 nm, usingreflectance and transmittance measurements and the Fresnel equations. The method appliedin this paper was instead to use reflectance and transmittance measurements that were leastsquare fitted over the whole measured interval, 350–2500 nm, using dispersion and Bruggemanmodels. The models generated the free parameters c1–c6, d and f which then were utilized tocalculate the wavelength dependent optical constants.
Craighead et al have also modelled the refractive index using the Maxwell–Garnet (MG)theory and has found that this theory worked well for composites with metal volume fractionsless than 0.2. Sathiaraj also modelled their composites but using both MG and Bruggemantheories. The latter found as well that the MG model worked well for volume fractions below0.2, and the Bruggeman model only worked well for volume fractions around 0.4. Craigheadet al present refractive index graphs with MG volume fractions between 0.14 and 0.39 [19, 23]which agree very well with N40A60 and N65A35 in figure 3. The n value at 2500 nm is 1.9and 2.8 respectively for the two composites presented by Craighead et al. The corresponding nvalue for N40A60 is 1.99 ± 0.03 and 2.76 ± 0.17 for N65A35.
Sathiaraj et al present refractive index graphs with actual volume percentages of 0.21, 0.42,0.57 and 0.61 [24]. These graphs do not agree that well with the derived optical constants foundin this study. The largest difference lies in the extinction coefficient. Since the composites madeby Sathiaraj do not have distinguishable metal particles there consequently is no absorptionpeak in k. Sathiaraj et al instead show a more or less constant k in the whole interval 300–2500 nm. As pointed out previously, figures 4 and 5 show clearly defined absorption peaks ink at around 500–700 nm deriving from the nickel nanoparticles.
It can be noted that the standard deviation increases with a nickel content of 65% or more.On looking in table 1, it can be seen that the volume fractions are very similar for sampleswith 60% nickel or less, in per cent units. But for the more metallic samples with 65 or 80%nickel the volume fraction varies to some degree. The increase in standard deviation can partlybe explained by this variation in volume fraction. A variation in the volume fraction for highnickel percentage samples will especially affect the extinction coefficient. Accordingly thelargest standard deviation is seen in the k value for N65A35 and N80A20.
5.1.2. Silica. A refractive index of 1.42, as found in this study, would according to Seco et alcorrespond to a porosity of about 8%. Elastic recoil detection analysis (ERDA) of the silica andhybrid-silica in this study has shown an organic carbon residue of about four atomic relativeper cent for the silica thin films and 6% for the hybrid-silica, to be published in a pendingpaper. The lower n of 1.42, compared to 1.46, can partly be explained by the film porosity, butcontaminants like carbon can also influence the refractive index. Depending on how the carbonatoms are bound in the silica structure they can either decrease or increase the refractive index.The imaginary part of the refractive index was equal to zero for both silica and hybrid-silica.A constant value was, however, not expected since the tabled value for dense amorphous silica(glass) is 1.48 at 350 nm and 1.43 at 2500 nm [12].
5.2. Volume fractions
The abbreviations NxxAyy in table 1 refer to volume percentages in the coating solution ofnickel and alumina respectively, not in the solid resulting films. An ERDA of the studiednickel–alumina composites was made which show that the actual volume percentages in thesefilms correspond well with the calculated solution volume percentages. On the other hand thecalculated Bruggeman volume fractions derived from the fit and shown in table 1 correspondvery poorly with real values. The reason for this mismatch lies partly in the Bruggeman model.
7748 T K Bostrom and E Wackelgard
A Bruggeman volume fraction of about 35% or more according to the model means that thefill material has more or less percolated and the metal nickel particles would be in contactwith each other. As a result of this percolation behaviour the optical properties according tothe Bruggeman approximation would appear in this case very metallic for volume fractionsover 35%. This behaviour was not found in the nickel–alumina composite studied here.Transmission electron images, even of the N80A20 material, show separated particles, alsoto be published in a pending paper [20].
Another reason for the disparity between real and model volume fractions would be due tohighly dispersed nickel in the composite that changes the properties of the surrounding aluminamatrix. Both Craighead et al and Sathiaraj et al suggest this theory. They also found thatthe Maxwell–Garnet model as well, just as the Bruggeman model, deviates from real volumefraction values, especially for medium to high volume fractions.
The alumina in the nickel–alumina composite studied was refitted and not taken from thepreviously modelled pure alumina. The motive for remodelling is because the properties of thealumina in the nickel–alumina composite change slightly with increasing nickel content. Theamount of atomically dispersed nickel increases with increasing nickel content. The ERDAalso shows that the stoichiometry changes: there is slightly more oxygen present than 3/2 ofthe aluminium content for high nickel content composites. This indicates that the presence ofsmall amounts of other oxides, such as NiO, Ni2O3, increases with increasing nickel content. Itis therefore motivated to refit the alumina matrix for each sample. It was found that the fittingroutine worked much better when remodelling the alumina for each individual nickel–aluminacomposite.
5.3. Solar absorber layer structure
Finally we briefly discuss how the derived optical constants were utilized. Knowing therefractive indices of the thin film materials in this study it was possible to design an optimizedthree-layer absorber. According to a thin film stack calculation program it should be composedof a highly absorbing N80A20 film of 100 nm at the base, a medium absorbing N40A60 filmof 60 nm in the middle, and finally a pure dielectric silica or hybrid-silica film of 85 nm at thetop [3]. The WLI reference thickness measurements, see section 4.1, were not made when [3]was written and hence the 80% nickel and the silica layer thicknesses are overestimated byabout 20%.
An AR coating is most effective when its refractive index is equal to the square root of therefractive index of the material it is deposited on, which can be deduced from the Fresnelformula for thin films [25]. This formula is only valid for non-absorbing materials. Theconstant refractive index in near-infrared for the weakly absorbing mid N40A60 layer is 1.99.The square root of 1.99 is equal to 1.41, which corresponds well with the derived value for theAR material used, sol–gel derived thin film silica, which has a refractive index of 1.42 ± 0.02.The same calculation is not valid for the base and mid-layer because of the highly absorbingproperties of the N80A20 material.
6. Conclusions
There are differences in the structure and hence the optical properties between the nickel–alumina composite materials described here, by Craighead et al and by Sathiaraj et al. Themanufacturing method of a composite is important for the end properties of the material. Themain differences lie in the metal particle size and shape, the density and the porosity of thecomposite and the amount of atomically dispersed nickel in the dielectric.
Optical properties of Ni–Al2O3 composites and Si, Al and Si–Ti oxides 7749
Fitting the optical constants of the alumina matrix for each individual nickel–aluminamaterial as done in this study makes sense since the properties of the oxide change withvarying nickel contents. The derived refractive indices found here could thus be more accuratecompared to the work done by Craighead et al and Sathiaraj et al as they use the same tabledalumina refractive index for their varying composites. Concerning the refractive index ofnickel, a tabled value of crystalline nickel was used in this study which can be justified bythe fact that TEM investigations show crystalline nickel particles. However, the size of theparticles does affect the refractive index.
Conclusively, the empirical mathematical model to derive optical properties of thin filmmaterials from reflectance and transmittance measurements used in this article worked well.The refractive indices of nickel–alumina and silica–titania composites, alumina, silica andhybrid-silica were clearly stated and reproducible except for the nickel–alumina materialshaving a nickel content of 65% or more.
Acknowledgments
The authors would like to thank all members of the Solid State Physics group for their backingand encouragement. We would especially like to express our gratitude to Marco Schade for hishelp with the interferometer measurements. The work has been carried out under the auspicesof The Energy Systems Program which is financed by the Swedish Energy Agency.
Appendix
Table A.1. Parameter values c1 and c2 for the Corning glass, see equation (1), and parameter valuesc1–c6 for all oxides related to the used dispersion model, see equation (2). The second subscriptrefers to the sample number, that is for N40A60 there are three samples.
Mat- Cor-
erial ning S/HS S70T30 S50T50 A N20A80 N40A60 N60A40 N65A35 N80A20
[1] Granqvist C G 1989 Spectrally Selective Surfaces for Heating and Cooling Applications (Washington: TheInternational Society for Optical Engineering)
[2] Bostrom T, Wackelgard E and Westin G 2003 Solution-chemical derived nickel–alumina coatings for thermalsolar absorbers Sol. Energy 74 497–504
[3] Bostrom T, Wackelgard E and Westin G 2005 Experimental and theoretical optimization of a three layer solutionchemically derived spectrally selective absorber Proc. ISES (Orlando, 2005)
[4] Theiss M 2002 Hard and Software, CODE Aachen, Germany[5] Shuxi Z, Ribbing C-G and Wackelgard E 2004 Optical constants of sputtered Ni/NiO solar absorber film-depth-
profiled characterization Sol. Energy Mater. Sol. Cells. 84 193–203[6] Ward L 1998 The Optical Constants of Bulk Materials and Films (Great Britain: JW Arrowsmith Ltd)[7] Tadanaga K, Iwashita K, Minami T and Tohge N 1996 Coating and water permeation properties of SiO2 thin
films prepared by the sol–gel method on Nylon-6 substrates J. Sol–Gel Sci. Technol. 6 107–11[8] Duffie J A and Beckman W A 1991 Solar Engineering of Thermal Processes (New York: Wiley–Interscience)[9] Paulick T C 1986 Inversion of normal-incidence (R,T) measurements to obtain n + ik for thin films Appl. Opt.
25 562–4[10] Cauchy A L 1836 Memoire sur la Dispersion de la Lumiere Prague[11] Bruggeman D A G 1935 Berechnung Verschiedener Physikalischer Konstanten von Heterogenen Substanzen
Ann. Phys. 24 636–64[12] Palik E D 1985 Handbook of Optical Constants of Solids (Orlando, FL: Academic)[13] Nelder J A and Mead R 1965 A simplex method for function minimization Comput. J. 7 308–13[14] Press W H, Teukolsky S A, Vetterling W T and Flannery B P 1992 Numerical Recipes in FORTRAN: The Art of
Scientific Computing (Cambridge: Cambridge University Press)[15] Dawnay E J C, Fardad M A, Green M, Horowitz F, Yeatman E M, Almeida R M, Vasconcelos H C,
Guglielmi M and Martucci A 1995 Control and characterisation of microstructure in sol–gel films for opticaldevice applications Adv. Mater. Opt. 55–62
[16] 2003 Vin Karola Instruments http://www.vinkarola.com Norcross[17] Shamala K S, Murthy L C S and Narasimha Rao K 2004 Studies on optical and dielectric properties of Al2O3
thin films prepared by electron beam evaporation and spray pyrolysis method Mater. Sci. Eng. B 106 269–74[18] Eriksson T S, Hjortsberg A, Niklasson G A and Granqvist C G 1981 Infrared optical properties of evaporated
alumina films Appl. Opt. 20 2742–6[19] Murr L E (ed) 1980 Solar Materials Science (London: Academic)[20] Bostrom T, Valizadeh S, Lu J, Jensen J, Westin G and Wackelgard E 2006 Characterizing a Ni-Al2O3/SiO2 solar
thermal selective absorber Thin Solid Films submitted[21] Seco A M, Goncalves M C and Almeida R M 2000 Densification of hybrid silica–titania sol–gel films studied by
ellipsometry and FTIR Mater. Sci. Eng. B 76 193–9[22] Brusantin G, Guglielmi M, Innocenzi P, Martucci A, Battaglin G, Pelli S and Righini G 1997 Microstructural
and optical properties of sol–gel silica–titania waveguides J. Non-Cryst. Solids 220 202–9[23] Craighead H G and Buhrman R A 1977 Optical properties of selectively absorbing Ni/Al2O3 composite films
Appl. Phys. Lett. 31 423–5[24] Sathiaraj T and Thangaraj R 1997 The experimental and calculated optical properties of NI-Al2O3 coatings using
effective medium theories J. Phys. D: Appl. Phys. 30 769–75[25] Meschede D 2002 Gerthsen Physik 21st edn (Berlin: Springer)