The use of reflectors for concentrating solar irradia-tion in solar energy applications can substantiallyreduce the cost of the energy generated by a solarcollecting device. Reflectors enhance the illumina-tion of a solar thermal absorber or a solar cell and canthereby increase the heat or the electricity deliveredper unit area. This fact implies that expensive solarthermal absorbers and photovoltaic cells can be re-placed by cheap reflectors and that the cost of solarheat or electricity can be decreased.
The reflector’s quality is of great importance for theoptical efficiency of the solar collecting device. Hightotal reflectance in the solar wavelength range is im-portant, and therefore aluminum and silver are themost common reflector materials used in solar energyapplications. Most often, high specular reflectanceis also preferable but is not always necessary. Low-concentrating devices, such as compound parabolicconcentrators,1 are less sensitive to scattering of thencident radiation than high-concentrating devicesuch as parabolic troughs and dishes. Furthermore,cattering of nonspecular radiation in linear corruga-ions with a particular geometry or unidirectional
M. Ronnelid [email protected]! is with the Solar Energy ResearchCenter, Dalarna University, S-781 88 Borlange, Sweden. M. Ad-sten [email protected]!, T. Lindstrom, P. Nostell,nd E. Wackelgård [email protected]! are with theepartment of Materials Science, Uppsala University, P.O. Box34, S-752 21 Uppsala, Sweden.Received 25 June 2000; revised manuscript received 21 Decem-
olling grooves can be beneficial for certain concen-rator geometries.2–4 Because rolled aluminum is
cheaper than other reflector materials, it can be acost-effective and suitable material for certain solarenergy applications. It is therefore of interest tocharacterize reflectance and light scattering fromrolled aluminum of different surface roughnesses toevaluate the feasibility of using these various kinds ofaluminum as reflector materials.
Rolling causes a surface roughness of unidirec-tional grooves in the aluminum surface, and thegrooves can be more or less pronounced, depending onthe manufacturing conditions and on the softness ofthe metal. A special property of a surface with uni-directional grooves is that it scatters light in prefer-ential directions, similarly to a one-dimensionalreflection grating with random scribe spacing.
The topography of random rough surfaces is oftendescribed by statistical functions such as height andslope probability distributions, with root meansquare ~rms! height and slope, respectively, equal tothe standard deviation of these distribution func-tions. The surface topographic function can be ex-pressed mathematically with an infinite Fourierseries of periodic functions with spatial wavelengthsin all lengths scales from zero to infinity. The mor-phology of a surface can also be described as a power-spectral density ~PSD! that is the square of thesurface height per unit spatial frequency ~inversespatial wavelength!. The dimensions of the PSD arelength to a power of 3 for one-dimensional surfacesand length to the power of 4 for two-dimensionalsurfaces. One may find the PSD directly from a sur-face profile by taking the square of the Fourier trans-form of the topographical profile. The PSD function
wttatfm
2cTpi
F2btuomsstothct
sFgp
describes two aspects of the surface roughness: thespread of heights from a mean plane and the lateraldistances over which these height variations occur,i.e., the different length scales. This information isin contrast to the rms height, which gives only theaverage height variation along the profile but no lat-eral information. The PSD function is important inlight-scattering theories because it connects the scat-tering at a certain angle with the spatial wavelengthsof the surface. For surfaces with height variationsmuch smaller than the wavelength of the probinglight, the Raleigh–Rice perturbation theory is mostcommonly used.5 It relates the PSD function of thesurface roughness to the total integrated scattering~TIS! or to the bidirectional angular resolved scatter-ing ~ARS!.6,7 Kirchhoff theory is also used forsurface-roughness evaluation from light-scatteringmeasurements.5 Kirchhoff ’s method is applicable
ithout limitations of surface height but is restrictedo surfaces with radii of curvature much larger thanhe wavelength of the probing light. When surfacesre too rough to fulfill the conditions set by these twoheories, more-rigorous mathematical models that,or example, are based on Monte Carlo simulationsust be used in the roughness evaluation.8The study of light scattering from rough surfaces is
an extensive field of research that focuses both on basicphysical understanding of electromagnetic field inter-action with nonplanar surfaces and on technical appli-cations such as the classification and qualification ofindustrial surfaces. It offers surface-roughness anal-yses that are fast and nondestructive.7 The aim ofthis study has been to characterize the optical scatter-ing from two types of rolled aluminum with differentsurface roughnesses. We investigated the groove ori-entation of the angular distribution of the scatteredlight relative to the incidence plane, the wavelength,and the state of polarization of the incident light.Furthermore, we numerically added the ARS data intolarger solid angle intervals that represented specular,low-angle, and high-angle scattered light. The inten-sity of the scattered light in each of these angularintervals indicates the possible use of the measuredtypes of rolled aluminum as reflectors in solar energyapplications. We investigated the surface topographywith white-light interferometry and described the to-pography in terms of statistical parameters such as therms height and slope.
2. Surface Characterization by Profilometry
We investigated light scattering for an aluminumsheet and a foil with significantly different surface-roughness characteristics. The two samples had dif-ferent visual appearances: The sheet appearedalmost completely diffuse, in contrast to the foil,which was fairly mirrorlike. The two types had sim-ilar purity ~99.5% Al! and electrical resistivity at0 °C. The aluminum sheet sample was made fromold-rolled aluminum @type 1050 A ~AA system!#.he 12-mm-thick cold-rolled foil @standard 1200 A,roduced by Eurofoil in Skultuna, Sweden# was lam-nated with 250-mm polyethylene plastic by Skultuna
lexible ~Skultuna, Sweden! and labeled Al 12yPET50. Our measurements were performed on theare aluminum surface, i.e., not on the back side withhe plastic laminate. We cleaned in ethanol in anltrasonic bath both samples to remove any grease orther surface contaminants. Before each measure-ent, dust particles were removed from the sample
urface by use of dry nitrogen gas. It should betressed that these reflector surfaces must be pro-ected with glass, lacquer, or plastic foil in a realutdoor application. Our aim is to study the scat-ering properties of the bare rolled aluminum, and weave deliberately omitted the influence of protectiveoatings on the scattering to avoid further complica-ions.
We used light-optical microscopy to image the twourfaces. Figure 1~a! shows the sheet aluminum;ig. 1~b!, the aluminum foil. The unidirectionalrooves are clearly seen in both micrographs, as areointlike defects. Clearly, the sheet aluminum sam-
Fig. 1. Light-optical micrographs of ~a! sheet aluminum and ~b!aluminum foil samples.
1 May 2001 y Vol. 40, No. 13 y APPLIED OPTICS 2149
rpo
Tiq1
pg~ias
wdc
bs
l3
tgtfompahdsmfgsp
g
2
ple has more visible and rougher grooves than thealuminum foil.
A. Instrumentation and Measurement Procedure
The surface roughness was investigated with a WykoNT-2000 interference fringe microscope with a Mirauinterferometer. Because the surfaces of the sampleswere rather rough, we used the vertical scanninginterferometry mode to characterize the white light.Typical vertical scanning interferometry perfor-mance is 0.3-mm spatial resolution and 1-nm verticalesolution, which can be compared with that ofhase-shift interferometry, for which the spatial res-lution is of the order of 0.1 mm and the vertical
resolution 0.1 nm. However, phase-shift inter-ferometry normally has a vertical range of only 1.5mm.
The sheet aluminum was slightly curved as a re-sult of the cutting of the sample, and therefore thesoftware adjusted all analyses for curvature and tilt.The image consisted of 736 pixels in one direction and480 pixels orthogonal to this direction. The sam-pling lengths were 1.56 and 1.81 mm in the two di-rections, thus providing an image size of 1.15 mm 30.87 mm. The shortest spatial wavelength that canbe recorded is twice the sampling step length, whichfor this instrument corresponded to 3.12 mm in thelonger and 3.62 mm in the shorter scan directions.
he longest spatial wavelength that can be measureds the profile length. The corresponding spatial ~fre-uency! bandwidths in the measurements were 8.7 3024 to 0.32 mm21 for the longer and 1.2 3 1024 to
0.28 mm21 for the shorter profile lengths. The sam-les were mounted in the instrument with the rollingrooves perpendicular to the longer profile length1.15 mm!. Sampling performed along the groovess referred to as parallel sampling, and samplingcross the grooves is referred to as perpendicularampling.The PSD was calculated with the instrument soft-are as an average line power spectrum in a samplingirection. This one-dimensional PSD spectrum wasalculated from single-line profiles:
PSD~ f ! 5d0
N (j51
N
u Zj exp@2i2pf ~ j 2 1!d0# u2, (1)
where d0 is the sampling length and N is the numberof data points ~i.e. pixels!; Zj is the height differenceetween point j and the reference mean line. Thepatial frequency, f, was equal to KyL, where K is an
integer that ranges from 1 to Ny2. All single-linePSD spectra for one fixed sampling direction wereaveraged to yield the one-dimensional PSD for thechosen sampling direction of the surface profile.
B. Results
The surface topographies of the two types of rolledaluminum are presented in Fig. 2 for the sheet andFig. 3 for the foil. Figures 2~a! and 3~a! show single-ine profiles parallel to the grooves and Figs. 2~b! and~b! show them perpendicular to the grooves. Peak-
150 APPLIED OPTICS y Vol. 40, No. 13 y 1 May 2001
o-peak values for a profile perpendicular to therooves were as large as 2 mm for the sheet but lesshan 1 mm for the foil. This difference is also evidentrom the rms height for the surface of 0.6 6 0.1 mmbtained for the aluminum sheet and of 0.20 6 0.02m for the foil. The rms height for a line profilearallel to the grooves was 0.3 6 0.1 mm for the sheetnd 0.15 6 0.05 mm for the foil. Although the rmseights for parallel and perpendicular scans did notiffer much for the foil, the anisotropy was anyhowignificant, as can be observed from the light-opticalicrograph images in Fig. 1~b!. The rms slope was
ound to be 7° for the sheet perpendicular to therooves and 1° parallel to the grooves. The corre-ponding values for the foil were determined to be 2°erpendicular and ,1° parallel to the grooves.We also used white-light interferometry to investi-
ate whether the laser beam size of 2.5 mm2 in theARS measurements was large enough to cover anarea that was statistically representative of the sam-ple. For this purpose we added as many as five ad-jacent images, each 1.15 mm by 0.87 mm, and therms height was calculated in each case. We foundthat the change in statistics was already moderate for
Fig. 2. Line profiles of the sheet aluminum sample taken with aninterference fringe microscope working in the white-light verticalscanning interferometry mode.
an extension of the area from one to two images forboth types of rolled aluminum. It can therefore beconcluded that the surface area in the ARS measure-ments is large enough to be statistically representa-tive.
The PSD spectra of the two samples shown in Fig.4 were calculated from line profiles perpendicular tothe rolling groves by use of the computational rou-tines of the instrument software described in Subsec-tion 2.A. These experimental PSD functionscovered a spatial bandwidth that corresponded tospatial wavelengths that were all longer than thewavelength of the light used in the optical measure-ments ~0.633 mm! and therefore contributed only tolow-angle optical scattering at a near-normal angle ofincidence, according to the grating equation. How-ever, for a 60° angle of incidence this spatial band-width gave rise also to high-angle scattering. ThePSD function for the sheet was 1 order of magnitudelarger than for the foil in nearly the whole measuredrange, which implies that the sheet surface isrougher than the foil surface for all measured spatialfrequencies. The slope of the PSD curves leveled off
Fig. 3. Line profiles for the aluminum foil sample taken with aninterference fringe microscope working in the white-light verticalscanning interferometry mode.
in the low-spatial-frequency range, thereby indicat-ing that the curves can be described by use of theK-correlation model.9,10 The slope in the fractal re-gion, i.e., the high-frequency range, followed a powerlaw with a fitted value of the exponent of 1.7 in bothcases, which means that the fractal dimensions of thetwo surfaces is the same in the measured bandwidth.
The rms heights of the sheet and of the foil wereroughly of the same order as the solar spectral wave-length range ~0.3–4.1 mm!, which implies that theRayleigh–Rice perturbation theory cannot be used formodeling light scattering for shorter solar wave-lengths but might be used, preferably for the foil, inthe near-infrared wavelength range. The rmsslopes of both samples were found to be small enoughnot to violate the assumption of a large local radius ofcurvature made in Kirchhoff ’s scalar theory. Al-though a theoretical modeling of light scattering fromthe sheet and foil could be performed, we chose, at thepresent stage, to base the reflector evaluation on ex-periments. Scattering theory has been used onlyqualitatively in the interpretation of results obtainedfrom the optical measurements.
3. Surface Characterization by Optical ScatteringMeasurements
As was mentioned in Section 1, we made an angle-resolved optical scattering characterization to evalu-ate the performance of these surfaces in solarreflector applications. The numerical summation ofARS data into larger solid angle intervals presentedin Section 4 below was validated by TIS measure-ments. In addition, the TIS spectra provided infor-mation about the wavelength dependence of thescattering. We performed integrating sphere mea-surements to obtain the hemispherical reflectance inthe solar wavelength range of the two types of sur-faces. Subsection 3.A contains short descriptions ofthe ARS, TIS, and integrating sphere instrumentsused in the characterization and of the results ob-tained from these measurements.
Fig. 4. One-dimensional average PSD taken along line profilesperpendicular to the rolling grooves for the sheet with a rms heightof 0.6 mm and the foil sample with a rms height of 0.2 mm.
1 May 2001 y Vol. 40, No. 13 y APPLIED OPTICS 2151
trttsdTdtsi
aa0eftnamvtoatbwr
2Sw
hlnttrthdpt
sbtztrtrTrssl
ap
2
A. Instrumentation and Measurement Procedure
1. Bidirectional Angle-Resolved ScatterometryThe ARS instrument on which we report here isequipped with a 2.4 mm 3 2.4 mm silicon diode de-ector, which moves along a semicircular arc with aadius of 45 cm. The arc is rotated about an axishrough its diameter. Hence it is possible to detecthe scattered intensity in a large part of the hemi-phere above the sample surface. A schematicrawing of the experimental setup is shown in Fig. 5.he sample is positioned in the middle of the arciameter, with the sample normal perpendicular tohe arc diameter. In this arrangement the ARS in-trument is aligned such that the plane defined byncident light Pi and the specularly reflected light P0,
i.e., the plane of incidence, crosses the midpoint of thearc. The sample can be tilted to allow for varyingthe angle of incidence. The detector position is de-termined by angle f from the midpoint of the arc andarc tilt angle u, the angle between the arc plane andP0. Note that the angles f and u are the polar andazimuthal angles, respectively, in spherical coordi-nates but not with the commonly used notation.However, in the scattering literature angles u and fre referred to as the in- and out-of-plane scatteringngles, respectively. A He–Ne laser operating at.633 mm was used as a light source in most of thexperiments, but a 0.540-mm He–Ne laser was usedor some measurements. Furthermore, a lock-inechnique was used to monitor the signal over a dy-amic range of eight decades. The detector, the arc,nd the sample holder were moved with steppingotors. Short steps were taken when the intensity
ariation in the detected signal between adjacent de-ector positions was large, the signal level was high,r both. The shortest steps, which corresponded ton angular shift of 0.0015°, occurred in the vicinity ofhe specular beam. Far away from the speculaream, in regions where the scattered light intensityas low and evenly distributed, the step lengths cor-
esponded to angular shifts of 0.3°.
Fig. 5. Schematic drawing of the ARS measurement equipment.Pi, incident beam; Ps, scattered intensity, P0 the specular compo-nent. Angles u and f are the in- and out-of-plane scattering an-gles, respectively.
152 APPLIED OPTICS y Vol. 40, No. 13 y 1 May 2001
. Total Integrating Scatterometrypectral reflectance measurements were carried outith a spectroscopic TIS instrument.11 The instru-
ment records both diffuse and total spectra in thewavelength range 0.370–0.970 mm. The focusing,
emispherical mirror of the TIS instrument detectsight scattered at angles of 2.5°–70° from the surfaceormal. The specular component is then dumpedhrough the entrance port in the middle of the wall ofhe hemispherical mirror. One measures the totaleflectance by rotating the sample a small angle suchhat the specular component is also reflected from theemispherical mirror and is thereby focused onto theetector. The design of the instrument makes itossible to detect diffuse reflectance and transmit-ance values as low as 1025 with respect to the total
signal. The use of black plastic screens enables thediffuse reflectance to be measured over fixed angleintervals; in the present study screens that coveredangle intervals 2.5°–10°, 10°–20°, 20°–40°, and 40°–70° were used.12 The recorded spectra were cor-rected according to a formalism for anisotropicallyscattering samples.13
3. Integrating Sphere MeasurementsThe total reflectance of the samples was measuredwith an integrating sphere at variable angles of in-cidence.14 The 30-cm-diameter sphere had a center-mounted sample holder attached to a vertical axis.The holder was a 50 mm 3 50 mm plate with itsurface in a vertical plane. The vertical axis coulde rotated to vary the angle of incident light from 2°o 80°. The incident light was aligned in the hori-ontal plane, passed through a 14-mm circular en-rance port, and focused onto the sample andeference in the holder plate. The sphere wall andhe back of the sample holder, which functioned as aeference plate, were coated with barium sulfate.he sample was also attached to the holder in theeference measurement to alter the throughput of thephere as little as possible from that measured in theample. The instrument covered the spectral wave-ength range 0.3–2.5 mm.
The problem of how to determine the reflectance ofnisotropically scattering surfaces was addressedreviously.15 Merely taking the ratio of the sample
and reference signals has nearly always led to incor-rect results. Thus corrections that accounted forsample and wall reflectance and nonisotropic illumi-nation of the sphere walls were applied.14
B. Results
1. Angle-Resolved Scatterometer MeasurementsThe angle-scattering distribution for the sheet alu-minum, for p-polarized light at a 60° angle of inci-dence and grooves oriented perpendicular andparallel to the incident plane, is shown in Fig. 6.The intensity is normalized to the intensity in thespecular direction. A scatterband originating fromthe unidirectional grooves can be observed in the fig-ure. With perpendicular groove orientation the
tstfttvwits
scatterband is confined to the incidence plane, as isillustrated in Fig. 6~a!, and for parallel groove orien-tation the scatterband is bent in an arclike shape, asshown in Fig. 6~b!. The foil shows similar scatteringfeatures but with a more pronounced peak intensityin the specular direction. The results from all ARSmeasurements are summarized in Table 1 and arediscussed further in Sections 4 and 5 below.
The general appearance of the light-scattering dis-tribution is similar for the two samples and can bedivided into three categories for scattering that orig-inates from different surface features: specularscattering, anisotropic scattering ~the scatterband!that is due to the grooves, and isotropic scatteringthat is due to point or randomly oriented elongated
Fig. 6. Scattering distribution of sheet aluminum as a function ofangle in the incidence plane u and angle out of the plane f, forp-polarized 0.633-mm He–Ne laser light at incidence angle 60°.Note that the intensity has been normalized to the maximumintensity ~i.e., the intensity in the specular direction! and that theintensity ~Int.! scale is logarithmic. The specular direction hasthe angles u 5 f 5 0. ~a! Parallel grooves, ~b! perpendiculargrooves with respect to the plane of the incident light.
defects. These categories are used in the analyses inSection 4.
2. TIS MeasurementsThe measured diffuse and total reflectance spectrafor the two samples are shown in Fig. 7 for the sheetsample and in Fig. 8 for the foil sample. The dip inthe total reflectance at 0.825 mm is due to an elec-ronic interband transition in aluminum. It can beeen that the diffuse reflectance of the sheet metal iswo to three times higher than for the foil. However,or both samples the angle interval 2.5°–10° scattershe most, followed by 20°–40° and 10°–20°, finally,he least scattering occurs in the highest angle inter-al, 40°–70°. The decreasing diffuse scattering levelith increasing wavelength for the aluminum foil
ndicates that surface roughness ~topographical fea-ures! and single-scatter events are the dominatingcattering mechanisms.7 It has also been shown
that an inverse wavelength dependence of the diffusereflectance is to be expected when one is measuringmetallic samples with unidirectional grooves withsurface heights much smaller than the wavelength ofthe probing light.16 For the sheet aluminum thescattering level is approximately constant over themeasured wavelength interval. Large macroscopicfeatures ~with surface heights much larger than thewavelength! will change the theoretical descriptionfrom diffractive ~physical! optics to geometrical op-tics, and the diffuse reflectance is, to a first approxi-mation, independent of the wavelength.5,8 Single-scatter events are assumed, and the scattering can beseen as being due to specular facets. However, therms height of the sheet sample is of the order of thewavelengths of the measured spectral range of theTIS instrument, which implies that the scatteringhas to be described by diffractive optics also.
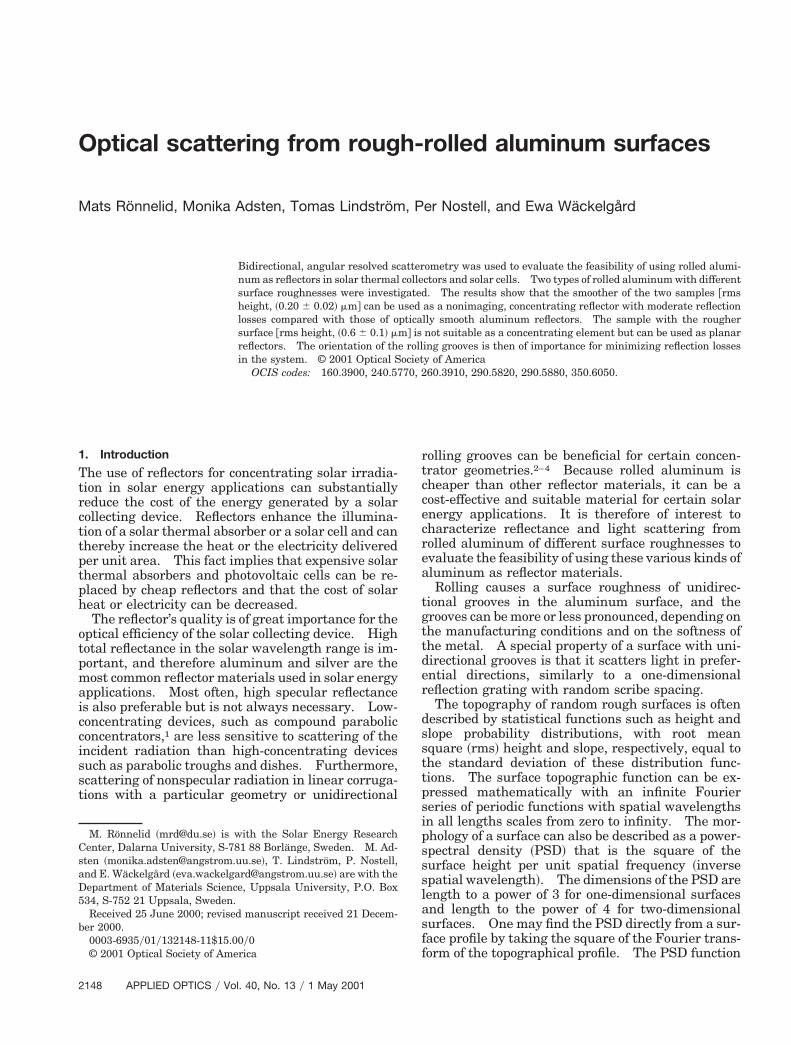
3. Integrating Sphere MeasurementsThe hemispherical reflectance of the two samples ascharacterized with the angular integrating sphere isplotted in Fig. 9. The reflectance is higher for thefoil than for the sheet, and this difference increasesespecially at shorter wavelengths. The averagehemispherical reflectance in the solar wavelengthrange was found to be 0.87 at 5° and 0.89 at 60°angles of incidence for the foil and 0.81 for the sheetfor both angles of incidence. The lower reflectance ofthe sheet was unexpected considering that the bulkoptical properties should be similar because the pu-rity and the electrical resistivity are similar for thetwo types of aluminum. The assumption of singlescattering made from the TIS measurements alsoindicates that the samples should have approxi-mately the same hemispherical reflectance. Thesheet was therefore gently etched in phosphoric acid@250 g of phosphoric acid ~85%! per liter of deionizedwater# at 50 °C for 20 min. We found that the rmsheight and the surface slope were not affected by thistreatment. The solar reflectance increased from0.81 to 0.88 at near-normal angle of incidence as aresult of the etching. Hence the total reflectance
1 May 2001 y Vol. 40, No. 13 y APPLIED OPTICS 2153
Table 1. Division of Scattered Radiation into Various Angular Regionsa
“p
rbT
rbT
2
spectra of the sheet and foil samples became almostidentical after etching, as is illustrated in Fig. 9.
4. Summation of Scattering Pattern
We intend to investigate the aluminum foil and sheetin a later study to examine their feasibility for use asreflectors in solar energy applications. The ARSdata presented here will then be used in optical ray-tracing calculations for different types of low-concentrating reflector geometries. The largeamount of data acquired in an ARS measurementmust be reduced to make the ray-tracing calculationmanageable. In Subsection 4.A we describe amethod for summarizing the ARS data points and for
Sample SR ~%! LAS-B ~%!
Foil60°, 0°, p 86.6 7.260°, 0°, s 83.0 8.860°, 40°, p 84.7 9.360°, 40°, s 86.8 8.460°, 90°, p 73.0 19.360°, 90°, s 75.4 16.20°, 2, un-pol 74.5 14.960°, 90°, un-pol, ~green! 75.0 18.5
Sheet60°, 0°, p 49.6 36.760°, 0°, s 50.2 36.460°, 90°, p 28.7 37.260°, 90°, s 30.6 37.80°, 2, p 26.6 32.0
aSee text for an explanation. All samples were illuminated w~green!,” for which the sample was illuminated with a green Holarized; un-pol, unpolarized.
Fig. 7. Reflectance versus wavelength for sheet aluminum asmeasured in the TIS instrument: Rd, diffuse reflectance; Rt, totaleflectance. Also indicated are the measurements performed withlack screens that limit the scattering to smaller angular intervals.he ranges of the angular intervals are indicated.
154 APPLIED OPTICS y Vol. 40, No. 13 y 1 May 2001
obtaining the scattered radiation power in differentsolid angular intervals. The results are presentedin Subsection 4.B and are also compared with the TISresults.
A. Method
As described in Section 3, the detector scanned thespace in unequal step lengths. The number of mea-sured points was largest for near-specular directionsof the reflected light and least for directions with lowand uniformly distributed scattering. It is not pos-sible merely to sum the intensities of all the mea-sured points in a certain angular interval to get thetotal power of the reflected radiation in that intervalbecause the detector’s movement between adjacentpositions was either shorter or longer than the detec-tor extension. We solved this problem by dividing
~%! HAS-B ~%! HAS ~%! Extension ~Band!
.8 0.3 3.1 211° to 111°
.3 0.9 4.4 213° to 113°
.2 1.8 2.2 219° to 115°
.2 1.3 2.3 215° to 113°
.8 4.5 1.4 223° to 119°
.8 3.0 3.9 219° to 117°
.8 3.6 4.2 223° to 123°
.1 2.8 2.6 219° to 117°
.6 9.1 3.0 221° to 121°
.5 9.3 2.6 221° to 123°
.6 29.1 4.4 245° to 129°
.7 27.7 3.2 241° to 127°
.6 34.1 5.7 241° to 141°
red He–Ne-laser ~0.633 mm!, except the measurement denotedlaser ~0.540 mm!. SR, specular reflectance; p, p polarized; s, s
Fig. 8. Reflectance versus wavelength for the aluminum foil asmeasured by the TIS instrument. Rd, diffuse reflectance; Rt, totaleflectance. Also indicated are the measurements performed withlack screens that limit the scattering to smaller angular intervals.he ranges of the angular intervals are indicated.
LAS
23111121
11001
ith ae–Ne
a
Fi
mmas
p
amfpwdsuIAvwc
Td
the total solid angle of the measurement into solidangle elements DVi, j, one for each data point, thatwith no overlap completely fill the space. The size ofsolid angle element DVi, j is approximately
DVi, j 5 Dfi, jDui, j cos fi, j, (2)
where angle Dfi, j, at a specific detector position rep-resented by fi, j and ui, j, is half the distance to thenearby detector positions along the arc at fi21, j andfi11, j respectively:
Dfi, j 5 0.5ufi11, j 2 fi21, ju, (3a)
nd angle Dui, j for the same position is half the dis-tance to adjacent positions of the arc, ui, j21 and ui, j11,respectively:
Dui, j 5 0.5uui, j21 2 ui, j11u. (3b)
or each detector position we calculated the scatteredntensity to be Psi, j
by dividing the measured value forthe scattered power by the area of the detector diode.We found the corrected power for solid angle DVi, j by
ultiplying the scattered intensity by solid angle seg-ent DVi, jR
2, where R is the radius of the detectorrc. To calculate the scattered radiation in a largerolid angle Vp,q, typically 2° by 2° in size, we summed
the scattered power of the small solid angles DVk,lthat belong to this specific Vp,q. The fraction Xp,q ofthe total scattered power that was scattered withinVp,q was then calculated by
Xp,q 5
S(k,l
n
Psk,lVk,lD
Vk,l[Vp,q
S(i, j
m
Psi, jVi, jD , (4)
Fig. 9. Reflectance spectra of the sheet and the foil samples in thewavelength range 0.3–2.5 mm at 5° and 60° angles of incidence.
he near-normal reflectance of the sheet after etching is also in-icated.
where n is the number of data points within the spe-cific solid angle Vp,q and m is the total number of data
oints in the whole ARS measurement.We validated the summation procedure outlined
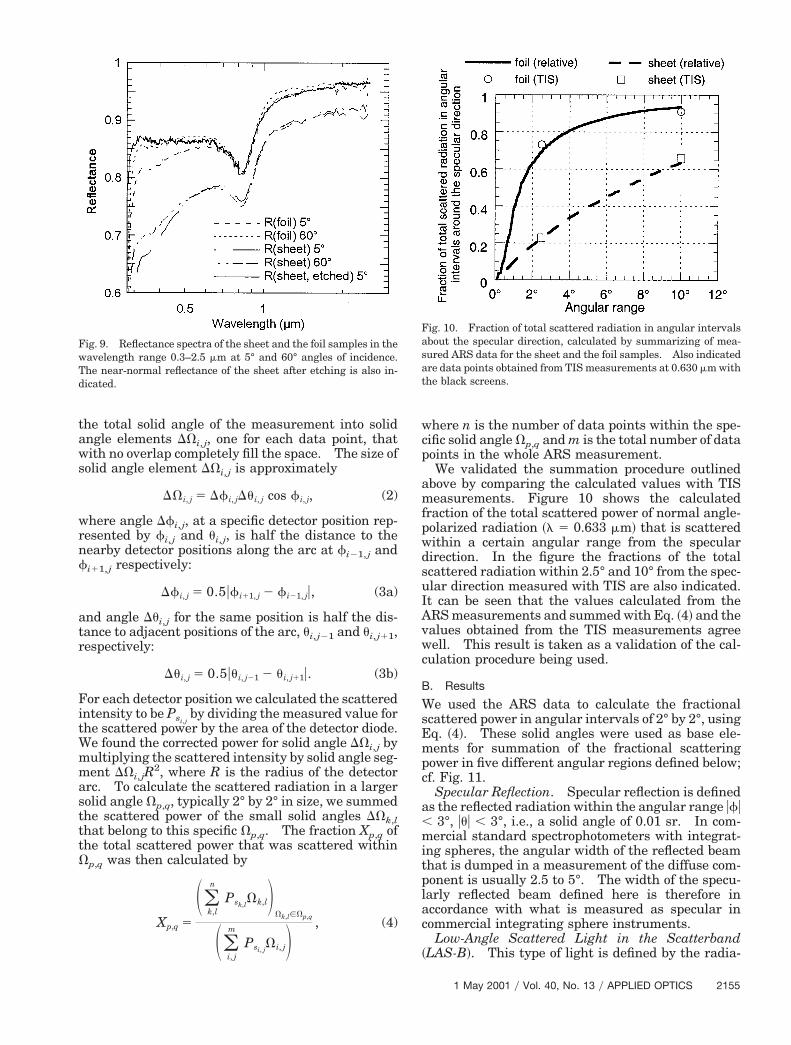
bove by comparing the calculated values with TISeasurements. Figure 10 shows the calculated
raction of the total scattered power of normal angle-olarized radiation ~l 5 0.633 mm! that is scatteredithin a certain angular range from the specularirection. In the figure the fractions of the totalcattered radiation within 2.5° and 10° from the spec-lar direction measured with TIS are also indicated.t can be seen that the values calculated from theRS measurements and summed with Eq. ~4! and thealues obtained from the TIS measurements agreeell. This result is taken as a validation of the cal-
ulation procedure being used.
B. Results
We used the ARS data to calculate the fractionalscattered power in angular intervals of 2° by 2°, usingEq. ~4!. These solid angles were used as base ele-ments for summation of the fractional scatteringpower in five different angular regions defined below;cf. Fig. 11.
Specular Reflection. Specular reflection is definedas the reflected radiation within the angular range ufu, 3°, uuu , 3°, i.e., a solid angle of 0.01 sr. In com-mercial standard spectrophotometers with integrat-ing spheres, the angular width of the reflected beamthat is dumped in a measurement of the diffuse com-ponent is usually 2.5 to 5°. The width of the specu-larly reflected beam defined here is therefore inaccordance with what is measured as specular incommercial integrating sphere instruments.
Low-Angle Scattered Light in the Scatterband~LAS-B!. This type of light is defined by the radia-
Fig. 10. Fraction of total scattered radiation in angular intervalsabout the specular direction, calculated by summarizing of mea-sured ARS data for the sheet and the foil samples. Also indicatedare data points obtained from TIS measurements at 0.630 mm withthe black screens.
1 May 2001 y Vol. 40, No. 13 y APPLIED OPTICS 2155
3
ir
2
tion reflected within the angular range 3° , ufu , 9°,° , uuu , 9° and within the scatterband. As for the
definition of the angular width of the specular re-flected radiation, the angular width of the scatter-band is defined as 63° from the maximum intensityin the band.
Low-Angle Scattered Light ~LAS!. Low-anglescattered light is defined as the radiation reflectedwithin the angular range ufu , 9°, uuu , 9°, excludingthe radiation scattered according to the specular re-flection and LAS-B definitions above.
High-Angle Scattered Light in the Scatterband~HAS-B!. HAS-B is defined as the radiation re-flected at angles for which ufu . 9°, uuu . 9°, andwithin the scatterband. As for the definition ofLAS-B, the angular width of the band is defined as63° from the maximum intensity in the band. Theintensity in the scatterband decreases with increas-ing solid angle from the specular direction. In the
Fig. 11. Two examples of the scattering pattern from p-polarizedlight with a 60° incidence angle on the rolled aluminum sheetsample. ~a! Grooves parallel and ~b! grooves perpendicular to thencident plane. The chosen five angular regions for which theelative scattered intensity is summed up are indicated.
156 APPLIED OPTICS y Vol. 40, No. 13 y 1 May 2001
calculations, radiation scattered in the direction ofthe band is included in HAS-B as long as furtherincrements of the band by a 6° by 2° area ~width bylength! will give a contribution to HAS-B of morethan 0.1% of the total scattered radiation.
High-Angle Scattered Light ~HAS!. HAS is de-fined as the radiation reflected outside the angularrange ufu , 9°, uuu , 9°, excluding the radiation scat-tered at high angles in the scatterband ~HAS-B!.
Radiation scattered in the hemisphere outside therange of the instrument is estimated to be in a 1–2%range of the total.
Figure 11 shows the relative scattered powerwithin these fives angular intervals for the sheet alu-minum with 60° incident p-polarized ~p-pol! lightwith rolling grooves perpendicular @Fig. 11~a!# andparallel @Fig. 11~b!# to the plane of incidence. TheARS data used in these summations are the onesshown in Figs. 6~a! and 6~b!, respectively.
Thirteen different measurements were performed,and the resultant summations in the various solid-angle intervals are summarized in Table 1. Thefraction of specularly scattered light is twice as largefor the foil as for the sheet, but the relative scatteredintensity is three to four times larger in the scatter-band for the sheet.
According to the first-order grating equation, theshortest spatial wavelength that contributes to dif-fraction at normal incidence has the same value asthe wavelength of the probing light, which was 0.633mm in these experiments. The shortest spatialwavelength at a 60° angle of incidence, with groovesperpendicular to the incident plane, must then be 4.7mm for the same light source. This means thatlonger spatial wavelengths contribute to diffractionin the latter case. However, for both samples thescattered light is distributed in the five categorieswith similar ratios for near-normal angles and for 60°with the grooves perpendicular to the plane of inci-dence, despite the different length scales that areresponsible for the scattering for these two angles ofincidence.
We found that the scatterband is more intense fornormal angle of incidence and for orientation of therolling grooves perpendicular to the incident lightthan for orientation of the grooves parallel to theincident plane. This effect is much more pro-nounced for the sheet for which the high-angle scat-tering is largest at the normal angle of incidence.According to Table 1, the specularly scattered lightfrom the sheet is roughly doubled in intensity whenthe grooves are rotated from perpendicular to parallelorientation with respect to the plane of the incidentlight. This can also be clearly seen in Fig. 12, wherethe relative intensities of specular light and scatter-band for 60° angle of incidence are plotted for thesheet sample. Perpendicular orientation gives ascatterband in the plane of the incident light, and theintensity is therefore plotted as a function of in-planeangle u. Parallel grooves cause a bending of thescatterband, as shown in Fig. 11, and the intensity isfor that reason plotted against out-of-plane angle f.
d
ffoohf
silsctl
As the scatterband originates from diffraction in theunidirectional grooves, it becomes less pronounced ifthe incident light is out of plane with the gratingplane ~the plane normal to the surface and perpen-
icular to the direction of the grooves!. In this casethe diffraction becomes more sensitive to the surfaceroughness along the grooves, and, because the rmsheight of the surface profile in this direction is muchsmaller, the scattering intensity becomes larger forlow-angle scattering.
As illustrated in Fig. 12, the HAS-B is symmetric inthe f direction in the case of parallel alignment.However, in the case of perpendicular alignment thescattering is not symmetric in the u direction. Thescattered intensity is larger for negative u values.
The state of polarization does not influence theangular distribution of the light scatter significantly,which indicates that single scattering dominates forthe spatial wavelengths involved. This is also con-firmed from the rms slope, the TIS measurements,and the fact that the hemispherical reflectance isvery similar for the two surfaces, irrespective of thesurface roughness. Changing the wavelength of theincident light from 0.633 to 0.540 mm did not result inany noticeable change in the scattering characteris-tics. This result is also expected from the weakinverse-wavelength dependence of diffuse reflectanceon the foil and from the wavelength-independent dif-fuse reflectance for the sheet in the TIS measure-ments.
5. Conclusions
The aim of this study has been to examine two typesof industrial aluminum sample with surface rough-nesses that originate from the cold-rolling process.The quality of the two types of aluminum is similar interms of purity and electrical resistivity, which im-plies that the bulk reflectances for the same surfaceroughness of both qualities should be highly similar.
Fig. 12. Distribution of specular and scattered power in the scat-terband from the surface of the sheet sample from p-polarized lightat a 60° angle of incidence. Each bar represents the scatteredradiation in steps of 2° along the scatterband. For the parallelalignment of the grooves to the incident plane, the abscissa repre-sents f, and for the perpendicular alignment of the grooves to theincident plane the abscissa represents u. The change of abscissavariable is due to the change in orientation of the scatterbandwhen the plane of incidence is changed with respect to the incidentplane, as is clearly seen in Fig. 11.
The spectral hemispherical reflectances of the twosamples were almost the same after etching of thesheet. This result indicates that single scatteringdominates in both cases, a conclusion that was alsosupported by the results from the other measure-ments performed in this study. The major opticaldifference between the two samples is therefore inthe angular distribution of light scattered from thetwo surfaces.
We found by use of white-light interferometry thatthe PSD is a magnitude larger for the sheet than forthe foil in nearly the whole measured wavelengthrange. This property is manifested in a three-times-larger rms height for the sheet ~0.6 mm! than for theoil ~0.2 mm!. The rms slopes were found to be gentleor both samples, thereby corresponding to large radiif surface curvature compared with the wavelengthf the light used in the optical measurements. Theigh-spatial-frequency region of the PSD functionrom 0.03 to 0.3 mm21 could be fitted to a power law
with the exponent 1.7 for both surfaces, which im-plies that the two surfaces have the same fractaldimension for these frequencies. From white-lightinterferometry we concluded that Kirchhoff ’s scalartheory for elastic light scattering is the most appro-priate theory to use in determining the surface rough-ness of these samples. However, the study of lightscattering has been only experimental in the researchreported here.
Optical angle-resolved scattering was measured,and the sheet was found to scatter more than the foil,at higher scatter angles, as expected from the white-light interferometry. Both samples have a distinctnarrow band of scattered light of higher intensityextending in two directions from the specular peak.The band originates from scattering by the unidirec-tional rolling grooves and appears as a straight lineperpendicular to the grooves when the grooves areoriented perpendicularly to the plane of the incidentlight. For other groove orientations with respect tothe incident plane and nonnormal incident light, thescatterband is bent into an arclike shape. In addi-tion to from the specular component and the one-dimensional scatterband, there is also an isotropiccontribution from other surface features such aspoint and randomly oriented surface defects. Also,this contribution is larger for the sheet than for thefoil, as can be expected from a two-times-larger rmsheight for profiles parallel to the grooves for the sheetthan for the foil.
The near-normal hemispherical solar reflectance ofthe foil was found to be 0.87, which is 0.04 unit lessthan for a smooth, evaporated aluminum surface.14
For the foil, ;85% of the scattered light was confinedin the angular interval ufu , 3°, uuu , 3° from thepecular direction with rolling grooves parallel to thencident plane, which implies that the nearly specu-ar reflectance is roughly 0.75. When the low-anglecattered light up to ufu , 9°, uuu , 9° was also in-luded, it constituted ;95% of the total reflected lightogether with the specular component, thus giving aow-angle reflectance of ;0.8. This conclusion is
1 May 2001 y Vol. 40, No. 13 y APPLIED OPTICS 2157
a
tion in the collector plane from structured booster reflectors
2
also valid for groove orientation perpendicular to theincident plane. A low-angle reflectance of ;0.8 waslso found at 0.63 mm in the TIS measurements, but
for shorter wavelengths it was somewhat lower be-cause of the dependence of scattering on the inversewavelength. These results indicates that aluminumfoil can be regarded as a feasible cheap aluminummirror in nonimaging, concentrating reflector appli-cations with a reflectance loss of ;10% in comparisonwith those from a smooth aluminum surface of highoptical quality.
The rolled aluminum sheet, after etching, with anear-normal hemispherical solar reflectance of 0.88,has a much lower specular reflectance. It scattersalmost 90% of all reflected radiation within the an-gular interval ufu , 9°, uuu , 9°, with rolling groovesparallel to the incident plane. With groove orienta-tion perpendicular to the plane of the incident light orfor normal angle of incidence the specular and low-angle scattering is considerably lower, ;65%. Alarge fraction, ;30%, is confined to the scatterbandfor higher angles, ufu . 9°, uuu . 9°. This result im-plies that an aluminum reflector with such a roughsurface as the sheet will not perform well in a con-centrating reflector application but might be accept-able as a planar reflector in front of flat-plate solarcollectors, i.e., with grooves oriented in the north–south direction.2,17 As the main part of the high-angle scattered light is collected in the scatterband, itwill be bent downward onto the collector and willtherefore give fewer reflectance losses than an isotro-pically scattering surface that has the same rmsheight. Ray-trace calculations for specific reflector–solar-collector configurations will reveal what onecan gain by using reflectors with such pronouncedrolling grooves.
The authors thank Bjorn Karlsson for inspiring usto make study and Arne Roos for fruitful discussionsduring the course of the research. This project wasfinancially supported by the Goran Gustafsson Foun-dation and the Swedish Foundation for Strategic Re-search through the graduate school Energy Systems.
References1. W. T. Welford and R. Winston, High Collection Nonimaging
Optics ~Academic, San Diego, Calif., 1989!.2. B. Perers, B. Karlsson, and M. Bergkvist, “Intensity distribu-
158 APPLIED OPTICS y Vol. 40, No. 13 y 1 May 2001
with rolling grooves and corrugation,” Sol. Energy 53, 215–226~1994!.
3. M. Ronnelid and B. Karlsson, “Optical properties of modifiedcompound parabolic concentrators with linear corrugated re-flectors,” Appl. Opt. 37, 5222–5226 ~1998!.
4. M. Ronnelid and B. Karlsson, “The use of corrugated boosterreflectors for large solar collector fields,” Sol. Energy 65, 343–351 ~1999!.
5. P. Beckman and A. Spizzichino, The Scattering of Electromag-netic Waves from Rough Surfaces ~Pergamon, Oxford, 1963!.
6. J. M. Bennett and L. Mattsson, Introduction to Surface Rough-ness and Scattering, 2nd ed. ~Optical Society of America,Washington, D.C., 1999!.
7. J. C. Stover, Optical Scattering: Measurement and Analysis,2nd ed. ~McGraw-Hill, New York, 1995!.
8. J. A. Ogilvy, Theory of Wave Scattering from Random RoughSurfaces ~Hilger, Bristol, U.K., 1991!.
9. E. L. Church, P. Z. Takacs, and T. A. Leonard, “Prediction ofBRDFs from surface profile measurements,” in Scatter fromOptical Components, J. C. Stover, ed., Proc. SPIE 1165, 136–150 ~1989!.
10. G. Palasantzas, “Roughness of spectrum and surface width ofself-afine fractal surfaces via the K-correlation model,” Phys.Rev. 48, 14472–14478 ~1993!.
11. D. Ronnow and E. Veszelei, “Design review of an instrumentfor spectroscopic total integrated light scattering measure-ments in the visible wavelength region,” Rev. Sci. Instrum. 65,327–334 ~1994!.
12. D. Ronnow, “Determination of interface roughness cross cor-relation of thin films from spectroscopic light scattering mea-surements,” J. Appl. Phys. 81, 3627–3636 ~1997!.
13. T. Lindstrom and A. Roos, “Reflectance and transmittance ofanisotropically scattering samples in focusing Coblentzspheres,” Rev. Sci. Instrum. 71, 2270–2278 ~2000!.
14. P. Nostell, A. Roos, and D. Ronnow, “Single-beam integratingsphere spectrophotometer for reflectance and transmittancemeasurements versus angle of incidence in the solar wave-length range on diffuse and specular samples,” Rev. Sci. In-strum. 70, 2481–2494 ~1999!.
15. A. Roos, C. G. Ribbing, and M. Bergkvist, “Anomalies in inte-grating sphere measurements on structured samples,” Appl.Opt. 27, 3828–3832 ~1988!.
16. J. M. Bennett, J. M. Elson, and J. P. Rahn, “Angle-resolvedscattering: comparison of theory and experiment,” in ThinFilm Technologies I, J. Jacobsson, ed., Proc. SPIE 401, 234–246 ~1983!.
17. P. Nostell, A. Roos, and B. Karlsson, “Optical characterisationof solar reflecting surfaces,” in Optical Materials Technologyfor Energy Efficiency and Solar Conversion XV, C. M. Lampert,ed., Proc. SPIE 3138, 163–172 ~1997!.