Optical Temperature Measurements in Shock Tubes from Relative Emission Intensities Ronald Watson A method is presented for obtaining spectroscopic temperatures in shock tubes using relative emission from two wavelength regions of a molecular band system. Experimental results are given for the OH violet system obtained in the reflected wave region near 3500'K. These results show that equilibrium conditions prevail and that the spectroscopic temperatures agree with those calculated from shock wave velocities. A resume of the appropriate theoretical considerations is given along with a detailed dis- cussion of the experimental techniques required. A brief discussion is also given of some other techniques used to measure temperatures in shock tubes, and comments are made regarding these methods as well as on some of the general problems tubes. 1. Introduction Because of the fairly simple fluid-mechanical phe- nomena associated with one-dimensional shock waves, the shock tube affords a means of obtaining a reasonably well-defined sample of test gas in a homogeneous condi- tion whose temperature can greatly exceed the highest attainable in steady-state devices such as furnaces.", 2 This has led to the extensive use of the shock tube in recent years for experiments concerned with chemical kinetics investigations, absolute emission measurements and various high enthalpy flow studies. 3 - 7 Although conditions in the shocked gas may be cal- culated from one-dimensional gas dynamic relationships, questions concerning equilibrium, 8 ' 9 boundary-layer effects, 10 1' and wave interaction,' 2 persist in all shock- tube experiments; this is particularly true in experi- ments performed at relatively low pressure where the gas particle collision frequency is low. Direct measure- ments of the properties of the shocked gas are therefore desirable. In shock-heated gases, any physical or chemical process which occurs behind the shock front tends to have a greater effect on the gas temperature than on the pressure or density. Therefore an accurate determina- tion of the hot gas temperature is perhaps the best diagnostic measurement that can be obtained in shock- tube experiments. It is the purpose of the present paper to describe in some detail a method for obtaining test gas temperatures by utilizing emission from diatomic molecules (results are given for experiments based on emission from the 2; -... 21 band system of The author is with the Heliodyne Corporation, Van Nuys, California. Received 7 October 1965. associated with spectroscopic temperature measurements in shock OH); a discussion is also given of some aspects of tem- perature measurements in general including comments on alternative techniques. 11. The Meaning of Temperature During Relaxation Processes Strictly speaking, the concept of temperature in dilute gas systems has meaning only for an equilibrium system and is defined by the Boltzmann population relationship between two quantized energy levels, El and E2, (ni/n2) = ( 1 /g2) exp-(El - E2)/kT, (1) where the ni and gi are, respectively, the concentrations and statistical degeneracies of the two levels, k is the Boltzmann constant, and T the temperature. In shock tube experiments, the kinetic energy of the shock wave is manifested in various molecular energy forms in the hot gas behind the shock front, namely translational, rotational, vibrational, electronic, and chemical (including ionization) processes. Because the hot gas is not at the same temperature as the surround- ings (the shock tube walls), a true equilibrium situation cannot exist. However, because the transfer of energy during molecule-to-molecule collisions is relatively rapid, it is usually the case at moderate and high gas densities that the population distributions among the various internal molecular states relax in a relatively short time (of the order of a few thousand collisions) and a single temperature adequately describes the state of the gas; Gaydon and Hurle' 3 have pointed out that collisional excitation and de-excitation processes are normally about two orders of magnitude faster than radiation effects. If slight perturbations in the various energy states occur by virtue of the different relaxation times asso- ciated with each mode, it may be possible to describe February 1966 / Vol. 5, No. 2 / APPLIED OPTICS 215
Transcript
Optical Temperature Measurements in Shock Tubesfrom Relative Emission Intensities
Ronald Watson
A method is presented for obtaining spectroscopic temperatures in shock tubes using relative emissionfrom two wavelength regions of a molecular band system. Experimental results are given for the OHviolet system obtained in the reflected wave region near 3500'K. These results show that equilibriumconditions prevail and that the spectroscopic temperatures agree with those calculated from shock wavevelocities. A resume of the appropriate theoretical considerations is given along with a detailed dis-cussion of the experimental techniques required. A brief discussion is also given of some other techniquesused to measure temperatures in shock tubes, and comments are made regarding these methods as wellas on some of the general problemstubes.
1. Introduction
Because of the fairly simple fluid-mechanical phe-nomena associated with one-dimensional shock waves,the shock tube affords a means of obtaining a reasonablywell-defined sample of test gas in a homogeneous condi-tion whose temperature can greatly exceed the highestattainable in steady-state devices such as furnaces.",2
This has led to the extensive use of the shock tube inrecent years for experiments concerned with chemicalkinetics investigations, absolute emission measurementsand various high enthalpy flow studies.3 -7
Although conditions in the shocked gas may be cal-culated from one-dimensional gas dynamic relationships,questions concerning equilibrium,8' 9 boundary-layereffects,10 1' and wave interaction,' 2 persist in all shock-tube experiments; this is particularly true in experi-ments performed at relatively low pressure where thegas particle collision frequency is low. Direct measure-ments of the properties of the shocked gas are thereforedesirable.
In shock-heated gases, any physical or chemicalprocess which occurs behind the shock front tends tohave a greater effect on the gas temperature than on thepressure or density. Therefore an accurate determina-tion of the hot gas temperature is perhaps the bestdiagnostic measurement that can be obtained in shock-tube experiments. It is the purpose of the presentpaper to describe in some detail a method for obtainingtest gas temperatures by utilizing emission fromdiatomic molecules (results are given for experimentsbased on emission from the 2; -... 21 band system of
The author is with the Heliodyne Corporation, Van Nuys,California.
Received 7 October 1965.
associated with spectroscopic temperature measurements in shock
OH); a discussion is also given of some aspects of tem-perature measurements in general including commentson alternative techniques.
11. The Meaning of TemperatureDuring Relaxation Processes
Strictly speaking, the concept of temperature in dilutegas systems has meaning only for an equilibrium systemand is defined by the Boltzmann population relationshipbetween two quantized energy levels, El and E2,
(ni/n2) = ( 1 /g2) exp-(El - E2)/kT, (1)
where the ni and gi are, respectively, the concentrationsand statistical degeneracies of the two levels, k is theBoltzmann constant, and T the temperature.
In shock tube experiments, the kinetic energy of theshock wave is manifested in various molecular energyforms in the hot gas behind the shock front, namelytranslational, rotational, vibrational, electronic, andchemical (including ionization) processes. Because thehot gas is not at the same temperature as the surround-ings (the shock tube walls), a true equilibrium situationcannot exist. However, because the transfer of energyduring molecule-to-molecule collisions is relativelyrapid, it is usually the case at moderate and high gasdensities that the population distributions among thevarious internal molecular states relax in a relativelyshort time (of the order of a few thousand collisions) anda single temperature adequately describes the state ofthe gas; Gaydon and Hurle' 3 have pointed out thatcollisional excitation and de-excitation processes arenormally about two orders of magnitude faster thanradiation effects.
If slight perturbations in the various energy statesoccur by virtue of the different relaxation times asso-ciated with each mode, it may be possible to describe
the state of the gas by effective temperatures, a separateone for each energy mode. Equilibrium among theinternal modes is achieved when these effective tempera-tures reach the same value.
When dissociation reactions occur, if the charac-teristic dissociation time, defined by
am = 1/[k,,(X)] (2)
where kd is the dissociation rate constant and (Y) theconcentration of all species, is long compared to relaxa-tion times for the internal energy modes, then the pre-vious two cases (complete internal equilibration ordifferent Boltzmann distributions among the individualmodes) should adequately describe the state of the gas.However, Treanor, in his very interesting recent work,8
has shown that depopulation of upper vibrational statesby preferential dissociation processes can lead to dis-tributions that are highly non-Boltzmann for the im-portant high-level vibrational states, even at relativelymoderate temperatures.
Because of the experimental difficulties in obtainingdetailed spectral intensity distributions at high resolu-tion in the short testing times available in shock tubes,no measurement indicating the actual extent of possiblenon-Boltzmann effects exists to date. However, it isclear that any spectroscopic temperature measurementsmust assume a population distribution model, and ex-perimental verification of the model is required to insurevalidity of the resulting temperature determination.
It is assumed for the remainder of the present paperthat the shocked gas whose temperature is to be meas-ured is in equilibrium. A discussion of the experimentalverification of this assumption for the measurementscited here will be given in Sec. VII.
111. Measurements of SpectroscopicTemperatures in Shock Tubes
i any optical techniques for measuring equilibriumtemperatures are known and have been discussed in theliterature (see, for example, refs. 14 and 15). The twomost widely known procedures, the line-reversal methodand the rotational line intensity method, have been em-ployed in recent years to obtain gas temperatures inshock tubes." 7 Both of these applications depend onemission from substances added to the gas, the assump-tion being that the additive is in thermal equilibriumwith the other species, thus furnishing a measure of thegas temperature.
Gaydon and his coworkers introduced sodiumchloride into the test gas and observed the emission orabsorption of sodium lines relative to light emissionfrom a lamp (2500'K). 1 This line-reversal tech-nique is relatively free from systematic errors but hasthe limitation of requiring a source of known tempera-ture and is, therefore, practically limited to measuringgas temperatures below about 3000'K, although pulsedor other special types of light sources should extend theusable temperature range. 8 ,"9
The rotational line intensity method was used by
Parkinson and Nicholls on emission from the CNmolecule.'7 These investigators measured the relativeintensities of rotational lines in CN bands of spectro-grams obtained in emission from compounds containingcarbon and nitrogen, the compounds being painted on aiMiylar membrane clamped in the shock tube. Use ofthe rotational line technique requires high spectralresolution and a very fast (low f/D) optical system, aswell as careful calibration of the film. In many cases,intensity and/or resolution may not be sufficient topermit application of this method in shock tubes. Awider spectrograph entrance slit increases the light fluxinto the instrument but reduces the spectral resolution.
Another technique used to measure shock-tube gastemperatures involves the absorption of light by 02
bands in the 2280-2870 A range; it has been utilizedby Wurster and Treanor.2 " Light from a xenon-filledflash lamp was passed through the shock tube, andspecific regions of the absorption spectrum were recordedphotoelectrically. The calculated temperature de-pendence of the absorption thus allows the temperatureto be defined. This broad-band absorption method hasthe advantage of being a direct measurement on thegas species, but it requires knowledge of spectral lineshapes and a light source with high intensity in thedesired spectral region.
A combined emission-absorption technique describedby Tourin2 ' has been used by Lauver et al.
2 2 and Penziaset al.2 to obtain temperatures in the 1500-3000'K range.This method utilizes absorption measurements to ob-tain concentration data which are then used in con-junction with the absolute intensity of the gas im-plicitly to define the gas temperature.
An alternative technique, which forms the basis forthe main results given in this paper and which was ini-tially described by Penner,' 4 involves measurement oflight emission from many rotational lines simultane-ously; no external light source is required, and it isnot necessary to add foreign substances to the gas.
For a transparent gas at equilibrium, the integratedemission (or absorption) for a vibration-rotation bandis given in terms of the vibrational absorption oscillatorstrength n as
7re2 NJabad = - -fn_'[I - exp(-hcook/kT],
mc2p (3)
where e2 /mc2 is the classical electron radius, N, is theconcentration of emitting molecules in the lower vibra-tional state n', p is the partial pressure of the emittingmolecule, and -oon the wavenumber at the band head.For a set of given initial conditions in a shock tube, thequantity band is completely determined by the tem-perature; hence the light flux emitted by a molecularband is also completely determined.
There is a disadvantage, however, in attempting toutilize Eq. (3) in a shock tube experiment, even if the f-number is known precisely, since an absolute calibra-tion of the response of the optical system is required.Although absolute calibrations have been performed fora number of f-number experiments in shock tube studies(see, for example, refs. 6, 7, 24, and 25), the calibration
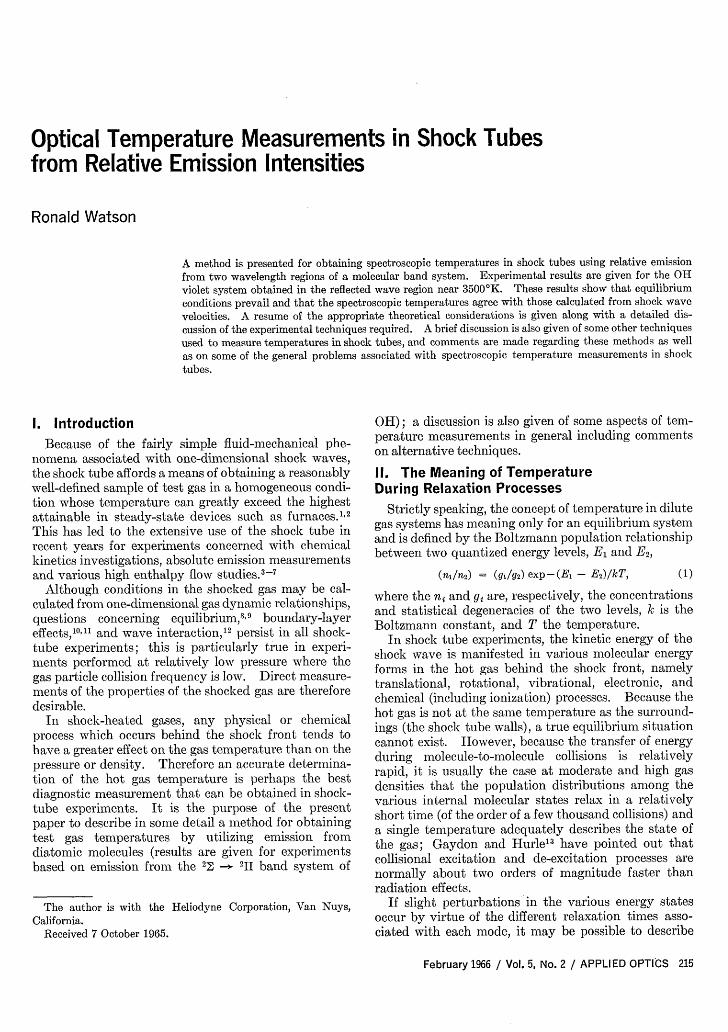
Fig. 1. Schematic diagram of the experimental equipment.
is difficult and agreement between f-number measure-ments is rarely better than within a factor or two.
A simpler shock-tube experiment may be performedby monitoring simultaneously the emission from twoor more wavelength regions of a vibration-rotationband with monochromators (or equivalent filters) hav-ing relatively wide entrance slits and using photo-multiplier detectors to obtain signals whose ratio is aunique function of the emitting gas temperature.These relative intensity measurements (in emissiononly) have the advantage of not requiring an absoluteintensity calibration or the use of an external lightsource. Furthermore, the optical arrangement re-quired for the temperature measurements is essentiallythat required for such experiments as those to measureabsolute intensities, and a direct measurement of thetemperature of the species of interest can be ob-tained while the absolute emission observations arebeing made.
The theoretical basis for this relative emission tech-nique has been described in detail in ref. 26; it is sum-marized in Sec. IV. The method is, of course, ap-plicable to any molecule if the proper data areavailable. Allen2 7 has applied a variation of the rela-tive emission technique in a difficult experiment inwhich he obtained separate rotational, vibrational, andelectronic temperatures in the chemical relaxation zonebehind a shock front in nitrogen at temperatures rang-ing up to 14,0000 K (rotational temperatures).
IV. Theoretical Considerations
The theoretical basis for the relative emission method
is seen most clearly by first considering the contributionfrom a single spectral line to the light flux incident on adetector in the exit plane of a monochromator, and thensumming over all lines passed by the instrument to ob-tain the total flux, and hence the voltage produced, bythe detector system. By comparing the relative mag-nitudes of signals from two separate spectral intervals,it is seen that factors whose absolute magnitudes areuncertain are common to each region, and hence cancelfrom appropriate signal ratios. The schematic diagramof Fig. 1 illustrates the experimental equipment usedto gather the data on OH discussed later in this paper.
A monochromator serves as a transmission filter andhas a nonuniform response to incident light of differentwavelengths. For an instrument with one-to-oneoptics and equal entrance and exit slit-widths, the slitfunction response form is triangular in shape (see Fig. 2)and may be readily determined by scanning a (nearly)monochromatic line such as the 3341.48 Hg line. As aresult of the slit function characteristics, the intensityat each point in the spectral wavenumber bandpass,2Aw*, is weighted by the relative height g. Thesteradiancy B1 from the ith spectral line at the wave-number wi at the exit plane of the monochromator isthen
+ A*
Bi = | e.. Bg d@,0 - A.*
(4)
where wo is the monochromator setting, e, is thespectral emissivity, and B is the blackbody spectralsteradiancy (see, for example, Chap. 1 of ref. 28). Therange 2Aco* in the integration is the wavenumber interval
Fig. 2. The monochromator slit function as determined byscanning the 3341.48 Hg line with a thermocouple; the mono-
chromator slit-width setting is 1.0 mm.
over which the slit function g is nonzero. The trans-mission losses in the shock tube windows and in themonochromator optics may be disregarded since theyare usually constant over typical wavenumber ranges of2Aco* (100-150 A). If the spectral response of thedetector is not constant over 2Ac,*, the variation shouldbe included in Eq. (4), e.g., by using a modified g,,.
The widths of individual spectral lines are smallcompared with 2 Aw* so that Eq. (4) may be written as
the quantum-mechanical matrix element terms for,respectively, the electronic, vibrational, and rotationaltransitions for the particular ith line under considera-tion [details associated with the derivation of Eq. (7)are available, for example, in Chap. 7 of ref. 28; seealso ref. 26].
While absolute values for the matrix element termsin Eq. (7) are often uncertain, relative magnitudesof the vibrational and rotational terms are known formany molecules. In order to utilize the relative emis-sion technique to obtain spectroscopic temperatures, itis required that these data be available.
Since a monochromator passes radiation from manyspectral lines within the slit function base, Eq. (7) mustbe summed over all of the lines in all of the branches ofall bands of the electronic band system considered thatlie within the slit function base. Thus the total stera-diancy in W sr-' cm- 2 observed by the detector at theexit slit, per unit optical depth X, becomes
[(vibrational (band (lines in ]within (8)bands) branches) each branch) 2Aa.*
The signal voltage generated by the detector is de-pendent on this total steradiancy, and for a linearresponse system is given by the relationship
V/X = K(B/X), (9)
where K represents the sensitivity of the optical-detection system (assumed to be spectrally flat) to theincident light flux.
B = B j exidw.W A*
(5)
For the case where the gas is optically thin (trans-parent), the spectral emissivity is simply the product ofthe spectral absorption coefficient P, times the opticaldepth X, and Eq. (3) becomes
0.l+ AX*B = B gX Y
Cl- A.*
P,, dw = B gi 1XSi, (6)
where X is the product of the partial pressure of theemitting species and the geometrical path length of thehot gas seen by the detector, and S,. is the integratedintensity of the ith line.
Assuming ideal gas behavior, statistical equilibrium,and separable wave functions* for the internal energymodes of the molecule, Eq. (6) may be written in theform
Bi 167r'c exp(-E ,/kT)Y = k -.'X4 R| I P'| ' Pkl gxi, (7)X 3kT Q
where c is the velocity of light, E0 i is the energy of theupper state from whence the transition occurs, Q is theinternal partition function, and Rel, Pnn', and Pkk' are
* Calculations concerned with the interaction of the vibra-tional and rotational energy states have been presented in ref.29. The results show that the coupling is important for OH onlyat temperatures greater than about 5000'K.
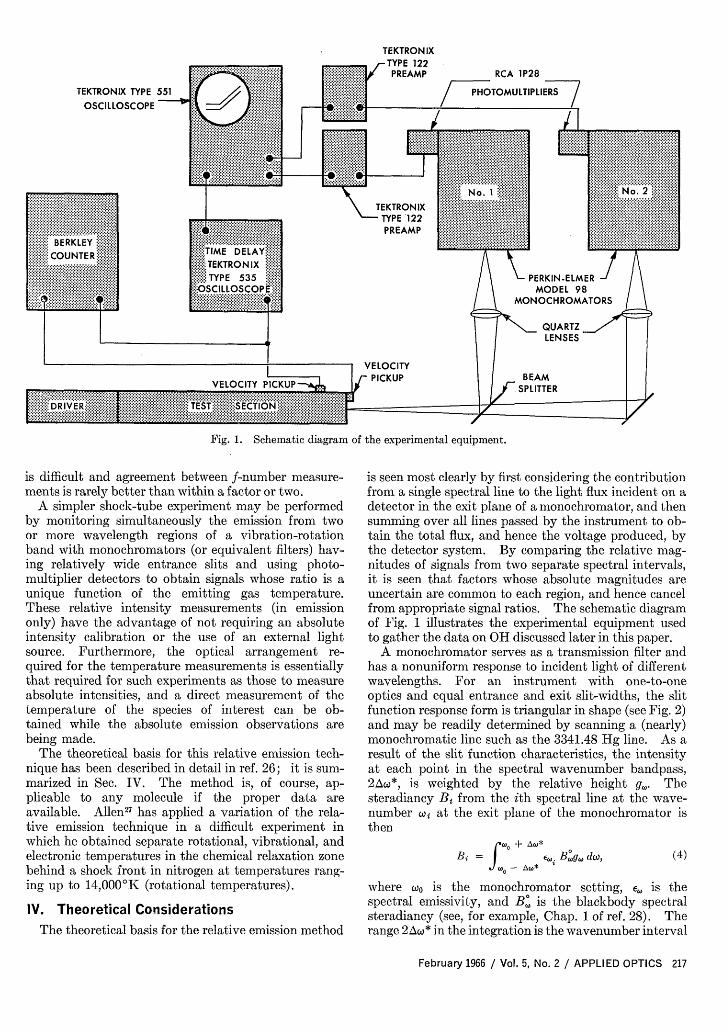
Fig. 4. The intensity ratio, (T), as a function of temperaturefor o2 from 31,000 cm-' to 32,000 cm-'.
For two spectral regions 1 and 2, Eqs. (7), (8), and(9) may be combined to form the intensity ratio
VK, [Z PnnI' E Zi 4[exp(-Euj/kT)] I p,,29(i2
V2K, | pnnt 2 Ew 4 [exp(-Ej/kT)] I Pkk'! i'wi]
Lnn' b i 12A*2
(10)
or simply
VjK2- = (T)- (11)
In Eq. (11), q.(T) represents a calculable function oftemperature which is independent of the shock tubeoperating uncertainties such as species concentrationand shock velocity, as long as the emitting species istransparent and in equilibrium. Note in Eq. (10) thatthe electronic matrix element does not appear since it isassumed to be constant for a given band system.Thus to obtain the spectroscopic temperature implicitlydefined by Eq. (11), it is necessary only to perform theappropriate summations and to determine the relativesensitivities of the two detection systems (i.e., the ratioK2/K,) which is experimentally much easier to do thanare the associated absolute calibrations.
It is appropriate to point out again that Eq. (10) is ageneral relationship applicable to any transparent,equilibrium gas. Specific results in this paper are,however, restricted to the OH molecule.
V. Detailed Calculations for OHCalculations for the temperature function (T)
were performed on computing machines using the data
of Dieke and Crosswhite' 0 for the relative rotationaltransition probabilities, line locations, and energy levels,and the data of Nicholls3" for Franck-Condon factors,jpnnt'i' The slit function was taken to be an isoscelestriangle centered at co and normalized to a peak valueof 1.0 as shown in Fig. 2. The wavenumber 2Aw*was chosen to be 1049 cm-' which corresponds to 100 Aat 3100 A near the band head of the OH violet systemfor the Perkin-Elmer Model 98 monochromators usedin the experiments.
From ref. 30, it is seen that only the (0, 0)-, (1, 1)-,(2, 2)-, and (3, 3)- bands contribute appreciable radiationin the wavenumber interval from 29,000 cm-' to 33,000cm-'. The calculations and experiments were there-fore restricted to this interval and these bands.
The effect of wavenumber setting on the relativelight flux passed by the monochromators may be seenin Fig. 3, which shows the variation of the relative in-tensity term
Irel = [F Pnn|' F -i[exp(-Eji/kT)jpk'1,g9inn' b i 2Aw*
(12)
with wavenumber at typical shock-tube operating tem-peratures.
Consideration of the data shown in Fig. 3 leads tosome conclusions regarding the choice of wavenumbersthat should be used for the two monochromator settingsto obtain 4(T). Since the maximum intensity occursnear co = 32,250 cm-' at all temperatures and is rela-tively insensitive to small errors in monochromatorsettings, this value is an obvious choice for W,,. Inorder to obtain high sensitivity in the temperaturemeasurements, the wo, setting for the other channelshould be as far removed from 32,250 cm-' as possible.The lower limit on c(, is governed by the signal-to-noiseratio at low wavenumbers; also, it is seen that, for agiven error in monochromator setting (e.g., 4 1/3 A), agreater percentage variation occurs in the signal atlower wavenumbers, thus leading to a greater uncer-tainty in the temperature.
In view of these factors, a choice of wavenumbers wasmade which allowed reasonable signal strengths to beattained (based on previous experimental experience),and O(T) was then calculated as a function of tempera-ture for various values of woQ, (see Fig. 4).
From Fig. 4 an estimate may be obtained of theerror in the spectroscopic temperatures produced byerrors in monochromator settings alone.* The maxi-mum error occurs for oo, = 31,000 cm-' and low temper-atures (-3000°K); errors due to uncertainties in wo, areessentially zero since this setting corresponds to thepeak of the curves in Fig. 3. If )0, can be set within 4cm-' (which corresponds to an experimental accuracyof about 1/3 A), the temperature uncertainty contrib-uted by this factor is AT = 25-30°K.
In order to minimize the uncertainty in temperature
* Note that the total error in the experimental measurements isgreater than this because of additional errors in measuring thesignal ratio V,/V2 and the relative sensitivity ratio, K2/KI.
Fig. 5. A typical oscilloscope record from a shock tube test withobservation of the OH emission in the axial direction behind thereflected shock wave. Sweep speed = 50 /Asec/cm. The uppertrace is for 32,250 cm-I at 10 mV/cm; the lower trace is for 31,000cm-' at 5 mV/cm. The spectroscopic temperature is 3680'Kand the calculated equilibrium temperature is 3620'K. Initial
H2O concentration is 0.30%.
produced by inaccuracies in the monochromator settingwhile maintaining a reasonably sensitive indication ofthe temperature near 3500'K, the experiments wereconducted with w)o = 31,000 cm-' (this choice corre-sponds to the top curve in Fig. 5).
Uncertainties in the monochromator slit-width open-ings do not affect the accuracy appreciably since theintensity ratio in Eq. (11) is relatively insensitive tosmall changes in 2Aw* for the slit-widths consideredhere.
VI. Experimental Facilities and ProceduresA schematic diagram of the essential components of
the apparatus (except for the gas-handling equipment)is shown in Fig. 1. Details of the gas-handling systemare described in ref. 32.
A. Shock Tube and Associated MeasuringApparatus
The shock tube was of conventional closed-tube de-sign with a 1.83-m low-pressure test section and a 1.52-mhigh-pressure driver section separated by Mylar plasticdiaphragms. The tube was fabricated from seamlesssteel tubing honed to a uniform diameter (78.21 0.025mm) with a surface finish of better than rms 20. Thetest section vacuum before loading with test gas wasbetween 0.1 and 0.2 with an indicated leak rate of0.01 /min to 0.1 /min. Quartz windows werelocated in the center of the end plate for axial observa-tions, and in various locations in the wall of the tubefor auxiliary observations normal to the tube axis. Ac-commodations for thin film gauges used for shockvelocity measurements were provided in three stations,thus allowing an estimate of shock speed attenuation tobe made.
B. Optical System
Isolation of the required spectral intervals of theemission from the hot gas was achieved by the use oftwo Perkin-Elmer Model 98 monochromators. A half-aluminized thin quartz disk served as a beam splitterin the path of the emission from the shock-tube endwindow (see Fig. 1) and quartz lenses were used to focus
the image of the end window on the monochromatorentrance slits. Apertures in front of the quartz lenseslimited the optical systems to observations in a narrowcore of gas in the center of the shock tube, the core beingabout 1 cm in diameter and essentially cylindrical inshape, with an included divergence angle of less thantan-'(0.04). Thus, side-wall boundary-layer effectsand reflections from the inside of the shock tube wallsdid not affect the measurement, and the volume of gasemitting radiation into the optical system grewlinearly with time as the reflected shock moved up thetube. Viewing emission axially behind the reflectedlshock allows an experimental check to be made on theassumptions that the gas is transparent and in equi-librium if the axial emission is linear with time.
Quartz condensing lenses were used to focus the lightfrom the exit slits of the monochromators onto RCA1P28 photomultipliers. Regulated power suppliesmaintained constant high voltage (500 V d) for thevoltage divider network of the photomultiplier. Thetime response of the load circuitry of the photomulti-pliers was 0.2 sec, but preamplifiers, used to minimizenoise levels, limited the over-all electronic response toabout 5 sec. This response proved adequate since thesignal from the emission behind the reflected shock in-creased linearly on a time scale much longer than 5 Asec.The signals were recorded by photographing the traceson a Tektronix type 551 dual-beam oscilloscope. Thelinearity of the responses of the detection systems tovarying levels of incident light was checked by usingemission from a tungsten lamp focused into both of theoptical systems.
Monochromator wavelength calibrations were per-formed by utilizing various spectral lines from gas dis-charge tubes. The reproducibility and0 accuracy ofthe settings was found to be about 1/3 A on spot re-checks, just prior to each experiment. The slit-func-tion responses were determined from thermocouplesignals obtained by scanning various lines of a low-pressure Hg lamp.
C. Gas-Handling SystemThe OH was generated by the dissociation of water
vapor diluted with argon in the shock tube. In orderto achieve the transparency required by the theoretical
Fig. 6. Oscilloscope record of the OH emission behind the re-flected shock viewed normal to the shock tube axis at 4.57 cmfrom the end wall. Sweep speed = 50 ,usec/cm. Both traces areat 32,250 cm-'; the upper trace gain is 20 mV/cm, the lower trace
gain is 50 mV/cm. Initial H20 concentration is 0.50%.
considerations, it was necessary to use very low initialwater vapor concentrations, namely, 0.3% to 0.5%.Mixtures of argon and water vapor prepared in externalmixing systems, however, exhibit excessive preferentialadsorption of the water vapor on the walls of the gas-handling equipment and the shock tube during thebleed-in procedure. To avoid difficulties due to thiseffect, a flushing procedure was used which allowed thetest gas mixture to flow continuously through the shocktube for periods of about 30 min before each experi-ment to insure that adsorption-equilibrium wasachieved and that the concentration was uniformthroughout the tube.32
D. Determination of the Relative SensitivityRatio, I(/K 1
The ratio of relative sensitivities of the two opticalsystems was obtained directly from shock-tube experi-ments with both monochromators monitoring emissionfrom the same wavelength interval. The resultingsignal ratio was the desired factor, K2/K1 . The cali-bration records were similar to Fig. 5, except withc0o, set at o,. Because c)oo and coo, are within 100 A, onlyminor corrections were required to account for varia-tions in instrument response (such as monochromatordispersion) when changing the monochromator settingsover this interval.
VII. Experimental Results
A typical oscilloscope trace of emission from the twowavelengths, 32,250 cm-' and 31,000 cm-', is shownin Fig. 5. The initial slopes of these records representemission per unit length of test gas and, together withthe K 2/K1 factor, permit determination of the spectro-scopic temperature of the OH by utilizing the cal-culated values of O(T). In Table I, the results derivedfrom a number of experiments are compared with the
temperature from machine calculations using measuredshock velocities and equilibrium gas dynamics relation-ships.
Figure 6 shows an oscilloscope signal from an experi-ment in which emission normal to the tube axis wasobserved from a 1-cm diam window in the side wall at adistance of 4.57 cm from the end of the shock tube.This location corresponds to a time interval of about 70sec after the reflected shock leaves the end plate and
thus is about in the middle of the 200 sec testing time ofthe axial observations shown in Fig. 6.
The linear growth of intensity observed in the axialruns, coupled with the steady signal during the earlypart of the cross-tube observations at the windowlocation 4.57 cm from the end wall, indicates that thegas was transparent, isothermal, and in thermal equilib-rium during the time interval of 200 Msec used for thespectroscopic temperature measurements. Approxi-mately 106 collisions occurred between the OH and otherspecies during the 200 Atsec period.
A cross-tube observation at a second window loca-tion 14.7 cm from the end wall showed that the OHemission was reduced by more than a factor of 30 belowthe level of the cross-tube observations at the firstwindow. The location of the second window corre-sponds to the point where the reflected shock is about200 Msec from the end wall and suggests that the re-flected shock interacts with the contact region at aboutthis time and thus explains the decay in intensity inthe axial observations after about 200 uisec in Fig. 5.
A. Estimate of Accuracy
The estimated accuracy of the spectroscopic tem-perature measurements is about 750K. Contribu-tions to this total error come from (a) errors in mono-chromator settings, (b) errors in the K 2/K1 calibration,and (c) uncertainties in determining V1/V2 from oscillo-scope records. The error due to uncertainties in themonochromator setting (i.e., -1/3 X) is about 250 K to30'K, as discussed previously. The uncertainty in theK2/K1 calibration was about 3%. From the data for+(T) in Fig. 4, it may be seen that this uncertainty inK2/K1 produces about +4 30'K uncertainty in thespectroscopic temperature. The initial slopes of thetemperature data oscilloscope records for V1/V2 couldbe determined to about 3% uncertainty also, whichleads to an uncertainty of about ± 30'K in the meas-ured temperature.
The difference between the spectroscopic and equi-librium temperature shown in Table I varies more than+ 750 K in some cases, presumably because there areuncertainties in the shock-tube performance data (suchas measured shock velocities and initial mixture tem-peratures). A 1% variation in the measured shockvelocity causes a variation of about + 650 K in thecalculated reflected shock temperature, while a 20 Cuncertainty in initial temperature causes a variation ofabout 250 K behind the reflected shock. Negligibleerrors in the reflected shock temperatures are intro-duced by fairly large uncertainties (e.g., + 5% or more)
in initial pressure because the temperature ratios acrossthe shocks are not sensitive to this parameter.
B. Vibrational Relaxation of OHThe lower trace in Fig. 6 is due to emission primarily
from the (2, 2)- and (3, 3)- vibration-rotation bands inthe 22 - 211 system while the upper trace correspondsto emission primarily from the (0, 0)- and (1, 1)- bands.Reference to the initial portions of these traces indicatesthat a time lag is required for the upper vibrationalstates to come into statistical equilibrium with thelower states.
Approximating the intensity-time relationship forthe (2, 2)- and (3, 3)- band emission by the expression:
I = c(t - )[1 - exp(-t/)],
it is seen that the vibrational relaxation time () isabout 25 /isec for this process. Similar values (15,Msec to 30 usec) were observed in most of the experi-ments which were performed over a relatively smalltemperature range. These observed relaxation timesare in approximate agreement with values calculatedfrom the Schwartz-Slawsky-Herzfeld method3 assumingreasonable collision diameters.' 4
It should be noted that the spectroscopic temperaturemeasurements are not affected by relaxation processessince (T) depends only on the increase of intensityper unit optical depth and is determined from the slopesof the equilibrium portions of the oscilloscope traces.
VIII. Conclusions
The experimental records indicate that thermalequilibrium in the OH IT .-.
2II system was achievedbehind the reflected shock wave. The spectroscopictemperatures obtained by the procedures described herewere in good agreement with calculated equilibriumtemperatures based on measured shock velocities;this indicates that the wide-band, dual-wavelengthemission method may be adapted to measure hot gastemperatures in shock tubes, if conditions correspondapproximately to those presented in this paper.
The advantages of the method described here are thatno external calibrated light sources are required, and,by using wide wavelength regions for the observations,high spectral resolution is not necessary. In addition,the technique as adapted to the reflected shock-wavestudies using axial observations allows experimentalverification of the equilibrium state and transparency ofthe gas.
Some limitations oi the method are that it requiresthe addition of small traces of water vapor (which de-presses the gas temperature), and since the techniquedepends on emission from molecules it is useful onlyfrom a lower temperature of about 2500'K to an upperlimit of perhaps 600 0 K depending on the availablesignal; no attempts have been made to check the upperlimit experimentally, however.
It is of course required that the chosen spectral inter-vals contain emission from gases for which (T) may becomputed. In all cases, due care should be exercised to
establish that al equilibrium situation exists in orderthat the method be valid.
The author is indebted to S. S. Penner for helpful ad-vice and discussions during the experimental work.
Part of this work was supported under a U.S. AirForce grant at the California Institute of Technology,Pasadena, California.
References1. E. L. Resler, S. C. Lin, and A. Kantrowitz, J. Appl. Phys.
23, 1390 (1952).2. I. I. Glass and J. G. Hall, Handbook of Supersonic Aero-
3. T. Carrington and N. Davidson, J. Phys. Chem. 57, 418(1953).
4. C. E. Treanor and W. H. Wurster, J. Chem. Phys. 32, 758(1960).
5. J. C. Keck, J. C. Camm, and B. Kivel, J. Chem. Phys. 28,723 (1958).
6. R. Watson, J. Quant. Spectry. Radiative Transfer 4, 1(1964).
7. T. D. Wilkerson, PhD Thesis and Univ. of Michigan Dept.of Physics Rept. No. 02822-3-T (June 1961).
8. C. E. Treanor, Reprint No. 65-29, 2nd Aerospace SciencesMeeting of the AIAA, New York, Jan. 1965.
9. W. L. Shackleford, PhD Thesis, California Institute ofTechnology, 1964.
10. A. Roshko, Phys. Fluids 3, 835 (1960).11. H. Mirels, "Boundary Layer Effects in Shock Tubes", pre-
sented at the American Physical Society 5th Shock TubeSymposium, Washington, D.C., 28-30 April 1965.
12. A. Hertzberg, W. E. Smith, H. S. Glick, and W. Squire,Report AD-789-A-2, Cornell Aeronautical Lab. (March1955).
13. A. G. Gaydon and I. R. Hurle, The Shock Tube in HighTemperature Chemical Physics (Reinhold, New York, 1963).
14. S. S. Penner, in Temperature, Its Measurement and Con-trol in Science and Industry (Reinhold, New York, 1962),Vol. 3, Part 1, pp. 561-574.
15. J. G. Phillips, in Optical Spectrometric Measurements of HighTemperatures, P. J. Dickerman, ed. (Univ. of Chicago Press,Chicago, 1961).
16. J. G. Clouston, A. G. Gaydon, and I. I. Glass, Proc. Roy.Soc. (London) 248A, 429 (1958); J. G. Clouston, A. G.Gaydon, and I. R. Hurle, Proc. Roy. Soc. (London) 252A,143 (1959); A. G. Gaydon and I. R. Hurle, Proc. Roy.Soc. (London) 262A, 38 (1961).
17. W. H. Parkinson and R. W. Nicholls, Can. J. Phys. 38, 715(1960).
18. L. Nadaud and M. Gicquel, "Mesure Optique des Tem-peratures Elevees", from AGARD meeting on High Tem-perature Aspects of Hypersonic Flow, Brussels, April 1962.
19. G. Charatis, PhD Thesis, Univ. of Michigan, 1961.20. W. H. Wurster and C. E. Treanor, "Spectroscopic Technique
for Temperature-Density Measurements in Oxygen-BearingFlows", Cornell Aeronautical Lab. Rept. No. AD-118-A-10,Buffalo, N.Y. (Dec. 1959).
21. R. H. Tourin, "Monochromatic Radiation Pyrometry ofHot Gases, Plasmas, and Detonations", in Temperature, itsMeasurement and Control in Science and Industry (Reinhold,New York, 1962), Vol. 3, Part 2, Chap. 43.
22. M. R. Lauver, J. H. Hall, and . E. Belles, TMX-52104,NASA-Lewis Research Center, Cleveland, Ohio (April1965).
23. G. J. Penzias, S. A. Dolin, and H. A. Kruegle, "Determina-tion of Shock Temperatures from Simultaneous InfraredEmission and Absorption Measurements", presented at theAmerican Physical Society 5th Shock Tube Symposium,Washington, D.C., 28-30 April 1965.
24. W. H. Wurster, J. Chem. Phys. 36, 2111 (1962).25. R. A. Allen, J. C. Camm, and J. C. Keck, J. Quant. Spectry.
Radiative Transfer 1, 269 (1961).26. R. Watson, "Spectroscopic Temperature Measurements in
Shock Tubes Utilizing Emission from the OH Violet Bands",presented at the American Physical Society 5th Shock TubeSymposium, Washington, D.C., 28-30 April 1965.
27. R. A. Allen, J. Quant. Spectry. Radiative Transfer 5, 511(1965).
28. S. S. Penner, Quantitative Molecular Spectroscopy and GasEmissivities (Addison-Wesley, Reading, Mass., 1959).
29. R. Watson and W. R. Ferguson, J. Quant. Spectry. Radia-tive Transfer 5, 595 (1965).
30. G. H. Dieke and H. M. Crosswhite, J. Quant. Spectry.Radiative Transfer 2, 197 (1962).
31. R. W. Nicholls, Proc. Phys. Soc. (London) A69, 741 (1956).
32. R. Watson, Rev. Sci. Instr. 10, 1113 (1962).
33. R. N. Schwartz, Z. I. Slawsky, and K. F. Herzfeld, J. Chem.Phys. 20, 1591 (1952).
34. K. F. Herzfeld and T. A. Litovitz, Absorption and Disper-sion of Ultrasonic Waves (Academic, New York, 1959), p.
328.
Meeting Reports continued from page 214
but whose absence would make the pictures unattractive. It isalmost a pity that the human eye-brain combination is so highlydeveloped, but then, if it were not, we would lose much of greatbeauty, and congresses of this kind would be much less popularand consequently less successful.
The international committee met to discuss future congressesand accepted, with pleasure, the Swedish invitation to hold the8th Congress at Uppsala in late June 1968. The delay to 1968 wasdictated by the need to avoid late 1967 when Swedish trafficmoves from the left- to the right-hand side of the road, and alsofinds agreement among some delegates that two years can betoo short a period both for organization and for enough reallynew ideas to have developed.
Colloquium on the Optical Properties andElectronic Structure of Metals and Alloys,Paris, 13-16 September 1965
Reported by Jean M. Bennett and H. E. Bennett, MichelsonLaboratory, China Lake, California
An international colloquium covering both theoretical and ex-perimental aspects of the optical properties of metals and alloyswas held in the red-carpeted Rochefoucauld-Liancourt room ofthe Club des Ingenieurs Arts et M6tiers in Paris from 13 to 16September. Cosponsored by the Direction des Recherches etMoyens d'Essais, Ministere des Armies, France, and the U.S.Air Force Office of Scientific Research, the meeting attracted 175attendees not only from the host country, France, but also fromthe United States, England, Germany, Norway, Switzerland,Israel, Japan, and even the Iron Curtain countries of Czecho-slovakia, Poland, and Russia. This group, which included mostof the leading scientists in the field of optical properties of metals,ranged from pure theoreticians to experimentalists. As a result,the sessions were characterized by lively discussions with manyparticipants. In a short review one can only hope to mention afew of the many excellent papers which were presented. Thetone of the meeting was set on an international level by theopening remarks in French by Mar6chal followed by a secondwelcome by Abels, also in French with English interspersed forthe important points. To provide a basis for common under-standing and to clarify the present status of solid-state theoriesdealing with the optical properties of metals, W. Kohn gave awell-presented introductory survey which emphasized that, whilethere has been much progress in the theoretical treatments, thereare still serious gaps in our understanding even of simple materialssuch as the alkali metals. The lively discussion which followedKohn's talk included suggestions by Spicer that indirect transi-
tions, which had not been discussed, may account for some of theunexplained optical phenomena. These remarks set the stagefor an interplay between groups emphasizing the relative im-portance of direct or indirect transitions, respectively, whichlasted throughout the meeting.
Further introductory material was presented by Heine whodiscussed how pseudopotential calculations could be used as abootstrap operation to formulate band structures for variousmaterials using inputs from the experimental data. Heine's firstslide noting the progress since 1957 in solving the Schr5dingerequation and setting up the potentials used cartooned facialexpressions with frowns and smiles to add a touch of humorwhich was not unappreciated. J. C. Phillips in a following talkpointed out that the complete theory must predict not only (1)the threshold energy for interband transitions, i.e., the criticalpoints but also (2) the shape, and (3) the magnitude of El and eQ.Often theorists stop with (1).
Throughout the introductory talks the speakers were becomingacquainted with the fact that the projectionist did not understandEnglish, and if one pushed the buzzer once he got the next slideand if twice he got the room lights. Several catastrophes wereaverted by attractive Mlle Theye, a solid-state physicist in herown right, who acted as one of the conference coordinators anddirected the projectionist in fluent French.
Following the afternoon orange juice and cookies break, themost controversial experimental work of the meeting was pre-sented. H. Mayer reported the surprising results of measure-ments of the optical properties of the alkali metals obtained inhis laboratory. Unexpected structure was found in the high-
continued on page 230
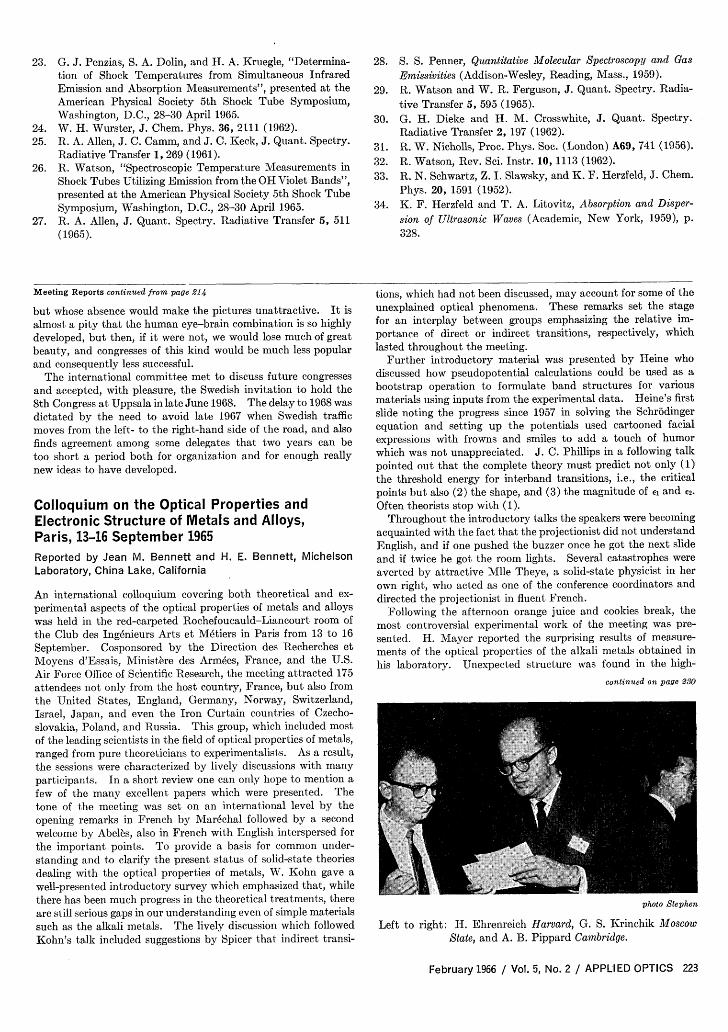
photo Stephen
Left to right: H. Ehrenreich Harvard, G. S. Krinchik MoscowState, and A. B. Pippard Cambridge.
The Optical Society of AmericaOfficers of the SocietyVAN ZANDT WILLIAMS, American Institute of Physics, 335 E. 45th Street, New York, N.Y. 10017JOHN A. SANDERSON, Optics Division, Naval Research Laboratory, Washington, D.C. 20390S. Q. DUNTLEY, Visibility Laboratory, Scripps Institution of Oceanography, University of
California, San Diego, Calif. 92152MARY E. WARGA, OSA, 1155 16th Street N.W., Washington, D.C. 20036ARCHIE I. MAHAN, Applied Physics Laboratory, 8621 Georgia Avenue, Silver Spring, Md. 20910
DAVID L. MACADAM, 68 Hammond Street, Rochester, N.Y. 14615JOHN N. HOWARD, AFCRL, Bedford, Mass. 01731
Directors-at-LargeHOWARD CARY (66) * A pplied Physics Corporation, 2724 South Peck Road, Monrovia, Calif.GLENN A. FRY (66) * School of Optometry, Ohio State University, Columbus, Ohio 43210A. F. TURNER (66) * Bausch & Lomb, Incorporated, Rochester, N.Y. 14602KARL G. KESSLER (67) * 307 West Bldg., National Bureau of Standards, Washington, D.C. 20234ADEN B. MIENEL (67)* Steward Observatory, University of Arizona, Tucson, Ariz.F. Dow SMITH (67) * Itek Corporation, Lexington, Mass. 02173ROBERT P. MADDEN (68) * National Bureau of Standards, Washington, D.C.ARTHUR L. SCHAWLOW (68) * Department of Physics, Stanford University, Stanford, Calif.RODERIC M. SCOTT (68) * Perkin-Elmer Corporation, Norwalk, Connecticut 06852
Local SectionsRochester JOHN D. HAYES President
JOSEPH H. ALTMAN President-ElectJUDITH W. ONLEY Secretary
Department of PsychologyUniversity of RochesterRochester, N.Y. 14620
ROGER P. LOVELAND TreasurerNew England GEOFFREY C. HARVEY President
BRIAN O'BRIEN Vice-PresidentROBERT R. SHANNON Secretary
Itek Corporation10 Maguire Rd.Lexington, Mass. 02173
WALTER P. SIEGMUND TreasurerDelaware M. E. GONSHERY President
Valley J. W. SHEAN Vice-President, ProgramsT. D. ROBERTS Secretary
General Electric CompanyP. 0. Box 8555Philadelphia, Pa. 19101
F. A. JESSEN TreasurerNational WILLIAM E. BEHRING President
Capital JAMES D. PURCELL 1st Vice-PresidentLUTZ LEOPOLD Secretary
Department of PhysicsGeorgetown UniversityWashington, D.C.
LESTER C. LEWIS Treasurer
Tucson JOHN W. ROBSON ChairmanDONALD J. STRITrMATTER Chairman-ElectRALEIGH M. DRAKE Secretary
Kitt Peak National Observatory950 North Cherry AvenueTucson, Ariz. 85717
PAMELA A. SHACK Treasurer
Texas JOHN ROMANKO PresidentULRICH 0. HERRMANN President-ElectWINFIELD W. SALISBURY Secretary-Treasurer
Varo Inc.135 East Walnut StreetGarland, Tex. 75041
Chicago HOWARD R. PADGITT PresidentARTHUR V. APPEL Vice-PresidentRUDOLPH W. LINDICH, JR. Secretary
Engis Equipment Company8035 Austin AvenueMorton Grove, Ill. 60053
RICHARD R. MOERSCH Treasurer
SouthwesternConnecticut
EMIL H. THIELENS PresidentL. F. BARCUS Vice-PresidentPAUL F. FORMAN Secretary
Perkin-Elmer CorporationMain AvenueNorwalk, Conn.
MARC DREYFUS Treasurer
Greater JOSEPH MI. CORcos PresidentNew York BENNETT SHERMAN First Vice-President
A. K. CHITAYAT Secretary8 Gilbert LanePlainview, N.Y.
L. MAYER Treasurer
Pittsburgh JAMES E. PATERSON PresidentJOSE PASTOR Vice-President,
The Optical Society of America was organized in 1916 "to increase and diffuse the knowledge of optics in all its branches, pure andapplied, to promote the mutual interests of investigators of optical problems, of designers, manufacturers and users of optical instruments, and apparatusof all kinds and to encourage cooperation among them". The Society invites to membership all who are interested in any branch of optics, either in re-search, in instruction, in optical or illuminating engineering, in the manufacture and distribution of optical goods of all kinds, or in physiological and medicaloptics. Further information may be obtained from the Executive Secretary of the Society.


![SHOCK[1] - Hypovolemic Shock](https://static.documents.pub/doc/80x56/58edc1bc1a28abae538b4711/shock1-hypovolemic-shock.jpg)


