225 International Journal of Transportation Engineering, Vol.4/ No.3/ Winter 2017 Optimal Blood Transportation in Disaster Relief Considering Facility Disruption and Route Reliability under Uncertainty Sara Cheraghi 1 , Seyyed-Mahdi Hosseini-Motlagh 2 Received: 13. 04. 2016 Accepted: 01. 11. 2016 Abstract The blood supply chain as a part of a healthcare system plays a substantial role in improving health within societies and supplying blood for daily needs. Specifically in disaster condition, blood supply is the challenge requiring more attention. This paper presents a fuzzy-stochastic mixed integer linear programming model to design blood supply chain network for disaster relief. To deal with uncertainty in the model parameters, a fuzzy programming approach is considered, and the combination of the expected value and the chance constrained programming is applied to solve the proposed model. Besides, a real case study in Iran is implemented to illustrate the applicability of the model. The results imply that an appropriate adjustment in the capacity and coverage radius of blood facilities, a decrease in the disruption probability of facilities and transportation routes as well as referral rate, can be applied as strategies to improve the supply chain costs. Keywords: Blood supply chain; disaster; fuzzy-credibility; chance-constrained programming Corresponding author E-mail: [email protected]1 MSc. Student, School of Industrial Engineering, Iran University of Science and Technology, Tehran, Iran 2 Assistant Professor, School of Industrial Engineering, Iran University of Science and Technology, Tehran, Iran
Transcript
225 International Journal of Transportation Engineering, Vol.4/ No.3/ Winter 2017
Optimal Blood Transportation in Disaster Relief Considering Facility Disruption and Route Reliability under
Uncertainty
Sara Cheraghi1, Seyyed-Mahdi Hosseini-Motlagh2
Received: 13. 04. 2016 Accepted: 01. 11. 2016
Abstract The blood supply chain as a part of a healthcare system plays a substantial role in improving health within societies and supplying blood for daily needs. Specifically in disaster condition, blood supply is the challenge requiring more attention. This paper presents a fuzzy-stochastic mixed integer linear programming model to design blood supply chain network for disaster relief. To deal with uncertainty in the model parameters, a fuzzy programming approach is considered, and the combination of the expected value and the chance constrained programming is applied to solve the proposed model. Besides, a real case study in Iran is implemented to illustrate the applicability of the model. The results imply that an appropriate adjustment in the capacity and coverage radius of blood facilities, a decrease in the disruption probability of facilities and transportation routes as well as referral rate, can be applied as strategies to improve the supply chain costs.
Corresponding author E-mail: [email protected] 1 MSc. Student, School of Industrial Engineering, Iran University of Science and Technology, Tehran, Iran 2 Assistant Professor, School of Industrial Engineering, Iran University of Science and Technology, Tehran, Iran
Optimal Blood Transportation in Disaster Relief Considering Facility Disruption and Route …
International Journal of Transportation Engineering, 226 Vol.4/ No.3/ Winter 2017
1. Introduction Rapidly increasing healthcare costs, especially in developing countries, have impeded health systems to improve their performance. Since blood supply chains (BSCs) as parts of healthcare systems play a key role in contributing to health improvement within societies, improving service quality besides reducing costs of the BSC is of great significance [Cheraghi, Hosseini-Motlagh and Ghatreh-Samani, 2017; Riahi, Hosseini-Motlagh and Teimourpour, 2013]. Blood is one of the most critical products in healthcare, for which no alternatives have been found so far despite medicines development. Although blood availability in both regular healthcare treatment and emergency cases is so critical, blood donation rate varies in each country. In the US, for instance, only 10% of the qualified people donate blood. However, the rate is even less in developing and low-income countries according to WHOi. As a result, blood supply and demand conformity requires the infrastructure development in collection, production and distribution of blood. Moreover, satisfying demand and minimizing costs and wastages are regarded as the chain preferable targets.
BSC and disaster management have become the two popular research fields in recent decades due to the increasing number of disasters. According to the related studies by IFRCii, around 71,800 disasters occurred in the world from 2000 to 2010 by which around a million were killed, and over 2,550 million were injured [Chester, 1995]. A part of this loss is directly owing to the disaster itself, while the rest concerns the deficiency of management as well as the supply of blood and other relief items. Thus, the necessity of an appropriate BSC network is perceived more than ever.
After the disasters happen (i.e., post-disaster phase), the affected people will demand food, shelters, healthcare equipment and other critical requirements that the most significant one is blood, which is considered as a scarce and vital commodity in healthcare. Accordingly, the proper supply of blood is regarded as the challenge that governments' healthcare systems
always face with [Beliën and Forcé, 2012]. Blood donation has no specific pattern and usually occurs in an irregular basis. In addition, the imprecise demand of blood besides the diversity of blood products with limited and different shelf lives; e.g., platelets, as the most perishable blood component and plasma as almost non-perishable one, imposes more complexity on BSCs [Rytila and Spens, 2006]. Moreover, any shortages are too costly, and may even lead to death. Blood donation takes place while referring to either mobile or permanent blood facilities. All blood quantities, drawn from the donors, are then temporarily transferred to regional facilities which account for testing and delivering blood products to hospitals and healthcare centers as soon as they are in need.
Generally, a BSC, which is composed of blood collection and production as well as inventory control and distribution processes, requires to make strategic, tactical and operational decisions, respectively for facility location, needed before the disaster occurrence, and inventory management besides blood distribution in post-disaster phase. Therefore, an efficient comprehensive BSC design especially in disaster condition, is of an importance to the chain improvement.
Papers on BSCs are mostly presented while accounting for deterministic condition, and only a few papers have studied the chain in disaster condition. Accordingly, we aim to investigate a BSC model in disasters considering uncertainty in model parameters to make the situation more realistic.
The inevitable uncertainty of critical data is a significant issue while designing a BSC network in disasters through optimization models. In large-scale real problems such as disasters or emergency cases, not enough data may be available or easy to access. In such occasions, parameters including demand amount, costs, and travel times are involved with uncertainty. Thus, it is of specific importance to consider these uncertain parameters in our model. Randomness and fuzziness are the two main types of uncertainty. Randomness is originated from
Sara Cheraghi, Seyyed-Mahdi Hosseini-Motlagh
227 International Journal of Transportation Engineering, Vol.4/ No.3/ Winter 2017
random (chance) nature of data. In such case, probability distributions (either discrete or continuous) can be estimated by using available sufficient historical data. Moreover, this type of uncertainty can be modeled through stochastic or robust programming approaches whether the random distributional information is available or not. Besides, stochastic programming approach is preferred only if an action is repeated several times over the planning horizon [Tofighi, Torabi and Mansouri, 2016]. However, these conditions do not hold in some cases like disasters in which the shortage of historical data and no repetition of a disaster occurrence during the planning horizon withhold us from modeling uncertain parameters as random data. In such occasions, we encounter imprecise parameters in the sense that we have no knowledge about their precise values. Indeed, it implies the epistemic uncertainty (an inherent impreciseness) in these parameters [Kabak and Ülengin, 2011] for which it is almost impossible to guess the probability distributions. In this situation, using fuzzy concept, reasonable estimations for these epistemic uncertain parameters will be provided based on the field experts' professional opinions. Thus, as a complement to the probability theory, we can formulate these parameters via the possibility theory. To this end, we first adopt a possibility distribution (i.e. trapezoidal or triangular fuzzy numbers) for each imprecise parameter, then an appropriate fuzzy-stochastic programming approach is applied to cope with the parameters epistemic uncertainty [Torabi and Hassini, 2008].
In this paper, we devise a hybrid uncertainty programming approach based on two-stage stochastic programming and fuzzy programming to handle inherent random and epistemic uncertainties in critical input data while designing a BSC network for disaster relief.
The reminder of the paper is classified into 7 sections. The related literature to disaster management and BSCs as well as BSC in disasters is reviewed in Section 2. Section 3 is dedicated to problem definition and model formulation. The combination of the expected value and the chance constrained programming is developed in Section 4 to solve the proposed
model. In Section 5, we apply a real case study to evaluate the efficiency and applicability of the proposed model, and the corresponding results are reported in Section 6. Finally, the conclusion remarks and possible future research directions comprise Section 7.
2. A Review of Related Literature In this section, we first briefly review the related papers to blood supply chain network design. Furthermore, Papers on disaster management are then reviewed and BSC in disasters is investigated by the relevant papers at the end.
The study of BSC management started in 1960s. According to the related surveys, one developed by Beliën, and Forcé [Beliën and Forcé, 2012] and another by Osorio, Brailsford and Smith [Osorio, Brailsford and Smith, 2015], papers on this field of interest can be classified into diverse ranges based on different criteria such as type of blood products, type of problems and the decision levels, solution methods and practical implementation. In an effort, an optimization model for donors' allocation to blood centers was proposed by Pierskalla and Roach [Pierskalla and Roach, 1972] by which the optimal numbers and location of blood centers as well as the coordination between supply and demand points are determined. In another effort, a bi-objective integer mathematical model for blood bank location-allocation problem in the Turkish Red Crescent Society was outlined by Şahin, Süral and Meral [Şahin, Süral and Meral, 2007]. The objective functions aim at minimizing the weighted traveled distance and the number of blood terminals as well as maximizing the covered population. Nagurney and Masoumi [Nagurney and Masoumi, 2012] presented an optimization bi-objective mathematical model including the location of collection facilities, laboratories and distribution centers to obtain the optimal allocation while minimizing the total supply risk and costs including operating cost as well as depot penalty and shortage costs over a single-period planning horizon. Arvan, Tavakkoli-Moghaddam and Abdollahi [Arvan, Tavakkoli-Moghaddam and Abdollahi, 2015] worked on a bi-objective model to design the
Optimal Blood Transportation in Disaster Relief Considering Facility Disruption and Route …
International Journal of Transportation Engineering, 228 Vol.4/ No.3/ Winter 2017
BSC network considering laboratories, blood bank centers, hospitals and donation zones. The objectives were considered as minimizing operating and transportation costs as well as blood products expiration. They applied 휀-constraint approach to solve the proposed model in which all parameters are considered to be deterministic. In another work, Zahiri et al. [Zahiri et al., 2015] developed an integer programming model for blood collection management under uncertainty. They applied a fuzzy-robust approach, and implemented a case study of Babol. The required decisions were made in two phases, such that the location of mobile and permanent blood facilities was determined in strategic phase, and the allocation of donors was then decided in tactical phase.
Disaster management totally consists of four stages including mitigation, preparedness, response and recovery [Sheu, 2007]. Some papers have considered the problem as a two-stage model due to uncertainty in demand. Decisions are normally made deterministically at the first stage and the results are transferred to the next one. Huang, Smilowitz and Balcik [Huang, Smilowitz and Balcik, 2012] studied a two-stage network design mathematical model for disaster preparedness and response phases. Demand and vehicles capacities are taken into account as stochastic parameters. At the first stage, the capacity and location of each facility besides relief items supplies are determined, and the quantity of satisfied demand at each demand zone as well as shortage level in each facility is then specified at the second stage. The problem has been formulated as a single-objective model while minimizing the establishment cost of facilities, relief items supply and shortage costs. A mathematical model was analyzed by Noyan [Noyan, 2012] to specify the location and inventory level of relief distribution centers in mitigation phase. Demand and supply of relief items as well as the capacity of facilities are considered as imprecise parameters. Besides, the network costs are to be minimized through the single-objective model. A robust optimization model for earthquake response phase was presented by Najafi, Eshghi and Dullaert [Najafi,
Eshghi and Dullaert, 2013]. They worked on a multi-objective model to minimize unsatisfied demand, the number of disregarded injured and vehicles used, in which demand and supply of relief items besides the number of injured are inexplicit parameters. They also applied a related case study to the problem in Iran to illustrate the applicability of their model. Chakravarty [Chakravarty, 2014] proposed a two-stage model for preparedness and response phases to decide on time and quality of relief distribution in disasters. In this model, response time and excess demands are to be minimized as the objectives, in which the disaster severity, cost structure and demand of relief resources are regarded stochastic. The inventory level in each supply point is specified at the first stage, and the quantity of supply and response time are then determined at the second stage. Tofighi, Torabi and Mansouri [Tofighi, Torabi and Mansouri, 2016] worked on a two-echelon humanitarian logistics network design for earthquake preparation in Tehran while dealing with both pre- and post-disaster logistical problems. They proposed a novel mixed possibilistic two-stage scenario-based stochastic programming approach to cope with the epistemic uncertainty of the problem. The locations of facilities including central warehouses and local distribution centers besides the amount of inventory prepositioned for relief supplies are specified in the first stage with respect to the uncertainty in supply and demand data along with the transportation routes availability while an earthquake occurs. Planning for relief distribution is provided during the second stage under different disaster scenarios to minimize total delivery time, total cost of inventory surplus, the maximum delivery time for critical relief items and shortage cost resulting from unsatisfied demand. They applied the weighted augmented 휀-constraint method to solve the proposed multi-objective model and developed a tailored differential evolution (DE) algorithm to obtain efficient solutions within a reasonable length of time.
In an effort, a dynamic multi-period model was developed by Sha and Huang [Sha and Huang, 2012] for blood supply in Beijing after earthquake
Sara Cheraghi, Seyyed-Mahdi Hosseini-Motlagh
229 International Journal of Transportation Engineering, Vol.4/ No.3/ Winter 2017
occurrence. The model was applied to optimize the location-allocation of temporary blood facilities by minimizing the total costs of facilities establishment and repositioning besides operating and shortage costs over the planning horizon, regardless to uncertainty in blood supply. In another work, an MILP stochastic model for BSC in emergency condition was proposed by Jokar and Hosseini-Motlagh [Jokar and Hosseini-Motlagh, 2015]. Their model aimed to optimize the network total cost including blood wastage and shortage costs. They considered the capacity of mobile blood facilities as a variable, and determined the optimal service area and number of blood facilities with respect to different disaster scenarios. Their results proved that changes in the capacity of mobile blood facilities can affect the optimal number of mobile as well as permanent facilities. A bi-objective model was proposed by Fahimnia et al. [Fahimnia et al., 2015] to determine the optimal way of blood distribution to hospitals and minimize the average delivery time from local and regional blood centers to hospitals. They applied 휀-constraint method to formulate the proposed model, and solved it using Lagrangian relaxation. Table 1 classifies the reviewed papers according to their special features.
Since only a few papers have studied blood supply chain network design in disasters, we intend to investigate the mentioned network under uncertainty by taking the imprecise parameters into account.
This paper contributes to the area by: 1) Employing a fuzzy two-stage stochastic programing approach to formulate the model in disaster condition and a credibility-based chance-constrained programming method to solve the proposed fuzzy-stochastic model. 2) Considering disruption probability feature for local and regional blood facilities and each route between facilities. 3) Developing a BSC network that synthesizes blood donors and mobile blood facilities as well as local and regional blood centers and demand zones. 4) Applying a real case study to evaluate the performance and efficiency of the proposed model.
3. Problem Description and Model Formulation
The considered supply chain consists of blood donors, mobile and local blood facilities and regional blood centers as well as demand zones such as healthcare centers and hospitals. Blood can be donated at either a mobile or a local blood facility except for the regional blood centers. Each mobile blood facility might move from one location to another in each period. The blood units collected by mobile facilities is transferred to either local or regional blood centers. All transfusion services are provided by regional blood centers, but not by local ones. In this regard, 휑 percent of the processes of a local center must be referred to a pre-determined regional blood center defined as the referral rate. Finally, the local blood facilities along with the regional blood centers account for delivering blood to the specified demand zones. Additionally, each route has certain reliability to be working, and the disruption probability of each facility has been taken into account. A schematic plan of the concerned BSC is depicted in Figure 1.
The problem is formulated as a two-stage fuzzy-stochastic model applying a number of disaster scenarios to design a BSC network in disasters in which all parameters are considered to be imprecise.
In a two-stage programming approach, two categories of decision variables could be defined [Birge and Louveaux, 2011]. The first category belongs to the first-stage decision variables and the second one is associated with the second-stage decision variables. The first category variables do not rely on the disaster scenarios and can be determined before a scenario realization, while the second-stage decision variables are scenario-dependent and thus are made after a scenario is realized. In the considered model, the value of decision variable Y, which represents the number of mobile blood facilities, would be taken in the first stage since it is a scenario-independent variable. On the other hand, the rest of decision variables are specified in the second stage as their values are reliant on the disaster scenarios.
Optimal Blood Transportation in Disaster Relief Considering Facility Disruption and Route …
International Journal of Transportation Engineering, 230 Vol.4/ No.3/ Winter 2017
231 International Journal of Transportation Engineering, Vol.4/ No.3/ Winter 2017
The objective function aims to minimize the total cost of supply chain including establishing and moving costs of each mobile blood facility and operating cost at both local blood facilities and regional blood centers as well as inventory holding cost and transportation cost. The following values are obtained through solving the proposed model:
1. The optimal number and location of mobile blood facilities based on different scenarios.
2. The number of blood units collected by each facility under each scenario in each period.
3. The number of blood units transported from mobile facilities to local and regional blood centers based on each scenario in each period.
4. The number of blood units shipped from local blood centers to regional blood centers based on each scenario in each period.
5. The level of blood inventory at both local and regional blood centers based on each scenario at the end of each period.
6. The amount of blood shipped from local and regional blood centers to healthcare centers and hospitals based on each scenario in each period.
3.1.Model Sets, Parameters and Decision Variables The following components are applied to formulate the proposed fuzzy-stochastic model. Indices:
퐷 donor group thdThe set, assigned to the B The set, assigned to candidate locations for bth mobile blood facility L The set, assigned to lth local blood center G The set, assigned to gth regional blood center P The set, assigned to pth hospital or healthcare center S The set, assigned to sth disaster scenario T The set, assigned to tth time period
Distribution
Collection Production & Inventory
Established fobile flood facility Candidate location for mobile blood facility
Regional blood center
Local blood facility Demand zones
Group of donors
1
2
3
4
|d|
|D|
1 1
1
2
|B|
|L|
2
|G|
1
2
3
4
|p|
|P|
Figure 1. An overview of the concerned blood
Optimal Blood Transportation in Disaster Relief Considering Facility Disruption and Route …
International Journal of Transportation Engineering, 232 Vol.4/ No.3/ Winter 2017
Technical parameters:
푑푒 Demand of blood at pth hospital in period t under sth scenario
푉 Capacity of each mobile blood facility
푣 Storage capacity of lth local blood center
푣 Storage capacity of gth regional blood center
푑 Maximum quantity of blood donated by dth group of donors under sth scenario
푟 Distance between dth donor group and bth mobile blood facility
푟 Distance between dth donor group and lth local blood center
푅 Coverage radius for each blood facility
푝 Probability of sth scenario occurrence
훼 Disruption probability of each route from bth mobile blood facility to lth local blood center
훾 Disruption probability of each route from lth local blood center to gth regional blood center
휇 Disruption probability of each route from bth location to gth regional blood center
훾 Disruption probability of each route from gth regional blood center to pth hospital
훼 Disruption probability of each route from lth local blood center to pth hospital
휌 Disruption probability of lth local blood center
휌 Disruption probability of gth regional blood center
휑 The rate at which services of local blood centers are directed to regional blood centers (called referral rate)
푀 An arbitrary large value
Cost parameters:
푓푐 Establishment fixed cost of each mobile blood facility
푚푣 Cost of each mobile blood facility moving from location j to location b in period t under sth scenario
표푐 Operating cost per blood unit at bth mobile blood facility from dth group of donors in period t under sth scenario
표푐 Operating cost per blood unit at lth local blood center in period t under sth scenario
표푐 Operating cost per blood unit at gth regional blood center in period t under sth scenario
푡푐 Transportation cost per blood unit from bth mobile blood facility to lth local blood center in period t under sth scenario
푡푏 Transportation cost per blood unit from bth mobile blood facility to gth regional blood center in period t under sth scenario
Sara Cheraghi, Seyyed-Mahdi Hosseini-Motlagh
233 International Journal of Transportation Engineering, Vol.4/ No.3/ Winter 2017
푡푑 Transportation cost per blood unit from lth local blood center to gth regional blood center in period t under sth scenario
푡푒 Transportation cost per blood unit from lth local blood center to pth hospital in period t under sth scenario
푡푓 Transportation cost per blood unit from gth regional blood center to pth hospital in period t under sth scenario
ℎ푐 Holding cost per blood unit at lth local blood center in period t
ℎ푐 Holding cost per blood unit at gth regional blood center in period t
Integer decision variables:
푌 The number of mobile blood facilities
Continuous decision variables:
푞푐 The amount of blood collected at bth mobile blood facility from dth donor in period t to be delivered to lth local blood center under sth scenario
푞푏 The amount of blood collected at bth mobile blood facility from dth donor in period t to be delivered to gth regional blood center under sth scenario
푞푑 The amount of blood collected at lth local blood center from dth donor in period t under sth scenario
푞푒 The amount of blood delivered from lth local blood center to gth regional blood center in period t under sth scenario
푞푎 The amount of blood delivered from lth local blood center to hospital p in period t under sth scenario
푞푓 The amount of blood delivered from gth regional blood center to hospital p in period t under sth scenario
퐼 The amount of blood inventory in lth local blood center at the end of period t under sth scenario
퐼 The amount of blood inventory in gth regional blood center at the end of period t under sth scenario
Binary decision variables:
푋 Is equal to 1 if a blood facility is located at jth site in period t–1, and moves to site bth in period t under sth scenario; 0, otherwise
푊 Is equal to 1 if dth group of donors is assigned to bth mobile blood facility in period t under sth scenario; 0, otherwise
푈 Is equal to 1 if dth group of donors is assigned to lth local blood center in period t under sth scenario; 0, otherwise
푈 Is equal to 1 if lth local blood center is allocated to gth regional blood center in period t under sth scenario; 0 otherwise
Optimal Blood Transportation in Disaster Relief Considering Facility Disruption and Route …
International Journal of Transportation Engineering, 234 Vol.4/ No.3/ Winter 2017
3.2. Objective function:
푀푖푛푖푚푖푧푒 푍 = 푓푐 ∗ 푌 + 푝 푚푣 푋
+ 푝 휌 훼 표푐 푞푐
+ 푝 휌 휇 표푐 푞푏
+ 푝 휌 훼 표푐 푞푐
+ 푝 휌 훼 표푐 푞푐
+ 푝 휌 훾 표푐 푞푏
+ 푝 휌 표푐 훼 푞푐
+ 푝 휌 표푐 푞푑 + 푝 휌 휇 표푐 푞푏
+ 푝 휌 휌 훾 표푐 푞푒
+ 푝 휌 훼 푡푐 푞푐
+ 푝 휌 휇 푡푏 푞푏
+ 푝 휌 휌 훾 푡푑 푞푒
+ 푝 휌 훼 푡푒 푞푎
+ 푝 휌 훾 푡푓 푞푓 + 푝 ℎ푐 퐼
+ 푝 ℎ푐 퐼
(1)
The present objective function minimizes the total cost of system, which comprises establishment cost of mobile facilities, total moving cost of mobile blood facilities, total operating cost of blood facilities considering the
rate of facilities disruption, total transportation cost between blood facilities and demand zones regarding relevant routes reliability and total inventory cost at local blood facilities as well as demand zones.
Sara Cheraghi, Seyyed-Mahdi Hosseini-Motlagh
235 International Journal of Transportation Engineering, Vol.4/ No.3/ Winter 2017
The total number of mobile facilities in each period must be at most equal to or less than the number of established blood facilities, represented by constraint (2). No more than one mobile facility will be established at each location, ensured by constraint (3). Constraint (4) guarantees that no mobile facility can move to another location in which any facilities have been established before. The donors must merely be assigned to open facilities, stated by constraint (5). Constraint (6) denotes the maximum allowable amount of blood, collected from each group of donors. Constraint (7) indicates the total amount of blood, collected by mobile facilities, must not exceed their capacities. Constraints (8) and (9) guarantee that no mobile facility can transport the donated blood if it is not assigned to the corresponding group of donors. Constraint (10) ensures that blood cannot be collected by local blood facilities from donors' groups not assigned to those facilities. Constraints (11) and (12) denote that donors would be only served by mobile blood facilities and local blood centers within their service area. Each local blood facility can only be assigned to one regional blood center, ensured by constraint (13). Constraint (14) makes sure that blood cannot be transported from a local blood facility to a regional blood center to which it is not assigned.
Constraint (15) expresses that a 휑-percent rate of blood transfusion services is directed from a local blood facility to a regional blood center. Constraints (16) and (17) are known as blood inventory balance constraints at local blood facilities and regional blood centers, respectively. Blood demand in hospitals must be satisfied under each scenario 푠, ensured by constraint (18). The storage capacities of local blood facilities and regional blood centers are denoted by constraints (19) and (20), respectively. Constraints (21) and (22) define the type of decision variables.
4. Fuzzy Chance - Constrained Programming Model Based on the Credibility Theory
The chance of fuzzy events was introduced in the form of possibility measure by Zadeh [Zadeh, 1978]. Later on, the dual part of possibility measure called necessity measure was defined. However, neither possibility measure nor necessity measure is self-dual. Thus, Liu and Liu [Liu and Liu, 2002] presented a new self-dual measure in the context of credibility measure, which is the average value of the two previous measures; i.e., possibility and necessity measures [Li and Ralescu, 2009].
Sara Cheraghi, Seyyed-Mahdi Hosseini-Motlagh
237 International Journal of Transportation Engineering, Vol.4/ No.3/ Winter 2017
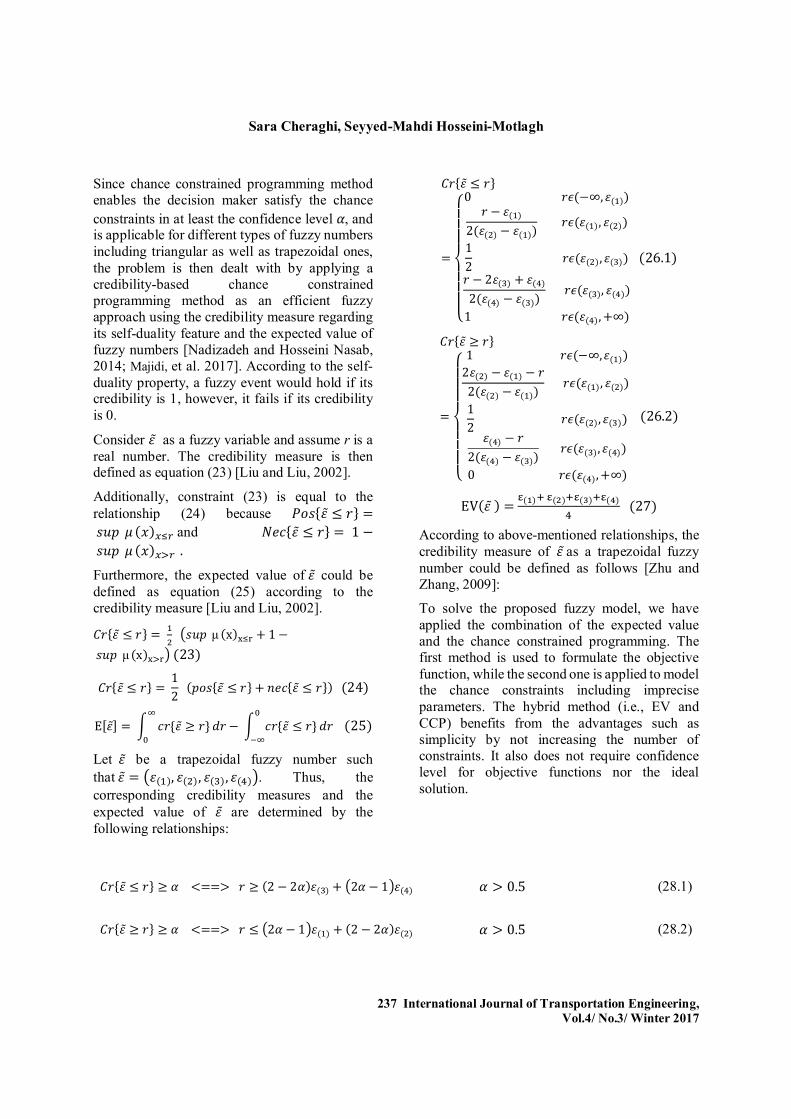
Since chance constrained programming method enables the decision maker satisfy the chance constraints in at least the confidence level 훼, and is applicable for different types of fuzzy numbers including triangular as well as trapezoidal ones, the problem is then dealt with by applying a credibility-based chance constrained programming method as an efficient fuzzy approach using the credibility measure regarding its self-duality feature and the expected value of fuzzy numbers [Nadizadeh and Hosseini Nasab, 2014; Majidi, et al. 2017]. According to the self-duality property, a fuzzy event would hold if its credibility is 1, however, it fails if its credibility is 0.
Consider 휀̃ as a fuzzy variable and assume r is a real number. The credibility measure is then defined as equation (23) [Liu and Liu, 2002].
Additionally, constraint (23) is equal to the relationship (24) because 푃표푠{휀̃ ≤ 푟} = 푠푢푝 휇 (푥) and 푁푒푐{휀̃ ≤ 푟} = 1 − 푠푢푝 휇 (푥) .
Furthermore, the expected value of 휀̃ could be defined as equation (25) according to the credibility measure [Liu and Liu, 2002].
퐶푟{휀̃ ≤ 푟} = 푠푢푝 μ (x) + 1 − 푠푢푝 μ (x) (23)
퐶푟{휀̃ ≤ 푟} = 12 (푝표푠{휀̃ ≤ 푟} + 푛푒푐{휀̃ ≤ 푟}) (24)
E[휀̃] = 푐푟{휀̃ ≥ 푟} 푑푟 − 푐푟{휀̃ ≤ 푟} 푑푟 (25)
Let 휀̃ be a trapezoidal fuzzy number such that 휀̃ = 휀( ), 휀( ), 휀( ), 휀( ) . Thus, the corresponding credibility measures and the expected value of 휀̃ are determined by the following relationships:
퐶푟{휀̃ ≤ 푟}
=
⎩⎪⎪⎪⎨
⎪⎪⎪⎧
0 푟휖(−∞, 휀( ))푟 − 휀( )
2(휀( ) − 휀( )) 푟휖(휀( ), 휀( ))
12 푟휖(휀( ), 휀( ))푟 − 2휀( ) + 휀( )
2(휀( ) − 휀( )) 푟휖(휀( ), 휀( ))
1 푟휖(휀( ), +∞)
(26.1)
퐶푟{휀̃ ≥ 푟}
=
⎩⎪⎪⎪⎨
⎪⎪⎪⎧
1 푟휖(−∞, 휀( ))2휀( ) − 휀( ) − 푟
2(휀( ) − 휀( )) 푟휖(휀( ), 휀( ))
12 푟휖(휀( ), 휀( ))
휀( ) − 푟2(휀( ) − 휀( )) 푟휖(휀( ), 휀( ))
0 푟휖(휀( ), +∞)
(26.2)
EV(휀̃ ) = ( ) ( ) ( ) ( ) (27)
According to above-mentioned relationships, the credibility measure of 휀̃ as a trapezoidal fuzzy number could be defined as follows [Zhu and Zhang, 2009]:
To solve the proposed fuzzy model, we have applied the combination of the expected value and the chance constrained programming. The first method is used to formulate the objective function, while the second one is applied to model the chance constraints including imprecise parameters. The hybrid method (i.e., EV and CCP) benefits from the advantages such as simplicity by not increasing the number of constraints. It also does not require confidence level for objective functions nor the ideal solution.
Optimal Blood Transportation in Disaster Relief Considering Facility Disruption and Route …
International Journal of Transportation Engineering, 238 Vol.4/ No.3/ Winter 2017
4.1. The Equivalent Auxiliary Crisp Model Considering the relationships (26.1), (26.2) and (27), the above model can be transformed to the equivalent crisp one as below if the chance
constraints are satisfied with minimum confidence level 0.5 (i.e., 훼 > 0.5).
푀푖푛푖푚푖푧푒 퐸[푍]
= 푓퐶( ) + 푓퐶( ) + 푓퐶( ) + 푓퐶( )
4 푌
+ 푝 (푚푣 ( ) + 푚푣 ( ) + 푚푣 ( ) + 푚푣 ( )
4)푋
+ 푝표푐 ( ) + 표푐 ( ) + 표푐 ( ) + 표푐 ( )
4훼 ( ) + 훼 ( ) + 훼 ( ) + 훼 (
4
∗휌 ( ) + 휌 ( ) + 휌 ( ) + 휌 ( )
4푞푐
+ 푝표푐 ( ) + 표푐 ( ) + 표푐 ( ) + 표푐 ( )
4휇 ( ) + 휇 ( ) + 휇 ( ) + 휇 (
4
∗휌 ( ) + 휌 ( ) + 휌 ( ) + 휌 ( )
4 푞푏
+ 푝표푐 ( ) + 표푐 ( ) + 표푐 ( ) + 표푐 ( )
4훼 ( ) + 훼 ( ) + 훼 ( ) + 훼 ( )
4
∗휌 ( ) + 휌 ( ) + 휌 ( ) + 휌 ( )
4푞푐
+ 푝표푐 ( ) + 표푐 ( ) + 표푐 ( ) + 표푐 ( )
4휌 ( ) + 휌 ( ) + 휌 ( ) + 휌 ( )
4푞푑
+ 푝표푐 ( ) + 표푐 ( ) + 표푐 ( ) + 표푐 ( )
4휇 ( ) + 휇 ( ) + 휇 ( ) + 휇
4
∗휌 ( ) + 휌 ( ) + 휌 ( ) + 휌 ( )
4푞푏
+ 푝푡푐 ( ) + 푡푐 ( ) + 푡푐 ( ) + 푡푐 ( )
4훼 ( ) + 훼 ( ) + 훼 ( ) + 훼 ( )
4
∗휌 ( ) + 휌 ( ) + 휌 ( ) + 휌 ( )
4푞푐
+ 푝푡푏 ( ) + 푡푏 ( ) + 푡푏 ( ) + 푡푏 ( )
4휇 ( ) + 휇 ( ) + 휇 ( ) + 휇 (
4
∗휌 ( ) + 휌 ( ) + 휌 ( ) + 휌 ( )
4푞푏
Sara Cheraghi, Seyyed-Mahdi Hosseini-Motlagh
239 International Journal of Transportation Engineering, Vol.4/ No.3/ Winter 2017
241 International Journal of Transportation Engineering, Vol.4/ No.3/ Winter 2017
∀푝 ∈ 푃, ∀푡 ∈ 푇, ∀푠 ∈ 푆 (46)
퐼 ≤ (2훼 − 1)푣 ( ) + (2 − 2훼)푣 ( )
∀푙 ∈ 퐿, ∀푡 ∈ 푇, ∀푠 ∈ 푆 (47)
퐼 ≤ (2훼 − 1)푣 ( ) + (2 − 2훼)푣 ( )
∀푔 ∈ 퐺, ∀푡 ∈ 푇, ∀푠 ∈ 푆 (48)
푊 , 푈 , 푈 ∈ {0,1}
∀푑 ∈ 퐷, ∀푏 ∈ 퐵, ∀푙 ∈ 퐿, ∀푔 ∈ 퐺, ∀푡 ∈ 푇, ∀푠∈ 푆
(49)
푞푐 , 푞푏 ,푞푎 , 푞푓 , 푞푒 , 퐼 , 퐼 , 푞푑 ≥ 0
∀푙 ∈ 퐿, ∀푔 ∈ 퐺, ∀푡 ∈ 푇, ∀푠 ∈ 푆 (50)
5. Case Study Numerous natural disasters such as earthquakes occur in the world each year, which cause loss of life and leave some economic damage in its wake. Iran is among top 10 countries with natural disasters, situated on one of the most seismic earthquake belts in the world. According to the official statistics, around 18 percent of the world's destructive earthquakes belong to Iran, and populous provinces such as Tehran, the capital of Iran, will have a greater share of losses caused by earthquakes. The present case study is considered
for earthquake occurrence in district 1 of Tehran, and the geographic position of the district is depicted in Figure 2.
Many years ago, JICAiii investigated the vulnerable areas of Tehran at the request of Iran to estimate the damage and losses caused by earthquakes. According to the studies done by this group on 22 districts of Tehran and its main active faults, a brief explanation of the most likely dangerous faults and their properties is presented and the related scenario models are then outlined in Table 2.
Figure 2. Geographic dispersion of 22 districts of Tehran metropolis
Optimal Blood Transportation in Disaster Relief Considering Facility Disruption and Route …
International Journal of Transportation Engineering, 242 Vol.4/ No.3/ Winter 2017
Mosha Fault (MF), which is more than 200 km long, is one of the major active faults in Tehran in terms of the length and danger. The largest historical earthquake by magnitude occurred in 958 with a distance of 50 km from the center of Tehran. The earthquake corresponded to the activity of the western part of the fault.
North Tehran Fault (NTF) is a 90 km-long fault, located in the northern margin of Tehran. The damage caused by the earthquakes originated from this fault will be even worse than one occurred in 958. So, we consider the North
Tehran Fault instead of Mosha Fault for the earthquake scenario.
South Ray Fault (SRF), which is about 20 km long, is located in south of Tehran. This fault is considered for the sake of its better geological surface trace and micro-seismic activities.
Besides, The Modified Mercalli Intensity (MMI) scale of earthquakes occurred in each region of district 1 is estimated in Table 3. In continue, north Tehran fault and the vulnerable areas of district 1 based on this fault are mapped in Figures 3 and 4, respectively.
Table 2. The properties of earthquake scenario models
Floating fault model
SRF Model NTF Model MF Model Properties
13 26 58 68 length
10 16 27 30 width
-- South North North eastern location
4/6 7/6 2/7 2/7 magnitude
Table 3. The Modified Mercalli Intensity (MMI) scale of earthquakes in each region
Floating fault model SRF NTF MF Region
7/8 3/7 3/9 3/8 1
18/8 9/6 8/8 6/7 2
2/8 8/6 9/8 8/7 3
6/8 1/7 3/9 2/8 4
3/8 7 9 1/8 5
3/8 7 9 1/8 6
3/8 7 9 7/7 7
6/8 3/7 3/9 1/8 8
3/8 1/7 1/9 1/8 9
9/7
7/6 5/8 8
10
Sara Cheraghi, Seyyed-Mahdi Hosseini-Motlagh
243 International Journal of Transportation Engineering, Vol.4/ No.3/ Winter 2017
Figure 3. The north Tehran fault
Figure 4. The vulnerable areas of district one according to the north Tehran fault
Figure 5. The candidate location of mobile blood facilities and existing local blood facilities, regional blood centers and hospitals
Optimal Blood Transportation in Disaster Relief Considering Facility Disruption and Route …
International Journal of Transportation Engineering, 244 Vol.4/ No.3/ Winter 2017
Table 4. The geographic coordinates of donor points and hospitals
Points Longitude Latitude
퐷 35.810363 51. 523087
퐷 35.794213 51.433588
퐷 35.791915 51.442772
퐷 35.809736 51.451183
퐷 35.804725 51.461569
퐷 35.815444 51.475559
퐷 35.797554 51.483198
퐷 35.799782 51.483971
퐷 35.805699 51.509806
퐷 35.815931 51.504484
H 35. 790687 51.414276
H 35. 791648 51.422644
As stated before, district 1 with a population over 350,000, includes 10 regions. To supply blood when facing disasters, all 10 regions of district 1 are assumed to contribute to blood distribution to the affected areas. In this paper, the center of each region represents a donor point; the locations of blood facilities and hospitals as demand zones are depicted in Figure 5. Besides, the geographic coordinates of donor points and hospitals are estimated in Table 4, and the distance between two arbitrary points can be obtained by the following equation:
In this section, we report the corresponding results to evaluate the proposed model and the solution approach. The proposed model is solved using CPLEX solver encoded in GAMS software
– version 24.1 - on a laptop computer with features of Intel Core i5 CPU, 2.5 GHz and 6GB of RAM. The model is implemented considering different confidence levels 훼, provided in Table 5, then the sensitivity analysis is presented. What is evident is that the model is solved within a reasonable length of time ended up with no gap and no need to mathematical solution methods. In addition, the increased value of α results in the increased number of mobile blood facilities and thus the increased supply chain costs, as shown in Figure 6. In the meantime, no changes can be observed in the number of mobile blood facilities when α is increased from 0.6 to 0.7 and from 0.9 to 1. Therefore, the increase of objective function value could be owing to the increase of transportation cost and operating cost caused by the increase of service level for fuzzy parameters. Since blood supply is so critical especially in disasters, decision makers need to determine conditions, in which the demand is satisfied at higher reliability degree α although it imposes higher costs on the chain. In fact, the decision
Sara Cheraghi, Seyyed-Mahdi Hosseini-Motlagh
245 International Journal of Transportation Engineering, Vol.4/ No.3/ Winter 2017
maker has to make a tradeoff between cost and demand satisfaction to decide on the confidence level of demand satisfaction besides the number and location of mobile blood facilities.
The model is solved for 5 mobile blood facilities, and the allocation of donors to mobile and local blood facilities is shown in Table 6 considering the 1st time period and the confidence level 훼 =0.7 . An overall observation is that, mobile blood facilities are frequently assigned to the regions with higher destruction risk regarding the disaster intensity based on each scenario. As can be observed in Figures 7, 3 mobile blood facilities are chosen from 5 candidate locations.
This section analyzes the changes in the supply chain costs as the capacity of mobile facilities is increased. Figures 8 and 9 show supply chain costs over different capacity levels at confidence levels 훼 = 0.7 and 훼 = 0.9, respectively. As can be seen in the corresponding diagrams, the increased capacity of mobile facilities results in decreased supply chain costs. The amount of cost savings (i.e. curve steepness) is a function of “inventory cost over transportation cost” ratio. Accordingly, a higher ratio is obtained by adopting a greater inventory cost and smaller transportation cost, which lets the supply chain network take advantage of increased capacity of facilities in order to reduce the times of transportation between nodes.
Table 5. The value of objective function and the number of mobile blood facilities based on different 휶 levels
훼 푌 푍 Run time (S)
0.5 2 6148 0:17:34
0.6 3 7024 0:22:21
0.7 3 7313 0:16:58
0.8 4 8142 0:20:09
0.9 5 8963 0:24:33
1 5 9074 0:20:41
Figure 6. The impact of confidence level changes on the supply chain cost
5000550060006500700075008000850090009500
٠٫۵ ٠٫۶ ٠٫٧ ٠٫٨ ٠٫٩ ١
tota
l cos
t $
confidence level %
Optimal Blood Transportation in Disaster Relief Considering Facility Disruption and Route …
International Journal of Transportation Engineering, 246 Vol.4/ No.3/ Winter 2017
Table 6. Donors assignment to mobile and local blood facilities based on each scenario model considering t=1
Regions MF scenario NTF scenario
SRF scenario
Floating fault scenario
1 L5 M8 M8 L5
2 M3 M3 M3 M3
3 M3 M3 M3 M3
4 L5 L5 L5 M8
5 L5 L5 L5 L5
6 M6 M6 M6 M6
7 L7 M8 L7 L7
8 M8 M8 L7 L7
9 M6 M6 M6 M6
10 M6 M6 M6 M6
Figure 7. The established mobile blood facilities considering t=1 and 휶 = ퟎ. ퟕ
Figure 8. The impact of capacity changes on the total supply chain cost; 휶 = ퟎ. ퟕ
0
0.5
1
1.5
2
2.5
٠ ۵ ١٠ ١۵ ٢٠ ٢۵ ٣٠ ٣۵capacity changes %
cost savings
Sara Cheraghi, Seyyed-Mahdi Hosseini-Motlagh
247 International Journal of Transportation Engineering, Vol.4/ No.3/ Winter 2017
Figure 9. The impact of capacity changes on the total supply chain cost; 휶 = ퟎ. ퟗ
6.1 Sensitivity Analysis on the Capacity of Mobile Facilities
In some parts, as shown in Figures 8 and 9, the curve is steeper which indicates reduced supply chain costs and thus increased cost savings resulting from the reduced transportation cost in total since the transportation duration decrease by increasing the capacity of mobile blood facilities. For instance, as the increase in capacity level reaches 5%, the amount of cost savings will become 1% while this amount of saving will be 1.95% when the capacity increases to 30%, if possible. Thus, these levels could be regarded as appropriate points for making a remarkable
reduction in supply chain costs even though choosing the level of capacity increase is reliant on the decision makers' policies. However, the slope of the curve will reduce gradually until it comes to zero in some parts and no changes would be observed as the capacity of facility is increased, which means that no capacity shortage has occurred. In other words, the current capacity of facility can satisfy the respective demand. Besides, the amount of cost savings will decrease due to the increase in supply chain costs as the service level increases from 0.7 to 0.9.
0
0.5
1
1.5
2
2.5
3
3.5
٠ ۵ ١٠ ١۵ ٢٠ ٢۵ ٣٠ ٣۵capacity changes %
cost savings
Figure 10. The impact of increasing coverage radius on the total supply chain cost; 휶 = ퟎ. ퟕ
4000
4500
5000
5500
6000
6500
7000
7500
۶٠ ٧٠ ٨٠ ٩٠ ١٠٠coverage radius
objective functionvalue $
Optimal Blood Transportation in Disaster Relief Considering Facility Disruption and Route …
International Journal of Transportation Engineering, 248 Vol.4/ No.3/ Winter 2017
6.2.Sensitivity Analysis on the Coverage Radius of Blood Facilities
In this section, the impact of an increase in coverage radius of blood facilities on total network cost is examined. To do so, the value of this parameter is varied, as shown in Figures 10 and 11. A general observation is that increasing the coverage radius of facilities leads to an increase in the capability of each facility to cover more donors, and thus, the total required number of blood facilities reduces. This reduction provides cost savings for the supply chain. This pattern will carry on until the total volume of blood to be collected by each blood facility does not exceed the capacity of that facility. To be more specific, in Figure 10, total cost of the network will reduce dramatically by increasing the coverage radius to 70. From this point on, further increases in the value of this parameter have no impact on reducing the objective function value. Almost the same pattern can be observed in Figure 11, but the difference is that more cost will be imposed on the supply chain as the service level increases from 0.7 to 0.9 and the network cost will decrease with slighter slope. 6.3.Sensitivity Analysis on the Reliability
of Routes We now aim to examine whether changes in the reliability of routes between facilities affect the supply chain costs. To this end, the model is solved for different reliability levels of routes
with respect to α = 0.7 and α = 0.9. As can be observed in the following figures, the increased reliability of routes, or in other words, decreased disruption probability of routes leads to reduced supply chain costs. Comparing the two Figures 10 and 11, it can be inferred that supply chain cost savings would decrease owing to the increased confidence level of services from 0.7 to 0.9, which leads to the increased supply chain costs. Furthermore, for some disruption levels (that part of the route reliability axis with negative numbers), cost savings reduce almost dramatically which possibly implies substituting another route with the current one, which may be out of order, so as to transfer required blood units from one facility to another or to a demand zone. On the other hand, decreases in the probability of route failure (that part of the route reliability axis with positive numbers), will enhance the amount of cost savings. For instance for Figure 10, if the reliability of route increases to 5%, the slope of the curve will reach 0.52 which shows 2.6% increase in cost savings while the slope reduces for greater route reliability. For example, the increase of 10% in route reliability results in the slope of 0.38 and 3.8% increase in cost savings and this amount is about 5% if we have 15% decrease in the route failure
6000
6500
7000
7500
8000
8500
9000
9500
۶٠ ٧٠ ٨٠ ٩٠ ١٠٠coverage radius
objective functionvalue $
Figure 11. The impact of increasing coverage radius on the total supply chain cost; 휶 = ퟎ.9
Sara Cheraghi, Seyyed-Mahdi Hosseini-Motlagh
249 International Journal of Transportation Engineering, Vol.4/ No.3/ Winter 2017
Figure 12. The impact of route reliability changes on the total supply chain cost; 훂 = ퟎ. ퟕ
Figure 13. The impact of route reliability changes on the total supply chain cost; 훂 = ퟎ. ퟗ
6.4.Sensitivity Analysis on the Disruption Probability of Local and Regional Facilities
This section is supposed to investigate the impact of changes in the disruption probability of facilities on the supply chain costs. According to Figures 12 and 13, a general observation is that the supply chain cost is affected by the changes in the facilities disruption. It means that the decreased probability of facilities disruption ends in supply chain cost improvement, in the meantime, the increased percentage of facilities disruption leads to cost increase. Noteworthy, those parts of the curve with steeper slope and thus the greater cost savings indicate that the same facilities are going to be used as did before. So, no extra costs will be imposed on the supply
chain while the lower-slope parts (those for the positive numbers on the facility disruption axis) represent reduced cost savings because higher costs are imposed on the supply chain. It may be due to replacing new facilities with the previous ones as they are out of work or badly disrupted. For instance for Figure 12, if the facility disruption decreases to 5%, the slope of the curve will reach 0.12, which indicates 0.6% increase in cost savings while the slope thus the amount of cost savings increases as the percentage of facility disruption reduces more. On the other hand, the slope of 0.06 will be obtained when the facility disruption increases to 5%, which causes a cost increase of 0.3% and this amount will be even more if the disruption of facilities grows until it comes to 3.8% at disruption rate of 0.2.
-7.5-6
-4.5-3
-1.50
1.53
4.56
-١٠ -۵ ٠ ۵ ١٠ ١۵
cost
savi
ngs %
route reliability changes %
-9-7.5
-6-4.5
-3-1.5
01.5
34.5
6
-١٠ -۵ ٠ ۵ ١٠ ١۵
cost
savi
ngs %
route reliability changes %
Optimal Blood Transportation in Disaster Relief Considering Facility Disruption and Route …
International Journal of Transportation Engineering, 250 Vol.4/ No.3/ Winter 2017
Figure 14. The impact of facilities disruption changes on the total supply chain cost; 훂 = ퟎ. ퟕ
Figure 15. The impact of facilities disruption changes on the total supply chain cost; 훂 = ퟎ. ퟗ
6.5.Sensitivity Analysis on the Referral Rate
In this section, we examine if changes in the referral rate can be employed as a strategy to improve supply chain costs. Notably, more transfusion services would be conducted in regional blood centers as referral rates become larger. For instance, a referral rate of 0.4 indicates that 40% of transfusion operations are to be referred to regional blood centers and the rest of them would be done in local blood centers. As can be observed from Figures 16 and 17, the greater referral rates eventuate in increased supply chain
costs and more facilities are required to be opened in order to maintain the same service level. Consequently, it would be more cost-effective to facilitate local blood centers and enhance their independency from regional blood centers with the aim of decreasing the referral rate and thus the supply chain costs. What is evident in all figures, represented earlier, is that the amount of cost savings would reduce as the service level grows. The increase of service level would result in larger supply chain costs by enhancing either the number of facilities or any other probable changes in the supply chain characteristics so as to meet demand as much as possible.
-4.8-4
-3.2-2.4-1.6-0.8
00.81.62.43.2
4
-١۵ -١٠ -۵ ٠ ۵ ١٠ ١۵ ٢٠co
st sa
ving
s %
facility disruption %
-5.6-4.8
-4-3.2-2.4-1.6-0.8
00.81.62.4
-١۵ -١٠ -۵ ٠ ۵ ١٠ ١۵ ٢٠
cost
savi
ngs %
facility disruption %
Sara Cheraghi, Seyyed-Mahdi Hosseini-Motlagh
251 International Journal of Transportation Engineering, Vol.4/ No.3/ Winter 2017
6.6.Model Performance (Fuzzy-Stochastic Approach Versus Deterministic Approach)
Finally, this section provides a comparable analysis for the performance of the proposed model under fuzzy-stochastic and deterministic approaches. To do so, we evaluate the model by particularly considering the impact of increasing the capacity of mobile blood facilities. Figure 18 depicts how the proposed model performs under aforementioned approaches while 훼 = 0.7. The figure implies that the network total cost under
both approaches decreases as the capacity of mobile blood facilities is enhanced. For instance, if we have an increase of 5% in the capacity of facilities, we will observe that total cost of fuzzy-stochastic model will come near to $7203 with a reduction of 1.5%. This pattern will continue with a slight slope until it reaches $7101 while we have a 35-percent increase in the capacity of facilities. The cost difference between the two approaches comes from the fact that fuzzy approach estimates the value of uncertain parameters more realistic than that of the deterministic approach.
00.010.020.030.040.050.060.070.080.09
0
2000
4000
6000
8000
10000
12000
٠٫١ ٠٫٢ ٠٫٣ ٠٫۴ ٠٫۵ ٠٫۶ ٠٫٧ ٠٫٨ ٠٫٩
cost
diff
eren
ce %
tota
l cos
t $
refferal ratetotal cost cost difference
00.010.020.030.040.050.060.070.080.09
0
2,000
4,000
6,000
8,000
10,000
12,000
14,000
٠٫١ ٠٫٢ ٠٫٣ ٠٫۴ ٠٫۵ ٠٫۶ ٠٫٧ ٠٫٨ ٠٫٩
cost
diff
eren
ce %
tota
l cos
t $
refferal ratetotal cost cost difference
Figure 16. The impact of facilities disruption changes on the total supply chain cost; 훂 = ퟎ. ퟕ
Figure 17. The impact of facilities disruption changes on the total supply chain cost; 훂 = ퟎ.9
Optimal Blood Transportation in Disaster Relief Considering Facility Disruption and Route …
International Journal of Transportation Engineering, 252 Vol.4/ No.3/ Winter 2017
Figure 18. Total supply chain cost under fuzzy-stochastic and deterministic approaches; 휶 = ퟎ. ퟕ
7. Conclusions Since the natural disasters are increasingly happening all over the world, blood supply in such emergency situations is of a great challenge considering the disasters direct impacts on humans and their emergency needs thereafter. This paper presents a fuzzy-stochastic programming model to design a BSC network for the efficient blood supply in disasters. The objective function aims to minimize the total supply chain costs regarding as the efficiency factor. In the proposed two-stage fuzzy-stochastic programming model, the number of blood facilities to be opened is decided at the first stage as there is no knowledge available of disasters, and blood collection and the frequency of transportation besides the level of inventory at the end of each period are specified at the second stage as the disaster scenarios are realized.
To formulate the proposed model, a fuzzy programming approach is considered to cope with the uncertainty in model parameters. A credibility-based chance-constrained programming method is then applied to convert the proposed model into an auxiliary crisp one. The following valuable insights are provided through solving the proposed model. (1) the hybrid solution method (i.e., EV and CCP) benefits from the advantages such as simplicity
by not increasing the number of constraints. It also does not require confidence level for objective functions. (2) an increase in credibility level would lead to a decrease in the system's cost savings. (3) if the capacity of blood facilities is enhanced from %5 to %30, if possible, cost savings will increase from %1 to %1.9. (4) a %10 decrease in route reliability results in %3.8 increase in the network total cost. (5) having a %5 increase in facility disruption, we witness % 0.3 decrease in cost savings. (6) as the referral rate increases, more facilities must be provided to respond the demand at the same service level. So, we will have an increase in the network cost.
At the end, a real case study in Iran was conducted to evaluate the applicability of the proposed model.
Future research could investigate other solution methods including heuristic or metaheuristic methods in the case the one presented in this paper would not be able to solve the problem of larger sizes. Other stochastic approaches could be also applied to the problem in order to compare the corresponding results with those of the proposed solution approach. Moreover, the routing problem could be simultaneously considered for the present model to improve the network costs.
55005800610064006700700073007600
٠ ۵ ١٠ ١۵ ٢٠ ٢۵ ٣٠ ٣۵obje
ctiv
e fun
ctio
n va
lue
$
capacity changes %
fuzzy-stochastic approach deterministic approach
Sara Cheraghi, Seyyed-Mahdi Hosseini-Motlagh
253 International Journal of Transportation Engineering, Vol.4/ No.3/ Winter 2017
8. References -Arvan, M., Tavakkoli-Moghaddam, R. and Abdollahi, M. (2015) “Designing a bi-objective, multi-product supply chain network for blood supply”, Uncertain Supply Chain Management, Vol. 3, No. 1, pp. 57–68. -Beliën, J. and Forcé, H. (2012) “Supply chain management of blood products: A literature review”, European Journal of Operational Research, Vol. 217, No. 1, pp. 1–16. -Birge, J.R. and Louveaux, F. (2011) “Introduction to stochastic programming”, Germany: Springer Science & Business Media. -Chakravarty, A. K. (2014) “Humanitarian relief chain: Rapid response under uncertainty”, International Journal of Production Economics, Vol. 151, pp. 146–157.
-Cheraghi, S., Hosseini-Motlagh, S. M., Ghatreh Samani, M. R., (2017) “Integrated planning for blood platelet production: a robust optimization approach”, Journal of Industrial and Systems Engineering, 10(SI: Healthcare).
-Chester, D. K. (1995) “World disasters report 1994”, International Federation of Red Cross and Red Crescent Societies: Third World Planning Review, Vol.17, No. 3, pp. 357. -Fahimnia, B, Jabbarzadeh, A., Ghavamifar, A. and Bell, M. (2015) “Supply chain design for efficient and effective blood supply in disasters”, International Journal of Production Economics. -Huang, M., Smilowitz, K. and Balcik, B. (2012) “Models for relief routing: equity, efficiency and efficacy”, Transportation Research Part E: Logistics and Transportation Review, Vol. 48, No. 1, pp. 2-18. -Ignatius, J., Hosseini-Motlagh, S. M., Sepehri, M. M., Behzadian, M. and Mustafa, A. (2010) “Hybrid models in decision making under uncertainty: the case of training provider evaluation”, Journal of Intelligent & Fuzzy Systems, Vol. 21, pp. 147-162. -Jokar, A. and Hosseini-Motlagh, S. M. (2015) “Impact of capacity of mobile units on blood supply chain performance: Results from a robust analysis”, International Journal of Hospital Research, Vol. 4, No. 3, pp. 109–114. -Kabak, Ö. and Ülengin, F. (2011) “Possibilistic linear-programming approach for supply chain
networking decisions”, European Journal of Operational Research, Vol. 209, No. 3, pp. 253–264. -Liu, B. and Liu, Y. K. (2002) “Expected value of fuzzy variable and fuzzy expected value models”, IEEE Transactions on fuzzy systems, Vol. 10, No. 4, pp. 445-450.
-Majidi, S., Hosseini-Motlagh, S. M., Yaghoubi, S., and Jokar, A. (2017) “Fuzzy green vehicle routing with simultaneous pickup- delivery and time window”,RAIRO,-Operations research. DOI:https://doi.org/10.1051/ro/2017007.
-Nadizadeh, A. and Hosseini Nasab, H. (2014) “Solving the dynamic capacitated location-routing problem with fuzzy demands by hybrid heuristic algorithm”, European Journal of Operational Research, Vol. 238, pp. 458–470.
-Nagurney, A. and Masoumi, A. H. (2012) “Supply chain network operations management of a blood banking system with cost and risk minimization”, Computational Management Science, Vol. 9, No. 2, pp. 205-231.
-Najafi, M., Eshghi, K. and Dullaert, W. (2013) “A multi-objective robust optimization model for logistics planning in the earthquake response phase”, Transportation Research Part E: Logistics and Transportation Review, Vol. 49, No. 1, pp. 217–249.
-Noyan, N. (2012) “Risk-averse two-stage stochastic programming with an application to disaster management”, Computers & Operations Research, Vol. 39, No. 3, pp. 541–559.
-Osorio, A. F., Brailsford, S. C. and Smith, H. K. (2015) “A structured review of quantitative models in the blood supply chain: a taxonomic framework for decision-making”, International Journal of Production Research, Vol.53, No. 24, pp. 1-22.
-Pierskalla, W. P. and Roach, C. D. (1972) “Optimal issuing policies for perishable inventory”, Management Science, Vol. 18, No. 11, pp. 603–614.
-Riahi, N., Hosseini-Motlagh, S. M. and Teimourpour, B. A. (2013) “Three-phase hybrid times series modelling framework for improved hospital inventory demand forecast”, International Journal of Hospital Research, Vol. 2, No. 3, pp. 133–142.
-Rytila, J. S. and Spens, K. M. (2006) “Using simulation to increase efficiency in blood supply chains”, Management Research News, Vol. 29, No. 12, pp. 801–819.
Optimal Blood Transportation in Disaster Relief Considering Facility Disruption and Route …
International Journal of Transportation Engineering, 254 Vol.4/ No.3/ Winter 2017
-Şahin, G., Sural, H. and Meral, S. (2007) “Locational analysis for regionalization of Turkish Red Crescent blood services”, Computers & Operations Research, Vol. 34, No. 3, pp. 692–704.
-Sha,Y. and Huang, J. (2012) “The Multi-period Location-allocation Problem of Engineering Emergency Blood Supply Systems”, Systems Engineering Procedia, Vol. 5, pp. 21 – 28.
-Sheu, J. B. (2007) “Challenges of emergency logistics management”, Transportation Research Part E: Logistics and Transportation Review, Vol. 43, pp. 655–659.
-Tofighi, S., Torabi, S. A. and Mansouri, S. A. (2016) “Humanitarian logistics network design under mixed uncertainty”, European Journal of Operational Research, Vol. 250, No. 1, pp. 239–250.
-Torabi, S. A. and Hassini, E. (2008) “An interactive possibilistic programming approach for multiple objective supply chain master planning”, Fuzzy Sets and Systems, Vol. 159, No. 2, pp. 193–214.
-Zadeh, L. (1978) “Fuzzy sets as a basis for a theory of possibility”, Fuzzy Sets and Systems, Vol.1, pp. 3-28.
-Zahiri, B., Torabi, S. A., Mousazadeh, M. and Mansouri, S. A. (2015) “Blood collection management: Methodology and application”, Applied Mathematical Modelling, Vol. 39, No.s 23-24, pp. 7680–7696.
-Zhu, H. and Zhang, J. (2009) “A credibility-based fuzzy mathematical programming model for APP problem” In: Artificial Intelligence and Computational Intelligence, AICI'09. International Conference on. IEEE, pp. 455-459
9. Endnotes 1 World Health Organization (WHO) 2 International Federation of Red Cross and Red Crescent Societies (IFRC) 3 Japan International Cooperation Agency (JICA)


![OPTIMAL TRANSPORT IN GEOMETRY · Optimal transport is one such tool References • Topics in Optimal Transportation [TOT] (AMS, 2003): Introduction • Optimal transport, old and](https://static.documents.pub/doc/80x56/5ec621bb8d12144b8d424d3b/optimal-transport-in-geometry-optimal-transport-is-one-such-tool-references-a.jpg)
![OPTIMAL TRANSPORTATION WITH CAPACITY CONSTRAINTS … · arXiv:1201.6404v2 [math.OC] 11 Mar 2012 OPTIMAL TRANSPORTATION WITH CAPACITY CONSTRAINTS JONATHAN KORMAN AND ROBERT J. MCCANN](https://static.documents.pub/doc/80x56/5e0eace0f37b4b6bae44f4f8/optimal-transportation-with-capacity-constraints-arxiv12016404v2-mathoc-11.jpg)

