Optimal design which are efficient for lack of fit tests. Frank Miller, AstraZeneca, Södertälje, Sweden Joint work with Wolfgang Bischoff, Catholic University of Eichstätt-Ingolstadt, Germany DSBS/FMS workshop 2006-04-26, Copenhagen Statistical Issues in Drug Development. - PowerPoint PPT Presentation
1 Optimal design which are efficient for lack of fit tests Frank Miller, AstraZeneca, Södertälje, Sweden Joint work with Wolfgang Bischoff, Catholic University of Eichstätt- Ingolstadt, Germany DSBS/FMS workshop 2006-04-26, Copenhagen Statistical Issues in Drug Development
Transcript
1
Optimal design which are efficient for lack of fit tests
Frank Miller, AstraZeneca, Södertälje, Sweden
Joint work with Wolfgang Bischoff, Catholic University of Eichstätt-Ingolstadt, Germany
DSBS/FMS workshop 2006-04-26, Copenhagen Statistical Issues in Drug Development
2
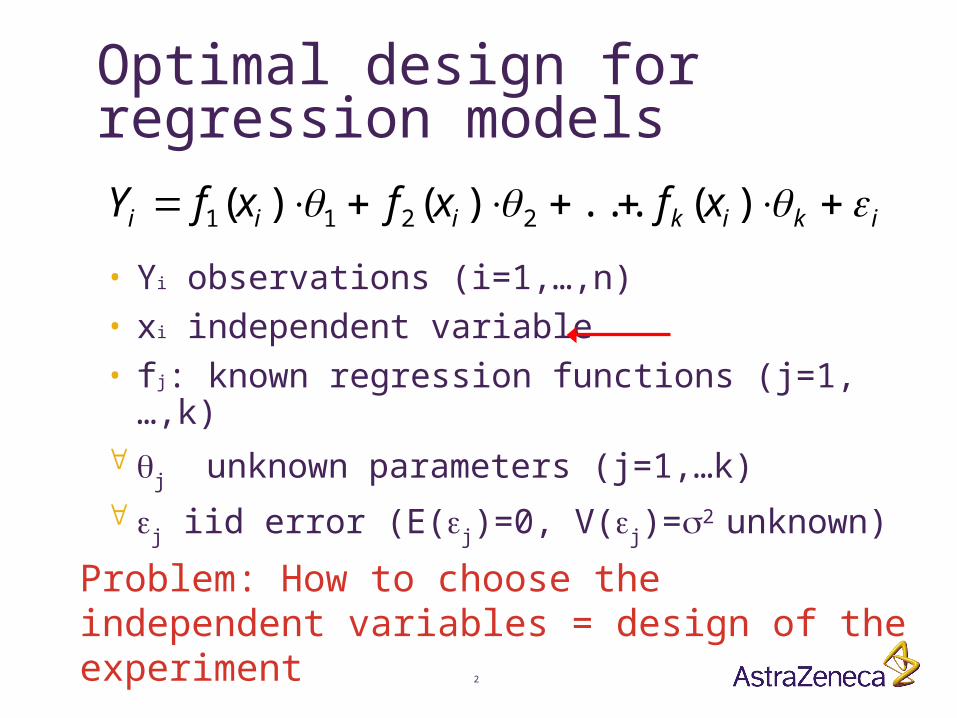
Optimal design for regression models
• Yi observations (i=1,…,n)• xi independent variable• fj: known regression functions (j=1,…,k) j unknown parameters (j=1,…k)
j iid error (E(j)=0, V(j)=2 unknown)
ikikiii xfxfxfY )(...)()( 2211
Problem: How to choose the independent variables = design of the experiment
3
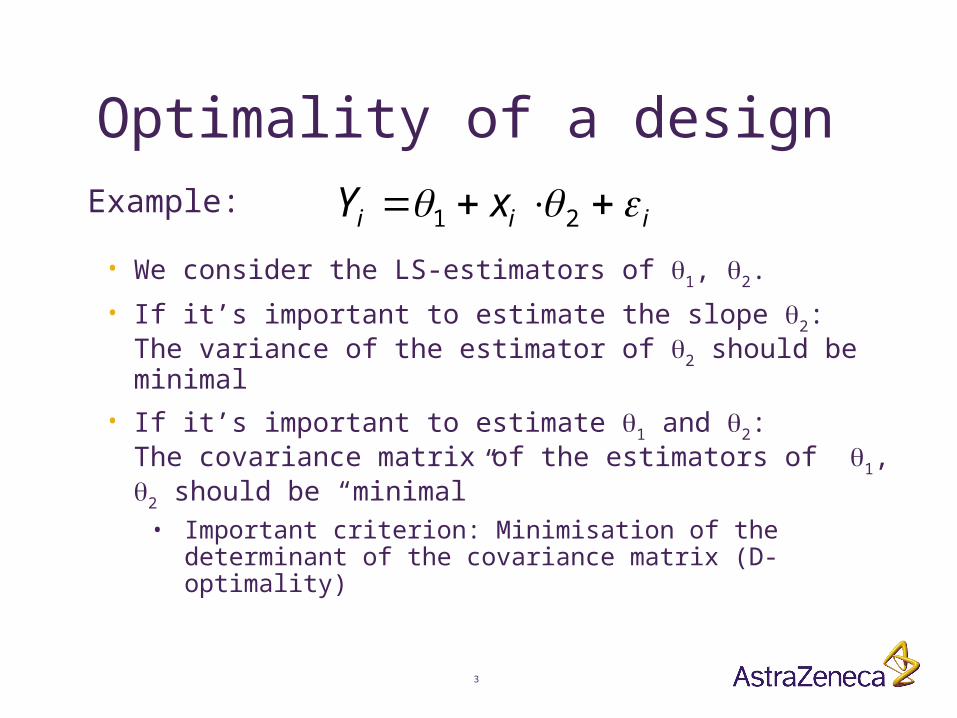
Optimality of a design
iii xY 21
• We consider the LS-estimators of 1, 2.
• If it’s important to estimate the slope 2:The variance of the estimator of 2 should be minimal
• If it’s important to estimate 1 and 2: The covariance matrix of the estimators of 1, 2 should be “minimal”
• Important criterion: Minimisation of the determinant of the covariance matrix (D-optimality)
Example:
4
Optimality of a design
iii xY 21Example:
Consider the design:• half of observations at lowest possible xi,• half of observations at highest possible xi.This design is both, optimal for estimationof 2 (c-optimal) and D-optimal for estimation of 1 and 2.
But we get no information if the above straight lineregression is the true relationship between independentfactor and observed variable.
We want to be able to perform a lack of fit test.
5
Lack of fit test arbitrary) ( gxgY iii
• Use the specific model as null-hypothesis in the general model:
kkk ffg ... with ,..., are There :H 1110
ikikii xfxfY )(...)( 11
General model:
Specific model:
• Different lack of fit tests possible (F-test, non-parametric tests)
• Power of lack of fit test should be optimised for functions in the alternative with a certain ”distance” from H0.
6
Optimal designs efficient for lack of fit tests
• We consider all designs which have an efficiency ≥ r (r between 0 and 1) for the lack of fit test.
• In this set of designs, we determine the optimal design (c-, D-optimal, …) for the specific model.
iii xgY
ikikii xfxfY )(...)( 11
General model:
Specific model:
These are the designs which distribute at least r*100% of the observations ”uniformly” on all possible x.
7
An experiment• Aim: to study the
(toxicological) impact of fertilizer for flowers on the growth of cress
• Region of interest: a proportion of 0 - 1.2% concentration of fertilizer in the water
• N=81 plant plates with 10 seeds each
8
An experiment• Plate i is treated with a concentration xi of
fertilizer, xi[0, 1.2] • After 5.5 days, the yield Yi (in mg) of cress in
plate i is recorded.
9
An experiment: the model
iiii xxY 32
21
• In the focus: we want to estimate the parameters 1, 2, 3 as good as possible
• Here: The determinant of the covariance matrix of should be as small as possible (D-optimality).
• Moreover, at least 1/3 of the observations should be used to check if the above model is valid.
• We search for the D-optimal design within the set of designs having at least 1/3 of its mass uniformly distributed on the experimental region [0, 1.2].
321ˆ,ˆ,ˆ
10
An experiment: the optimal design
• Solution (“asymptotic” design):• 33.3% of observations uniformly on [0, 1.2],• 26.6% of observations for xi = 0,• 13.4% of observations for xi = 0.6,• 26.6% of observations for xi = 1.2.
• Approximation with:
.81,...,60,2.1
,59,...,47,200
19584099,46,...,36,6.0
,35,...,23,200
1958899,22,...,1,0
i
ii
i
ii
i
xi
31
90
19510
45
19520
90
19510
11
An experiment: the result
Estimation of the regression curve:22.135.556.201 xxy
P-value of lackof fit test (hereF-test): 0.579
hypothesisof quadraticregression can notbe rejected
12
C-optimal designs
Polynomial regression model of degree k-1Estimate the highest coefficient in an optimal wayUse only designs which are efficient for a lack of fit test
The optimal design can be derived algebraically for arbitrary k.
13
References• Biedermann S, Dette H (2001): Optimal designs for testing the
functional form of a regression via nonparametric estimation techniques. Statist. Probab. Lett. 52, 215-224.
• Bischoff, W, Miller, F (2006): Optimal designs which are efficient for lack of fit tests. Annals of Statistics. To appear.
• Bischoff, W, Miller, F (2006): For lack of fit tests highly efficient c-optimal designs. Journal of Statistical Planning and Inference. To appear.
• Dette, H (1993): Bayesian D-optimal and model robust designs in linear regression models. Statistics 25, 27-46.
• Wiens, DP (1991): Designs for approximately linear regression: Two optimality properties of uniform design. Statist. Probab. Lett. 12, 217-221.
14
Dose response relationship in clinical trials
Nonlinear models are used,for example
xxf21exp1
1)(
The D-optimal design for the estimation of 1
and 2 has half of the observations on each of two doses: 215434.1 x
(see for example Minkin, 1987, JASA, p.1098-1103)The D-optimal design depends on unknown parameters
15
Dose response relationship in clinical trials
One possibility is to divide the trial into two stages.
Use some prior knowledge about the unknownparameters 1 and 2 to compute two doses for stage 1.
Perform an interim analysis and update knowledge about the parameters. Compute a new D-optimal designfor stage 2.
It might be desirable already in the first stage of the trial to have the possibility for a lack of fit test