Santiago Fire Department The Model Results Conclusions Bibliography Optimal Fire Station Location and Fleet Assignment for the Santiago Fire Department Universidad de Los Andes [email protected]March 24, 2014 1 / 38
Transcript
Santiago Fire Department The Model Results Conclusions Bibliography
Optimal Fire Station Location and FleetAssignment for the Santiago Fire Department
10 Santiago 1 0 0 0 0 011 Santiago 2 0 0 0 0 012 Santiago 0 1 1 1 0 013 Providencia 1 0 1 0 0 114 Las Condes 1 0 0 1 0 015 Las Condes 0 1 0 1 0 016 Estacin Central 1 0 0 1 0 117 Santiago 1 0 0 0 1 018 Vitacura 1 0 0 0 1 019 Lo Barnechea 2 0 0 0 0 020 Las Condes 2 0 0 0 0 021 Renca 2 0 0 0 0 022 Independencia 1 0 1 0 0 0
Total 21 5 5 8 3 2
4 / 38
Santiago Fire Department The Model Results Conclusions Bibliography
Arrival Time
5 / 38
Santiago Fire Department The Model Results Conclusions Bibliography
Standard Response
Vehicles Required ExclusionsIncident type1 type2 type3 ex1 ex2e1: House Fire 2P T
e2: Building Fire 2P T L
e3: Car Fire P
e4: Wildfire P
e5: Car accident T R T R
e6: Bus accident P T R T R
e7: Hazmat P H T
e8: Gas leak P H T H T
e9: Electric problems P T
e10: Others P T P T
6 / 38
Santiago Fire Department The Model Results Conclusions Bibliography
Sets
E : Set of types of calls.V : Set of types of vehicles.I : Set of nodes where emergency calls are generated.J ⊆ I : Set of nodes where a station could be located.Covi ⊆ J : Set of nodes that a station in i ∈ I can attend. This is
defined with respect to a coverage radius.T : Set of periods in the evaluation horizon.
7 / 38
Santiago Fire Department The Model Results Conclusions Bibliography
Parameters
Demtei : Number of calls of emergency of type e ∈ E at node
i ∈ I and period t ∈ T .Aj : Number places available to locate a station at node j ∈ J.C taj : Maximum capacity of number of vehicles that can be
assigned to station j ∈ J at period t ∈ T .K tv : Maximum number of available vehicles of type v ∈ V at
period t ∈ T .FS : Maximum number of Fire Stations to be located.Nv : Number of vehicles of type v ∈ V .Nvv : Combination of number vehicles by type that can attend
calls. This only take the values {1P, 2P,H, L,T ,R}.Sv : Vehicle of type v ∈ V standard response distance.mt
Nvvi: Number of vehicles of type v ∈ V that have to be dis-
tributed in the neighborhood of node i ∈ I considering adistance Sv at period t ∈ T , to have at least Nv vehiclesto attend a call.
Dayst : Number of days of period t ∈ T .
8 / 38
Santiago Fire Department The Model Results Conclusions Bibliography
Decision Variables
w tei ∈ {0, 1} : 1 if emergency of type e ∈ E at node i ∈ I is attended
with its correspondent standard response at period t ∈T .
x tvajk ∈ {0, 1} : 1 if the k-th vehicle of type v ∈ V is assigned to subnodea of node j ∈ J at period t ∈ T .
y tvik ∈ {0, 1} : 1 if node i ∈ I is attended by k vehicles of type v ∈ Vat period t ∈ T .
z tj ∈ {0, 1} : 1 if a station is located at node j ∈ J at period t ∈ T .
9 / 38
Santiago Fire Department The Model Results Conclusions Bibliography
Standard Response by Vehicle Type
mt2Pi∑
k=1
y tPik ≤∑
j∈Covi
Aj∑a=1
(C taj∑
k=1
x tPajk + x tPLajk
)∀i ∈ I , ∀t ∈ T
mt2Pi∑
k=1
y tPik ≤∑
j∈Covi
Aj∑a=1
C taj∑
k=1
x tPajk ∀i ∈ I , ∀t ∈ T
mt1Hi∑
k=1
y tHik ≤∑
j∈Covi
Aj∑a=1
C taj∑
k=1
x tHajk ∀i ∈ I , ∀t ∈ T
mt1Li∑
k=1
y tLik ≤∑
j∈Covi
Aj∑a=1
(C taj∑
k=1
x tLajk + x tPLajk
)∀i ∈ I ,∀t ∈ T
mt1Ti∑
k=1
y tTik ≤∑
j∈Covi
Aj∑a=1
C taj∑
k=1
x tTajk ∀i ∈ I , ∀t ∈ T
mt1Ri∑
k=1
y tRik ≤∑
j∈Covi
Aj∑a=1
C taj∑
k=1
x tRajk ∀i ∈ I ,∀t ∈ T
10 / 38
Santiago Fire Department The Model Results Conclusions Bibliography
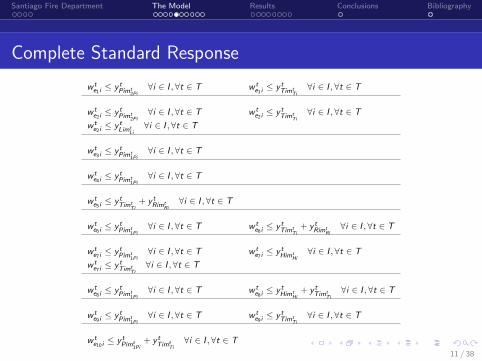
Complete Standard Response
w te1i≤ y tPimt
2Pi∀i ∈ I ,∀t ∈ T w t
e1i≤ y tTimt
Ti∀i ∈ I ,∀t ∈ T
w te2i≤ y tPimt
2Pi∀i ∈ I ,∀t ∈ T w t
e2i≤ y tTimt
Ti∀i ∈ I ,∀t ∈ T
w te2i≤ y tLimt
Li∀i ∈ I ,∀t ∈ T
w te3i≤ y tPimt
1Pi∀i ∈ I ,∀t ∈ T
w te4i≤ y tPimt
1Pi∀i ∈ I ,∀t ∈ T
w te5i≤ y tTimt
Ti+ y tRimt
Ri∀i ∈ I ,∀t ∈ T
w te6i≤ y tPimt
1Pi∀i ∈ I ,∀t ∈ T w t
e6i≤ y tTimt
Ti+ y tRimt
Ri∀i ∈ I , ∀t ∈ T
w te7i≤ y tPimt
1Pi∀i ∈ I ,∀t ∈ T w t
e7i≤ y tHimt
Hi∀i ∈ I ,∀t ∈ T
w te7i≤ y tTimt
Ti∀i ∈ I , ∀t ∈ T
w te8i≤ y tPimt
1Pi∀i ∈ I ,∀t ∈ T w t
e8i≤ y tHimt
Hi+ y tTimt
Ti∀i ∈ I , ∀t ∈ T
w te9i≤ y tPimt
1Pi∀i ∈ I ,∀t ∈ T w t
e9i≤ y tTimt
Ti∀i ∈ I ,∀t ∈ T
w te10i≤ y tPimt
1Pi+ y tTimt
Ti∀i ∈ I , ∀t ∈ T
11 / 38
Santiago Fire Department The Model Results Conclusions Bibliography
Precedence, Causality, Capacities and Immobility
x tvajk ≤ x tvajk−1 ∀j ∈ J, a = 1, ...,Aj , ∀v ∈ V , ∀k ∈ K tv − {1} , ∀t ∈ T
y tvik ≤ y tvik−1 ∀j ∈ J, a = 1, ...,Aj , ∀v ∈ V ,∀k ∈ K tv − {1} ,∀t ∈ T
x tvajk ≤ z taj ∀j ∈ J, a = 1, ...,Aj , ∀v ∈ V , ∀k = 1, ..,C taj , ∀t ∈ T
∑v∈V
C taj∑
k=1
x tvajk ≤ C tajz
taj ∀j ∈ J, a = 1, ...,Aj ,∀t ∈ T
∑j∈J
Aj∑a=1
C taj∑
k=1
x tvajk ≤ K tv ∀v ∈ V ,∀t ∈ T
x tvajk ≥ x t−1vajk ∀j ∈ J, a = 1, ...,Aj , ∀v ∈ V , ∀t ∈ T − {1} , k = 1, ...,C taj
z taj ≥ z t−1aj ∀j ∈ J, a = 1, ...,Aj ,∀t ∈ T − {1}
12 / 38
Santiago Fire Department The Model Results Conclusions Bibliography
Specially Tailored: Water and Ladder Specialities
A station cannot have both pumper brigades and ladder brigades.The SFD keeps these brigades separate, with specialized staff ateach station.
x tPaj1 + x tTaj1 ≤ 1 ∀j ∈ J, a = 1, ...,Aj , ∀t ∈ T
13 / 38
Santiago Fire Department The Model Results Conclusions Bibliography
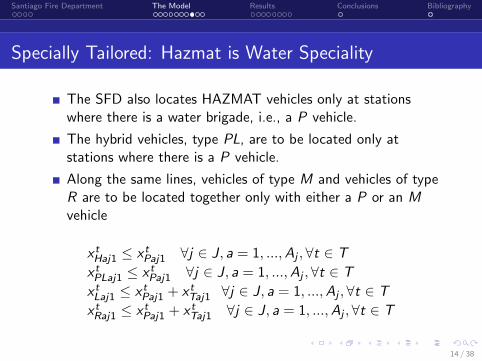
Specially Tailored: Hazmat is Water Speciality
The SFD also locates HAZMAT vehicles only at stationswhere there is a water brigade, i.e., a P vehicle.
The hybrid vehicles, type PL, are to be located only atstations where there is a P vehicle.
Along the same lines, vehicles of type M and vehicles of typeR are to be located together only with either a P or an Mvehicle
x tHaj1 ≤ x tPaj1 ∀j ∈ J, a = 1, ...,Aj , ∀t ∈ T
x tPLaj1 ≤ x tPaj1 ∀j ∈ J, a = 1, ...,Aj ,∀t ∈ T
x tLaj1 ≤ x tPaj1 + x tTaj1 ∀j ∈ J, a = 1, ...,Aj ,∀t ∈ T
x tRaj1 ≤ x tPaj1 + x tTaj1 ∀j ∈ J, a = 1, ...,Aj , ∀t ∈ T
14 / 38
Santiago Fire Department The Model Results Conclusions Bibliography
Objective Function
z = max∑t∈T
∑e∈E
∑i∈I
DemteiDays
tw tei
15 / 38
Santiago Fire Department The Model Results Conclusions Bibliography
Demand Forecast
0
20
40
60
80
100
120
140
160
180
200
Num
ber
of e4
Month
Emergency Type 4: Wildfire in which the fire occurs in an area of
combustible vegetation in the countryside or a wilderness area
e4 e4 forecasted
16 / 38
Santiago Fire Department The Model Results Conclusions Bibliography
Description
The SFD database contains information from January, 2007 toJuly, 2011, and includes 24,480 information records of emergencycalls. The baseline case considered only clean recordscorresponding to the emergencies defined in Section 3, with a totalof 22,143 calls. The four year forecasted series added to thehistorical clean records includes 37,964 calls occurring from 2007to 2015.Ten experiments were performed. Five of these experiments wererun on the historical demand alone, while the remaining fiveexperiments were run using the historical series (2007 - 2011)augmented with the forecast for the years 2012 to 2015.
17 / 38
Santiago Fire Department The Model Results Conclusions Bibliography
Scenarios
The system is modeled as a square grid, with each square of size 1km by 1 km. The maximum number of vehicles of each type wasset to the current number of vehicles. For the maximum servicedistance s, we used s ∈ {3.5, 4.5, 5.5, 6.5}, where values of s areexpressed in kilometers.
18 / 38
Santiago Fire Department The Model Results Conclusions Bibliography
Scenarios
Baseline scenario: We first run a baseline case in which thecurrent situation is assessed by running the model with all thestation locations and vehicle allocations fixed to their currentvalues. The total coverage is computed in terms of calls attendedto with the standard response, using the correspondent demanddata set. The solutions to the baseline cases provide lower boundsof the objective function z .Scratch scenario: In this experiment, the model was run allowingunrestricted relocation of stations and reallocation of vehicles.This case provides the upper bound to the improvement achievableby redesigning the whole system. Needless to say, this case wouldbe non-viable politically.
19 / 38
Santiago Fire Department The Model Results Conclusions Bibliography
Scenarios
Fleet reallocation only: In this experiment, all locations werefixed to their current values, but the model optimally redefined thevehicle allocations.First best station: Exactly one fire station is free to be relocated,and all vehicles can be allocated optimally. This was done byincluding the following constraint to the model:∑
j∈κz tj ≥ |κ| − 1 ∀t ∈ T (1)
where κ is the set of current station locations. This equationforces n − 1 stations to remain in their current locations, and freesexactly one station to be relocated.
20 / 38
Santiago Fire Department The Model Results Conclusions Bibliography
Scenarios
Second best station: Exactly two fire stations are free to berelocated, and all vehicles can be allocated optimally. This wasdone by including the following constraint:∑
j∈κz tj ≥ |κ| − 2 ∀t ∈ T (2)
21 / 38
Santiago Fire Department The Model Results Conclusions Bibliography
Results for scenarios with historical time series of events
Scenario s O.F. % Stations P PL H L R T
Base 3.5 15,467 22 21 2 3 5 8 5
Scratch 3.5 21,093 36% 22 21 2 3 5 8 5
Fleet only 3.5 18,972 23% 22 19 2 3 4 8 5
First best 3.5 20,545 33% 22 20 2 3 5 8 5
Second best 3.5 20,736 34% 22 19 2 3 5 8 5
Base 4.5 17,458 22 21 2 3 5 8 5
Scratch 4.5 21,596 24% 22 20 2 3 5 8 5
Fleet only 4.5 19,862 14% 22 19 2 3 5 7 5
First best 4.5 21,084 21% 22 18 2 3 4 8 5
Second best 4.5 21,596 24% 22 20 2 3 5 8 5
Base 5.5 18,084 22 21 2 3 5 8 5
Scratch 5.5 22,079 22% 19 19 2 3 4 8 5
Fleet only 5.5 20,927 16% 22 20 2 3 5 7 5
First best 5.5 21,618 20% 22 19 2 3 4 7 5
Second best 5.5 22,016 22% 22 16 2 3 2 8 5
Base 6.5 20,134 22 21 2 3 5 8 5
Scratch 6.5 22,201 10% 13 18 2 3 4 - 5
Fleet only 6.5 21,191 5% 22 17 2 3 4 5 5
First best 6.5 22,200 10% 22 16 2 3 5 - 5
Second best 6.5 22,200 10% 22 15 2 3 4 - 5
22 / 38
Santiago Fire Department The Model Results Conclusions Bibliography
Results for scenarios with both historical data and aforecast of the events occurring in the years 2012 to 2015
Scenario s O.F. % Stations P PL H L R T
Base 3.5 26,062 22 21 2 3 5 8 5
Scratch 3.5 34,960 58% 22 20 1 3 5 8 5
Fleet only 3.5 31,630 36% 22 19 2 3 5 8 5
First best 3.5 33,964 51% 22 20 2 3 5 8 5
Second best 3.5 34,286 53% 22 19 2 3 5 8 5
Base 4.5 29,277 22 21 2 3 5 8 5
Scratch 4.5 36,093 39% 20 20 1 3 5 8 5
Fleet only 4.5 32,711 20% 22 20 2 3 4 8 5
First best 4.5 35,187 34% 22 17 2 3 5 8 5
Second best 4.5 35,926 38% 22 20 2 3 5 8 5
Base 5.5 30,278 22 21 2 3 5 8 5
Scratch 5.5 36,711 36% 21 21 2 3 5 8 5
Fleet only 5.5 34,248 22% 22 20 2 3 5 7 5
First best 5.5 35,799 31% 22 18 2 3 5 8 5
Second best 5.5 36,564 35% 22 20 2 3 2 8 5
Base 6.5 33,582 22 21 2 3 5 8 5
Scratch 6.5 36,835 16% 19 20 2 3 5 6 5
Fleet only 6.5 36,241 13% 22 19 2 3 5 6 5
First best 6.5 36,558 15% 22 20 2 3 5 8 5
Second best 6.5 36,824 16% 22 20 2 3 3 8 523 / 38
Santiago Fire Department The Model Results Conclusions Bibliography
Proportion of stations and fleet in Santiago for allexperiments
Historical Historical + ForecastedScenario s [km] Stations Vehicles Stations VehiclesBaseline 3.5 to 6.5 45.5% 43.2% 45.5% 43.2%
Fleet Free 35 45.5% 34.1% 45.5% 33.3%
Fleet Free 45 45.5% 36.6% 45.5% 28.6%
Fleet Free 55 45.5% 35.7% 45.5% 31.0%
Fleet Free 65 45.5% 44.4% 45.5% 45.0%
Scratch 35 18.2% 17.4% 9.1% 21.2%
Scratch 45 45.5% 27.2% 22.7% 14.2%
Scratch 55 27.3% 26.8% 18.2% 20.3%
Scratch 65 11.8% 9.4% 18.2% 23.5%
First Best 35 40.9% 22.5% 40.9% 24.9%
First Best 45 40.9% 30.0% 45.5% 28.1%
First Best 55 45.5% 32.5% 45.5% 21.1%
First Best 65 40.9% 12.9% 45.5% 39.2%
Second Best 35 45.5% 28.7% 40.9% 23.7%
Second Best 45 45.5% 27.2% 40.9% 28.9%
Second Best 55 40.9% 22.2% 40.9% 22.8%
Second Best 65 40.9% 20.7% 36.4% 26.1%24 / 38
Santiago Fire Department The Model Results Conclusions Bibliography
Conclusions I
We analyzed a reconfiguration of the fire station location andfleet assignment for the Santiago Fire Department, using anoptimization model. We propose alternatives for improvingthe number of emergency calls attended to by the standardresponse defined by the SFD.
The experiments suggest that a complete relocation and fleetreassignment would allow a significantly improved coverage ofevents. In other words, with the same resources SFD hastoday, and with only a redistribution of those resources, it ispossible to improve the number of emergency calls attendedto within the standard response by 10% to 35%. In practice,this means that if the response time is six minutes, the
25 / 38
Santiago Fire Department The Model Results Conclusions Bibliography
Conclusions II
percentage of calls attended to within the standard responseincreases from 70% to 95%.
The experiments also showed that by relocating a single firestation and a fleet redistribution, it is possible to obtain up toan 50% improvement in the percentage of calls adequatelyattended to. Relocation of one station is a perfectly viablesolution, in political terms.
The results of the model when applied to future scenarios,shows similar conclusions, making a relocation and fleetredistribution a very attractive plan. This relocation shouldinclude some of the downtown stations.
26 / 38
Santiago Fire Department The Model Results Conclusions Bibliography
Conclusions III
Finally, considering that performing massive changes is notnecessarily viable, we propose relocating the 16th Station andreassigning the fleet as indicated in the results of theexperiments with both their historical and forecasted timeseries of incidents. These changes, with just one relocation,should result in an improvement of 30% in the percentage ofevents attended to within the standard response, with respectto the baseline scenario.
27 / 38
Santiago Fire Department The Model Results Conclusions Bibliography
Bibliography I
Ayfer Basar, Bulent Catay, and Tonguc Unluyurt.A taxonomy for emergency service station location problem.Optimization Letters, 6(6):1147–1160, 2012.
F. Borras and J. Pastor.The ex-post evaluation of the minimum local reliability level:An enhanced probabilistic location set covering model.Annals of Operations Research, 111(1-4):51–74, 2002.
G.M. Carter and E.J. Ignall.A simulation model of fire department operations: Design andpreliminary results.Systems Science and Cybernetics, IEEE Transactions on,6(4):282–293, 1970.
28 / 38
Santiago Fire Department The Model Results Conclusions Bibliography
Bibliography II
R. Church and C. ReVelle.The maximal covering location problem.Papers in Regional Science, 32(1):101–118, 1974.
Philippe Chevalier, Isabelle Thomas, David Geraets, ElsGoetghebeur, Olivier Janssens, Dominique Peeters, and FrankPlastria.Locating fire stations: An integrated approach for belgium.Socio-Economic Planning Sciences, Special Issue: ModelingPublic Sector Facility Location Problems, 46(2):173–182,2012.
29 / 38
Santiago Fire Department The Model Results Conclusions Bibliography
Bibliography III
S. C. Chapman and J. A. White.Probabilistic formulations of emergency service facilitieslocation problems.In ORSA/TIMS Conference, San Juan, Puerto Rico, 1974.
A. Eiselt and V. Marianov.Foundations of Location Analysis.International Series in Operations Research and ManagementScience. 2011.
R. Galvo.The use of lagragean relaxation in the solution ofuncapacitated facility location problems.Location Science, 1(1):57–70, 1993.
30 / 38
Santiago Fire Department The Model Results Conclusions Bibliography
Bibliography IV
R. S. Garfinkel, A. W. Neebe, and M. R. Rao.An algorithm for the m-median plant location problem.Transportation Science, 8(3):217–236, 1974.
W.E. Goswick.Fire Station Location: an Analysis of Local Factors.Executive Fire Officer Program. Applied Research Project.National Fire Academy, 1991.
S. Hakimi.Optimum locations of switching centres and the absolutecentres and medians of a graph.Operations Research, 12(3):450–459, 1964.
31 / 38
Santiago Fire Department The Model Results Conclusions Bibliography
Bibliography V
V. Marianov and C. ReVelle.The capacitated standard response fire protection sitingproblem.Annals of Operations Research, 40:303–322, 1992.
V. Marianov and C. ReVelle.A probabilistic fire protection siting model with joint vehiclereliability constraints.Papers in Regional Science Association, 71(3):217–241, 1992.
V. Marianov and C. ReVelle.Siting emergency services.Facility Location, pages 199–223, 1995.
32 / 38
Santiago Fire Department The Model Results Conclusions Bibliography
Bibliography VI
V. Marianov and D. Serra.Facility Location: Applications and Theory, chapter LocationProblems in the Public Sector, pages 119–150.Springer-Verlag, 2002.
Alan T. Murray.Optimising the spatial location of urban fire stations.Fire Safety Journal, 2013.
D. Plane and T. Hendrick.Mathematical programming and the location of fire companiesfor the denver fire department.Operations Research, 25(4):563–578, 1977.
33 / 38
Santiago Fire Department The Model Results Conclusions Bibliography
Bibliography VII
C. ReVelle, H. Eiselt, and M. Daskin.A bibliography for some fundamental problem categories indiscrete location science.European Journal of Operational Research, 184(3):817–848,2008.
C. ReVelle and V. Marianov.A probabilistic fleet model with individual vehicle reliabilityrequirements.European Journal of Operational Research, 53(1):93–105,1991.
K. Rosing and C. ReVelle.Heuristic concentration: Two stage solution construction.European Journal of Operational Research, 97(1):75–86, 1997.
34 / 38
Santiago Fire Department The Model Results Conclusions Bibliography
Bibliography VIII
C. S. ReVelle and R. Swain.Central facilities location.Geographical Analysis, 2(1):30–42, 1970.
D. Schilling, D. J. Elzinga, J. Cohon, R. Church, andC. ReVelle.The team/fleet models for simultaneous facility and equipmentsiting.Transportation Science, 13(2):163–175, 1979.
D. Serra and V. Marianov.The p-median problem in a changing network: The case ofbarcelona.Location Science, 6:383–394, 1998.
35 / 38
Santiago Fire Department The Model Results Conclusions Bibliography
Bibliography IX
Daniel Serra and Vladimir Marianov.New trends in public facility location modeling.Technical report, UPF Economics and Business Working PaperNo. 755, 2004.
M. Teitz and P. Bart.Heuristic methods for estimating the generalized vertexmedian of a weighted graph.Operations Research, 16(5):955–961, 1968.
H. Toro-Dıaz, M. Mayorga, S. Chanta, and L. MacLay.Joint location and dispatching decisions for emergency medicalservices.Computers and Industrial Engineering, 64:917–928, 2013.
36 / 38
Santiago Fire Department The Model Results Conclusions Bibliography
Bibliography X
C. Toregas, R. Swain, C. ReVelle, and L. Bergmann.The location of emergency service facilities.Operations Research, 19(6):1363–1373, 1971.
John A. White and Kenneth E. Case.On covering problems and the central facilities locationproblem.Geographical Analysis, 6(3):281–294, 1974.
L. Yang, B. Jones, and S. Yang.A fuzzy multi-objective programming for optimization of firestation locations through genetic algorithms.European Journal of Operational Research, 181(2):903–915,2006.
37 / 38
Santiago Fire Department The Model Results Conclusions Bibliography