Department of Vertebrate Ecology, The Australian Museum, 6-8 College Street, NewSouth Wales 2000, Australia
INTRODUCTION
Proponents of optimal foraging theory attempt to predict the behavior ofanimals while they are foraging; this theory is based on a number of assump-tions (133, 155, 210, 231). First, an individual’s contribution to the nextgeneration (i.e. its "fitness") depends on its behavior while foraging. Thiscontribution may be measured genetically or culturally as the proportion of anindividual’s genes or "ideas", respectively, in the next generation. In theformer case, the theory is simply an extension of Darwin’s theory of evolution.
Second, it is assumed that there should be a heritable component of foragingbehavior, i.e. an animal that forages in a particular manner should be likely tohave offspring that tend to forage in the same manner. This heritable compo-nent can be either the actual foraging responses made by an animal or the rulesby which an animal learns to make such responses. In other words, optimalforaging theory may apply regardless of whether the foraging behavior islearned or innate. Given these first two assumptions, it follows that theproportion of individuals in a population foraging in ways that enhance theirfitness will tend to increase over time. Unless countervailed by sufficientlystrong group selection (see 287,242), foraging behavior will therefore evolve,and the average foraging behavior will increasingly come to be characterizedby those characteristics that enhance individual fitness.
The third assumption is that the relationship between foraging behavior andfitness is known. This relationship is usually referred to as the currency offitness (231). In general, any such currency will include a time scale, althoughin some cases it may be assumed that fitness is a function of some rate.
The fourth assumption is that the evolution of foraging behavior is notprevented by genetic constraints such as the physical linkage of genes thataffect a number of traits or the effects of single genes on multiple traits (155).Such genetic linkage of traits could impede the rate of evolution, but it isassumed that mutations will eventually arise that circumvent these linkages.
The fifth assumption is that the evolution of foraging behavior is subject to"functional" constraints that have been realistically determined. When focus-ing on foraging behavior (rather than on foraging traits in general), it assumed that the morphologies and physical properties of the animals areknown and evolutionarily fixed. Assumptions may also have to be made aboutthe level of information available to an animal and about the animal’s ability tostore and process this information (e.g. 125,189,268). Animals might obtaininformation through either direct experience or observation of others (e.g.274). Such functional constraints can also be considered as evolutionaryvariables within a broader framework.
The final assumption is that foraging behavior evolves more rapidly than therate at which the relevant conditions change (210). Thus, the evolution andadaptation of foraging behavior should approximately reach completion withindividuals foraging in ways close to (i.e. statistically indistinguishable from)those that maximize their expected fitness, subject to any functional constraints.In this sense, it is hypothesized that animals forage "optimally."
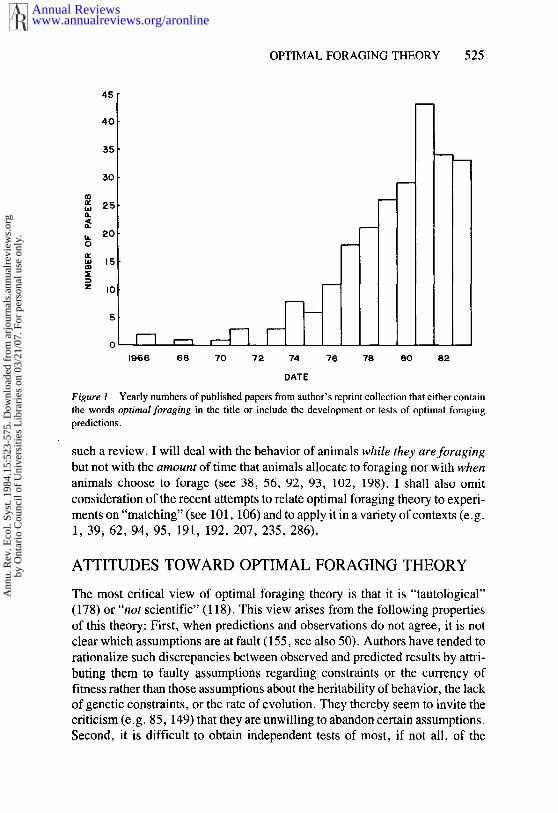
This approach to animal foraging behavior began to develop about 18 yearsago with papers by MacArthur & Pianka (150) and Emlen (64). The number papers published annually that either include the optimal foraging in the title orclearly develop or test predictions based on optimal foraging theory appears tohave increased rapidly between 1973 and 1981 and to have decreased since then(Figure 1). It will be interesting to see what happens in the future.
During the last 18 years, the literature on optimal foraging theory has beenreviewed a number of times (46, 76, 132-135,137, 199,209,210,229,231).Nevertheless, at this stage another review seems timely. Past reviews havetended to take a relatively positive view of the value of optimal foraging theoryand to take apparent tests of predictions derived from this theory at face value.Optimal foraging theory has engendered considerable controversy, however(e.g, 118,178). Furthermore, in many optimal foraging studies, the theory andthe observations may not be appropriately matched because, for example, theassumptions are unrealistic or unsupported or the mathematical calculations areincorrect (see 209 and discussion below). It is therefore time, I believe, review the various points of view concerning optimal foraging theory, to derivecriteria for evaluating studies that attempt to test this theory, and to begin tojudge its usefulness on the basis of studies that meet these criteria. In order toachieve these goals, it is also necessary to review both the theoretical andempirical developments that have occurred. I shall attempt below to carry out
Figure i Yearly numbers of published papers from author’s reprint collection that either contain
the words optimal foraging in the title or include the development or tests of optimal foraging
predictions.
such a review. I will deal with the behavior of animals while they are foraging
but not with the amount of time that animals allocate to foraging nor with whenanimals choose to forage (see 38, 56, 92, 93, 102, 198). I shall also omitconsideration of the recent attempts to relate optimal foraging theory to experi-ments on "matching" (see 101,106) and to apply it in a variety of contexts (e.g.
1, 39~ 62, 94, 95, 191, 192, 207, 235, 286).
ATTITUDES TOWARD OPTIMAL FORAGING THEORY
The most critical view of optimal foraging theory is that it is "tautological"(178) or "not scientific" (118). This view arises from the following propertiesof this theory: First, when predictions and observations do not agree, it is notclear which assumptions are at fault (155, see also 50). Authors have tended
rationalize such discrepancies between observed and predicted results by attri-buting them to faulty assumptions regarding constraints or the currency offitness rather than those assumptions about the heritability of behavior, the lackof genetic constraints, or the rate of evolution. They thereby seem to invite thecriticism (e.g. 85,149) that they are unwilling to abandon certain assumptions.Second, it is difficult to obtain independent tests of most, if not all, of the
assumptions that underlie optimal foraging theory. Probably few would doubtthe assumption about the heritability of foraging behavior, but confirmatoryexperiments (e.g. 54) are mostly lacking. Foraging behavior almost certainlyaffects animal fitness, but unless the effects of this behavior on survival andreproduction can be demonstrated for animals that differ only in terms ofselected aspects of their foraging, the currency of fitness cannot be verified.Under carefully controlled circumstances, an animal will do as it pleases, andconsequently, it is difficult to obtain more than a minimum estimate of ananimal’s capabilities for information acquisition, storage and processing.Elaborate breeding experiments would be necessary to verify the existence ofany linkage between foraging behavior and other traits. There also does notappear to be any information available on rates of evolution and of changes inconditions.
To view optimal foraging theory as tautological or unscientific seems un-reasonable. Like other scientific theories, it is based on assumptions. Theexistence of a number of assumptions in the case of this theory makes itdifficult, but not impossible, to evaluate it fully. Some of the assumptions areeasier to relate to observations than others. A sound knowledge of an animal’snatural history may well determine how realistic the assumptions concerningthe currency of fitness and functional constraints are (see 210), but it is of littlehelp with regard to the other assumptions. It is also relatively easy to alter thetheoretical treatments of foraging and the data collection schemes to accommo-date alterations in the assumptions concerning fitness currency and functionalconstraints. For example, the assumption that an animal is simply maximizingthe net rate of energy gain can easily be modified to allow for a minimumrequirement of some nutrient (e.g. see 188). At present, however, there is obvious way to incorporate deviations in other assumptions into the theory.Such deviations should lead to "suboptimal" foraging behavior, but unlesssome way can be found to predict the magnitude and direction of any departuresfrom optimal behavior, there seems little point in pursuing this (but see 90, 213,238,239). The most logical approach to differences between predictions andobservations is therefore to explore the consequences of variation in thecurrency and constraints assumptions and to devise experiments and observa-tions from which the most realistic assumptions about these variables can bededuced. If the most realistic currency and constraints assumptions and themost careful development of theory do not lead to reasonably close agreementbetween observed and predicted results a reasonable fraction of the time, thenoptimal foraging theory should properly be judged as not very useful (seebelow); Therefore, its usefulness cannot be determined on the basis of only oneor a few studies (see also 280).
A second view of optimal foraging theory, which is also unflattering, is thatit is doomed to failure because of the complexity of the natural world. In other
words, according to this view, the effort to develop this theory is hopelessbecause one or more of the basic assumptions is almost certain to be false. Thisview would seem to be overly pessimistic, however, and if it were applied inanalogous fashion to the motion of falling objects, it would surely produce atable of falling coefficients, rather than the law of gravity. The success of manyoptimal foraging studies also argues against this view.
A third view of this theory, highly flattering but clearly inaccurate, is thatthere are already so many studies supporting its predictions that it can heregarded as well-established and verified; hence there is no need for furtherdevelopment and tests of its predictions. However, the large and growingnumber of studies in which some discrepancy has been found between thepredictions of optimal foraging theory and observations---especially in terms ofprecise quantitative predictions--mitigates strongly against this view.
A final view of this theory, to which I subscribe, is that it is still too early topronounce judgment and that further development and testing are warranted.Though the number of "optimal foraging studies" is already quite large (Figure1), none of them fulfills all of the criteria for evaluating this theory outlinedbelow. When those studies that come closest to satisfying all the criteria areexamined, some patterns emerge in terms of the degree of success of the theory,and these pattems suggest avenues for future investigation.
THE DEVELOPMENT OF THEORY
In 1977 it was reasonable to consider development (and tests) of optimalforaging theory in the following four roughly independent categories: (a) diet,(b) patch choice, (c) when to leave a patch; and (d) movement (e.g. 210). 7 years later, these categories are still useful and convenient, but several newdevelopments have occurred. The first of these is the addition of a fifthcategory, namely central place foraging (e.g. 179), which deals with situationsin which an animal has a central foraging base, such as a nest, from which itgoes on foraging bouts and to which it returns with at least some of what it hasgathered while foraging. In such situations, the choices of where to forage(patch choice), when to leave a patch, and what to eat (diet) are interrelated,and hence a separate category is required.
A second general development has been an increased realization of thepotential importance of the stochastic or variable nature of the world (e.g. 23,159, 174,195,253). From the outset of optimal foraging theory, it was realizedthat most, if not all, parameters--such as the amount of energy obtained froman individual of a particular prey type--are random variables (i.e. they takedifferent values with certain probabilities). In the initial models, this kind ofrandomness was adequately dealt with by the use of mean values for the variousparameters (e.g. 32). In some situations, however, the fitness of a foraging
animal is a function not only of the mean values of the various parameters butalso of their variances. In these situations, an animal should make its foragingdecisions on the basis of these variances as well as the means. Animals thatprefer lower variance, all else being equal, are termed "risk averse," whileanimals that prefer higher variance are "risk prone" (23).
The variable nature of the world also means that animals cannot be omni-scient and that they will have only an imperfect knowledge of what they mayencounter at a future time and place (199). In such situations, an animal shouldbe a statistician---collecting and storing information as it forages and using thisinformation to make foraging decisions. For example, there may be a positivecorrelation among the nectar volumes in flowers on the same plant, in whichcase an animal feeding on this nectar might base its decisions about when tomove to another plant on the amount of nectar obtained so far from the presentplant. Therefore, it should be less likely to change plants the more nectar it hasobtained from the flowers of the present plant.
It has also been recognized that the world is always changing and thatanimals should accordingly devote time to "sampling" their environment inorder to obtain necessary information for subsequent foraging decisions (245).For example, if the relative quality of two food patches switches from time totime, then an animal that can feed in either patch should always spend sometime in what at the time might be the worse patch so that it could make theappropriate adjustments when conditions change. At present, however, thereappears to have been no mathematical development of such sampling regimes.
A final general development has been the alteration of a number of theassumptions in the original foraging models. For example, in the originalmodel of optimal diet (see 210), it was assumed that animals recognize distinctfood types almost instantaneously. More recently, recognition time has beenincluded, which has altered the original predictions of the theory (63, 111).
1. Risk Aversion and Risk Proneness
In general, the fitness of a foraging animal will be some function of a number offoraging parameters such as ~the amounts of energy obtained from the variousfood types, the handling times involved, the rates of encounter, and so on. Ifthese foraging parameters are random variables, the average or expected fitnesswill usually depend not only on the mean values of the parameters but also ontheir variances. Optimal foraging theory began with two kinds of exception tothis rule.
The first kind of exception resulted from the initial assumption that thefitness of a foraging animal is a linear function of the net rate of food gain whileforaging. In algebraic terms, it was implicitly assumed (e.g. 210) that fitness = a + bR, where R is the net rate of food gain and a and b are constants. In thiscase, since E (F) = a + bE(R), any variance associated with R does not affect
the expected fitness, and the maximization of the expected fitness is equivalentto the maximization of the expected net rate of food gain. As the followingexample illustrates, however, the situation becomes quite different when fit-ness is assumed to be a nonlinear function of R (or its equivalent) (see also 214,252). Suppose that fitness F = 0 ifR < T (i.e. some threshold) and F (i.e. an arbitrary constant) ifR > T. Suppose also that R is a random variablewith probability distribution P(R = r) = P(r). Then the expected value of F issimply the probability that the animal meets it minimum food requirements(i.e. f~P(r)dr), which depends on the general shape of the probability distribu-tion for R. Suppose further that the variance of the probability distribution for R(but not the mean) depends on which of two (or more) foraging possibilities animal chooses and that the probability distributions of R are always symmet-ric. Then the choice that maximizes the expected fitness will depend onwhether the mean R (i.e. E(R)) is greater or less than the threshold T. If E(R) T, the animal should opt for the smaller variance (i. e. be risk averse); but if E(R)< T, the animal should be risk prone and preferentially select the highervariance. In other words, if an animal is likely to starve, its best chance forsurvival will come from the most variable situation (assuming no differences inmeans). On the other hand, if it can expect to exceed its food requirements, itshould prefer the lowest variance.
In general terms, the optimal response to variance in R (assuming a constantmean) depends on the shape of the relationship between fitness and R at thepoint where R equals its average or expected value. If the relationship is convex(i.e. bowed downwards), an animal should be risk prone; if it is concave (i.e.bowed upwards), an animal should be risk averse. If fitness is a sigmoidal (i.e.S-shaped) function of R and the frequency distributions of R are symmetric withthe same mean, then an animal should be risk averse or prone to the right or leftof the inflection point, respectively (from 23). If both the mean and variance R depend on an animal’s foraging decisions, the situation is more complicated(253).
The second kind of exception to the general rule that the expected fitness willdepend on the means and variances of the various foraging parameters arisesfrom the assumption that foraging events are independent of one another and ofprevious foraging decisions. Suppose, for example, that encounter rates withdifferent kinds of food types are not affected by any aspect of past history, suchas the food types previously encountered or consumed. Then the foragingprocess can be modeled as a renewal process, and the expected rate of food gaindepends only on the averages of the food gain from each food type, the handlingtime for each food type, and the time between encounters with food items (e.g.32, 33; see below). In this case, if fitness increases linearly with food gain, theoptimal diet will depend on these averages and not on any associated variances.On the other hand, if foraging events are influenced by past history, the
variances and covariances of any foraging parameters should affect the ex-pected rate of food gain and hence the optimal foraging strategy (e.g. 87, 174,202).
2. Optimal Diet
The original and simplest model of optimal diets was based on the followingassumptions: (a) The fitness of a forager increases linearly with the expectedrate of food intake, where food value is measured in calories or weight. Thecosts of handling and searching for food are assumed to be equal. (b) Each foodtype has an associated average food value and average handling time, both ofwhich are known to the forager. (c) The forager requires negligible time recognize food types and does not make any mistakes in doing so. (d) Handlingand searching for food are mutually exclusive. In other words, the foragerdecides whether or not to eat a particular food item at the instant it encountersthat item. This assumption was implicit during the early developments ofoptimal diet theory. (e) The rates of encounter with the different food types areconstant and independent of each other and of past history. (f) Handling timesand food yields are independent of past history. (g) Food items are encounteredsequentially rather than simultaneously. (h) Food items, if eaten, are totallyconsumed. (i) Dietary choices are constant. (j) The foraging time is compared with the time spent handling and searching for food. (k) There are constraints on total food volume or the rate of food intake.
Under these assumptions, foraging can be thought of as a renewal processwhere the renewal event is the recommencement of searching for a food itemand where the expected food gains and times taken between renewal events areindependent of past experience. Therefore, the optimal diet depends only onthe average values of the food gains and handling times for each food type andon the encounter rates with the different food types (32,253). It also follows(see 117 and references in 210) that in the optimal diet, a food type is eitheralways eaten or always ignored; the optimal diet is found by starting with thefood type having the highest average food gain to average handling time ratio(i.e. the highest rank) and adding food types with successively lower ratiosuntil R reaches a maximum. Consequently, the optimal diet in the present casehas the following testable properties (210):
1. Whether or not a food type should be eaten is independent of its abundanceand depends only on the absolute abundances of food types of higher rank.An animal should never specialize on a relatively low-ranked food typeregardless of its abundance (see also 68, 236).
2. As the abundance of a relatively high-ranked food type increases, lower-ranked types should eventually be dropped from the diet, starting with thelowest-ranked type included. So, increasing overall food abundance should
lead to greater specialization. Increasing abundance of relatively low-ranked food types may, however, have no effect on the optimal diet.
3. As mentioned above, a food type is either completely included in theoptimal diet or completely excluded from it--animals should never exhibit"partial preferences."
Many studies have attempted to test one or more of these three predictions(e.g. 51, 52, 59, 67, 78, 81, 84, 141, 241, 246, 248, 257, 266). A muchsmaller number have tried to determine the exact optimal diet using the abovemodel and to compare this diet with the observed one (65, 66, 75, 82, 83,136,163, 190, 263,278). (These studies will be evaluated below.) There are alsomany recent studies that examine the dietary preferences of animals and thefactors correlated with these preferences (e.g. 10, 18, 57, 60, 61,74, 112, 114,121, 122, 148, 151, 164, 220, 222, 223,225,255,260, 265,276). Furtherdevelopments in optimal diet theory have occurred through alterations to theassumptions in the above model.
DIFFERENTIAL COSTS OF HANDLING AND SEARCHING FOR FOOD The
simplest possible variation of the above model is to assume that fitness is anincreasing linear function of the net rate of food gain rather than the gross rate.The distinction is real so long as the costs of handling and searching for food aredifferent. This alteration produces potential differences in the exact optimaldiet, but it does not change the three more qualitative predictions outlinedabove (31).
NUTRIENT CONSTRAINTS Significant departures from the above optimal dietpredictions result from the simplest of models that include nutrient require-ments. Suppose, for example, that fitness is maximized when the rate of foodgain is maximized, subject to the constraint that the rate of gain of some nutrientmust at least equal some threshold value. In this case (see 188), "partialpreferences" should result (i.e. some food types, when encountered, should beeaten with probabilities between 0 and 1), and the preference for a particularfood type should depend not only on the abundances of more preferred foodtypes but also on its own abundance (and probably the abundances of lesspreferred food types). Similar predictions arise from other models that includenutrient requirements (153, 21 l, 212). After allowing for nutrient require-ments, increases in abundance of preferred food types should still lead togreater dietary specialization (from 188).
RECOGNITION TIME, MISIDENTIFICATION, AND CRYPTICITY The optimaldiet model can easily be modified to allow for the time required for recognitionof food types by adding recognition times to the handling times (107, 111).
When an animal encounters a food item, it must spend some time (which mayvary with the food type) to recognize the food type, and it may also incurhandling time if it chooses to eat the food item. This version of the optimal dietmodel does not predict partial preferences, but it does predict that whether ornot a particular food type is included in the diet should depend on its ownabundance (absolute and/or relative), as well as the abundances of morepreferred food types (63, 107, 111). In fact, a suboptimal food type may included in the optimal diet if it becomes abundant enough (111). Furthermore,food types may be ranked in terms of energy/handling time ratios, increasingthe abundance of preferred food types should lead to greater dietary specializa-tion, and food types should be added or deleted from the optimal diet in rankorder. Allowing for misidentifiction of food types leads to the same set ofpredictions. The same predictions also arise if recognition time is only requiredwhen an animal specializes (see 66).
Crypticity of food types can lead to yet another variation in the predictions ofthe optimal diet model (66, 111). Hughes (111) allowed for the possibility an animal might mistake inedible objects for an otherwise valuable food type,spending some time before discovering the error and rejecting the object. If thedensity of the more valuable food type were sufficiently low, the optimal dietmight consist of specialization on less valuable food types with total exclusionof the more valuable but cryptic one. Hence, with decreases in the abundance ofthe more valuable food type, the forager might first switch from specializing onthe more valuable food type to generalizing and then to specializing on the lessvaluable food type. Otherwise, this version of the optimal diet model producesthe same predictions as the model including recognition times and misidenti-fication.
THE DEPENDENCE OF DIET ON TIdE DEGREE OF SATIATION An animal’s dietmay not be constant but may depend on its degree of satiation. Suppose, forexample, that an animal requires only a small amount of food to reach "satia-tion" (i.e. the food level above which further increases do not enhance fitness)and that it has just encountered a low-value food item that would normally beexcluded from the diet. If fitness is maximized when the time required to reachsatiation is minimized, then the optimal strategy might be to consume the fooditem rather than to continue searching for a more preferred food type (221). other words, an animal might specialize until it has almost reached satiation andthen expand its diet. Richards (221) showed that for two prey types A and such diet expansion should only occur if the animal requires less than theamount of food in the higher ranked item to reach satiation. This variation in theoptimal diet model is therefore most applicable to animals that forage for fooditems that are large relative to total intake.
THE EFFECTS OF FORAGER EXPERIENCE ON HANDLING TIMES AND FOODYIELDS As the rate of encounter with a food type increases, the handling timefor that food type will probably decrease (43, 111, 157,281); handling timemay also decrease with increasing "hunger" (e.g. 129, 277).
Hughes (111) modified the original diet model by setting each handling timeequal to a function of the encounter rate. He then showed that partial prefer-ences should not develop; that whether or not a particular food type is includedin the optimal diet depends on its own abundance, as well as on the abundancesof more preferred food types: and that as changes in the abundance of foodtypes occur, the optimal diet could switch from specialization on one food typeto specialization on another, with or without generalization in between (111).McNair (157) obtained similar results.
Food yields per food item may also be influenced by an animal’s past diet(22, 183). Though this possibility apparently has not been modeled, it is clearthat allowing for it considerably complicates the determination of optimal dietsand probably requires knowledge of an animal’s past diet. Rates of encounterwith detected food items may also depend on past experience. Animals might,for example, develop "search images" whereby they are more (or less) likely detect food types they have encountered before (e.g. 157, 166, 184). Theformation of such search images may explain frequency-dependent dietaryselection (e.g. 73, 105, 167).
NONRANDOM ENCOUNTERS WITH FOOD ITEMS In the original optimal diet
model, it was assumed that encounter rates with food types are constant andindependent of past history and of each other. This type of food encounterpattern is termed random, and it produces a probability distribution (negativeexponential) of the time between an animal’s beginning to look for food and thenext food encounter independent of past history (e.g. 187, 219). This probabil-ity distribution still could depend on past history, however. Suppose, forexample, that there is a single food type, items of which "arrive" when ananimal is both handling and searching for food. Food items that arrive duringsearch time have been "encountered." Suppose further that the handling timefor a food item and the time interval between successive food arrivals areindependent random variables. The expected interval between the time whenthe animal finishes handling a food item and simultaneously recommencessearching and when it encounters the next food item will then depend on thelength of the handling time. This expected time interval would be very short if,for example, handling times and interarrival times were constant, with theformer slightly shorter than the latter.
In general, the relationship between past history and the time intervalbetween the point when an animal recommences searching and its next food
encounter will be complex. Continuing the above example, suppose thatsuccessive handling times and successive interarrival times are all independentof one another. Even then, it is possible that any number N of food items willarrive during the handling time for the last item. The probability densityfunction for the required time interval T will be a function of N and the handlingtime H. Hence, the expected time interval between the end of handling one fooditem and the end of handling the next (i.e. T + H) will depend on the probabilitydensity function of H and the conditional probability function of N given H = hand N = n. The situation becomes even more complicated if there are two ormore food types, each with its own associated probability distributions ofhandling times and interarrival times.
Krebs et al (136) considered the following special case. They supposed thatthere are two food types with constant values 2E and E, that the interarrival timet between successive food items is constant, that the handling times associatedwith each food type are random variables (H1, H2) such that 2E/E(HI) E/E(H2), and that food types occurred in one of the following three sequences,where L = large and S = small: L, S, L, S,--L,L,L,S,L,L,L,S,--L,S,S,L,S,S,--. They defined p as the probability that H2 < t and argued thatthe optimal strategy of the animal is to specialize on the larger food type ifp <1/2, independent of the sequence of food types. As Rechten et al (219) pointedout, however, this formulation is incorrect; the correct optimal strategyapparently has not been determined. They argue that if there is a single foodtype and if an animal recommences searching at random during any interarrivalinterval, then the expected time until the next food encounter is 0.5 [Ix + (or2 ÷IX)], where ix is the rate of food arrival and ~r2 is the variance of the interarrivaltime. But recommencement times are only likely to be distributed randomlyover interarrival times if the average handling times are much larger than theinteramval times. Consequently, Rechten et al’s deductions for the case of twofood types are unlikely to be correct in most cases.
McNair (156) considered a more general situation by assuming that thesearch time (after handling time has ended) required to encounter a food itemhas a probability distribution that depends on both the prey types last encoun-tered and the one that will be found next. In this case, prey types are notnecessarily added to the optimal diet in decreasing order of the energy tohandling time ratio; whether or not a food type is included in the optimal dietwill depend on its own abundance instead (156).
Pulliam (187) also examined nonrandom encounters with food items assuming that an animal encounters clumps of food; that every item in theseclumps can be consumed without further search time; and that during searchingtime, encounters with clumps occur at random. The qualitative predictions ofthe simple optimal diet model remain unchanged, but if overall food densities
are constant, increased clumping of food items tends to shift the optimal diettowards greater specialization (187).
DECLINING RATES OF FOOD ENCOUNTER If an animal forages amongstpatches and if the rate of encounter with a food type declines with the removalof that food type from a patch, then the optimal diet within a patch and theoptimal time of departure from it are interrelated. Under these circumstances,the optimal diet may depend on the time spent in a patch so far and on theabundances of nonpreferred food types, and it may consist of partial prefer-ences (99). The optimal diet may also depend on the average time spent in patch (99), just as foraging strategies may, in general, depend on the time scaleinvolved (see 48, 115,210, 224).
OTHER POSSIBLE VARIATIONS IN THE OPTIMAL DIET MODEL The optimaldiet model has not been modified to allow for simultaneous encounters withfood items. In such situations, however, partial preferences may be optimalbecause a food item will probably be eaten if it is encountered along with lesspreferred items or ignored if a more preferred item is present.
The optimal diet model might also be modified to allow for nonlinearrelationships between fitness and the expected rate of food intake (i.e. toinclude risk) or to allow fitness to be affected by factors other than food (e.g.177). Some theoretical treatments of diets have not been included in the abovediscussion (e.g. 17, 48, 89, 181,249-251,258).
SUMMARY OF PREDICTIONS The qualitative predictions that arise from thesimple optimal diet model break down under relatively straightforward andrealistic variations to the model. Partial rather than absolute preferences areexpected if fitness depends on more than one food value (e.g. energy andnutrients or the energy intake mean and variance). Preferences for food typesthat depend on the abundance of each food type rather than on the abundancesof better food types should develop if fitness depends on more than one foodvalue, if recognition of food types requires time or is imprecise, if food typesare cryptic, or if handling times or food yields depend on experience. In the lasttwo situations, the optimal diet may also involve specialization on an inherentlyinferior food type or switching between specialized diets. This breakdown ofthe simple qualitative predictions means that much care should be exercised intesting them.
3. Optimal Patch Choice
Patch choice is analogous to dietary choice and can be modeled in exactly thesame manner if two conditions are met: first, food patches must always be
encountered before being accepted or rejected and second, the within-patchfood yield and time spent must be independent of which patch types areaccepted and of the overall rate of food gain. There are no obvious examplesthat satisfy all of these assumptions, however, so it is not surprising thatapparently no one has focused on this kind of patch choice.
In general, one of the above assumptions will not be met. The variouspossible departures from these assumptions determine an array of differentpatch-choice situations that I shall consider below.
The simplest kind of patch-choice situation involves the following assump-tions: (a) the locations and "qualities" of all patches are known to the foraginganimal; (b) these locations and qualities are constant; (c) there is no resourcedepletion during the time the animal spends in a patch; and (d) fitness is increasing linear function of the animal’s net rate of food gain. Under the~eassumptions, the animal’s optimal strategy is to spend all its time in the mostconveniently located patch with the greatest net rate of food gain. A variety ofpatch-choice situations can be obtained by altering one or another of the above
assumptions as follows:
THE CURRENCY OF FITNESS Fitness may be a nonlinear function of the netrate of food gain or may depend on the rates of both nutrient and food gains. If itis not a linear function of the net rate of food gain, then the expected fitness for aparticular strategy will depend on the mean, variance, and possibly the generalshape of the frequency distribution of that net rate. Suppose, for example, thatthe expected fitness is given by E(F) = aE(R) - b V(R), where V(R) variance of R and a and b are positive constants (i.e. an animal is risk averse)(e.g. 214,215). Suppose also that there are two patch types, that the amount food obtained during time ti in patch type i has mean Ri ti and variance Vi ti (i.e.each time period is independent of other time periods), that an animal spends proportion p of total time T in patch 1, and that the costs of travel betweenpatches are negligible. Then the animal’s overall rate of food gain will havemean E(R) pR1 + (1-- p)R2 andvari ance V(R)= (pVI+ (1 -p)V2)/T, andthe expected fitness E(F) will be maximized with respect top whenp = 1 or depending on whether aT(R~ - R2) is greater than or less than b(V~-V2). Inother words, the animal should allocate all of its time to one or another patchtype depending on the difference in means relative to the difference in variancesbetween the two patch types [i.e. (R~-R~)/(V~-V2)] and the relative import-ance in determining fitness of the mean and variance of the total amount of foodobtained during the foraging time T (i.e. aT~b). If one of the patch types hasboth the highest R and the lowest V, then the animal should spend all its time ina patch of that type. If the expected fitness is not a linear function of the meanand variance of the rate of food gain, however, the optimal strategy may consistof allocating time to both patches.
An identical situation prevails if fitness depends on the rate of intake of twoor more food values, such as food weight and the amount of some nutrient. Iffitness is a linear function of the rate of intake of food and a nutrient, then theoptimal strategy will be to allocate all available time to one patch type, theidentity of which will depend on the quantitative details of the fitness functionand the available patch types. If the fitness function is nonlinear, then ali~cat-ing time to more than one patch may be optimal. Patch choice may also affectother aspects of fitness such as predation risk to a forager (e.g. 91, 100, 161,163,238).
IMPERFECT KNOWLEDGE ABOUT THE QUALITY OF PATCHES If an animaldoes not know the quality of the available patch types, then its optimalallocation of time should depend on how much foraging time remains, on itsexperience so far in each patch type, and on any a priori knowledge about thekinds of patches available (138). If a lot of foraging time remains, an animalshould devote some time to sampling the available patch types before decidinghow to allocate the remaining time. If its experience indicates that one patchtype is much worse than the others, the animal should stop foraging in thatpatch type. If the animal knows the array of available patch qualities but notwhich ones are which, it should spend less time sampling that if it knows onlythat patch quality varies.
There is no comprehensive theoretical treatment of this foraging problem.Krebs et al (138), however, have considered the following special case for twopatches: (a) In each patch, an animal’s foraging consists of trials for which theprobability of obtaining a food reward is a constant but unknown Pi. In theirexamples, P1 and P2 are (0.50, 0.00), (0.40, 0.10), (0.35, 0.15), and 0.20). (b) The P~ each have an a priori beta probability distribution withparameters (eta, 13;) = (0, 0), (0, 2), or (2, 0). This distribution has the desirableproperty that the a posteriori probability distribution of Pi after n,. trials with rlsuccesses in patch i also has a beta distribution with new parameters (Ori -I- ri, [~i
+ ni - ri) (138). (c) The time and effort required by an animal to move betweenthe two patches is negligible. (d) An animal samples each of the two patchesequally and then exploits just one of them. (e) The total number of foragingtrials is 2N of which M are spent sampling the two patches. (f) An animal adoptsthe value of M that maximizes the expected number of food rewards during the2N foraging trials. Krebs et al (138) then derived the optimum M. For eachcombination a l, a2, n, where n is the number of foraging trials carried out so farin each patch and ai is the number of food rewards obtained so far in each patch,they determined whether the expected future gain was greater if the animalallocated the next two trials to sampling each patch and then specialized on theapparent better patch (Es) or if it specialized immediately (Ed). They workedbackwards in n from n=N and found that, if only two trials remained, spe-
cialization was better than continued sampling for all combinations of al anda2. They also found that the.higher the value of n, the more "consistentlyhigher" (138) Ed was than Es (in, presumably, the proportion of a~, a2combinations).
It is not clear from their paper, however, how they subsequently derived theoptimal M. One possible way to determine it would be to estimate the probabil-ity associated with each combination of a~, a2, and n, use these probabilities tocalculate the expected difference between Ed and Es for each n, and set M equalto the n at which this expected difference first becomes negative as n decreasesfrom N. Krebs et al reported that the optimum M decreases as the differencebetween P~ and P2 increases. They also found that for a given a~, a2 combina-tion, the likelihood that Ed would exceed Es decreases as the total number oftrials (2N) increases. That is, sampling should last longer for larger N’s.
TEMPORAL VARIATION IN PATCH QUALITY If the qualities of the availablepatches vary over time, the optimal strategy may not be to allocate all of theavailable time to one patch, but it will sometimes include time spent samplingthe various patches (245). However, no theoretical model of this situation hasapparently been developed.
4. Optimal Patch Departure Rules
As an animal spends time in a food patch, it may obtain information about thequality of the patch while depleting the food available in it. An animal maytherefore leave a patch because of information gained or resource depletion orboth. The failure to appreciate fully these dual reasons for patch departure hasresulted in some confusion concerning the development and testing of predic-tions concerning rules of patch departure.
Charnov (33) developed the first model of patch departure, and he incorpo-rated seven assumptions: (a) fitness increases linearly with the expected net rateof energy intake; (b) the expected net energy gain from a patch gi(t) depends onthe patch type i and is a continuous function of amount of time t allocated to thepatch, (c) the slope of g~ (t) decreases with increasing t because of resourcedepletion; (d) the foraging animal "knows" the quality of each patch (i.e. function gi(t) for each i); (e) the average travel time between patches (tb) known to the animal; b0 the proportion of visited patches of type i (Pi), and theenergy costs per unit time in traveling between patches (eb) and while searchingwithin a patch (e,~) are constant and known to the forager; (g) an animal bases decision to depart from a patch only on the patch type and the amount of timespent in the patch. From these assumptions, it follows that the foraging processcan once again be modeled as a renewal process (33, 34) and that the foragershould allocate time Ti to each patch of type i such that the instantaneous or"marginal" rate of net energy gain (i.e. Og~(t)/Ot, when t = T;) has dropped by
time Ti to the overall rate for the habitat (33). Hence, the instantaneous rates net energy gain at the times of departure should be equal for each patch type andshould be higher in habitats whose overall net rate of energy intake is higher(33). The times allocated to patches should therefore be greater for consistentlybetter patches but should decrease as habitat quality increases (33). Essentiallythe same theory and predictions have been derived by Cook & Hubbard (42)and Parker & Stuart (182). This theory has been modified in the followingways:
DIFFERENT POSSIBLE DEPARTURE RULES An animal’s departure may de-pend on the amount of food obtained in a patch rather than on the length of timespent there. Assuming that food occurs in discrete tbod items, the amount offood obtained in a patch is a discrete rather than a continuous variable. FromCharnov’s theoretical work (33), it follows that in such a situation an animalshould leave a patch as soon as it obtains an amount of food such that themarginal rate of energy gain from the amount of food consumed equals theoverall rate in the habitat. So, the interval between the time the last food itemwas obtained in a patch and departure from that patch [i.e. the "giving-uptimes" (139)] should be zero.
It might also be assumed in the case of discrete food items that an animal’sdeparture from a patch depends only on a giving-up time for each patch type(139). The expected marginal rate of energy gain in a patch should then dependon both the patch type and the time since the last food item. Krebs et al (139)predicted that giving-up times should be the same in different patch typeswithin a habitat. This prediction should only be correct in the above model,however, if the departure decisions and the expected marginal rates of energygain in the patches depend solely on the giving-up times. In general, giving-uptimes should be longer in patches that are consistently better than others (158).
Iwasa et al (113) have compared the above three departure rules, involvingtime per patch, food per patch, and giving-up time, respectively, for the casewhen identical food items are encountered at random within patches that allhave the same initial number of food items. They also assume that the foodhandling times are negligible. When the maximum rates of food gain aredetermined for each departure rule, the optimized fixed-number (i.e. the fixedamount of food) strategy is best, followed by the fixed-time strategy and thenby the fixed giving-up-time strategy (113). This conclusion seems reasonable,since the instantaneous rate of food gain should be most directly affected by thenumber of food items removed (or remaining), less directly by the elapsedtime, and least directly by the time since the last food item was consumed. Ifpatch quality varies but the animal knows the quality of each patch beforeentering it and is able to adopt a different number, time, or giving-up-timethreshold for each patch type, then the three optimal strategies should yield the
same result. McNair (158) found, however, that it is possible to constructsituations in which the fixed giving-up-time strategy is better than the fixed-time strategy.
THE DEPENDENCE OF FITNESS ON THE MEAN AND VARIANCE OF ENERGYINTAKE If fitness is a nonlinear function of an animal’s net rate of energyintake and if some of the parameters that determine this rate are randomvariables, then the net rate of energy intake will also be a random variable; andthe expected fitness will be a function of its mean, variance, and possibly thegeneral shape of its frequency distribution (see above). Stephens & Chamov(253) considered this possibility for the above model of patch departure. Theyassumed that the expected fitness is maximized when the probability that ananimal obtains less than some threshold amount of food is minimized; that all ofthe parameters in the model are constants, except travel time between patches;that there is one patch type; and that encounters with patches occur at random sothat between-patch travel time has a mean of 1/q and a variance of 1/q2. Thenthey used renewal theory (see 47) to derive the mean (~) and variance (~r~) the energy gain (eT) during a foraging period of length 7. They had previouslyshown that if’r is large relative to the time between foraging decisions, then eTwill be approximately normally distributed; also minimizing the probability ofstarvation will be equivalent to maximizing the ratio (R- Ix~)/~r~, where R is thenet energy requirement. Finally, they contrasted the optimal time spent in eachpatch if the probability of starvation is minimized (tl) with that if the mean rateof energy gain is maximized (t2). They found that there is a critical level of (R*) such that t~ is greater or less than t2 if R is less or greater than R*,respectively (253).
UNKNOWN PATCH QUALITY The situation is rather different if the foraginganimal does not know the qualities of patches before it enters and samplesthem. The animal may leave a patch long before there has been any resourcedepletion if the initial sampling of the patch suggests that it is inferior to others.To develop models of optimal patch departure, it is therefore necessary toconsider the sampling procedures that animals might adopt. Sampling by aforaging animal may be defined as acquisition and storage of information that iscorrelated with future foraging success. It should be widespread, since fooddensities should be correlated both temporally and spatially.
The array of possible kinds of information that an animal may usefullyacquire while foraging is large. For example, an animal feeding on discretefood items may store the magnitudes of all time intervals between successivefood items, the time intervals between arrival in a patch and the first encounterwith a food item, and the time since the last food item was encountered, and itmay also store the food values of all food items encountered. This information
may be correlated with the value of and time to the next food item. Assumptionsabout the level of information foraging animals possess are critical in thedevelopment of models of optimal patch departure. Since an animal’s ability tostore information may decay over time, assumptions concerning an animal’smemory are also important.
The range of ways in which animals might use their information is also large.It is usually assumed that foraging animals are constantly making decisionsbased on the values of a number of parameters (e.g. 159, 199). These rela-tionships between the parameters and the decisions are termed decision rules(e.g. 199). The general aim of optimal foraging models is to determine theoptimal decision rules.
Several distinct optimal patch departure models have been developed andthese are considered separately below.
ANIMALS FORAGING FOR NECTAR IN FLOWER CLUSTERS For an animal
that is foraging for nectar, any cluster of flowers such as an inflorescence or aplant may be thought of as a patch. Since these animals do not remainindefinitely in a single patch, they must be making decisions about whether tostay in or leave the patch. Such decisions could be made on a continuous basis,but it seems more likely that they are made just after the animal has consumedthe nectar in a flower. As an animal visits more flowers relative to the numberavailable in the patch, the probability of revisiting flowers should increase.There should also be a positive correlation between the nectar volume in anytwo flowers within the same cluster because these flowers are likely to havebeen visited previously at about the same time, and they may have relativelysimilar rates of nectar production. Consequently, the amount of nectar that theanimal can expect at the next flower on the present cluster should rise withincreases in either the amount of nectar obtained at the present flower or thenumber of flowers available in the cluster, and it should decrease with increasesin the number of flowers within the cluster visited so far.
With this view of foraging by a nectarivore in mind, I considered thefollowing model for departure from a flower cluster (194):
1. Fitness is assumed to increase linearly with the overall net rate of energygain.
2. The probability p that the next flower visited by the animal within thepresent flower cluster is a revisit increases as the number of flowers alreadyvisited within the cluster (nv) increases and as the number of availableflowers (na) decreases.
3. The nectar volume obtained by the animal at the present flower is positivelycorrelated with the nectar in the next flower that the animal would visit if itcontinued to forage within the present flower cluster.
4. After consuming the nectar in a flower, the animal decides whether to visitanother flower in the same flower cluster or to leave and visit a flower onanother cluster.
5. The animal leaves a cluster if the amount of nectar obtained from the presentflower (or the average nectar obtained from the last m flowers) is less than threshold (T), which depends on nv and n~. If the animal is foragingoptimally, it should be more likely to visit another flower within the presentcluster the greater its expected nectar at the next flower within that cluster is.Consequently, the optimal threshold T should increase with either anincrease in nv or a decrease in na.
6. The time and energetic costs incurred by an animal in moving betweenflowers within a cluster, moving between clusters, or removing nectar froma flower are all constant.
7. The animal obtains little or no nectar at a revisited flower.8. The animal is assumed to know the above relationships and parameters and
the overall rate of energy gain in the habitat.
It follows from points 2, 3, and 7 above that the probability density functionfor the amount of nectar (P~n) in the next flower that the animal would visit if continued to forage within the present cluster is given by f(~xnltxp,nv,n,) f(Ix~,p~p,n~,na)=f, where I.zp is the amount of nectar obtained at the presentflower (or the mean amount obtained at the last m flowers). If E~ E(p~nl~p,nv,n~) = f~nfd~ is the expected value of ~, then it would also be thecase that ~En/O~zp>O, OEn/Onv<O, and OE~/Ona>O. In order to find the set ofoptimal thresholds for different numbers of visited flowers and availableflowers, it is apparently necessary to carry out computer simulations of theabove foraging model (e.g. 202). Three solutions have been deduced withoutproof, however, from the "marginal value theorem" that Charnov (33) de-veloped, which was outlined above for situations in which patch qualities areknown (103, 195; J. M. Pleasants, personal communication).
In all cases, the optimal threshold T for a given nv and na is assumed todepend on the animal’s overall rate of energy gain in the habitat (R) and thetimes and costs required to move between flowers within a cluster (tf and cftf)and to handle a flower and remove its nectar contents (th and chth). The threeproposed solutions for the optimal T are given by the following equations:
E(p.nll~p >~ T) - (cftf + %t~) = R(tf + th),
i.e. the expected rate of energy gain obtained by moving to the next flower onthe present cluster, given that the animal chooses to do so, is equal to the overallrate of energy gain in the habitat (195). This statement is not equivalent, as
Hodges (103) implied, to the prediction that an animal should leave a plantwhenever the expected rate of energy gain obtained by probing the next flowerwithin the present cluster is less than the overall rate in the habitat.
E(IX,IIXp = T) - (cftf + Ch/h) "~ R(tf + th),
i.e. the threshold T is such that if the animal obtains exactly that amount ofnectar at the present flower and chooses to visit another flower on the presentflower cluster, its expected rate of energy gain for so doing is equal to theoverall rate of energy gain in the habitat (103;. J. M. Pleasants, personalcommunication).
where t~. and t~.c¢ are the time and cost required to move between flowers ondifferent flower clusters and I~ is the expected nectar at the first flower onanother cluster (103). Hodges (103) allowed th to depend on the amount ofnectar energy obtained. He justified only considering the first flower on anotherflower cluster on the basis of his observations that the animals he studied(bumblebees) visited one flower per flower cluster most of the time.
Though each of these proposed foraging strategies will produce one desiredresult---i.e, the likelihood of departure from a flower cluster will decrease withincreases in the amount of nectar obtained at the present flower---none is thecorrect optimal strategy (202). Nor do we know the extent to which theseproposed strategies tend to be good approximations of the correct one.
Computer simulations indicate that the optimal thresholds will usually risewith increases in the numbers of visited flowers and fall with increases in thenumber of available flowers, even if there is no immediate risk of revisiting aflower (202). In other words, if a flower cluster still has many unvisitedflowers, the animal should tend to continue sampling the cluster before reject-ing it. This finding is analogous to the sampling situation Krebs et al (138)consider.
FORAGING IN PATCHES FOR RANDOMLY ENCOUNTERED PREY
ITEMS Oaten (174) considered the optimal patch departure rule in the follow-ing situation: (a) Fitness increases linearly with the expected rate of foodintake. (b) Food consists of prey items that are all identical and that occur patches that differ in terms of the initial number of prey present. Food items arenot replaced as they are eaten. (c) The proportion Pk of patches encountered the animal that initially contain k prey is known to the animal. (d) The animalalso knows the probability density function f(t~ ..... (i, k) for the time between
arrival in a patch and the first food encounter (tj) and the time ti between the(i-1)th and ith food encounter, given that the patch initially contains k fooditems and that the animal obtained j food items from the patch. (e) The timerequired for the animal to travel between patches has an expected value that isknown to the animal. (j) The animal’s decision concerning whether or not stay in its present patch depends on the time intervals ti ..... ,tj up to the lastfood item obtained and the time vj+ ~ since the last food item was encountered.More precisely, it is assumed that after j food items the animal employs athreshold Vj (i.e. the giving-up time) that is a function of t~ ...... t~ such that and when vj.+ ~ = V~, the animal leaves its present patch. (g) The handling timesof food items are negligible.
Based on these assumptions, Oaten (174) derived implicit equations for and showed that an optimally foraging animal will tend to stay longer in a patchthan an animal that leaves when its instantaneous probability of capture per unittime has fallen to the overall rate in the habitat. Continued foraging in the patchprovides not only food but valuable information as well (159, 174).
Green (87) modified Oaten’s model by adopting the following assumptions:(a) Each patch consists of n bits (i.e. places where food items may be found).(b) The animal takes unit time to search each bit. (c) Within each patch, number of bits containing one food item follows a binomial distribution withparameters n and p. Remaining bits contain no food. The value of p thendetermines the patch type. (d) In terms of patch quality, the animal knows onlythat p is distributed over patches with a beta distribution whose parameters areot and 13. (e) As the animal searches a patch, the probability that it will find foodin the next bit does not change. (f) The animal will leave its present patch if has searched tk bits and found only k food items.
Green (87) then compared the rate of food gain for the optimal tk’s for threealternative cases: (a) The naive strategy--The animal is assumed to learnnothing about the quality of its present patch from its experience in it; theoptimal strategy is to search all n bits in each patch visited. (b) The omniscientstrategy--The animal is assumed to know the qualities of each patch beforevisiting them. Therefore, the animal should thoroughly search the best patchesand ignore the others (as in the optimal diet model above). (c) The instan-taneous rate strategy--The animal is assumed to leave a patch when theprobability of finding a prey in the next bit falls below some critical value. Inthis case, the optimal critical value is typically lower than the overall rate offood gain in the habitat. An optimal forager in Green’s model should thereforetend to stay longer in each patch than an animal that adopts the best instan-taneous rate strategy. Green (87) found that the omniscient strategy is the best it can be used, the naive strategy is the worst, and for the parameter values heconsidered, the instantaneous rate strategy is almost as good as the strateagy ofemploying the optimal t~’s.
Iwasa et al (113) also developed a modified version of Oaten’ s (174) model.They made the following additional assumptions: (a) Within each patch en-counters with food items occur at random and (b) The instantaneous rate of foodencounter in a patch is proportional to the number of food items remaining inthe patch. They then showed that the expected number of food items remainingin a patch, given that n have been eaten in time t (including any time since lastfood item), is a function of the pi’s (i.e. the distribution of patch quality) and and n, but it does not also depend on the tt, ¯ ̄ ., tj and v(/+ 1~ of Oaten’s model.The optimal strategy is therefore to leave a patch whenever t and n are such thatthis expected number of remaining food items is less than some threshold (n,)(113). Iwasa et al also showed that this optimal departure rule becomes fixed-number (per patch) strategy when all patches have the same knownnumber of food items and a fixed-time strategy when the number of food itemsper patch has a Poisson distribution. It is not clear whether a fixed-number, afixed-time, or a fixed giving-up-time strategy generally would, when opti-mized, yield the highest rate of food gain in the present model. They suggested,however, that the fixed giving-up-time strategy is the best of the three onlywhen the distribution of food is highly contagious.
Stewart-Oaten (254) modified his earlier model (174) in the same manner Iwasa et al (113) and showed that if the number of food items per patch has Poisson distribution, then the optimal strategy is to "leave after constant timeT" (i.e. a fixed-time strategy). He also demonstrated that in this situation, thefollowing three strategies are all equivalent to the optimal strategy: (a) employa department rule such that the average instantaneous capture rate at the time ofdeparture from a patch is equal to the overall capture rate; (b) leave a patchwhen the instantaneous probability of capture per unit time is equal to theoverall capture rate; and (c) leave when this instantaneous capture probability equal to an optimum threshold. McNamara (159) also developed two specialcases of Oaten’s foraging situation model (174).
FORAGING IN PATCHES THAT VARY OVER TIME If patch quality varies over
time, then an animal may sometimes do better if it moves to a new patch than ifit remains where it is. The optimal strategy will be determined by the frequencyand magnitude of potential changes in patch quality and the extent to whichpatch quality tends to remain constant over time. For example, if patch qualitymay change at time ti and if patch qualities at time tn+ i are likely to be the sameas at time tn, then an animal should remain in its present patch at time tn if it is ina high quality patch and move to a new patch if it is in a low quality patch. Thisstrategy would be called "win-stay" (see 288). In contrast, if patch qualitiestend to reverse themselves every time they change, an animal should adopt a"win-leave" strategy (see 288) and leave its patch if it was of high qualityduring the last time interval.
Janetos (119) developed a model of this foraging situation based on thefollowing assumptions: (a) Fitness increases linearly with the expected rate food gain. (b) There are two kinds of patches, good and bad, which may changein quality after each day. Good and bad patches change quality with probabili-ties a and b respectively. (c) The daily food gains in good and bad patches are and B respectively. (d) The cost of changing patches is C (measured in foodunits). Janetos considered the two possible strategies: (a) sit-and-wait, wherethe animal never moves from its present patch, and (b) active forager (win-stay), where the animal remains in its present patch for another day if its has justhad a good day and changes patches otherwise. Two other possible strategiesthat Janetos does not consider are: (c) active forager (win-shift), where animal changes patches if it just had a good day and otherwise remains in itspresent patch for another day and (d) active forager (always shift), where animal changes patches at the end of every day. The average daily food gainfrom strategy (d) (i.e. (bG+aB-C)/(a+b)) is always less than that fromstrategy (a) (i.e. (bG+aB)/(a+b) (see 119). Consequently, we need not con-sider strategy (d) further. Strategy (b) is better than strategy (a) (G-B)~C>(a+b)2/b(a+b-1). Similarly, strategy (c) is better than strategy (a) (G-B)/C>(a+b)Z/a(a+b- 1). Since 1 -a-b must be either positive or nega-tive and since (G-B)/C is positive, it follows that the optimal strategy is either(b) or (c). Using Janetos’s methods, (119) it can easily be shown that (a÷b)<l, strategy (b) is better than strategy (c) as long [(G-B)~C>(a-b)(a+b)2/ab[l-(a+b)2]; and if (a+b)>l, (b) is better if the reverseinequality holds. Consequently, if a + b< 1 and a<b, then strategy (b) is alwaysoptimal; whereas ifa+b> 1 and a>b, then strategy (c) is always optimal. In theother cases, the optimal strategy depends on the difference between good andbad patches relative to the cost of moving between patches and on the magni-tudes of a and b. Janetos & Cole (120) consider two other possible strategies.
5. Optimal Movements
Many animals undergo movement relative to the medium in which they areforaging. This movement may result from activities of the foraging animal, asin the case of a mobile animal that walks, flies, swims, etc., while in search offood or of a stationary feeder that exerts some control over the rate at which itsforaging medium passes by (e.g. a suspension feeder that controls the rate ofmovement of water through its filtering apparatus). Movement may also occurindependently of an animal’s behavior as, for example, in the case of stream-living animals that rely on the movement of the water to bring them food. Thissection will deal with the active movement of foraging animals.
THE PATTERN OF MOVEMENT As animals move from one place to anotherwhile foraging they exhibit various movement patterns (see references in 209,
210). If, for example, the movements of an animal are divided (naturally artificially) into linear segments, then there may be some tendency for thesegment lengths and angular changes in direction to assume particular values.There may also be some relationship between the present rate of food intake andthe size of the linear segments and direction changes. Many animals, forexample, exhibit "area-restricted searching" whereby they alter their move-ments in response to food so that they tend to remain in the local area.
Two models dealing with such movement patterns have been developed (see36, 193, 194). One assumes that the animal does not know where food mayoccur (36, 193), while the other assumes that the animal knows the exactlocations of a number of "resource points" that may contain food (194). Bothmodels assume that fitness increases linearly with the rate of food gain.
In the first model, the foraging animal is visualized as moving among pointson a uniform bounded grid in the following manner (193): (a) Movements only occur between a point in the grid and one of its four nearest neighbours(Hence movements are of constant length). (b) The direction of a movementdepends only on the direction of the previous movement. (c) The animal turnsright, continues straight ahead, turns left, or goes backwards with probabilitiesPr, P~, Pt, and Pb respectively. These probabilities are obtained by discreteapproximation to a normal distribution that has a mean angle 0° and is truncatedat +180° and -180°. The probabilities are then uniquely determined byPr--Pb, which in this case is the directionality of movement (see 146). (d) animal obtains no food at revisited grid points. The optimal directionalityminimizes path recrossing. (36, 193). Using computer simulation, I showedthat this optimal directionality increases with increases in the size of the gridand with decreases in the length of the foraging bout and that it depends on thebehavior of the animal at the grid boundary (193). For realistic boundarybehavior and a wide range of grid sizes and bout lengths, the model predictsdirectionalities between 0.8 and 1.0 (i.e. movements with relatively littleturning) (1930).
In the second model, the movements are visualized as follows (194): (i) occurs at "resource points," which are randomly distributed but the locations ofwhich are known to (e.g. can be seen by) the foraging animal. (b) The animalcannot tell how much food is available at a resource point before it gets there.(c) The animal chooses the next resource point just before leaving the presentone. (d) The animal moves linearly between resource points. (e) The animalchooses the next resource point by aiming its departure in some directionrelative to the direction of the last movement, scanning a sector of angularwidth 2w about this aimed direction and then choosing the closest resourcepoint. Heinrich (98) pointed out, however, that animals may not always choosethe closest detected resource point. 0O The difference between the arrival andaimed departure directions and the width of the scanning sector may depend on
the direction of previous movement or on the amount of food obtained at thepresent resource point. In other words, the animal is able to "remember" certaininformation. These relationships are adjusted in order to maximize fitness. (g)Food is renewed at a constant, relatively low rate. (h) There is a positivecorrelation between the amounts of food in neighboring resource points. Thecloser the points are, the higher this correlation will be. I have argued that thiscorrelation pattern arises from the tendency of the animal (or other animals) move between closely tieighboring resource points, thereby creating similar-ities among neighboring points in terms of the time since the last visit (194). (i)The area containing the resource points is large, so that encounters with itsboundaries can be ignored.
I went on to deduce that the optimal rule of movement will have thefollowing properties (194): (a) The mean angular change in direction should 0°. (b) The animal should alternate right and left hand turns. (c) The width the scanning sector should increase as the amount of food obtained at a resourcepoint increases. Consequently, the variance of the angular change in directionshould increase simultaneously (i.e. the directionality should decrease). (d)The frequency distribution of the distances moved between resource pointsshould resemble a negative geometric distribution. If the animal cannot obtainor store some of the information it is assumed to know in the model, then thesepredictions will have to be modified accordingly (194). In addition, as Zimmer-mann (296) pointed out, the optimal directionality should decrease if the rate food renewal is rapid or if the animal removes only a fraction of the availablefood during a visit to a resource point. In some circumstances, random move-ment (i.e. no directionality) could be expected. The exact optimal rule movement has not been determined for the present model (209). Such exercise would almost certainly require a large-scale computer simulation(209).
THE SPEED OF MOVEMENT OF MOBILE ANIMALS As foraging animals travelfaster, the rates of energy expenditure and of encounters with the locations offood items should-increase (e.g. 77, 171, 204, 273, 275). If food items arecryptic, however, the probability that encountered food items will actually bedetected should decrease at the same time. Gendron & Staddon (77) developeda model incorporating all of these potential consequences of increasing speed,which is based on the following assumptions: (a) Fitness increases linearly withthe net rate of energy gain. (b) Searching for and handling food items aremutually exclusive activities. (c) There is only one food type. (d) The rate encounter with food items is S ×D, where D is the density of food items and S isthe search rate (measured by the area searched per unit time). (e) The probabil-ity Pd that the animal detects an encountered food item is: Pd = [ I -(S/M)k]~/
k~; where M is the search rate at which no food items are detected and k is aconspicuousness index. 0c) The rate of energetic expenditure while searching
increases linearly with the search rate. (g) The rate of energetic expenditurewhile handling food items is negligible. (h) The animal adopts the search ratethat maximizes the net rate of energy gain.
Gendron & Staddon discovered that the optimal search rate could only befound using computer simulations based on particular parameter values butnoted that it is lower than the rate that maximizes the gross rate of energy gain.They also modified the above model to allow for two food types that are eatenwhenever encountered and detected and found that the optimal search rate inthis case depends on the density and crypticity of each food type, as well as ontheir energetic values and handling times.
I developed a simpler model by omitting any consideration of crypticity andimplicitly assuming that all encountered food items are detected (204). Theoptimal search rate is then the maximum speed that the animal can sustain overthe search period. If the energetic cost of searching at this search rate increasesmore rapidly than a linear function would, however, the optimal search rate inmy model may be some intermediate speed.
FILTERING RATE BY STATIONARY SUSPENSION FEEDERS For animals thatobtain their food by filtering water (or air), increases in the filtering rate shouldbe accompanied by increases in the rate of ingestion of food particles and in theenergetic costs of filtering and by a decrease in the energy absorption efficiencyfor each particle ingested. Three similar models of this foraging situation havebeen developed (142, 144,256). All of them incorporate the following assump-tions: (a) Fitness increases linearly with the net rate of energy gain. (b) The of food (energy) ingestion is proportional to the filtering rate F (measured volume per unit time). (c) The energetic cost of filtering, EF, is: EF = bFx,
where b andx are constants (x= 3 in 142;x= 2 in 144). (d) The animal adopts filtering rate that maximizes the net rate of energy gain. The three modelsbasically differ only in their assumptions concerning absorption efficiency.Lam & Frost (142) assumed simply that energy gain is equal to the amount energy ingested (i.e. the absorption efficiency is 100%) and that energetic costsincrease with increasing body length. They derived the optimal filtering rateand showed that it increases with increasing particle density or decreasing bodylength. Lehman (144), in contrast, assumed that there is a constant number N food particles in the animal’s gut. Consequently, the time t that each particlespends in the gut is given by N = FDt, where D is the particle density. He alsoassumed that the gut has a maximum volume and that the amount of energyobtained per ingested particle increases with increasing passage time (t) in thegut. Therefore, the animal should maintain a full gut, and the optimal filteringrate is found by plotting the net rate of energy gain against the filtering rate afterassigning particular values to the various parameters. Finally, Taghon (256)assumed that the fraction of energy obtained from ingested particles decreaseswith increases in the filtering or ingestion rates. He calculated the optimal
filtering rate for constant absorption efficiency and for absorption efficienciesthat decline linearly or exponentially with rising filtering rates. He concludedthat in all cases, the optimal filtering rate increases with increasing energyvalue per food particle.
FORAGING MODE Alternate foraging modes have received little attention todate (6, 170, 172). Norberg (170) considered two alternate modes, one which resulted in a higher rate of energy gain at a given food density and in ahigher rate of energy expenditure than the other. He showed that the higher thefood density, the more likely it is that the more efficient, but more expensive,strategy will lead to a higher net rate of energy gain (170). He also consideredthe special case of birds that climb or hop vertically in trees while searching forfood and then fly between trees (172). He assumed that the birds could hop each tree and fly to the next tree using gliding as much as possible (Strategy A),hop down each tree and fly up to the top of the next (Strategy B), or alternatehopping up and down each tree and fly horizontally between trees (Strategy C).He showed that Strategy B is never optimal; Strategy C produces a better netrate of energy gain than Strategy A if and only if the distance betweensuccessively visited trees is less than about half the distance coverable ingliding flight, with height loss equal to the foraging height zone within eachtree (172).
6. Optimal Central Place Foraging
For a central place forager, one cannot consider diet, patch choice, departurefrom patches, and movement rules independently of one another. The trans-portation distance for food gathered will depend on the animal’s location at thetime of return, and this location may depend on previous movements or onwhere the animal has chosen to forage. At the same time, the frequency of tripsback to the central place will depend on the animal’s diet and on the amount offood obtained at each location.
Present models of central place foraging focus on just one aspect of foraging:(a) movements while searching for food, (b) the relationships between diet distance from the central place, and (c) the association between distance andboth patch choice and the rule of departure from a patch. Consequently, I shalldeal separately with each of these foraging categories. In all three cases, it isassumed that the cost of transporting food items to the central place dependsonly On the time required, and not on the size of the load (cf 54).
SEARCHING MOVEMENTS According to Morrison’s (165) model, a foraginganimal leaves its central place, searches for a patch of food using the movementrule described below, returns to the central place with a food item, and thenmakes (n- 1) more trips to and from the patch, obtaining the same amount
food each time; then it resumes the search for another patch. His model is basedon the following assumptions (165): (a) Fitness increases linearly with expected rate of food gain. (b) The locations of patches are initially unknown.(c) The animal searches for patches by traveling a constant distance (D) between turns, which results in new movement directions that are independentof previous events. During the search, the animal detects all patches that occurwithin a detection radius (r). Every time the animal changes direction, re-searches areas searched during the previous movement interval. The overlapbetween areas searched during nonsuccessive movement intervals is assumedto be negligible. (d) The animal adopts the distance (D) that produces imum fitness. Morrison then showed that as D increases, the rate of searchingnew areas increases, the expected search time to find a patch consequentlydecreases, the expected final distance from the central place increases, and thecosts of each visit to the patch therefore increase. He derived an expression forthe average time per feeding visit to a patch and showed that this is minimized(i.e. the expected rate of food gain is maximized) for values of D that decreaseas n increases. In other words, if an animal revisits a patch many times, itshould adopt a movement rule that keeps it near its central place. Because thelocations of patches are initially unknown, in the present model the animal willtend to visit patches more distant than the nearest patch (165).
DIET VS DISTANCE FROM CENTRAL PLACE Schoener (232) considered thesituation where an animal encounters food items that differ in terms of their netenergy yield and handling time and where any chosen food item is transportedto a central place. He assumed that fitness increases linearly with the averagenet rate of energy gain. The optimal strategy is obtained in the same manner asthe optimal diet in the above diet models; encountered food items should beranked according to the ratio: (net energy gain - transportation cost) (handling time + transportation time). He also assumed that both net energygain and handling time are functions of prey length. For several choices forthese functions, if transportation time is independent of prey length, then astransportation time (i.e. distance) increases the length of the best prey shouldincrease and the range of prey lengths taken should shift upwards. These effectscan be reversed, however, if transportation time increases with prey length(232).
Lessells & Stephens (145) considered an animal that forages in patches andadopted the following assumptions: (a) Fitness increases linearly with theexpected rate of food gain. (b) Patches occur at different distances (i.e. traveltimes tr) from a central place. (c) Each chosen food item is transported to thecentral place. (d) Within a patch, the animal accepts the first food item "value" (i.e. energy) C or greater, where C may vary with transportation .timeor distance. (e) Handling times other than transportation time are negligible. (or’)
The animal "chooses" the relationship between C and tr that maximizes fitness.For each C, there will be an expected energy gain e and a search time ts perpatch; the optimal C is obtained graphically from a plot of e against t~ inessentially the same way as Charnov’s marginal value theorem is solved (see33, 145). Lessells & Stephens also showed that the optimal threshold increases with increases in the distance of a patch from the central place. Inother words, the animal should tend to take food items of higher energy valuefrom more distant patches.
PATCH CHOICE AND PATCH DEPARTURE VS DISTANCE FROM CENTRALPLACE If there is no resource depletion during foraging in available patches,then an animal should forage in the closest patch exclusively. If resourcedepletion does occur, however, then the animal should forage in a number ofpatches, and the overall allocation of time to the various patches will depend notonly on patch choices but also on the rules for departure from each patch.Consequently, in the context of central place foraging, patch choice and thepatch departure rule must be considered together. In all of the models discussedbelow, the animal’s diet is assumed to be independent of patch location.
Andersson (4) formulated a continuous model for this foraging situationbased on eight assumptions: (a) Fitness increases linearly with the amount food obtained during a fixed time S or decreases with the time required to obtaina fixed amount of food. (The same results should apply if the rate of food gain isthe currency of fitness.) (b) Stationary, identical food items are distributedrandomly and with density k throughout the total foraging area, which iscircular with radius R. (c) When searching, the animal is surrounded by detection area of radius ra, which is much smaller than R. (d) t(r) is the totaltime that each point of distance r from the central place remains within theanimal’s detection area. (e) Given that a food item occurs at a certain point distance r from the central place, the item will be discovered and removed withprobability P[t(r)] where P increases with increasing tr but with decreasingslope (i.e. diminishing returns set in as the animal spends more and more timesearching at each point). (j’) Removed food items are not replaced. (g) food item obtained at distance r from the central place entails a transportationtime Ct(r). (h) The animal adopts the functional relationship t(r) that maximizesfitness. Andersson.then derived an expression for the average time required perfood item for food obtained from the circular belt (r, r+dr) given t(r); definedmarginal cost as the cost per food item from this belt during an additional timedt(r) as dt(r) tends to 0; and showed that for general forms of Pit(r)], the totalsearch time has been optimally allocated if and only if this marginal food cost isequal throughout the foraging area. In addition, if P(t) = 1-exp[-at(r)],where a is the instantaneous rate of detection, and Ct(r) = r/vz, where v is thetransport velocity and z is the number of food items per load, then the optimalt(r) is given by:
where M is the marginal food cost under optimal time allocation. Finally,Andersson found that over a variety of parameter values, the optimal t(r) (i.e.the time per unit area) decreases approximately linearly with r (4).
Several authors (80, 128, 179) have developed a discrete model that dealswith the same foraging situation. They assume that after an animal has foragedfor time t in a patch, its expected food gain isf(t), wheref’ (t)>0 andf’ ’ (t)<0;that after foraging in each patch, the animal transports the food obtained to acentral place at a time cost T (i.e. the time for a return trip), and that fitnessincreases linearly with the expected rate of food gain. These assumptions formthe basis for a mathematical model identical to Charnov’s (33) model of theallocation of time to patches, and the solution is found in the same manner as forCharnov’s model (80, 128). If there is only one patch, since T increases withthe increasing distance d of a patch from the central place, the optimal timespent in the visited patch and amount of food obtained there will both increasewith increasing d (80, 128). if, however, there are two or more patches different distances, then the animal should spend decreasing amounts of timeper patch as the distance from the central place increases (see 33). Whether thetime per patch (i.e. time per unit area) should decrease linearly with distance (aspredicted in 4) will depend on the relationships between time and energy yieldper patch and between patch abundance and distance.
The above model has not been modified to allow for some (but not instant)food renewal. However, food renewal underlies a simple model Evans (70)developed. He made the following assumptions: (a) An animal forages in foodpatches that last one day. (b) Patches of food arise anew at the beginning of eachday. (c) A unit area (e.g. 2)contains a foodpatchon anygiven day withprobability p. (d) The animal, after leaving its central place, searches eachconsecutive circular belt (perhaps by moving in a spiral) until it finds a patch,and then it forages in that patch for the rest of the day. The probability Pk thatthe animal will forage in the circular band between (k- 1) and k distance units(corresponding to area units) is given then by Pk= [1 _q(Zk- ~)]q¢2k-z~, where q= 1-p. In this case, the search time per unit area, which is proportional toPk/(2k- 1), might follow the same general pattern, but it would reach a peakearlier than Pk. In contrast to Andersson’s (4) predictions, any decrease wouldnot be linear.
EVALUATING OPTIMAL FORAGING THEORY
1. Criteria for Accepting Optimal Foraging Studies
Because of both the many assumptions that form the basis for any optimalforaging predictions and the difficulty of devising independent, direct tests ofsome of these assumptions, the usefulness of the optimal foraging approachwill only become clear after a large number of optimal foraging studies have
been conducted. Not all studies, however, provide equally valid contributionsto the overall evaluation of optimal foraging theory, and I propose that onlythose studies that satisfy the following criteria be considered acceptable.
1, When the assumptions about the foraging animal can be assessed inde-pendently, they should be as realistic as possible, and they should be justified.Such assumptions normally include those made about the currency of fitness,the information possessed by the animal, and any behavioral constraints. Formany herbivores, for example, it would not be realistic to assume that fitness ismeasured solely in terms of the net rate of energy gain (see 72). Very fewstudies explicitly justify the assumptions made, however (e.g. 194, 197).
2. The foraging model should correspond as closely as possible to the actualforaging situation. It is inappropriate, for example, to apply a model based onan assumption of random food encounters to a situation in which food encoun-ters occur after constant intervals (219) or to use Chamov’s (33) marginal valuetheorem in situations where an animal is likely to be sampling rather thandepleting each patch.
3. The predictions should follow logically from the underlying model. Insome cases, the mathematics may be controversial (e.g. 34, 259, 264).
4. Parameters that determine the optimal diet should be estimated in anunbiased manner. For example, encounter rates with food types should bedetermined "from the animal’s point of view."
5. Because many foraging parameters are random variables, there willusually be some error associated with any optimal foraging predictions. Conse-quently, such predictions should usually be determined and expressed in termsof means and standard errors or of confidence intervals. I know of no publishedstudies in which this has been done.
6. Confidence intervals should also be determined for observed foragingbehavior, followed by appropriate statistical comparisons of the observed andpredicted confidence intervals.
7. In laboratory studies, the experimental foraging situation should mimicnatural foraging situations as closely as possible (206), even though unnaturalforaging situations may, of course, tell us much about the capabilities ofanimals.
8. In laboratory studies, animals should be given sufficient experience withthe experimental foraging situation to allow their behavior to reach an equilib-rium. Like Bayesian statisticians, animals are likely to have a priori assess-ments of food distributions, among other factors, and their foraging decisionswill therefore be influenced by past experience (e.g. 116). Only after animal’s behavioral response to a foraging situation has reached an equilibriumis it reasonable to assume that this response has not been affected by theanimal’s experience before the experiment began. Even then, this assumptionmay not be valid. Studies of animals with limited experience may, however,tell us much about how they learn to forage.
Unfortunately, there appear to be no studies (including my own) that satisfyall of these criteria. However, studies .that fail to include confidence intervalsfor predictions but satisfy the other criteria can provide some idea of theusefulness of optimal foraging theory. If there is no significant differencebetween the confidence interval for the observed behavior and a point predic-tion (e.g. the mean) for the optimal behavior, then the same result would hold a confidence interval had been used for the optimal behavior. If the firstdifference is significant, however, using a predicted confidence interval for theoptimal behavior may fail to reveal a significant difference between theobserved and predicted values. Failure to develop confidence intervals forpredictions should therefore lead to a bias towards rejecting optimal foraginghypotheses.
In the following sections, I shall review tests of optimal foraging theory,concentrating on those studies that come closest to satisfying the above criteria.
2. Diet
THE CURRENCY OF FITNESS Most optimal diet models assume that fitness ispositively correlated with the gross or net rate of food or energy gain. There is agrowing literature that indicates, however, that nutrients affect growth and/orthe maintenance and food preferences of herbivores (11, 13, 27, 28, 72, 127,162, 168, 169, 175, 180, 186, 224, 226, 227, 233, 234, 265, 282, 283),granivores (40, 86, 148, 190), and predators (88, 185). Some nectarivorousanimals may maximize their net rates ofenergy gain while foraging (e.g. 194),but the small amounts of amino acids and other nutrients in nectars may havenutritional significance (8, 9). For animals foraging on food items that appearto differ only in terms of their size, it is probably realistic to express fitness asfood or energy gain (e.g. 63, 66, 82, 107,136, 138,139, 199,216,217,269,271,278,284, 296).
Most optimal diet models are also based on the assumption (usually implicit)that the relation between fitness and food or energy gain is linear and conse-quently that fitness is maximized when the expected net rate of food or energygain is maximized. It is also always assumed that dietary choice does notinfluence an animal’s ability to perform other tasks, such as avoiding predators.For the foraging situations considered so far, this seems a reasonable assump-tion.
THE DETECTION OF FOOD ITEMS In most optimal diet models, it is assumedthat animals cannot determine the values of food items at a distance and thatencounters occur sequentially rather than simultaneously. This assumption islikely to be unrealistic for many animals, however. In particular, among thoseanimals for which optimal diet predictions have been tested, detection andevaluation of food items at a distance occurs in nectarivores (e.g. 152, 195,
200, 203, 271), fish (e.g. 75, 78, 266, 278), back swimmers (81), swallows (263). The time an animal needs to move to a detected food itemshould be included in the handling time for that item, so the value of a food itemmay depend on the distance at which it is detected. If a number of food items areencountered simultaneously, an animal may neglect a food item that it ofteneats if a better item is present. The only diet choice situations considered so farfor which food evaluation at a distance should not occur and for which the netrate of food or energy g~in should be a reasonable currency of fitness arepredation by crabs on mussels (63), predation by great tits on pieces mealworm presented through a small window over a conveyor belt (66, 107,136), pigeons "searching" for food in a Skinner box by pecking at a key (143),and redshank searching for worms of different sizes (82). In all these cases,encounters with food items should be sequential rather than simultaneous. Ishall discuss the results of these studies below and then briefly consider theresults of other studies.
STUDIES IN WHICH FOOD ENCOUNTERS ARE SEQUENTIAL, FOOD EVALUA-
TION AT A DISTANCE DOES NOT OCCUR, AND FOR WHICH THE NET RATE OF
FOOD OR ENERGY GAIN IS A REASONABLE CURRENCY OF FITNESS It is
usually assumed in optimal diet theories that the expected time to the next foodencounter is independent of the time spent handling the last food item. Thisassumption will be correct if food encounters occur at random but incorrect ifthey are nonrandom and if the encounter process continues while the animal ishandling food. In the conveyor belt studies by Krebs et al (136), Houston et (107), Erichsen et al (66), and Rechten et al (218), the interval between encounters was constant and the encounter process (i.e. the movement of theconveyor belt) continued while the bird handled the food. These studiestherefore require modifications in the optimal diet theory, as Krebs et al (136)and Rechten et al (219) have attempted to do. Neither modification appears be correct (see 219 and above), but I shall assume below that the correct theorywould produce negligible changes in the predictions generated during the aboveconveyor belt studies.
In these studies and in Lea’s (143) Skinner box study, animals (birds in cases) were sequentially presented with two types of food items, which couldbe accepted or rejected. Depending on the values of the various parameters, theoptimal diet was therefore either always to accept the better food type and neveraccept the other (i.e. specialize) or to accept both food types (i.e. generalize)(see the above discussion of optimal diet theory).
Krebs et al (136) varied the encounter rates with the 2 food types and testedtheir predictions on 5 individual birds in each of 5 experimental tests. Theyfound that in all 25 instances, the optimal diet predictions were upheld in thesense that the birds preferentially selected the better food type when specializa-
tion was predicted (assuming that food types were instantly and correctlyrecognizable) and did not select preferentially when generalization was pre-dicted. They also discovered, however, that when specialization was predicted,the birds continued to include some of the worse food type in their diets. Inother words, the birds exhibited partial preferences.
Houston et al (107) varied the encounter rates and in some cases added recognition time to each food type. They tested 4 individual birds in 3 ex-perimental treatments; the observed and predicted dietary selections wereconsistent with each other in 11 of the 12 instances. In one instance, a bird waspredicted to specialize but did not. They also found partial preferences.
Erichsen et al. (66) included food items that resembled the better food typebut yielded no return and varied the encounter rates with the 3 food types. Asthe birds always rejected the fake food items, this was essentially a two-food-type situation. They tested 5 birds in 2 treatments; the observed and predicteddietary selections were consistent 9 out of 10 instances. In one case, a bird wasselective when it should not have been. They too reported partial preferences.
Rechten et al (218) used essentially the same experimental design as Krebs al (136), alternating two food types that were regularly spaced on the conveyorbelt. They found that when specialization is predicted, the birds make twokinds of "errors," namely, rejecting a profitable item (RP error) and taking unprofitable item (TU error). They also discovered that at higher food presenta-tion rates (i.e. shorter distances between food items), there were more errors and fewer TU errors, as one would expect if the birds sometimesmisidentify the food types. They showed, however, that the birds could haveadopted error probabilities that would have yielded higher rates of food gain, somisidentification does not completely account for the observed partial prefer-ences. Rechten et al also observed that on the average, the birds rejected moreitems per item taken than would be expected if the birds were includingsampling in their strategy and that hungry birds came closer to the optimalforaging predictions than partially satiated birds.
Lea’s (143) results contrast with the relatively favorable ones obtained in theconveyor-belt studies, He varied the search time between the handling of onefood item and the encounter with the next, the handling times associated witheach food type, and the magnitude of the food reward associated with each foodtype. As expected, the 6 pigeons he studied became less and less selective as thesearch time lengthened; but they did not change from specializing to generaliz-ing in a predicted stepwise manner, and they did not demonstrate a rapiddecrease in selectivity at the predicted threshold search time. Lea also found,contrary to expectation, that the rate of encounter with the worse prey typeaffected its level of inclusion in the diet.
The different levels of success of optimal foraging theory in the aboveconveyor-belt and Skinner-box studies could be due to a greater similarity
between the conveyor-belt foraging situation and the natural foraging situationsof the birds in the studies. In the conveyor-belt situation, a bird sees potentialfood items through a small open window above the conveyor belt and eitherallows an item to pass or else picks up the item for eating and/or inspection (e.g.136). Food value is varied by changing the size of a food item; handling time isvaried by enclosing the food items in containers from which they must beextracted; recognition time is varied by making the containers clear or opaque.In Lea’s (143) Skinner-box study, the pigeon made dietary decisions (i.e."searches") by pecking a certain number of times on a key, chose to accept particular food type by pecking on a key and then waited for a period of timebefore gaining access to a food bin for another period of time. The conveyor-belt studies seem to mimic natural foraging situations more closely than theSkinner-box study.
Elner & Hughes (63) studied different-sized crabs feeding on mussels different sizes. When mussel availability was unlimited, the crabs chose musselsizes close to the optimal size and that the crabs included bigger and smallermussels as the supply of optimally sized mussels was depicted. Since crabsmust spend some time recognizing mussel size, the abundance of a particularmussel size should determine whether it is included in the optimal diet (see theabove discussion of optimal diet theory). Elner & Hughes discovered that theforaging of the crabs was consistent with this expectation. Contrary to expecta-tion, however, they also found some partial preferences.
OTHER STUDIES IN WHICH FOOD EVALUATION AT VARIOUS DISTANCES MAY
NOT OCCUR Granivorous birds that essentially search areas of ground be-neath them may not evaluate food at different distances. If the density of seedsis sufficiently low, seed encounter should also be sequential rather than simul-taneous. However, seeds of different species are apparently not equivalent interms of their nutrients (e.g. 40, 86), so the theory of optimal diets forgranivores should take nutrient constraints into account (188, 190).
Pulliam (190) studied chipping-sparrows that were feeding on seeds in oakwoodland. Some seed species were never eaten by caged or wild birds, andPulliam assumed that these seeds were nutritionally unsuitable. When attentionwas restricted to the remaining seed types, he discovered that as predicted, seedtypes with ratios of energy yield to handling time above a threshold valuetended to.be included in the birds diet and vice versa. He also found partialpreferences, which he interpreted in terms of the nutritional qualities of theseeds.
EXPERIMENTAL STUDIES WITH NECTARIVORES A nectarivore will often beable to see many flowers or plants from its present location. Thus, the optimaldiet theory must be modified to allow for detection at a distance and for
simultaneous encounters. Waddington & Holden (271) assumed that in suchsituations, a nectarivore that can only plan one step at a time should alwayschoose the next flower (or plant, etc.) so as to achieve the maximum expectedratio of net energy gain divided by the time required to move to and exploit thenext flower. As pointed out above, this will not be precisely the optimalstrategy, but I shall assume that it is a good approximation.
Waddington & Holden (271) observed honeybees foraging for nectar amongtwo types of randomly distributed artificial flowers that differed in color andshape. They varied the average nectar yield per flower of each type by varyingthe proportions of flowers containing 2A1 of unscented 25% sucrose solution,varied the densities of the 2 flower types, and for each of 7 cases, determinedthe proportions of visits to each flower type if the bees foraged optimally. Theobserved and predicted proportions were all similar, although a few significantdifferences were found (271).
Real and his colleagues (216, 217) also observed nectarivores (bumblebeesand wasps) foraging for nectar among two kinds of differently colored, ran-domly distributed artificial flowers. In both studies, the densities of each flowertype were equal, and the value of each type was varied by changing theprobability distribution of the nectar volume per flower. The insects exhibitedflower preferences that increased With increases in the average nectar yield perflower and decreased with increases in the variance (216, 217).
Waddington et al (269) also considered the importance of reward variance determining flower preferences. They observed bumblebees foraging amongfour flowers of two color types arranged in a square with diagonally oppositeflowers of different colors. Each time a bee left a flower, the nectar in thatflower was replenished according to a probability distribution of nectar re-wards. The bumblebees preferred flower types with constant rewards to oneswith the same mean but variable rewards (269). In addition, the bumblebeesexhibited partial rather than absolute flower preferences (269).
In all of the above studies of nectarivore foraging, the animals were riskaverse and did not always maximize their expected net rate of energy gain. Thisresult seems surprising in view of the large numbers of flowers (or plants) thatmany nectarivores (especially bees) are likely to visit during a day.
Marden & Waddington (152) observed honeybees choosing between twoartificial flowers that differed in color and sometimes distance. When theflowers were equidistant from a bee, 14 of the 15 bees always chose one coloror the other, while the last one showed no color preference. When the flowerswere at different distances from a bee (but not in different directions), 8 of bees tended to choose the closest flower independently of its color; one bee wasinitially constant to a particular color and later tended to choose the closestflower; another bee remained color constant. Thus, almost all the bees even-tually tended to forage optimally. The preferences were partial rather thanabsolute, however.
OTHER STUDIES In other diet studies, fewer of the criteria outlined above aresatisfied. Nevertheless, these studies yield results that tend to be similar tothose just discussed. Many studies have found that animals exhibit partialrather than absolute food preferences (e.g. 3, 51, 59, 76, 86, 104, 115, 141,263,266, 278,294). Some studies have indicated that an animal’s preferencefor a particular food type depends only on the abundances of better food types(e.g. 52, 53), while others have found that the abundance of the particular foodtype is also important (e.g. 78, 115, 263, 266).
3. Patch Choice
THE CURRENCY OF FITNESS The same comments made about optimal dietsas to whether or not it is realistic to assume that fitness increases linearly withthe net rate of food or energy gain also apply to optimal patch choice. Inaddition, fitness associated with patch choice should often depend on preda-tion, etc.
PATCH CHOICE IN THE ABSENCE OF RESOURCE DEPLETION WITH KNOWN
LOCATION AND QUALITY OF PATCHES Most studies of patch choice focuson patches where there is no resource depletion, the locations are known, andfactors other than food mass or energy are unimportant. In the earliest of thesestudies, the patches differed in the average rate of food or energy gain, a~d thevariance was ignored. The animals preferred the patch with the highest rate offood or energy gain, but preferences were partial rather than absolute (147,243, 245, 279, 291). Recently, several studies have considered how thevariance in the rate of food intake affects patch preferences. Two kinds ofbirds--juncos and white-crowned sparrows--were found to prefer a patch witha relatively low variance in the rate of food intake (i.e. they were risk averse)when they could expect to meet their food (i.e. energy) requirements and to risk prone when unable to do so. Preferences in these studies were also partialrather than absolute (24-26).
In another set of recent studies, the patches differed not only in the foodsupplied but also in predation risk (91,100, 161,163,238). Sticklebacks in thesimulated presence of an avian predator tended to feed in low rather than in highdensity swarms where the fish are less able to pay attention to predatorapproaches. In the absence of the predator, the fish preferred the high densityswarms. (161). Sparrows sometimes prefer a distant patch providing shelterfrom predators to a closer, exposed patch (91). Small bluegills did not switchhabitats when expected, and this may have been due to differential predationrisk (163). Patch choice by back swimmers was related to a balance betweenfeeding rate and predation risk (238).
If there is no resource depletion within patches and if fitness increaseslinearly with the rate of food or energy gain, then the optimal strategy is to
forage all the time in the best patch. If fitness also depends on some other aspectof food intake such as the variance in the rate of intake or the intake rate of somenutrient, however, then allocating time to more than one patch may be optimal(see the discussion of theories of optimal patch choice). The presence of otherfactors affecting fitness may explain the partial preferences observed in theabove studies.
Two studies indicate the importance of factors other than energy. Belovsky.(12) studied the foraging behavior of moose, for which diet and patch choiceare equivalent because the various food types occur in patches. He assumed thatmoose are subject to constraints in the maximum feeding time available eachday, daily rumen processing capacity, sodium requirements, and energy meta-bolism. He found that a model based on the assumption that fitness increaseslinearly with daily energy gain accurately predicts the amounts of aquaticvegetation, deciduous leaves, and forbs consumed by a moose each day. Inturn, nectar-gathering workers of social bee species appeared to choose sun-flower cultivars on the basis of energy production per plant, whereas solitarybees, which collect pollen as well as nectar from these plants, did not (260).
PATCH CHOICE WHEN RESOURCES ARE DEPLETED AND RENEWED In most
natural situations, an animal will deplete the available food resources as itforages in a patch. At the same time or in between foraging bouts, theseresources may be renewed. The optimal patch choice (assuming the locationsof patches are known) will therefore depend on the patterns of resourcedepletion ancl renewal. For example, if resource renewal is rapid relative todepletion, then an animal should always forage in the best patch. If renewal isslow, the optimal strategy would be to avoid recently depleted patches.
Cole et al (37) explored the extent to which hummingbirds can learn theappropriate patch choice strategy if both resource depletion and renewal occur.Their patches were two artificial flowers, one of which supplied nectar whilethe other did not. In between foraging bouts, the positions of the two flowertypes either remained constant or were switched. The birds had an initial biastowards shifting between flower locations on successive bouts, and theylearned this strategy more rapidly than they learned to return to the same flowerlocation. The authors attributed this difference to the relatively slow renewal offlower nectar, so that the "win-shift" strategy is more appropriate under naturalconditions. Two other studies concluded that animals distribute themselvesbetween two patches so that the rates of food or energy intake in the patches areequal (160, 200).
4. Rules of Departure from a Patch
The amount of time an animal spends in a patch may affect its rate of foodintake, its predation risk, and the time it spends elsewhere performing other
important tasks, such as monitoring potential intruders. Consequently, thesefactors may all enter into determining the currency of fitness for an animal’srule of departure from a patch. So far, the currency for all models of patchdeparture has been the net rates of food or energy gain; the tests of these modelshave involved situations for which this is a reasonable choice. Other factors--e.g. predation (97), intrusions (123), and thermoregulation (49)--will clearlyhave to be included in some situations, however. If one only considers food, ananimal may leave a patch because its rate of food or energy intake has decreasedthrough depletion of the available food or through movement into poorerregions of the patch, or because sampling experience indicates that it is arelatively poor patch. The theory of patch departure has concentrated, howev-er, on resource depletion rather than on sampling (see the above discussion ofthe optimal rules of departure). It is assumed that the locations and qualities ofpatches are known. The theory should therefore be tested only in situationswhere this assumption is justified. In the discussion below, I shall first considerstudies that satisfy this requirement, then a study that deals mostly withsampling, and finally research that involves both depletion and sampling (seealso 209).
RESOURCE DEPLETION IN PATCHES OF KNOWN QUALITY AND
LOCATION When food items are discrete, the optimal rule of patch departurewill depend on the informaton used by the animal. An animal may base itsdeparture decisions on the amount of food obtained so far, the amount of timespent in the patch, the time since the last food encounter, or other intercaptureintervals, among other factors. In the absence of independent tests, assump-tions about information use must be taken at face value.
Krebs et al (139) were the first to attempt to evaluate optimal patch depar-ture. In one of their experiments, the locations and qualities of the patchesshould have been known to the foraging animals (chickadees). All of thepatches were artificial pine cones containing a single food item (mealwormpieces) randomly assigned to one of six covered holes. The autfiors found thatthe birds obtained 0.26 food items per patch on average. This number is muchsmaller than the optimum of 1.0 that would prevail if the birds base theirdeparture on the number of food items obtained so far. It could be close to theoptimum, however, if the birds base their departure from a patch on the totaltime spent in the patch or on the time since consuming the last (and first in thiscase) food item. Krebs et al carried out some other experiments indicating thatthe chickadees based their departures on the time since the last food item wasconsumed (i.e. on the giving-up time) rather than on the time spent in a patch the amount of food obtained so far. Zach & Falls (292) reported similar resultsfor ovenbirds. Bond’s (20) analysis of the probability distributions of giving-uptimes suggested that departure decisions may be affected by other factors as
well. Giving-up times for caddis larvae were unaffected by the previous level offeeding (262). Giving-up times of parasitoid wasps were approximately con-stant in patches of different qualities, and the wasps reduced the prey to aboutthe same level in each patch (110).
Several studies have implicitly assumed that foraging animals base theirdeparture from patches on the time spent in a patch so far (42, 45, 123, 135).Cowie (45) varied the predicted times per patch by changing interpatch traveltimes and found that the observed average times and the predicted times weresimilar. Cook & Hubbard (42) considered six patches that differed in fooddensity and predicted the percentages of the foraging animal’s time that shouldbe spent in each patch type. They found that the animals spent some time inpatches they should not have visited at all, but that otherwise the differencebetween the observed and predicted values was minimal. Krebs & Cowie (135)applied this same approach to Smith & Sweatman’s (245) and Zach & Falls’s(291) data (see 209). Resource depletion was minimal in the latter two studies,however, so I included them in the previous discussion of patch choice.Kacelnik et al (123) studied great tits that could obtain food in a patch hopping on a perch. They simulated resource depletion by requiring increasingnumbers of hops to obtain the next food item. The most common numbers ofhops were equal to the predicted number for 3 out of 4 birds, one bird havingconsiderably longer hopping bouts than predicted. In all of these studies, theaverage or most common time spent per patch agrees reasonably well with thepredicted time per patch, but the time spent per patch is not a constant as waspredicted. A number of studies have obtained results that support more qualita-tive predictions of optimal patch departure (e.g. 16, 41,58, 79,124, 140,237).
PATCHES OF UNKNOWN QUALITY To nectivores that feed at flowers ininflorescences or on plants, these clusters of flowers represent patches. As suchan animal moves among the flowers within a patch, it may be increasinglylikely to revisit a flower (e.g. 195,202,208), it may visit flowers that tend contain less nectar than others (e.g. 103,196, 205), or it may obtain informa-tion about the otherwise unknown quality of its present patch (e.g. 103, 195,202). Such foraging situations are therefore ideal for developing and testingmodels of optimal patch departure. In general, however, these models mustinclude sampling as well as depletion.
The only study in which sampling and depletion are included in both themodel and the data collection is one of mine (202). I observed honey eatersfeeding at inflorescences that almost always had seven flowers in a regulararrangement. As these birds visited flowers within an inflorescence, the prob-ability of a revisit increased slightly until seven flowers had been visited, andthen it became close to one. There was a positive correlation among the nectarvolumes of flowers from the same inflorescence, so the birds could have
estimated patch quality on the basis of their sampling experience in a patch. Iassumed that fitness increases linearly with the expected net rate of energy gain;that the birds base their departure decisions on nectar thresholds with respecteither to the nectar volume obtained from the last flower visited or to theaverage nectar volume obtained from the flowers visited within a patch so far;and that these thresholds will vary with the number of flowers that have beenvisited. I used a computer simulation based on the observed probabilities offlower revisitation, the patterns of nectar distribution, and the times associatedwith various activities of the birds to derive the optimal nectar thresholds andfrom them, the optimal frequency distributions of the numbers of flowersprobed per inflorescence. The observed and predicted frequency distributionswere qualitatively similar but significantly different. The direction of thisdiscrepancy is what would be expected if the birds tend to be transient (202), characteristic verified by subsequent bird banding (G. H. Pyke & H. FI Recher,unpublished data).
Other attempts have been made to test predictions of optimal patch departureusing foraging by nectarivores (15,103,108,109, 195,284). In all these cases,however, the development of the predictions is inappropriate to the foragingsituation (see the above discussion of optimal patch departure theory; also 209,230). The same is true for Davies’ study (52) of spotted flycatchers foragingamong nondepletable patches of flying insects (see 209).
5. Rules of Movement
MOVEMENT PATTERNS AND SPEED OF MOVEMENT Relatively little atten-tion has been given to developing and testing models of optimal patterns ofmovement (see 209, 210,270). Many studies have shown that animals becomeless directional in movements or tend to engage in area-restricted searchingafter their encounter with large amounts of food or food odor (19, 21, 55, 69,194,210,247,267,285,289,293,295). Such behavior is expected wheneverfood is patchily distributed (e.g. 210). However, there are as yet no predictionsas to exactly what the directionality, or more generally, the rule-governingpatterns, of movement should be in different s~tuations (see the above discus-sion of optimal movement patterns). Consequently, quantitative tests of thepredictions are not feasible. The degree of directionality exhibited by animalsvaries widely (2, 130, 196, 203, 210, 228,240, 296-298).
In addition, where animals can see food items at a distance, they tendto move to the closest and the best items (best in terms of the rate of foodgain) (e.g. 152, 176, 203,297,298), Animals may also tend to alternate leftand right turns (e.g. 194) or to turn in one directon rather than the other(e.g. 35).
The speed of movement of foraging animals has received even less attentionthan movement patterns (see 204). In one of the few studies, Ware (272) found
that the average swimming speed of bleak, a planktivorous fish, is close to thespeed that maximizes the net rate of energy gain.
FORAGING MODE Animals sometimes exhibit a variety of foraging modeswhile feeding in the same area and on the same food types. Kestrels, forexample, may hunt while hovering or while sitting on a perch (225). Humming-birds and honey eaters may perch and hop or hover while feeding amongflowers within an inflorescence or plant (201). I deduced that in two observedforaging situations, hovering hummingbirds and perching honey eaters wouldhave obtained lower net rates of energy gain if they had adopted the alternativemode of foraging (201). Hovering seems to enable a bird to move more rapidlybetween flowers within an inflorescence than perching and hopping, but at ahigher energetic cost (201). Zach (290) found that crows, which,break Whelksby dropping them on rocks, minimized the total amount of ascending flightrequired when choosing the height of the drop. No other tests of optimalforaging modes have apparently been carried out.
6. Central Place Foraging
All quantitative tests of optimal central place foraging have assumed thatfitness increases linearly with the rate of food or energy intake. Other factorsmay also be important (e.g. 154), however.
For central place foragers, patches may differ in their quality and distancefrom the central place, and animals should vary their time and load size perpatch accordingly (see the above discussion of optimal central place foraging).Several researchers found that the rate of food gain in a patch decreases as moretime is spent in the patch, and they have used this relationship and the theory ofoptimal central place foraging (see 80,128,179) to derive predicted times andload sizes for different patches. In these cases--as required by the theory--there is effectively only one patch, and the animal is not simultaneouslychoosing among patches. Close agreement between the observed and predictedload sizes was reported (30, 126, 128, 261). However, chipmunks congistentlyspent less time and collected smaller loads than predicted (80). In all cases, theload sizes and patch times increased with increasing distance or time from thecentral place (80, 126, 128, 261). This qualitative result is consistent withCarlson & Moreno’s (29) and Nunez’s (173) findings.
A central place forager must also choose which patches to visit, and it wouldbe expected to allocate different amounts of time to patches at differentdistances from the central place. But the predicted pattern of time allocation issensitive to assumptions about the knowledge of patch locations and the rate offood renewal (see above), so quantitative tests of such predictions seempremature. Central place foraging has also been the subject of a number of otherstudies (e.g. 5, 7, 14, 44, 71, 96, 131,224, 244).
Optimal foraging theory can only be expected to be useful when its assump-tions, mathematical development, and testing are appropriate for the studies towhich it is applied. Future optimal foraging studies should therefore dealexplicitly with these problems and satisfy the kind of criteria I have presentedabove. As in many other areas of research, the achievement of these goalsshould be enhanced by better communication between theoreticians andempiricists.
Up to this point, the predictions of optimal foraging theory have beensupported to some extent but not completely. In many cases, the (correct)prediction is some kind of all-or-nothing behavioral response, yet animalsinvariably exhibit more gradual and incomplete responses (e.g. partial dietpreferences, variable patch times). Many explanations for these discrepancieshave been proposed (e.g. sampling, mistakes), but further development andtesting of these rationalizations remain to be carried out.
If attention is restricted to those studies that provide genuine tests of optimalforaging theory, the level of agreement between predicted and observed forag-ing behavior has been reasonably good, except for the findings of gradual ratherthan all-or-nothing behavioral responses. Consequently, the optimal foragingapproach seems worth pursuing. Nevertheless, there are still extremely fewstudies that come close to meeting my proposed critiera, and it is thereforepremature to form a firm opinion regarding the usefulness of the approach.
ACKNOWLEDGMENTS
Harry Recher provided helpful comments on an earlier version of this paper.Melinda Brouwer, Debbie Bushell, Judy Recher, Martin Shivas, and GraceSevkowski assisted with proofreading.
Literature Cited
1. Abrams, P. A. 1982. Functional re-sponses of optimal foragers. Am. Nat.120:382-90
2. Adams, G. 1981. Search paths of firefliesin two dimensions. Fla. Entomol. 64:66-73
3. Allen, P. L. 1983. Feeding behaviour ofAsterias rubens (L) on soft bottombivalves: A study in selective predation.J. Exp. Mar. Biol. Ecol. 70:79-90
4. Andersson, M. t978. Optimal foragingarea: Size and allocation of search effort.Theor. Popul. Biol. 13:397-409
5. Andersson, M. 1981. Central placeforaging in the whinchat, Saxicola rubet-ra. Ecology 62:538-44
6. Andersson, M. 198t. On optimal pred-
ator search. Theor. Popul. Biol. 19:58-86
7. Aronson, R. B., Givnish, T. J. 1983.Optimal central-place foragers: A com-parison with null hypotheses. Ecology64:395-99
8. Baker, H. G. 1977. Chemical aspectsof pollination of woody plants in the trop-ics. In Tropical Trees as Living Systems,ed. P. B. Tomlinson, M. Zimmerman.London/New York: Cambridge Univ.Press
9. Baker, H. G., Baker, I. 1975. Studies ofnectar-constitution and pollinator-plantcoevolution. In Coevolution of Animalsand Plants, ed. I. E. Gilbert, P. H.Raven. Austin: Univ. Tex. Press
10. Barnard, C. J., Stephens, H. 1981. Preysize selection by lapwings in lapwing-gull associations. Behaviour 77:1-22
11. Batzli, G. O., Cole, F. R. 1979. Nutri-tional ecology of microtine rodents--digestibility of forage. J. Mammal. 60:740-50
12. Belovsky, G. E. 1978. Diet optimizationin a generalist herbivore, the moose.Theor. Popul. Biol. 14:105-34
13. Belovsky, G. E. 1981. Food plant selec-tion by a generalist herbivore: Themoose. Ecology 62:1020-30
14. Bernstein, R. A. 1982. Foraging-areasize and food density: Some predictivemodels. Theor. Popul. Biol. 22:309-23
15. Best, L. S., Bierzychudek, P. 1982. Pol-linator foraging on foxglove (Digitalispurpurea)~a test of a new model. Evolu-tion 36:70-79
16. Bibby, C. J., Green, R. E. 1980. Forag-ing behaviour of migrant pied flycatch-ers, Ficedula hypoleuca, on temporaryterritories. J, Anim. Ecol. 49:507-21
17. Bobisud, L. E., Potratz, C. J. 1976. One-trial versus multi-trial learning fora pred-ator encountering a model-mimic sys-tem. Am. Nat. 110:121-28
18. Bohl, E. 1982, Food supply and preyselection in planktivorous Cyprinidae.Oecologia 53:134-38
19. Bond, A. B. 1980. Optimal foraging in auniform habitat: The search mechanismof the green lacewing. Anim. Behav. 28:10-19
20. Bond, A. B. 1981. Giving-up as a Pois-son process--the departure decision ofthe green lacewing. Anim. Behav. 29:629-30
21. Brunner, J. F., Burts, E. C. 1975.Searching behaviour and growth rates ofAnthocoris nemoralis (Hemiptera:Anthocoridae), a predator of the pearPsylla, Psylla pyricola. Ann. Entomol.Soc. Am. 68:311-15
22. Calow, P. 1975. The feeding strategies oftwo freshwater gastropods, Ancylus flu-viatilis Mull. and Planorbis contortusLinn. Pulmonata) in terms of ingestionrates and absorption efficiences. Oecolo-gia 20:33-49
23. Caraco, T. 1980. On foraging timeallocation in a stochastic environment.Ecology 61:119-28
24. Caraco, T. 1981. Energy budgets, risk,and foraging preferences in dark-eyedjuncos. Behav. Ecol. Sociobiol. 8:213-17
25. Caraco, T. 1982. Aspects of risk-aversion in foraging white-crowned spar-rows. Anim. Behav. 30:719-27
26. Caraco, T., Martindale, S., Whittam, T.
S. 1980. An empirical demonstration ofrisk-sensitive lbraging preferences.Anim. Behav. 28:820-30
27. Carefoot, T. H. 1967. Growth and nutri-tion of Aplysia puncture feeding on avariety of marine algae. J. Mar. Biol.Assoc. UK 47:565-89
28. Carefoot, T. H. 1973. Feeding, food pre-ference, and the uptake of food energy bythe supralittoral isopod, Ligia pallasii.Mar. Biol. 18:228-36
29. Carlson, A., Moreno, J. 1981. Centralplace foraging in the wheatear Oenantheoenanthe--an experimental test. J.Anim. Ecol. 50:917-24
30. Carlson, A., Moreno, J. 1982. The load-ing effect in central place foraging. Be-hav. Ecol. Sociobiol. 11:173-83
31. Charnov, E. L. 1973. Optimal forag-ing: Some theoretical explorations. Phi3thesis. Univ. Wash., Seattle. 95 pp.
32. Charnov, E. L. 1976. Optimal foraging:Attack strategy of a mantid. Am. Nat.110:141-51
33. Charnov, E. L. 1976. Optimal foraging:The marginal value theorem. Theor.Popul. Biol. 9:129-36
34. Charnov, E. L. 1981. Marginal value: Ananswer to Templeton & Lawlor. Am.Nat. 117:394
35. Cheverton, J. 1982. Bumblebees mayuse a suboptimal arbitrary handedness tosolve difficult foraging decisions. Anita.Behav, 30:934-35
36. Cody, M. L. 1971. Finch flocks in theMohave Desert. Theor. Popul. Biol. 2:142-58
37. Cole, S., Hainsworth, F. R., Kamil, A.C., Mercier T., Wolf, L. L. 1982. Spatiallearning as an adaptation in humming-birds. Science 217:655-57
38. Collier, G., Hirsch, E., Kanarek, R.1977. The operant revisited. In Hand-book of Operant Behaviour, ed. W. K.Honig, J. E. R. Staddon, pp. 28-52. NewYork: Prentice-Hall
39. Comins, H. N., Hassell, M. P. 1979. Thedynamics of optimally foraging predatorsand parasitoids. J. Anim. Ecol. 48:335-51
40. Conley, J. B., Blem, C. R. 1978. Seedselection by Japanese Quail, Coturnixcoturnix japonica. Am. Midl. Nat. 100:135-40
41. Cook, R. M., Cockrell, B. J. 1978. Pred-ator ingestion rate and its bearing on feed-ing time and the theory of optimal diets.J. Anirn. Ecol. 47:529--47
42. Cook, R. M., Hubbard, S. F. 1977.Adaptive searching strategies in insectparasites. J. Anita. Ecol. 46:115-26
43. Cornell, H. 1976. Search strategies andthe adaptive significance of switching in
44. Covich, A. P. 1976. Analyzing shapes offoraging areas: Some ecological and eco-nomic theories. Ann. Rev. Ecol. Syst.7:235-57
45. Cowie, R. J. 1977. Optimal foraging inthe great tits (Parus major). Nature268:137-39
46. Cowie, R. J., Krebs, J. R. 1979. Optimalforaging in patchy environments. InPopulation Dynamics, 20th Symp. Br.Ecol. Soc., London, 5-7April, 1978, ed.R. M. Anderson, B. D. Turner, L. R.Turner.
47. Cox, D. R. 1962. Renewal Theory. Lon-don: Methuen
48. Craig, R. B., DeAngelis, D. L., Dixon,K. R. 1979. Long- and short-term dy-namic optimization models with applica-tion to the feeding strategy of the Logger-head Shrike. Am. Nat. 113:31-51
49. Crowder, L. B., Magnuson, J. J. 1981.Cost-benefit analysis of temperature andfood resource use: A synthesis with ex-amples from the fishes. In BehavioralEnergetics : Vertebrate Costs of Survival,Ohio State Univ. Biosci. Colloq. No. 7,ed. W. P. Aspey, S. I. Lustick. Col-umbus: Ohio State Univ. Press
50. Curio, E. 1983. Time-energy budgetsand optimization. Experientia 39:25-34
51. Davidson, D. W. 1978. Experimentaltests of optimal diet in two social insects.Behav. Ecol. Sociobiol. 4:35-41
52. Davies, N. B. 1977. Prey selection andthe search strategy of the spotted fly-catcher. (Muscicapa striata): A fieldstudy on optimal foraging. Anim. Behav.25:1016-33
53. Davies, N. B. 1977. Prey selection andsocial behaviour in wagtails (Aves:Motacillidae). J. Anita. Ecol. 46:37-57
54. DeBenedictis, P. A., Gill, F. B., Hains-worth, F. R., Pyke, G. H., Wolf, L. L.1978. Optimal meal size in humming-birds. Am. Nat. 112:301-16
55. Downing, J. A. 1981. In situ foragingresponses of 3 species of littoral clado-cerans. Ecol. Monogr. 51:85-103
56. Drummond, H., Burghardt, G. M. 1983.Geographic variatioil in the foraging be-haviour of the garter snake, Thamnophiselegans. Behav. Ecol. Sociobiol. 12:43-
4857. Dunstone, N. 1978. Fishing strategy of
the mink (Mustela vison)---Time-budgeting of hunting effort. Behaviour67:157-77
58. Dunstone, N., O’Connor, R. J. 1979.Optimal foraging in an amphibious mam-mal. 1. The aqualung effect. Anim. Be-hav. 27:1182-94
59. Ebersole, J. P., Wilson, J. C. 1980.Optimal foraging--the responses ofPeromyscus leucopus to experimentalchanges in processing time and hunger.Oecologia 46:80-85
60. Eggers, D. M. 1977. The nature of preyselection by planktivorous fish. Ecology58:46-59
61. Eggers, D. M. 1982. Planktivore pre-ference by prey size. Ecology 63:381-90
62. Ellis, J. E., Wiens, J. A., Rodell, C. F.,Anway, J. C. 1976. A conceptual modelof diet selection as an ecosystem process.J. Theor. Biol. 60:93-108
63. Elner, R. W., Hughes, R. N. 1978. Ener-gy maximization in the diet of the shorecrab Carcinus maenas. J. Anim. Ecol.47:103-16
64. Emlen, J. M. 1966. The role of time andenergy in food preference. Am. Nat.100:611-17
65. Emlen, J. M., Emlen, M. G. R. 1975.Optimal choice in diet: Test of a hypoth-esis. Am. Nat. 109:427-35
66. Erichsen, J. T., Krebs, J. R., Houston,A. I. 1980. Optimal foraging and crypticprey. J. Anim. Ecol. 49:271-76
67. Erllnge, S. 1981. Food preference,optimal diet and reproductive output instoats Mustela erminea in Sweden. Oikos36:303-15
68. Estabrook, G. F., Dunham, A. E. 1976.Optimal diet as a function of absoluteabundance, relative abundance, and rela-tive value of available prey. Am. Nat.110:401-13
69. Evans, H. F. 1976. The searching be-haviour of Anthocoris confusus (Reuter)in relation to prey density and plant sur-face topography. Ecol. Entomol. 1:163-69
70. Evans, R. M. 1982. Efficient use of foodpatches at different distances from abreeding colony in black-billed gulls. Be-haviour 79:28-38
71. Fagerstrom, T., Moreno, J., Carlson, A.1982. Load size & energy delivery inbirds feed!ng nestlings---constraints onand alternative strategies to energy-maximization. Oecologia 56:93-98
72. Freeland, W. J., Janzen, D. H. 1974.Strategies in herbivory by mammals: Therole of plant secondary compounds. Am.Nat. 108:269-89
73. Fullick, T. G., Greenwood, J. D. 1979.Frequency dependent food selection inrelation to two models. Am. Nat. 113:762-65
74. Galen, C., Kevan, P. G. 1983. Bumb-lebee foraging and floral scent dimorph-ism: Bombus kirbyellus Curtis (Hyme-noptera: Apidae) and Polemonium visco-
sum Nutt. (Polemoniaceae). Can. J.Zool. 61:1207-13
75. Gardner, M. B. 1981. Mechanisms ofsize selectivity by planktivorous fish: Atest of hypothesis. Ecology 62:571-78
76. Garton, E. V. 1979. Implications ofoptimal foraging theory for insectivorousforest birds. In Role of InsectivorousBirds in Forest Ecosystems, ed. J. G.Dickson, R. N. Conner, R. R. Fleet, J.C. Kroll, J. G. Jackson. New York:Academic
77. Gendron, R. P., Staddon, J. E. R. 1983.Searching for cryptic prey: The effect ofsearch rate. Am. Nat. 121:172-86
78. Gibson, R. M. 1980. Optimal prey-sizeselection by 3-spined sticklebacks (Gas-terosteus aculeatus)---a test of the ap-parent-size hypothesis. Z. Tierpsychol.52:291-307
79. Giller, P. S. 1980, The control of han-dling time and its effects on the foragingstrategy of a Heteropteran predator,Notonecta. J. Anim. Ecol. 49:699-712
80. Giraldeau, L. A, Kramer, D. L. 1982.The marginal value theorem--a quantita-tive test using load size variation in acentral place forager, the eastern chip-munk, Tamias striatus. Anita. Behav.30:1036~2
81. Gittelman, S. H. 1978. Optimum dietand body size in backswimmers (Heter-optera: Notonectidae, Pleidae). Ann. En-tomol. Soc. Am. 71:737-47
82. Goss-Custard, J. D. 1977. Optimalforaging and the size selection of wormsby redshank, (Tringa totanus), in thefield. Anita. Behav. 25:10-29
83. Goss-Custard, J. D. 1977. The energeticsof prey selection by redshank, Tringatotanus (L.), in relation to prey density.J. Anim. Ecol. 46:1-19
84. Goss-Custard, J. D. 1977. Responses ofredshank, Tringa totanus, to absolute andrelative densities of two prey species. J.Anim, Ecol. 46:867-74
85. Gould, S. J., Lewontin, R. C. 1979. Thespandrels of San Marco and the Panglos-sian paradigm: A critique of the adapta-tionist programme. Proc. R. Soc. LondonSer. B 205:581-98
86. Green, R. 1978. Factors affecting the dietof farmland skylarks, Alauda arvensis. J.Anim. Ecol. 47:913-28
87. Green, R. F. 1980. Bayesian birds: Asimple example of Oaten’s stochasticmodel of optimal foraging. Theor.Popul. Biol. 18:244-56
88. Greenstone, M. H. 1979. Feeding be-haviour of free-living wolf spiders opti-mises dietary proportions of the essentialamino acids. Nature 282:501-3
89. Griffiths, D. 1975. Prey availability and
the food of predators. Ecology 56:1209-14
90. Griffiths, D. 1981. Sub-optimal foragingin the ant-lion Macroleon quinquemacu-latus. J. Anita. Ecol. 50:697-702
91. Grubb, T. C., Greenwald, L. 1982. Spar-rows and a brushpile--foraging re-sponses to different combinations of pre-dation risk and energy cost. Anita. Be~hav. 30:637-40
92. Hainsworth, F. R. 1978. Feeding: Mod-els of costs and benefits in energy regula-tion. Am. Zool. 18:701-14
93. Halnsworth, F. R., Tardiff, M. F. Wolf,L. L. 1981. Proportional control for dailyenergy regulation in hummingbirds.Physiol. Zool. 54:452-62
94. Hassell, M. P. 1980. Foraging strategies,population models and biological con-trol--a case study. J. Anim. Ecol. 49:603-28
95. Hassell, M. P., Southwood, T. R. E.1978. Foraging strategies of insects.Ann. Rev. Ecol. Syst. 9:75-98
96. Hegner, R. E. 1982. Central place forag-ing in the white-fronted bee-eater. Anim.Behav. 30:953-63
97. Heinrich, B. 1979. Foraging strategies ofcaterpillars: Leaf damage and possiblepredator avoidance strategies. Oecologia42:325-37
98. Heinrich, B. 1983. Do bumblebees for-age optimally, and does it matter? Am.Zool. 23:273-81
99. Heller, R. 1980. On optimal diet in apatchy environment. Theor. PopuL Biol.17:201-14
100. Heller, R., Milinski, M. 1979. Optimalforaging of sticklebacks on swarmingprey. Anim. Behav. 27:1127-41
101. Heyman, G. M. 1983. Optimizationtheory: Close but no cigar. Behav. Anal.Lett. 3:17-26
102. Hixon, M. A. 1982. Energy maximizersand time minimizers: Theory and reality.Am. Nat. 119:596-99
103. Hodgcs, C. M. 1981. Optimal foragingin bumblebees--hunting by expectation.Anim. Behav. 29:1166-71
104. Horn, M. H. 1983. Optimaldiets in com-plex environments--feeding strategies of2 herbivorous fishes from a temperaterocky intertidal zone. Oecologia 58:345-50
105. Horsley, D. T., Lynch, B. M., Green-wood, J. J., Hardman, B., Mosely, S.1979. Frequency-dependent selection bybirds when the density of prey is high. J.Anim. Ecol. 48:483-90
106. Houston, A. I. 1983. Optimality theoryand matching. Behav. Anal. Lett. 3:1-15
107. Houston, A. 1., Krebs, J. R., Erichsen, J.T. 1980. Optimal prey choice and dis-
crimination time in the great tit. (Parusmajor L.). Behav. Ecol. Sociobiol.6:169-75
I08. Howell, D. L, Hartl, D. L. 1980. Opti-mal foraging in glossophagine bats:When to give up. Am. Nat. 115:696-704
109. Howell, D. J., Hartl, D. L. 1982. Indefense of optimal foraging by bats: Areply to Schluter. Am. Nat. 119:438-39
ll0. Hubbard, S. F., Cook, R. M. 1978.Optimal foraging by parasitoid wasps. J.Anita. Ecol. 47:593-604
111. Hughes, R. N. 1979. Optimal diets underthe energy maximization premise: Theeffects of recognition time and learning.Am. Nat. 113:209-21
112. Hughes, R. N., Seed, R. 1981. Sizeselection of mussels by the blue crab Callinectes sapidus: Energy maximizer ortime minimizer? Mar. Ecol. 6:83-89
113. Iwasa, Y., Higashi, M., Yanamura, N.1981. Prey distribution as a factor deter-mining the choice of optimal foragingstrategy. Am. Nat. 117:710-23
114. Jaeger, R. G., Barnard, D. E. 1981.Foraging tactics of a terrestrial salaman-der: Choice of diet in structurally simpleenvironments. Am. Nat. 117:639-64
ll5. Jaeger, R. G., Joseph, R. G., Bamard,D. E. 1981. Foraging tactics of a terres-trial salamander--sustained yield in terri-tories. Anita. Behav. 29:1100-5
116. Jaeger, R. G., Rubin, A. M. 1982.Foraging tactics of a terrestrial salaman-der-judging prey profitability. J. Anita.Ecol. 51:167-76
117. Jaenike, J. 1978. On optimal ovipositionbehavior in phytophagous insects. Theor.Popul. Biol. 14:350-56
118. Jander, R. 1982. Random and systematicsearch in foraging insects. In The Biologyof Social Insects, ed. M. D. Breed, C. D.Michener, I-I. E. Evans. Boulder, Colo:Westview
119. Janetos, A. C. 1982. Active foragers vs.sit-and-wait predators: A simple model.J. Theor. Biol. 95:381-85
120. Janetos, A. C., Cole, B. J. 1981. Imper-fectly optimal animals. Behav. Ecol.Sociobiol. 9:203-10
121. Jenkins, S. H. 1980. A size-distance rela-tion in food selection by beavers. Ecolo-gy 61:740-46
122. Johnson, D. R., Campbell, W. V., Wyn-ne, J. C. 1980. Fecundity and feedingpreference of the two-spotted spider miteon domestic and wild species of peanuts.J. Econ. Entomol. 73:575-76
123. Kacelnik, A., Houston, A. I., Krebs, J.R. 1981. Optimal foraging and territorialdefence in the great tit (Parus major).Behaw Ecol. Sociobiol. 8:35~10
124. Kamil, A. C., Peters, J., Lindstrom, F. J.
1981. An ecological perspective on thestudy of the allocation of behavior. In 2ndAnn. Harvard Syrup. Quant. Anal.Behav.
125. Kamil, A. C., Yoerg, S. J. 1982. Learn-ing and foraging behaviour. In Perspec-tives in Ethology, ed. P. P. G. Bateson,P. H. Klopfer, 5:325-64. New York:Plenum Press
126. Kasuya, E. 1982. Central place watercollection in a Japanese paper wasp,t’olistes chinensis antennalis. Anita. Be-hay. 30:1010-14
127. Kenward, R. E., Sibly, R. M. 1977. Awoodpigeon (Columba palumbas) feed-ing preference explained by a digestivebottleneck. J. Appl. Ecol. 14:815-26
128. Killeen, P. R., Smith, J. P., Hanson, S.J. 1981_ Central place foraging in Rattusnorvegicus. Anim. Behav. 29:64--70
129. Kislalioglu, M., Gibson, R. N. 1976.Prey "handling time" and its importancein food selection by the 15-spined stickle-back, Spinachia spinachia (L.). J. Exp.Mar. Biol. Ecol. 25:151-58
130. Kitching, R. L., Zalucki, M. P. 1982.Component analysis and modelling of themovement process: Analysis of simpletracks. Res. Popul. Ecol. 24:224-38
131. Kramer, D. L., Nowell, W. 1980. Cen-tral place foraging in the eastern chip-munk, Tamias striatus. Anita. Behav. 28:772-78
132. Krebs, J. R. 1973. Behavioral aspects ofpredation. In Perspectives in Ethology,ed. P. P. Bateson, P. H. Klopfer. NewYork: Plenum
133. Krebs, J. R. 1978. Optimal foraging: De-cision rules for predators. In BehaviouralEcology: An Evolutionary Approach, ed.J, R. Krebs, N. B. Davies. Oxford:Blackwell
134. Krebs, J. R. 1980. Optimal foraging,predation risk, and territory defence.Ardea 68:83-90
135. Krebs, J. R., Cowie, R. J. 1976. Forag-ing strategies in birds. Ardea 64:98-116
136. Krebs, J. R., Erichsen, J. T., Webber, J.I., Charnov, E. L. 1977. Optimal preyselection in the great tit (Parus major).Anim. Behav. 25:30-38
137. Krebs, J. R., Houston, A. I., Charnov,E. L. 1980. Some recent developments inoptimal foraging. In Foraging Behavior;Ecological, Ethological and Psycholog-ical Approaches, ed. A. C. Kamil, T.Sargent, pp. 3-18. New York: GarlandSTPM
138. Krebs, J. R., Kacelnik, A., Taylor, P.1978. Test of optimal sampling by forag-ing great tits. Nature 275:27-31
139. Krebs, J. R., Ryan, J. C., Charnov, E. L.1974. Hunting by expectation or optimal
foraging? A study of patch use by chick-adees. Anita. Behav. 22:953-64
140. Kruse, K. C. 1983. Optimal foraging bypredaceous diving beetle larvae on toadtadpoles. Oecologia 58:383-88
141. Lacher, T. E. Jr., Willig, M. R., Mares,M. A. 1982. Food preference as a func-tion of resource abundance with multipleprey types: An experimental analysis ofoptimal foraging theory. Am. Nat. 120:297-316
142. Lam, R. K., Frost, B. W. 1976. Model ofcopepod filtering response to changes insize and concentration of food. Limnol.Oceanogr. 21:490-500
143. Lea, S. E. G. 1979. Foraging and rein-forcement schedules in the pigeon--optimal and non-optimal aspects ofchoice. Anim. Behav. 27:875-86
144. Lehman, J. T. 1976. The filter-feeder asan optimal forager, and the predictedshapes of feeding curves. Limnol.Oceanogr. 21:501-16
145. Lessells, C. M., Stephens, D. W. 1983.Central place foraging--Single preyloaders again. Anim. Behav. 31:238-43
146. Levin, D. A., Kerster, N. W., Niedzlek,M. 1971. Pollinator flight directionalityand its effect on pollen flow. Evolution35:113-18
147. Lewis, A. R. 1980. Patch use by graysquirrels and optimal foraging. Ecology61:1371-79
148. Lewis, A. R. 1982. Selection of nuts bygray squirrels and optimal foragingtheory. Am. Midl. Nat. 107:250-57
149. Lewontin, R. C. 1979. Fitness, survivaland optimality. In Analysis of EcologicalSystems, ed. D. H. Horn, R. Mitchell, G.R. Stairs. Columbus: Ohio State Univ.Press
150. MacArthur, R. H., Pianka, E. R. 1966.On optimal use of a patchy environment.Am. Nat. 100:603-9
151. Magnhagen, C., Wiederholm, A. M.1982. Food selectivity versus preyavailability--a study using the marinefish Pomatoschistus microps. Oecologia55:311-15
152. Marden, J. H., Waddington, K. D. 1981.Floral choices by honeybees in relation tothe relative distances to flowers. Physiol.Entomol. 6:431-35
153. Marten, G. C. 1973. An optimizationequation for predation. Ecology 54:92-101
154. Martindale, S. 1982. Nest defense andcentral place foraging: A model and ex-periment. Behav. Ecol. Sociobiol. 10:85-89
155. Maynard Smith, J. 1978. Optimizationtheory in evolution. Ann. Rev. Ecol. Syst.9:31-56
156. McNair, J. N. 1979. A generalized mod-el of optimal diets. Theor. Popul. Biol.15:159-70
157. McNair, J. N. 1981. A stochastic forag-ing model with predator training effects.II. Optimal diets. Theor. Popul. Biol.19:147-62
158. McNair, J. N. 1982. Optimal giving-uptimes and the marginal value theorem.Am. Nat. 119:511-29
159. McNamara, J. 1982. Optimal patch usein a stochastic environment. Theor.Popul. Biol. 21:269-88
160. Milinski, M. 1979. Evolutionarily stablefeeding strategy in sticklebacks. Z.Tierpsychol. 51:36~-0
161. Milinski, M., Heller, R. 1978. Influenceof a predator on the optimal foraging be-haviour of sticklebacks (Gasterostrusaculeatus L.). Nature 275:642-44
162. Mitchell, R. 1981. Insect behavior, re-source exploitation and fitness. Ann.Rev. Entomol. 26:373-96
163. Mittelbach, G. G. 1981. Foraging effi-ciency and body size: A study of optimaldiet and habitat use by bluegills. Ecology62:1370-86
164. Molles, M. C., Pietruszka, R. D. 1983.Mechanisms of prey selection by pre-daceous stoneflies~roles of prey mor-phology, behaviour and predator hunger.Oecologia 57:25-31
165. Morrison, D. W. 1978. On the optimalsearching strategy for refuging predators.Am. Nat. 112:925-34
166. Mueller, H. 1971. Oddity and specificsearching image more important thanconspicuousness in prey selection. Na-ture 233:345-4-6
167. Murdoch, W. W. 1969. Switching ingeneral predators: Experiments on pred-ator specificity and stability of preypopulations. Ecol. Monogr. 39:335-54
168. Myers, J. H. 1979. The effects of foodquantity and quality on emergence timein the cinnabar moth. Can. J. Zool.57:1150-56
169. Nicotri, M. E. 1980. Factors involved inherbivore food preference. J. Exp. Mar.Biol. Ecol. 42:13-26
170. Norberg, R. A. 1977. An ecologicaltheory on foraging time and energeticsand choice of ,optimal food-searchingmethod. J. Anim. Ecol. 46:511-29
171. Norberg, R. A. 1981. Optimal flightspeed in birds when feeding young. J.Anita. Ecol. 50:473-77
172. Norberg, R. A. 1983. Optimal locomo-tion modes of foraging birds in trees. Ibis125:172-80
173. Nunez, J. A. 1982. Honeybee foragingstrategies at a food source in relation to its
distance from the hive and the rate ofsugar flow. J. Apic. Res. 21:139-50
174. Oaten, A. 1977. Optimal foraging inpatches: A case for stochasticity. Theor.Popul. Biol. 12:263-85
175. Oates, J. T., Waterman, P. G., Choo, G.M. 1980. Food selection by the SouthIndian leaf-monkey, Presbytis johnii, inrelation to leaf chemistry. Oecologia 45:45-56
176. O’Brien, W. J., Slade, N. A., Vinyard,G. L. 1976. Apparent size as the determi-nant of prey selection by bluegill sunfish(Lepomis macrochirus).-Ecology 57:1304-10
177. Ohguchi, O., Aoki, K. 1983. Effects ofcolony need for water on optimal foodchoice in honey-bees. Behav. Ecol.Sociobiol. 12:77-84
178. Ollason, J. G. 1980. Learning to for-age---optimally? Theor. Popul. Biol. 18:44-56
179. Orians, G. H., Pearson, N. E. 1979. Onthe theory of central place foraging. InAnalysis of Ecological Systems, ed. D. J.Horn, G. R. Stairs, R. D. Mitchell, pp.155-77. Columbus: Ohio State Univ.Press
180. Owen-Smith, N., Novellie, P. 1982.What should a clever ungulate eat? Am.Nat. 119:151-78
181. Palmer, A. R. 1981. Predator errors,foraging in unpredictable environments,and risk: The consequences of prey varia-tion in handling time versus net energy.Am. Nat. 118:908-15
182. Parker, G. A., Stuart, R. A. 1976. Anim-al behavior as a strategy optimizer:Evolution of resource assessmentstrategies and optimal emigrationthresholds. Am. Nat. 110:1055-76
183. Partridge, L. 1981. Increased prefer-ences for familiar foods in small mam-mals. Anita. Behav. 29:211-16
184. Pietrewicz, A. T., Kamil, A. C. 1979.Search image formation in the Blue Jay(Cyanocitta cristata). Science 204:1332-33
185. Poston, H. A. 1976. Optimum level ofdietary biotin for growth, feed utiliza-tion, and swimming stamina of fingerlinglake trout (Salvelinus namaycush). Fish. Res. Board Can. 33:1803-6
186. Price, M. R. S. 1978. The nutritionalecology of Coke’s hartebeest (Alce-plaphus buselaphus cokei) in Kenya. J.Appl. Ecol. 15:33-49
187. Pulliam, H. R. 1974. On the theory ofoptimal diets. Am. Nat. 108:59-75
188. Pulliam, H. R. 1975. Diet optimizationwith nutrient constraints. Am. Nat. 109:765-68
189. Pulliam, H. R. 1980. Learning to forageoptimally. See Ref. 137
190. Pulliam, H. R. 1980. Do chipping spar-rows forage optimally? Ardea 68:75-82
191. Pulliam, H. R. 1980. On digesting atheory. Auk 97:418-20
192. Pulliam, H. R. 1981. Optimal manage-ment of optimal foragers. In RenewableResource Management, ed. T. J. Vin-cent, J. M. Skowronski. Berlin: Spring-er-Vedag
193. Pyke, G. H. 1978. Are animals efficientharvesters? Anim. Behav. 26:241-50
194. Pyke, G. H. 1978. Optimal. foraging:Movement patterns of bumblebees be-tween inflorescences. Theor. Popul.Biol. 13:72-97
195. Pyke, G. H. 1978. Optimal foraging inhummingbirds: Testing the marginalvalue theorem. Am. Zool. 18:739-52
196. Pyke, G. H. 1978. Optimal foraging inbumblebees and coevolution with theirplants. Oecologia 36:281-93
197. Pyke, G. H. 1979. Optimal foraging inbumblebees: Rule of movement betweenflowers within inflorescences. Anita. Be-hay. 27:1167-81
198. Pyke, G. H. 1979. The economics ofterritory size and time budget in the gold-en-winged sunbird. Am. Nat. 114:131-45
199. Pyke, G. H. 1980. Optimal foraging innectar-feeding animals and coevolutionwith their plants. See Ref. 137
200. Pyke, G. H. 1980. Optimal foraging inbumblebees: Calculation of net rate ofenergy intake and optimal patch choice.Theor. Popul. Biol. 17:232-46
201. Pyke, G. H. 1981. Why hummingbirdshover and honeyeaters perch. Anita. Be-hav. 29:861-67
202. Pyke, G. H. 1981. Honeyeater foraging:A test of optimal foraging theory. Anim.Behav. 29:878-88
203. Pyke, G. H. 1981. Optimal foraging inhummingbirds: Rule of movement be-tween inflorescences. Anita. Behav. 29:889-96
210. Pyke, G. H., Pulliam, H. R., Charnov,E. L. 1977. Optimal foraging: A selec-tive review of theory and tests. Q. Rev.Biol. 52:137-54
211. Rapport, D. J. 1971. An optimizationmodel of food selection. Am. Nat. 105:575-88
212. Rapport, D. J. 1980. Optimal foragingfor complementary resources. Am. Nat.116:324-46
213. Rapport, D. J., Turner, J. E. 1977. Eco-nomic models in ecology. Science 195:367-73
214. Real, L. 1980. On uncertainty and thelaw of diminishing returns in evolutionand behaviour. In Limits to action: TheAllocation of Individual Behavior, ed. J.E. R. Staddon. New York: Academic
215. Real, L. 1980. Fitness, uncertainty, andthe role of diversification in evolutionand behavior. Am. Nat. 115:623-38
216. Real, L. 1981. Uncertainty and pollina-tor-plant interactions: The foraging be-havior of bees and wasps on artificialflowers. Ecology 62:20--26
217. Real, L., Ott, J., Silverfine, E. 1982. Onthe tradeoff between the mean and thevariance in foraging: Effect of spatial dis-tribution and color preference. Ecology63:1617-23
218. Reehten, C., Avery, M., Stevens, A.1983. Optimal prey selection--why dogreat tits show partial preferences. Anim.Behav. 31:576-84
219. Rechten, C., Krebs; J. R., Houston, A. I.1981. Great tits and conveyor belts--acorrection for non-random prey distribu-tion. Anim. Behav. 29:1276-77
220. Reichman, O. J. 1977. Optimization ofdiets through food preferences by hetero-myid rodents. Ecology 58:454-57
221. Richards, L. J. 1983. Hunger and theoptimal diet. Am. Nat. 122:326-34
222. Rissing, S. W. 1981. Prey preferences inthe desert homed lizard: Influence of preyforaging method and aggressive be-havior. Ecology 62:1031-40
223. Robinson, S. K., Holmes, R. T. 1982.Foraging behavior of forest birds: Therelationships among search tactics, diet,and habitat structure. Ecology 63:1918-31
224. Rockwood, L. L. 1977. Foraging pat-terns and plant selection in Costa Ricanleaf cutting ants. J. NY Entomol. Soc.85:222-33
225. Rudolph, S. G. 1982. Foraging strategiesof American Kestrels during breeding.Ecology 63:1268-76
226. Rusterholz, M., Turner, D. C. 1978. Ex-periments on nutritional wisdom of roedeer. Rev. Suisse Zool. 85:718-30
227. Savory, C. J. 1977. The food of redgrouse chicks Lagopus I. scoticus. Ibis119:1-9
228. Scheibling, R. E. 1981. Optimal forag-ing of Oreaster reticulatus (L.) (Echin-odermata: Asteroidea). J. Exp. Mar.Biol. Ecol. 51:173-85
229. Schluter, D. 1981. Does the theory ofoptimal diets apply in complex environ-ments? Am. Nat. 118:139-47
230. Schluter, D. 1982. Optimal foraging inbats: Some comments. Am. Nat. 119:121-25
231. Schoener, T. W. 1971. Theory of feedingstrategies. Ann. Rev. Ecol. Syst. 11:369-404
232. Schoener, T. W. 1979. Generality of thesize-distance relation in models of opti-mal feeding. Am. Nat. 114:902-14
233. Scriber, J. M. 1981. Sequential diets,metabolic costs, and growth of Spodop-tera eridania (Lepidoptera, Noctuidae)feeding upon dill, lima bean and cab-bage. Oecologia 51 : 175-80
234. Scriber, J. M., Slansky, F. Jr. 1981. Thenutritional ecology of immature insects.Ann. Rev. Entomol. 26:183-211
235. Sih, A. 1977. Optimal foraging theoryused to deduce the energy available in theenvironment. Biotropica 9:216
236. Sih, A. 1979. Optimal diet: The relativeimportance of the parameters. Am. Nat.113:460-63
237. Sih, A. 1980. Optimal foraging: Partialconsumption of prey. Am. Nat. 116:281-90
238. Sih, A. 1980. Optimal behavior: Canforagers balance two conflicting de-mands? Science 210:1041-43
239. Sih, A. 1982. Optimal patch use: Varia-tion in selective pressure for efficientforaging. Am. Nat. 120:666-85
240. Sirota, Y. 1978. A preliminary simula-tion model of movement of larvae ofCulex pipiens molestus (Diptera: Culici-dae). II. Experimental studies on the dis-persal of insects. Res. Popul. Ecol.19:170-80
241. Sites, J. W. Jr. 1978. The foragingstrategy of the dusky salamander, Des-mognathus fuscus (Amphibia, Urodel:a,Plethodontidae): An empirical approachto predation theory. J. Herpetol. 12:373-83
242. Slobodkin, L. B. 1974. Prudent preda-tion does not require group selection.Am. Nat. 108:665-78
243. Smith, J. N. M., Dawkins, R. 1971. Thehunting behaviour of individual great titsin relation to spatial variations in theirfood density. Anita. Behav. 19:695-706
244. Smith, J. P., Maybee, J. S., Maybee, F.M. 1979. Effects of increasing distanceto ~bod and deprivation level on food
hoarding in Rattus norvegicus. Behav.Neural Biol. 27:302-18
245. Smith, J. N. M., Sweatman, H. P. A.1974. Food searching behavior of tit micein patchy environments. Ecology 55:1216-32
246. Stamps, J., Tanaka, S., Krishman, V. V.1981. The relationship between selectiv-ity and food abundance in a juvenilelizard. Ecology 62:1079-92
247. Stanton, M. L. 1982. Searching in apatchy environment: Foodplant selectionby Colias periphyle butterflies. Ecology63:839-53
248. Stein, R. A. 1977. Selective predation,optimal foraging, and the predator-preyinteraction between fish and crayfish.Ecology 58:1237-53
249. Stenseth, N. C. 1981. Optimal foodselection: Some further considerationswith special reference to the grazer-hunter distinction. Am. Nat. 117:457-75
250. Stenseth, N. C., Hansson, L. 1979.Optimal food selection: A graphic model.Am. Nat. 113:373-89
251. Stenseth, N. C., Hansson, L., Myllym~i-ki, A. 1977. Food selection of the fieldvole Microtus agrestis. Oikos 29:511-24
252. Stephens, D. W. 1981. The logic of risk-sensitive foraging preferences. Anirn. Be-hav. 29:628-29
253. Stephens, D. W., Charnov, E. L. 1982.Optimal foraging: Some simple stochas-tic models. Behav. Ecol. Socioblol. 10:251-63
254. Stewart-Oaten, A. 1982. Minimaxstrategies for a predator-prey game.Theor. Popul. Biol. 22:410-24
255. Sutherland, W. J. 1982. Do oystercatch-ers select the most profitable cockles.Anim. Behav. 30:857-61
256. Taghon, G. L. 1981. Beyond selection:Optimal ingestion rate as a function offood value. Am. Nat. 118:202-14
257. Taghon, G. L. 1982. Optimal foragingby deposit-feeding invertebrates--rolesof particle size and organic coating.Oecologia 52:295-304
258. Taghon, G. L., Self, R. F. L., Jumars, P.A. 1978. Predicting particle selection bydeposit feeders: A model and its implica-tions. Limnol. Oceanogr. 23:752-59
259. Templeton, A. R., Lawlor, L. R. 1981.The fallacy of the averages in ecologicaloptimization theory. Am. Nat. 117:390-93
260. Tepedino, V. J., Parker, F. D. 1982.Interspecific differences in the relativeimportance of pollen and nectar to beespecies foraging on sunflowers. Environ.Entomol. 11:246-50
261. Tinbergen, J. M. 1981. Foraging deci-sions in starlings (Sturnus vulgaris L.).Ardea 69:1~i7
262. Townsend, C. R., Hildrew, A. G. 1980.Foraging in a patchy environment by apredatory net-spinning caddis larva--atest of optimal foraging theory. Oecolo-gia 47:219-21
263. Turner, A. K. 1982. Optimal foraging bythe swallow (Hirundo rustica L.)--preysize selection. Anim. Behav. 30:862-72
264. Turrelli, M., Gillespie, J. H., Schoener,T. W. 1982. The fallacy of the fallacy ofthe averages in ecological optimization.Am. Nat. 119:879-84
265. Vadas, R. L. 1977. Preferential feed-ing---optimization strategy in seaurchins. Ecol. Monogr. 47:337-71
266. Visser, M. 1982. Prey selection by the3-spirted stickleback (Gasterosteusaculeatus L.) Oecologia 55:395-402
267. Waage, J. K. 1979. Foraging for patchi-ly-distributed hosts by the parasitoid,Nemeritis canescens. J. Anita. Ecol. 48:353-71
268, Waddington, K. D. 1982. Informationused in foraging. See Ref. 118
269. Waddington, K. D., Allen, T., Heinrich,B. 1981. Floral preferences of bumb-lebees (Bombus edwardsii) in relation tointermittent versus continuous rewards.Anita. Behav. 29:779-84
270. Waddington, K. D., Heinrich, B. 1980.Patterns of movement and floral choiceby foraging bees. See Ref. 137
271. Waddington, K. D., Holden, L. R. 1979.Optimal foraging: On flower selection bybees. Am. Nat. 114:179-96
272. Ware, D. M. 1975. Growth, metabolism,and optimal swimming speed of a pelagicfish. J. Fish Res. Board Can. 32:3341
273. Ware, D. M. 1978. Bioenergetics ofpelagic fish: Theoretical change in swim-ming speed and ration with body size. J.Fish. Res. Board Can. 35:220-28
274. Weigl, P. D., Hanson, E. V. 1980.Observational learning and the feedingbehaviour of the red squirrel Tamias-ciurus hudsonicus: The ontogeny of opti-mization. Ecology 61:213-18
275. Weihs, D. 1975. An optimum swimmingspeed of fish based on feeding efficiency.lsr. J. Technol. 13:163-69
276. Wells, H., Wells, P. H., Smith, D. M.1981. Honeybee responses to reward sizeand colour in an artificial flower patch. J.Apic. Res. 20:172-79
277. Werner, E. E. 1974. The fish size, preysize, handling time relation in severalsunfishes and some implications. J. Fish.Res. Board Can. 31:1531-36
278. Werner, E. E., Hall, D. J. 1974. Optimalforaging and the size selection of prey bythe bluegill sunfish (Lepomis macrochir-us). Ecology 55:1042-52
ing efficiency and habitat switching incompeting sunfishes. Ecology 60:256-64
280. Werner, E. E., Mittelbach, G. G. 1981.Optimal foraging: Field tests of dietchoice and habitat switching. Am. Zool.21:813-29
281. Werner, E. E., Mittelbach, G. G., Hall,D. J. 1981. The role of foraging profit-ability and experience in habitat use bythe bluegill sunfish. Ecology 62:116-25
282. Westoby, M. 1974. An analysis of dietselection by large generalist herbivores.Am. Nat. 108:290-304
283. Westoby, M. 1978. What are the biolog-ical bases of varied diets? Am. Nat.112:627-31
284. Whitham, T. G. 1977. Coevolution offoraging in Bombus and nectar dispens-ing in Chilopsis: A last dreg theory. Sci-ence 197:593-96
285. Williamson, C. E. 1981, Foraging be-haviour of a freshwater copepod--fre-quency changes in looping behavior athigh and low prey densities. Oecologia50:332-36
286. Wilson, D. S. 1976. Deducing the energyavailable in the environment: An applica-tion of optimal foraging the~, Biotropi-ca 8(2):96-103
287. Wilson, D. S. 1978. Prudent predation:A field study involving three species oftiger beetles. Oikos 31:128-36
288. Wolf, L. L., Hainsworth, F. R. 1983.Economics of foraging strategies in sun-birds and hummingbirds. In Behavioral
Energetics: The Cost of Survival in Verte-brates, ed. W. P. Aspey, S. I. Lustick.Columbus: Ohio State Univ. Press
289. Yano, E. 1978. A simulation model ofsearching behaviour of a parasite. Res.Popul. Ecol. 22:105-22
290. Zach, R. 1979. Shelldropping--~lecisionmaking and optimal foraging in North-western crows. Behaviour 68:106-17
291. Zach, R., Falls, J. B. 1976. Ovenbird(Aves: Parulidae) hunting behavior in patchy environment: An experimentalstudy. Can. J. Zool. 54:1863-79
292. Zach, R., Falls, J. B. 1976. Do ovenbirds(Ayes: Parulidae) hunt by expectation?Can. J. Zool. 54:1894-1903
293. Zach, R., Falls, J. B. 1977. Influence ofcapturing a prey on subsequent search inthe ovenbird (Aves: Parulidae). Can. J.Zool. 55:1958-69
294. Zach, R., Falls, J. B. 1978. Prey selec-tion by captive ovenbirds (Aves: Paruli-dae). J. Anita. Ecol. 47:929--43
295. Zach, R., Falls, J. B. 1979. Foraging andterritoriality of male ovenbirds (Ayes:Parulidae) in a heterogeneous habitat. J.Anirn. Ecol. 48:33-52
296. Zimmerman, M. 1979. Optimal forag-ing: A case for random movement. Oeco-logia 43:261-67
297. Zimmerman, M. 1981. Optimal forag-ing, plant density and the marginal valuetheorem. Oecologia 49:148-53
298. Zimmerman, M. 1982. Optimal forag-ing: Random movement of pollen collect-ing bumblebees. Oecologia 53:394-98