Optimal Land Allocation of Maize, Cassava and Teak for Small Landholders in Southern Togo, West Africa By Amber Lily Kenny Submitted in partial fulfillment of the requirements for the degree of MASTER OF SCIENCE IN FORESTRY MICHIGAN TECHNOLOGICAL UNIVERSITY 2007
Transcript
Optimal Land Allocation of Maize, Cassava and Teak for Small Landholders in Southern Togo, West
Africa
By
Amber Lily Kenny
Submitted in partial fulfillment of the requirements for the degree of MASTER OF SCIENCE IN FORESTRY
MICHIGAN TECHNOLOGICAL UNIVERSITY 2007
The thesis, “Optimal Land Allocation of Maize, Cassava and Teak for Small Landholders
in Southern Togo, West Africa” is hereby approved in partial fulfillment of the
requirements for the Degree of MASTER OF SCIENCE IN FORESTRY.
SCHOOL OF FOREST RESOURCES AND ENVIRONMENTAL SCIENCES
SIGNATURES:
ADVISOR: ____________________________________ Dr. Blair D. Orr
DEAN: ____________________________________
Dr. Margaret R. Gale
DATE: ____________________________________
i
TABLE OF CONTENTS
LIST OF FIGURES............................................................................................ ii LIST OF TABLES.............................................................................................. iii ACKNOWLEDGEMENTS................................................................................ v ABSTRACT....................................................................................................... vi CHAPTER ONE - INTRODUCTION................................................................ 1 SECTION ONE—GENERAL BACKGROUND........................................... 5 CHAPTER TWO - BACKGROUND OF TOGO............................................... 6 Climate and Topography........................................................................ 9 Politics and History of Togo................................................................... 10 The Peoples and Cultures....................................................................... 14 Economy and Resource........................................................................... 17 Farming................................................................................................... 18 CHAPTER THREE—BACKGROUND OF STUDY AREA............................ 21 CHAPTER FOUR - CROPS IN SOUTHERN TOGO....................................... 24 Cassava................................................................................................... 24 Maize....................................................................................................... 28 Teak......................................................................................................... 30 SECTION TWO—RESEARCH...................................................................... 35 CHAPTER FIVE - METHODS.......................................................................... 36 Linear Programming.............................................................................. 36 Maize, Cassava, Teak Linear Program.................................................. 38 Data Collection....................................................................................... 39 CHAPTER SIX - DATA..................................................................................... 47 Prices...................................................................................................... 47 Labor constraint...................................................................................... 48 CHAPTER SEVEN - RESULTS AND ANALYSIS......................................... 52 Farmer Types.......................................................................................... 53 Discount Rate.......................................................................................... 56 SECTION THREE—IMPLICATIONS OF STUDY..................................... 77 CHAPTER EIGHT – COMPARISONS WITH OTHER STUDIES.................. 78 CHAPTER NINE - RECOMMENDATIONS AND CONCLUSIONS............. 82 CHAPTER TEN - CONCLUDING REMARKS................................................ 88 LITERATURE CITED ...................................................................................... 90
ii
List of Figures
Figure 1 Remains of a forest in southern Togo................................................. 1
Figure 2 Map of Africa with Togo highlighted.…………………….........…... 7
Figure 3 Regional map of Togo………..…………………………..............…. 8
Figure 4 Children comprise over half of the Togolese population.….........….. 16
Figure 5 Village water access site……………….…………………...........….. 16
Figure 6 Young farmers clearing a field............................................................ 18
Figure 7 Smallholders creating a tree nursery to alley crop in their fields........ 20
Figure 8 Agodokpé, study site........................................................................... 21
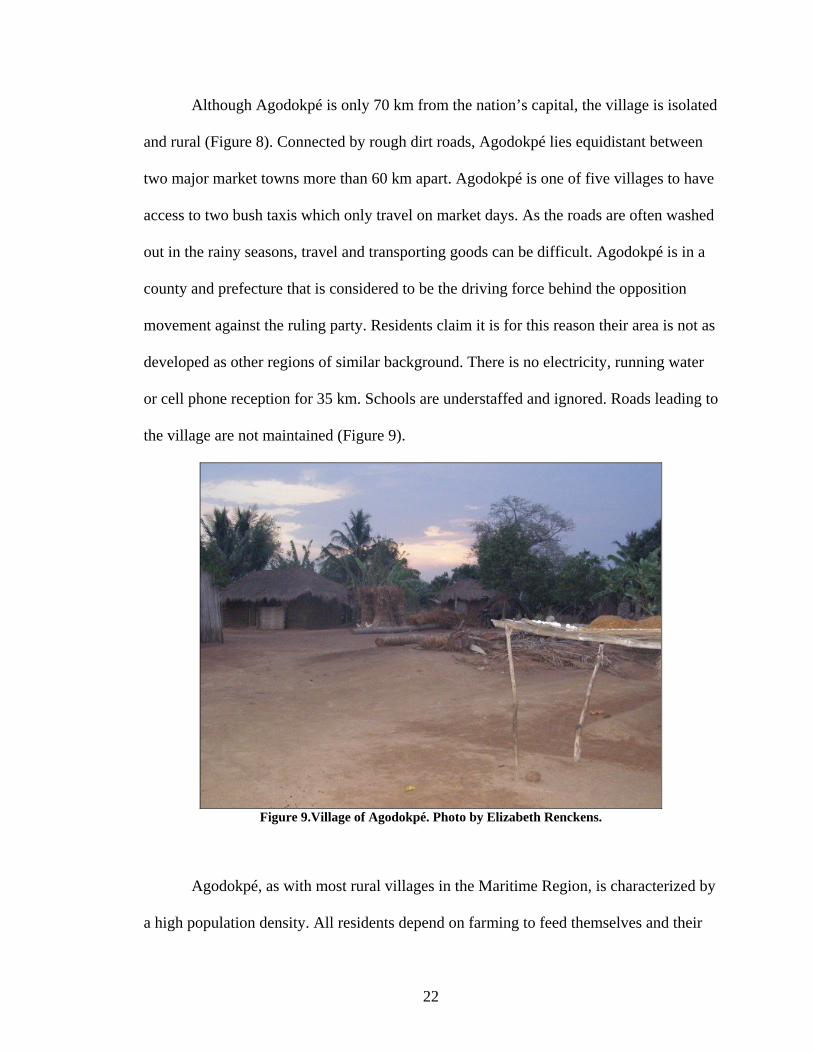
Figure 9 Village of Agodokpé….……………………………............……….. 22
Maize makes high demands of soil nutrients, especially nitrogen. Maize is
sensitive to drought and water-logging, both of which can occur during the long and short
growing seasons in southern Togo. Despite these potential obstacles, farmers continue to
plant maize. Farmers believe maize is grown for eating, not for generating money, and
feel they must grow it for food security. Many Togolese eat akplé two to three times a
day. Across Africa, people love eating maize and do not even consider the possibility of
not growing it (Trofimov 2005). In West Africa, maize is often grown in a mixed
cropping system. A common system in southern Togo is planting cassava with maize, as
cassava is a late maturing crop and maize an early maturing crop (Norman et al. 1995).
In Agodokpé, as with the rest of southern Togo, maize is considered a “male”
crop. Men are responsible for growing, harvesting and selling maize. Women and
children help with the planting and harvesting but are not considered “in charge” of the
crop (Figure 14). The maize market at local markets is one of the few venues run by men.
30
Because male farmers manage maize production, they also retain and control the income
generated from surplus maize.
Figure 14. Young mothers and their children removing grain from maize cobs.
Agodokpé, Togo. Photo by Amber Lily Kenny
Teak
Teak (Tectona grandis), a deciduous tropical hardwood, is one of the premier
timbers of the world. Its wood is highly valued for its color, fine grain, durability,
strength, lightness and weather resistance (Keogh 1996). Native to Southeast Asia, teak
has been an important plantation species since the early 20th century. Teak is most
commonly used for shipbuilding, furniture, cabinetry and general carpentry (Weaver
1993). As teak remains one of the most valuable timbers in the world, demand and
interest in this species continues as well. Teak is one of the few species of tropical
hardwoods that grows well under plantation conditions (Keogh 1996) (Figure 15). With
31
demand for teak increasing and natural supply decreasing, plantation teak is a way to
address global timber needs without depleting natural reserves (Krishnapillay 2000).
Figure 15. Five year old teak, Agodokpé, Togo. Photo by Elizabeth Renckens.
Although naturally occurring at latitudes 23° N to 10°S, teak has the ability to
grow between the latitudes of 28° N to 18° S, allowing teak plantations to occur
throughout southeast Asia, west and east Africa, Australia, South and Central America, as
well as the Caribbean. The estimated global net area of teak is 2,253,530 ha (Pandey and
Brown 2000). While the majority of plantations are found in southeast Asia,
approximately 4.5 percent of global teak plantations are found in Africa (Pandey and
Brown 2000). Optimal growth of teak requires a warm tropical climate with an average
rainfall of 1500 to 2000 mm and a dry season lasting three to five months (Keogh 1987).
Teak can grow on numerous soil types, but grows best on fertile, well drained alluvial
32
soils. Its growth is limited by heavy clays, poor drainage conditions and steep slope
(Weaver 1993).
In response to deforestation problems in the early 20th century, Togo planted its
first teak plantation in 1910 (Akakpo 2000). Togo’s southern most regions, ecological
zones four, five, and six, are suitable for teak production as they generally have enough
rainfall (1000-1700 mm) to support teak. Northern zones not only lack adequate rainfall
for teak but also have such poor soil that teak cannot grow well (Kokutse et al. 2004).
Nonetheless, farmers continue to plant teak in these regions. The Togolese government
has established extensive plantations and manages the majority of these plantations. Teak
production is also considered a suitable endeavor for small landholders because of its
high value, relatively fast growth and ease of cultivation (Mittelman 2000). Smallholders
who do plant teak generally employ a fifteen-year rotation plan. Some farmers may wait
to harvest trees until year 30, but most prefer to harvest and receive cash for their trees
before this. State-run teak plantations are managed on a 30 or more year rotation.
Agricultural extension agents with the Togolese governmental agency ICAT
(Institut de Conseil et d'Appui Technique, Technical Assistance and Support Institute)
provide farmers with agriculture and agroforestry technical advice. In theory, each county
in Togo has three to four agents living among farmers in rural areas. In reality, one agent
sporadically lives in rural counties, helps farmers from time to time and is underpaid and
under-supported. Along with forest technicians and foresters from the forestry branch of
the Togolese Ministry of Environment, ODEF (Office de Développement et Explotation
des Ressources Forestières), ICAT agents advise farmers on the best teak planting and
33
management techniques. They suggest that farmers plant 2,500 trees per hectare with 2m
by 2m spacing. Farmers should then follow a weeding regime of three times the first year
(Figure 16), two times the second year, and one final time the third year. Additionally
ICAT agents suggest thinning to 1250 trees between years five and ten and to 625 trees at
years fifteen to twenty (Ayassou, 2006). Thinnings generate revenue.
In certain regions in Togo it is possible to buy teak seedlings or stumps from
nurseries. Trees from these nurseries tend to have a better survival rate and faster growth
rates than those not from nurseries (Ayassou 2006). Farmers would prefer to buy
seedlings in order to establish teak plantations. However, it is expensive to buy seedlings
and stumps, and most farmers do not have the resources necessary to purchase the teak.
For a lower cost, one can buy teak seeds from ODEF and ICAT. Seeds from these
agencies have a higher success rate (Yadjassan 2006) but as they are an additional cost,
most farmers do not buy them. To establish teak stands, farmers (or their children) collect
seeds out in “the bush” near teak stands or collect seedlings growing under the stands and
replant them in their field (Figure 17). Although teak collection from the bush requires
more labor, it is also financially costless and requires no travel to nursery sites or
government forestry centers.
34
Figure 16. Six month old teak after 2nd weeding
Photo by Elizabeth Renckens
Figure 17. Teak seedling. Photo by Elizabeth Renckens.
35
Section Two
Research
36
Chapter Five
Methods:
As a Peace Corps extension agent, I lived in Agodokpé for 27 months. By
working, living and participating in daily activities in the village I became familiar with
community life and integrate into the community. Through numerous interactions, I was
able to observe and process information necessary for this study. I learned that farmers
grow cassava and maize for consumption and that many do not own large parcels of land
but would like to plant teak despite this lack of land. From this information, I concluded
that actual and desired farming activities in Agodokpé are limited by the physical
constraints of land and labor. A linear programming was devised as a means to find the
best allocation of these resources. Constructing a linear program defines the information
necessary to run the model. For this particular planning problem, it was necessary to
collect data on farming activities as well as social realities.
Linear Programming
A linear programming model can aid in decision making by finding optimal
allocations of constrained resources (Fawcett 2001). Linear programming uses a
mathematical model to select the best allocations of resources under specific constraints.
First developed in the 1940s for use in military operations, linear programming is widely
used for agriculture planning purposes (Dent et al. 1986, Hillier and Lieberman 1986).
Farming systems are constrained by the amount of finite resources available and are
further affected by changing physical and economic conditions. By utilizing a linear
programming model, one can plan farm activities in dynamic environments to obtain
37
optimal results. Furthermore, linear programming allows for analysis of what allocations
are possible if one manipulates the physical constraints of the problem.
All linear programs can be written in the following standard from:
Maximize Z = c1x 1+c 2 x 2+...c n x n (Objective function)
a11x 1+a12 x 2+...a1n x n <= b1 (Problem constraints)
a21x 1+a22 x 2+...a2n x n <= b2
am1x 1+am2 x 2+...amn x n <= bm
and x 1 >= 0, x 2 >= 0, x n >= 0 (Non-negative constraints)
The parameters, a, b, and c’s are fixed real values. X variables are the decision variables
to be determined using the linear program (Hillier and Lieberman 1986).
To effectively use linear programming as a tool for decision making, the objective
function of the farmer must first be stated. The benefit or return of each activity is known
as the objective coefficient. It is necessary to know these technical coefficients of the
objective function (the ci values) as well as the technical coefficients for the constraints
(the aij values) and the constraint limitations (the bi values) on the fixed resources, before
the model can be formulated. The amount of fixed resources constrains the activities,
which compete for the same resources (Fawcett 2001).
In order to model how farmers might incorporate teak into the smallholdings a
linear model of current farm operations was developed. The objective of the Togolese
smallholder is to maximize income including the value of food grown for home
consumption. The activities are defined as the cultivation of maize and cassava. By
generating different scenarios based on farmer data, it was possible to find best
allocations of maize and cassava on two land types using the linear programming model
38
developed. After optimal allocations of maize and cassava were found for each farmer
type, teak was added to the model, and scenarios for each farmer type were calculated
again to see if growing teak was feasible given the constraints of land, labor and financial
resources.
Maize, Cassava, Teak Linear Model Max: Z= QC * PC + QM * PM + QT * PT Subject to: Y1 C L1 C + Y2 C L2 C = QC
Y1 M L1 M + Y2 M L2 M = QM
Y1 TL1 T + Y2 T L2 T = QT
L1C + L1M + L1T ≤ L1 L2C + L2M + L2T ≤ L2 V1C L1C + V2C L2C +V1M L1M + V2M L2M + V1T L1T + V2T L2T ≤ V and all variables ≥ 0 For the following Primary variables L = Land area Y = Yield expressed on a per hectare basis Q = Total quantity P = Price V = Annual variable costs of production (excluding labor) per hectare Subscripts C = cassava M = maize T = teak 1 = high quality land 2 = low quality land Note: the parameters associated with each teak land type were the same.
39
The model was solved using, “What’sBest!” (Lindo Systems Inc 2007) which
solves linear problems in Microsoft Excel.
After the linear program was constructed, a questionnaire was designed to collect
the data needed to solve the model.
Data Collection
Data were collected through participant observation, individual informal and in-
depth interviews. Participant observation entails living, participating and interacting with
the community under study over an extended period of time (Nichols 2000). The primary
information collected through participant observation guided the direction of the study,
and allowed me to identify key informants, members of the community who are
knowledgeable of certain situations and can provide reliable information (Nichols 2000)
(Figure 18). I was able to interview key community members with various social standing
on their experiences with teak, what growing it entails, and their advice for other farmers
in the area who are interested in it. Finally with information gained from participant
observation and key informants, I was able to assemble a questionnaire, which I used to
conduct individual interviews with the heads of each participating household of the
community (Figure 19). Thirty nine out of fifty households were surveyed, as eleven
families were not in residence due to political problems, travel and palm wine collection.
40
Figure 18. Key Informants. Photo by Elizabeth Renckens
Figure 19. Interview with typical smallholder household. Photo by Elizabeth Renckens
41
Social and economic differences among farmers can significantly influence crop
allocation, production as well as the feasibility of successful teak production. To those
unfamiliar with Togo, the participants in the study may seem similar. Overall, they are all
from the same area and are considered uneducated and poor. The most successful farmers
make a dollar and half a day, while others make much less than that (World Bank 1997).
Each smallholder has the same objectives: to grow enough food for him and his family to
eat, as well as to have enough surplus income to send some of his children to school and
to withstand emergencies. Yet, at the same time, each farmer has a set of individual social
circumstances that affect how he achieves this shared objective. These differing social
circumstances then influence the types of farm activities a farmer has available to try to
achieve his objective. Decision making on how to best achieve the objective is affected
by variables including labor availability, land tenure, skill and social status (Harris 1996).
Social status is a variable that can affect a small landholder’s ability to take on
new projects, like teak. Generally, in Agodokpé, the more land one owns, the higher
social standing one has. Furthermore, the more land one has, the more crops one can
grow, which can then feed more people and generate more income. Age, education level
and community status also affect social standing. For example, across Togo there are
younger men with little education and land, but who hold traditional village positions of
high social standing. They can have as much social status as older, affluent, educated
landowners, who own many hectares and have adult children. As in any community,
others can be influenced by a person’s degree of social standing which includes the
ability to have access to credit and work attitude. With higher social status, a farmer is
more likely to own extra land, or have access to other land. Also, he likely has some
42
education or training contributing toward a stronger work ethic than other farmers with
lower status. Finally, with higher social status, a farmer can have access to more labor to
help find teak seedlings, or have access to surplus income to buy teak seeds. For these
reasons it was necessary to construct a scale in order to factor how social status affects a
smallholder’s ability to plant teak. Farmer social categories were defined by the chief and
village elders of Agodokpé. The categories ranged from levels one to five, with one as
the lowest social status and five as the highest (Table 1)
43
Table 1. Generalized Social Status Scale for Togolese Small Holders, where 1 is low and 5 is high____________0 Level Education Landowner Family Income (US$/yr) Notes__________________________ 1 0 no, no <60 Drinks a lot, does small jobs for food 2 <grade 2 no, yes >60 Has small family 3 >grade 2 yes, yes >100 Owns a small amount of land 4 <grade 6 yes, yes >250 Has education and/or training 5 >grade 6 yes, yes >400 Village elder and/or has education____ Source: Chief Vidzro and Village Elders, Agodokpé, Togo 2006
44
Through participant observation it was revealed that the two major staple crops
cultivated in this region were cassava and maize. Not only were cassava and maize the
major crops grown, they were also the most important food crops for consumption. Key
informants and focus groups indicated that smallholders were interested in planting teak
on their land as well as cassava and maize. During interviews an interpreter translated
questions from French to Ewé to record responses accurately. The objective of the
questionnaire was to acquire information necessary to determine optimal allocation
among maize, cassava and teak. Accordingly, it was necessary to gather physical data on
household and farm operations. Farmers were asked how many hectares of low quality
land and high quality land they owned. Current allocations of land between cassava and
maize were also asked as well as the labor involved in cultivating the crops. Expected
yields for normal conditions were determined, as were the yields from the previous year’s
harvest, which had been affected by drought. Families gave information on average
maize and cassava consumption, prices and labor. The survey concluded with an open-
ended question which allowed farmers to share information on cultivating maize,
cassava, teak and other farm crops.
The surveys were then reviewed and households were separated into five basic
farmer types based on amount of land owned, amount of available labor and social status.
The averages of social status, number of household members, available labor, ha owned,
land quality, crop yields, consumption and income were then calculated to create a
prototype representing each farmer type (Table 2).
45
Table 2 Farmer Type Averages for Social Status, Available Labor, Hectares Owned and Yearly Income_______________ Type Social Status Available Labor Variable Ha Owned Ha low qual Ha high qual Income US$
Buyers participating in the black market travel to small villages to inquire if there are any
smallholders interested in selling teak. When a smallholder decides he is ready to harvest
his teak, he and the buyer decide on a price for the trees. Depending upon the scale of
harvest, this is either a flat rate/tree or prices for individually selected trees. The black
market prices in Table 3 reflect the flat rate price. The buyer then supplies labor,
machines and transportation for the harvest of teak. Occasionally local farmers are
contracted to help harvest trees.
Labor constraint
For small landholders family size determines available labor (Harris 1996). A
farmer with a large family has a larger labor pool and can provide workers for the field. A
farmer who has adult or older children will have more available labor than a newly
married smallholder with young children. In order to account for differences in work
potential an equation was created to calculate available labor. Hardworking adult males
were assigned the number 1.0, adult females were assigned the number 0.75, less
49
productive men 0.5, and children ages twelve to eighteen, 0.5. Children under the age of
twelve were not included in the work variable, as they do not make a significant
contribution to farm work. A household which contains one hardworking man, two
women and two older children, and two small children, has the work variable of 3.5.
Work Variable =
1 + 0.75 + 0.75 + 0.5 + 0.5 = 3.5.
In addition to labor, land is another constraint. Available land and quality of land
also limits farm activities. A smallholder can only grow as much as the land has the
capacity to produce (Kumar 1989).
The linear programming model constraints include the amount of cassava and
maize produced. The cassava constraint was calculated by multiplying the weight one
must eat per year by the average number of people in the farmer type’s household. The
constraint for maize was calculated in the same manner. For example, type 4 farmers are
land rich and labor poor, with an average of three people per household. Based on
household surveys and validated by FAO statistics, one person in southern Togo must eat
3.21 kg of cassava/week, or 167.07 kg/year. They must eat 1.24 kg of maize/week or
65.06 kg/year. Therefore the typical household in farmer type 4 consumes 501 kg of
cassava and 195 kg of maize per year (Table 4).
50
Table 4 Average Cassava and Maize Required for Household Consumption for Farmer Type__ Farmer type Average household size Cassava required kg/year Maize required kg/year 1 3 501 195 2 10 1670 650 3 5 835 325 4 3 501 195 5 10 1670 650_________
51
Available land and labor were also constraints. Type 4 farmers have more land that most
farmers with an average of one hectare of good quality land and 2.5 hectares of poor
quality land. Additionally their available labor variable is 1.5. Farmers believed they
should plant a certain amount of maize even if it would be more profitable to plant only
cassava.
Because this model deals with subsistence farmers, variable costs for crop
production were set at zero. The major inputs involved in producing maize and cassava
are the land, maize grain, cassava cuttings and manual labor. Farmers keep a portion of
the previous year’s harvest for seed maize, and utilize the stalks of consumed cassava as
cuttings for the next cassava planting. The man hours it takes to produce maize and
cassava were calculated. A ratio was then calculated to represent the amount of labor per
hectare each activity required.
These constraints were placed in the model using the price of maize at US$
0.20/kg and price of cassava at US$ 0.05/kg. These prices are based on the average price
of maize and cassava over several years, which fluctuate depending on season and
supply.
ICAT agents stated that poor land could produce 3200 kg of cassava per ha and
8000 kg per ha on rich land. One hectare of maize planted on poor land can produce 600
kg, whereas one hectare of rich land can produce 1200 kg of maize. Household surveys
agreed with the majority of this information, although many farmers stated they could
only attain a yield of 700 kg of maize on good quality land. This could be a result of poor
planting techniques or their recall of two recent years with unfavorable weather. ICAT
yields were used in the model.
52
Chapter Seven
Results and Analysis
Smallholders must determine how to best manage their land while constrained by
physical and economic conditions. The objective of every farmer in Agodokpé is to grow
enough food to feed their family and to produce enough crops to sell on the local market.
By selling surplus maize and cassava, farmers hope to generate enough income to
purchase other food items as well as pay expenses such as school fees and medicines.
Smallholders must allocate resources to various farming activities so as to best achieve
their objectives. Any farming problem can be divided into three areas: a set of objectives,
a range of possible activities and a set of resource and household constraints (Dent, et al.
1986). For farmers in Agodokpé, the major farming activities are cultivating maize and
cassava. These activities are constrained by available land and labor.
Although each farmer participates in different farm activities and social
conditions, patterns emerged from the households interviewed. Survey responses could
be delineated into five basic farmer types. Available labor and social status were both
incorporated, each helping to define the groups. The farmers’ responses were then
averaged to create a prototype to use in model calculations.
53
Farmer Types
Type 1: Land poor, Labor poor - 20.5 % of households are represented by this
category. Type 1 farmers lack land and workers. On average they own less than one
hectare of poor quality land. Households tend to be small with a labor variable of 1.5.
Type 1 farmers have low social standing, rating an average between 2 and 3 on the social
status scale. All single women (divorced, widowed, etc) interviewed fell into this
category.
Type 2: Land poor, Labor rich - 17.9 % of farmers in Agodokpé are in this category.
On average they own 1.5 ha of land and have an average work variable of 6.1. People in
this category have a slightly higher social standing, 3 on the social status scale, than type
1 farmers.
Type 3: Medium land, Medium labor - The plurality of farmers, 38.5 %, fell into this
category. This category represents farmers of middle to higher social status of 3 to 4, who
have an average work variable of 2.9. Type 3 farmers generally own about two hectares
of land.
Type 4: Land rich, Labor poor - Type 4 farmers were the least represented with 7.7 %
of the farmers occupying this category. This is not surprising as farmers who own large
parcels of land are rare. Farmers that do own larger amounts of land are usually part of a
large household, thus making type 4 farmers who are land rich and labor poor even more
uncommon. This farmer also has a higher average social status of four.
Type 5: Land rich, Labor rich - 15.4 % of those interviewed represented land rich and
labor rich households. Farmers in this category represent the elite village members. The
54
typical type 5 farmer has the highest social standing in the community at 4 to 5, an
average of 7.4 hectares of land and a large available work force, 5 or greater on the
worker variable scale. They have access to fertile lands and have the most capital.
The parameters for the farmer types were used in the linear model to find optimal
allocations of cassava, maize and teak under different rotation plans and discount rates.
Basic Land Allocation Models
First, a linear programming model was solved for the optimal allocation of maize
and cassava. The results for a land rich, labor poor farmer (type 4) maize and cassava
constraints and allocation are shown in Tables 5a and 5b. The farmer meets the maize
constraint and then allocates all remaining resources to cassava production on low and
high quality land. Some land is left idle.
Table 5a Land rich, Labor poor (type 4) Constraints for Linear Model Quantity Constraint Dual____ Cassava yield (kg) 501 0.00 Maize yield (kg) 195 -0.08 Low quality land (ha) 2.5 0.00 High quality land (ha) 1 240.00 Variable cost 0 0.00 Labor 1.5 340.43 Table 5b Land rich, Labor poor (farmer 4) Optimal Land Allocation__ Land allocation low quality (ha) High quality (ha)______ Cassava 1.85 1.00 Maize 0.33 0.00__________
For a household that is land rich and labor poor, the linear program finds the optimal land
allocation is: 1.85 ha of cassava on low quality land, 1.00 ha of cassava of high quality
55
land, and 0.33 ha of maize of low quality land. The model results also represent the
typical farming pattern of farmers in the study area.
The model was run for the other four farmer types and results were similar to
actual farming practices found in Agodokpé. Two years of field observations validate the
results of the model. The model, therefore, accurately represents current farm
management in Agodokpé.
The next step was to add a teak component to the model to determine if there
were circumstances where smallholders could increase income using teak in an
agroforestry system. As available farming land is limited for small landholders in Togo,
most farmers are not sure how much teak they can and should plant. Adding teak to the
model further divides land available and may change the allocation of resources. The
amount of labor necessary for teak was also calculated. Because labor with teak varies
with which establishment regime is employed, labor ratios were found for buying teak
seedlings and finding teak in the bush.
Labor required for teak plantations differ in years zero, one and two. A more
complicated four year model was used to solve this problem. The majority of labor
involved with teak occurs in year zero as this is when a farmer must look for seeds or
seedlings and transplant them to his field. In year one, the farmer is expected to weed
three times a year. After year one the work involved declines. In order to compare the
returns of teak, a long-term activity, with the annual returns of maize and cassava it was
necessary to find discount rates for the monetary values involved.
56
Discount rates
Growing teak requires land to be occupied with trees for years at a time. The
earnings from teak can only be realized at the end of the rotation (Kumar 1989) (Figure
20). Discount rates were applied to the costs and returns in the model as to incorporate
costs involved with using resources continuously. This enabled the model to reflect more
accurately the true costs and returns of growing teak, cassava and maize. In order to
calculate the discounted value of teak, a list of teak operations was created, which
included the costs and revenues for operations in each year (Table 6). Each value was
discounted in the appropriate year and the discounted values were added to give the
present net worth.
Figure 20. Fifteen year old teak plantation ready for harvest after bush fire. Agodokpé, Togo. Photo by Elizabeth Renckens
57
Table 6. Cost and Revenues of Operation for Teak Production at a Discount Rate of 8% with Black Market Prices Operation Cost/ha (US$) Year Revenue/ha (US$) Discounted Values Prepare Land 5.00 0 0.00 -5.00 Weed 12.00 0 0.00 -12.00 Seedlings 0.00 0 0.00 0.00 Plant 0.00 0 0.00 0.00 Weed 15.00 1 0.00 -13.89 Weed 0.00 1 0.00 0.00 Weed 0.00 1 0.00 0.00 Weed 0.00 2 0.00 0.00 Weed 0.00 2 0.00 0.00 Weed 0.00 3 0.00 0.00 Thin 25.00 5 1000.00 680.58 Harvest 0.00 15 3750.00 1182.16 Total 57.00 4750.00 1862.74
58
Finally the equivalent annual annuity (EAA) was determined. The resulting
number is the net value of teak per year used in the model. The equivalent annual annuity
allows projects of different life spans to be compared at the same discount rate. Therefore
it was possible to compare benefits of growing teak for a shorter rotation of fifteen years,
with a longer rotation of thirty years and with the annual harvest of maize and cassava.
Small landholders informally apply this practice to their farming activities. Subsistence
farmers will often forego receiving small increments of income over time in order to get
one larger return at the end of the time period (Bergert 2000). Planting teak is regarded as
investing in the future among many study participants. Often, farmers feel the objective
of growing teak is not so much to make a profit, but to have a guaranteed source of future
capital. Several farmers referred to it as a “retirement plan.”
The discount rate employed gives a measure of the importance of the time
element involved (Davis and Johnson 1987). For most people, particularly subsistence
farmers, 100 US$ today is more valuable than 100 US$ in the future. In order to account
for this with the production of teak, future values were discounted to reflect current
values (Klemperer 1996). The further into the future the profit is realized the greater the
impact of discounting. If the discount rate is high, current income is valued more than
receiving additional income in the future (Davis and Johnson 1987). Pressing economic
want can induce stakeholders to sacrifice the future profit in order to meet present needs
(Price and Nair 1984). Individuals who live on subsistence incomes often have higher
discount rates. For example, a farmer’s need for immediate money, perhaps to pay for
medical bills, or buy food for his family, may overshadow the possibility of earning more
money in the future by planting teak (Arnold and Deewees 1995). Conversely, farmers
59
know they may have large unplanned expenses, so planting teak can store wealth for
emergencies.
The discount rate depends upon individual time preference. This preference is
influenced by factors such as age, degree of education, income as well as personal wants
and needs (Davis and Johnson 1987). Most development economists utilize discount rates
between eight and twelve percent (Lette and de Boo 2002). For most economic resource
allocation problems a discount rate of ten percent is often used. Higher rates make it less
likely that an undertaking with distant returns will be economically feasible (Pearce and
Turner 1990). For this study discount rates of eight, eleven, and fifteen percent were
used.
This study assumes farmers will apply proper silvicultural techniques to their
plantations.
The following tables show optimal cassava, maize and teak allocation for each
farmer type, under a fifteen year rotation plan, sold on the black market with an eight
percent discount rate. These tables assume teak seedlings have been found in the bush as
opposed to being purchased.
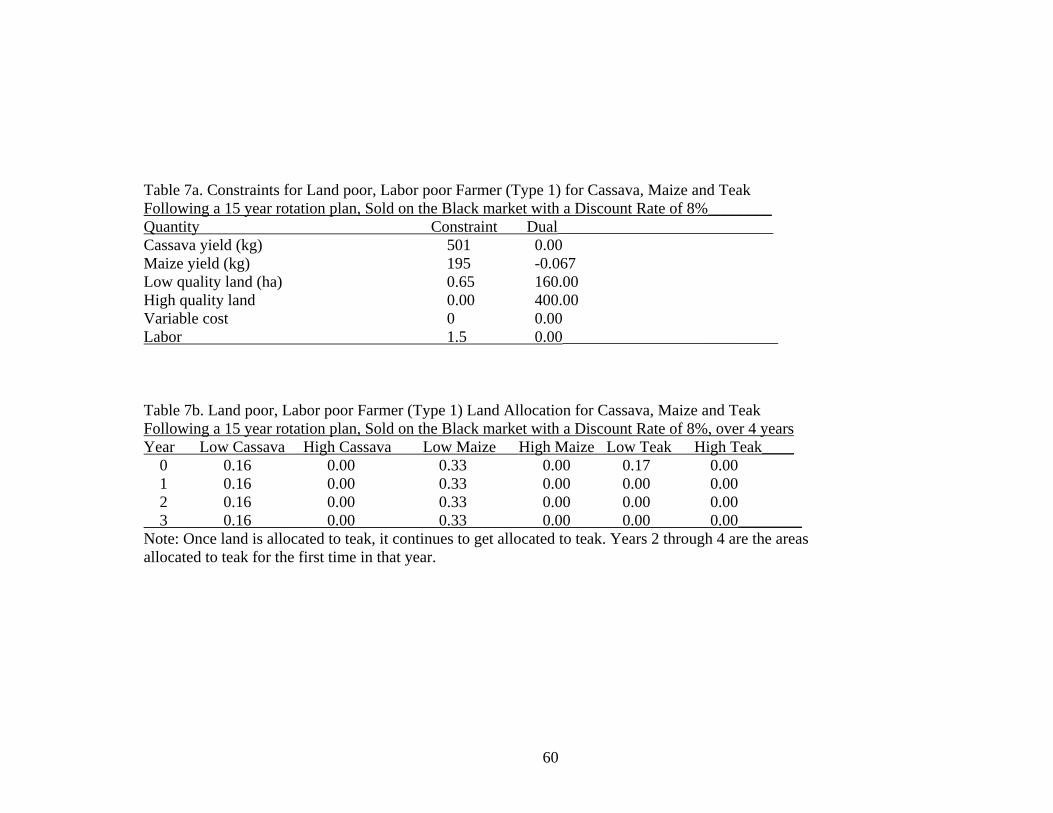
With a discount rate of eight percent it is profitable for land poor and labor poor
farmers to plant a small amount of teak (Tables 7a and 7b). The majority of their land is
allocated to cassava, while enough maize is planted to meet the maize constraint.
60
Table 7a. Constraints for Land poor, Labor poor Farmer (Type 1) for Cassava, Maize and Teak Following a 15 year rotation plan, Sold on the Black market with a Discount Rate of 8%________ Quantity Constraint Dual___________________________ Cassava yield (kg) 501 0.00 Maize yield (kg) 195 -0.067 Low quality land (ha) 0.65 160.00 High quality land 0.00 400.00 Variable cost 0 0.00 Labor 1.5 0.00___________________________ Table 7b. Land poor, Labor poor Farmer (Type 1) Land Allocation for Cassava, Maize and Teak Following a 15 year rotation plan, Sold on the Black market with a Discount Rate of 8%, over 4 years Year Low Cassava High Cassava Low Maize High Maize Low Teak High Teak____ 0 0.16 0.00 0.33 0.00 0.17 0.00 1 0.16 0.00 0.33 0.00 0.00 0.00 2 0.16 0.00 0.33 0.00 0.00 0.00 3 0.16 0.00 0.33 0.00 0.00 0.00________ Note: Once land is allocated to teak, it continues to get allocated to teak. Years 2 through 4 are the areas allocated to teak for the first time in that year.
61
Tables 8a and 8b represent farmers who have a large amount of labor, but have
little available land. A household with a large labor force requires more food production
to feed the family. Nonetheless, under a discount rate of eight percent, a land poor, labor
rich farmer optimizes their resources by devoting 0.5 ha to teak, planting maize on both
land types, and only planting a small amount of cassava for family consumption.
62
Table 8a. Constraints for Land poor, Labor rich Farmer (Type 2) for Cassava, Maize and Teak Following a 15 year rotation plan, Sold on the Black market with a Discount Rate of 8%_________ Quantity Constraint Dual____________________________ Cassava yield (kg) 1670 0.00 Maize yield (kg) 650 -0.133 Low quality land (ha) 1.0 200.00 High quality land 0.5 400.00 Variable cost 0 0.00 Labor 6.1 0.00____________________________ Table 8b. Land poor, Labor rich Farmer (Type 2) Land Allocation for Cassava, Maize and Teak Following a 15 year rotation plan, Sold on the Black market with a Discount Rate of 8%__________ Year Low Cassava High Cassava Low Maize High Maize Low Teak High Teak__ 0 0.00 0.21 0.502 0.29 0.50 0.00 1 0.00 0.21 0.502 0.29 0.00 0.00 2 0.00 0.21 0.502 0.29 0.00 0.00 3 0.00 0.21 0.502 0.29 0.00 0.00 ___ Note: Once land is allocated to teak, it continues to get allocated to teak. Years 2 through 4 are the areas allocated to teak for the first time in that year.
63
Type 3 farmers represent the typical smallholder found in Agodokpé. They own
land, have a family and have limited education. According to the linear programming
model, farmers in this category that require an eight percent discount rate should allocate
their low quality land to teak production. The majority of their high quality land should
be used for maize with the remaining devoted to cassava production (Tables 9a and 9b).
64
Table 9a. Constraints for Medium land, Medium labor Farmer (Type 3) for Cassava, Maize and Teak Following a 15 year rotation plan, Sold on the Black market with a Discount Rate of 8%_____________ Quantity Constraint Dual________________________________ Cassava yield (kg) 835 0.00 Maize yield (kg) 325 -0.133 Low quality land (ha) 1.60 200.00 High quality land 0.40 400.00 Variable cost 0 0.00 Labor 2.9 0.00________________________________ Table 9b. Medium land, Medium labor Farmer (Type 3) Land Allocation for Cassava, Maize and Teak Following a 15 year rotation plan, Sold on the Black market with a Discount Rate of 8%______________ Year Low Cassava High Cassava Low Maize High Maize Low Teak High Teak________ 0 0.00 0.13 0.00 0.27 1.60 0.00 1 0.00 0.13 0.00 0.27 0.00 0.00 2 0.00 0.13 0.00 0.27 0.00 0.00 3 0.00 0.13 0.00 0.27 0.00 0.00 ___________ Note: Once land is allocated to teak, it continues to get allocated to teak. Years 2 through 4 are the areas allocated to teak for the first time in that year.
.
65
Tables 10a and 10b indicate it is most profitable for land rich, labor poor farmers
(type 4) to allocate the majority of their resources to teak production. Farmers allocate
2.05 of 3.5 hectares to teak in year zero and an additional 0.45 hectares are allocated in
year one. Additional labor is valued by the type 4 farmer, as the dual price shows an
additional unit of labor is worth 340.43 US$. Maize and cassava have significantly better
yields on high quality land, while teak performs the same, independent of land quality.
The model allocates a portion of high quality land to maize and cassava, and the rest to
teak production. The majority of resources are allocated to cassava while a small amount
of maize is planted to meet the specified household constraints.
66
Table 10a. Constraints for Land rich, Labor poor Farmer (Type 4) for Cassava, Maize and Teak Following a 15 year Rotation Plan, Sold on the Black market with a Discount Rate of 8%_______ Quantity Constraint Dual___________________________ Cassava yield (kg) 501 0.00 Maize yield (kg) 195 -0.08 Low quality land (ha) 2.5 0.00 High quality land 1 240.00 Variable cost 0 0.00 Labor 1.5 340.43_________________________ Table 10b. Land rich, Labor poor Farmer (Type 4) Land Allocation for Cassava, Maize and Teak Following a 15 year rotation plan, Sold on the Black market with a Discount Rate of 8%_________ Year Low Cassava High Cassava Low Maize High Maize Low Teak High Teak___ 0 0.00 0.84 0.00 0.16 2.05 0.00 1 0.00 0.84 0.00 0.16 0.45 0.00 2 0.00 0.84 0.00 0.16 0.00 0.00 3 0.00 0.84 0.00 0.16 0.00 0.00 ______ Note: Once land is allocated to teak, it continues to get allocated to teak. Years 2 through 4 are the areas allocated to teak for the first time in that year.
67
With a low discount rate of eight percent it is advantageous for land rich, labor
rich (type 5) farmers to allocate the majority of their land to teak production (Tables 11a
and 11b) Farmers interviewed in this category had an average of 6.4 ha low quality land
and 1.0 ha of high quality land. All of the low quality land was allocated to the
production of teak. The remaining hectare of high quality land was allocated with almost
equal amounts of maize and cassava. As with the other tables, the dual price of planting
maize is negative, indicating that it would be more profitable for the farmer to plant less
maize and more cassava or teak.
68
Table 11a. Constraints for Land rich, Labor rich Farmer (Type 5) for Cassava, Maize and Teak Following a 15 year rotation plan, Sold on the Black market with a Discount Rate of 8%________ Quantity Constraint Dual___________________________ Cassava yield (kg) 1670 0.00 Maize yield (kg) 650 -0.133 Low quality land (ha) 6.40 200.00 High quality land 1.00 400.00 Variable cost 0 0.00 Labor 5.0 0.00____________________________ Table 11b. Land rich, Labor rich Farmer (Type 5) Land Allocation for Cassava, Maize and Teak Following a 15 year rotation plan, Sold on the Black market with a Discount Rate of 8%__________ Year Low Cassava High Cassava Low Maize High Maize Low Teak High Teak___ 1 0.00 0.46 0.00 0.54 6.40 0.00 2 0.00 0.46 0.00 0.54 0.00 0.00 3 0.00 0.46 0.00 0.54 0.00 0.00 4 0.00 0.46 0.00 0.54 0.00 0.00 ____ Note: Once land is allocated to teak, it continues to get allocated to teak. Years 2 through 4 are the areas allocated to teak for the first time in that year.
69
When the model is solved with the same constraints as Tables 11a and 11b,
(fifteen year rotation plan, with an eight percent discount rate) except with ODEF prices
instead of black market prices, it is not profitable to plant teak for farmer type 5 (Tables
12 a and12b.). The majority of low quality land is allocated to cassava. One additional
hectare of high quality land is occupied with cassava as well. Maize is only grown on low
quality land to fulfill the maize constraint. No resources are allocated to teak.
70
Table 12a. Constraints for Land rich, Labor rich Farmer (Type 5) for Cassava, Maize and Teak Following a 15 year rotation plan, Sold on the ODEF market with a Discount Rate of 8%________ Quantity Constraint Dual___________________________ Cassava yield (kg) 1670 0.00 Maize yield (kg) 650 -0.067 Low quality land (ha) 6.40 160.00 High quality land 1.00 400.00 Variable cost 0 0.00 Labor 5.0 0.00____________________________ Table 12b. Land rich, Labor rich Farmer (Type 5) Land Allocation for Cassava, Maize and Teak Following a 15 year rotation plan, Sold on the ODEF market with a Discount Rate of 8%_________ Year Low Cassava High Cassava Low Maize High Maize Low Teak High Teak___ 0 5.32 1.00 1.08 0.00 0.00 0.00 1 5.32 1.00 1.08 0.00 0.00 0.00 2 5.32 1.00 1.08 0.00 0.00 0.00 3 5.32 1.00 1.08 0.00 0.00 0.00_______ Note: Once land is allocated to teak, it continues to get allocated to teak. Years 2 through 4 are the areas allocated to teak for the first time in that year.
71
Continuing to use the discount rate of eight percent, Tables 13a and 13b show the
results for the type 3 farmer who owns a medium amount of land and has a medium
amount of labor in comparison to other farmer types. This scenario considers teak grown
on a thirty year rotation and sold on the black market. Under this scenario it is not
beneficial to grow teak and maximize profits. A majority of low quality land is allocated
to cassava (1.06 ha) with the remainder of low quality occupied with maize production. A
portion of cassava (0.40 ha) is allocated to high quality land. The rotation length of teak
has an influence over the profitability of teak. This same scenario generated with a fifteen
year rotation plan instead of thirty is profitable (Tables 9a and 9b). What is feasible at
fifteen years is no longer practical at thirty years.
72
Table 13a. Constraints for Medium Land, Medium Labor Farmer (type 3) for Cassava, Maize and Teak Following a 30 year rotation plan, Sold on the Black market with a Discount Rate of 8%______________ Quantity Constraint Dual_________________________________ Cassava yield (kg) 835 0.00 Maize yield (kg) 325 -0.067 Low quality land (ha) 0.4 160.00 High quality land 1.6 400.00 Variable cost 0 0.00 Labor 2.9 0.00_________________________________ Table 13b. Medium Land, Medium Labor Farmer (type 3) Land Allocation for Cassava, Maize and Teak Following a 30 year rotation plan Sold on the Black market with a Discount Rate of 8%________________ Year Low Cassava High Cassava Low Maize High Maize Low Teak High Teak_________ 0 1.06 0.40 0.54 0.00 0.00 0.00 1 1.06 0.40 0.54 0.00 0.00 0.00 2 1.06 0.40 0.54 0.00 0.00 0.00 3 1.06 0.40 0.54 0.00 0.00 0.00____________ Note: Once land is allocated to teak, it continues to get allocated to teak. Years 2 through 4 are the areas allocated to teak for the first time in that year.
73
The model was solved for each farmer type under a fifteen year rotation sold on
the black market and the ODEF market with the discount rates of eight, eleven, and
fifteen percent as well as a thirty year rotation plan with the same markets and discount
rates. Table 14 shows which rotation lengths, pricing regimes and discount rates allow for
teak production for each farmer type. If a fifteen year rotation plan is followed, teak is a
financially optimal feasible venture for all farmer types while sold on the black market
with a discount rate of less than eleven percent.
For fifteen year and thirty year teak sold through ODEF as well as the thirty year
rotation black market plan, teak is only a feasible option for farmer type 4, who is
characterized as land rich and labor poor. Seven percent of smallholders interviewed
represented this category. Teak production was found to be feasible for farmer type 4
under every regime tested.
Farmer type 2, land poor and labor rich, has the lowest feasibility for teak
production. Having an average of 1.5 ha and 10 members per household, they must
allocate the majority of their land to food crops and do not have not have surplus land for
teak production.
74
Table 14. Feasibility of Teak Production Under Various Assumptions. x indicates teak production is financially successful_ Rotation 15 Year Rotation 30 Year Rotation_______________________________ Price Regime Black Market ODEF Black Market ODEF_________________________ Discount Rate 8 11 15 8 11 15 8 11 15 8 11 15_____________________ Farmer Type___________________________________________________________________________________________ 1 x x - - - - - - - - - - 2 x - - - - - - - - - - - 3 x x - - - - - - - - - - 4 x x x x x x x x x x x x 5 x x - - - - - - - - - -______________________ Note: Using seedlings/seeds found in the bush
75
The model shows that growing teak is only profitable for farmers who plant
seedlings or seeds found in the bush, follows a fifteen year old rotation and sell trees on
the black market. The discount rate is significant, as teak is only profitable with a
discount rate of eleven percent or less. For type 4, land rich and labor poor farmers, teak
is profitable under all regimes. Type 4 has the smallest number of farmers.
Teak plantations established with teak stumps grow faster, and produce hardier,
higher quality timber than teak collected in the bush (Yadjassan 2006) (Figure 21). The
cost of planting one hectare of land with teak stumps is 125 US$. This cost is more than
many farmers make per year and more than most have available to spend on farming
projects. Any excess money is used for school fees, medicine, funeral expenses and
traveling. It is not possible for smallholders to recover the planting costs associated with
improved teak seedlings and stumps.
Figure 21. Planted teak stump after nine months,
Agodokpé, Togo. Photo by Amber Lily Kenny
76
In many of the scenarios, the model indicates that it is the most profitable to
allocate the majority of the resources to cassava production. If not for the constraint,
stipulating that maize must be produced, all resources would be allocated to cassava.
However, smallholders do not allocate the majority of their resources toward cassava
production. The Togolese truly love eating maize porridge, akplé. Many eat akplé three
times a day if possible. Preparing akplé is less time consuming that preparing cassava
dishes. Togolese farmers feel secure with maize production and it is an important part of
their culture. Cassava is a woman’s crop. Men may help in the cultivation of it but they
do not process it, sell it on the market or retain the income generated from it. When asked
why they do not only plant cassava since it is so profitable, male farmers responded with
the question, “Well, then what would we [the men] do?” For the most part, men control
the market of maize, and retain the resulting revenue. If there is a surplus produced of
maize, men sell it at the market. Every year men generate a small amount of income this
way. However, in most cases farmers would rather receive a single large payment after a
significant amount of time, rather than getting annual increments, even if the sum of the
small yearly increments is more than the large one time payment. Without the financial
infrastructure, farmers rely on this large one time payment as a way to make large
purchases. Teak is seen as an attractive investment by male smallholders who cultivate
maize; it guarantees one future large payment.
Farmers do not always want to cultivate all their land. If they do not have enough
labor to continually cultivate a parcel of land with food crops, farmers with high social
standing can get extended family members to help with one time projects, like planting
teak.
77
Section Three
Implications of Study
78
Chapter Eight
Comparisons with Other Studies
This study explores optimal resource allocation between maize, teak and cassava
for Togolese smallholders. Evaluating farm data with a linear program showed that
although labor and land constrain the feasibility and scale of teak production, the greatest
influencing factor on teak feasibility is the discount rate.
Zanin (2005) determined the feasibility of teak production for smallholders in
Panama using sensitivity analysis. She found that under various price scenarios, teak
projects are feasible with a discount rate of ten percent or less. These results agree with
the findings of this study: teak production is profitable for smallholders who have a
discount rate of eleven percent or less. Unlike this study, Zanin’s smallholders were not
restricted by the production of subsistence crops and all had adequate land.
Mittelman (2000) describes a smallholder project in Nakhon Sawan, Thailand,
where farmers participated in an on-farm teak planting project. Unlike Togolese farmers,
who were eager to plant teak, the smallholders were initially reluctant to include teak
production in their farming systems. Mittelman states that the Thai farmers’ needs for
immediate economic returns were more important to them than the future revenue of
teak. Like smallholders in Togo, available land for crops was limited and Thai
smallholders were reluctant to allocate land to teak, which would take a number of years
to generate revenue. After local participant-project designers encouraged teak planting
and facilitated planting arrangements with stakeholders, farmers were more amenable to
teak production. Smallholders planted teak with the aim to diversify income benefits and
79
maximize midterm income (through shorter rotations) for investment in farm and family
development. Within seven years of project implementation, sales agents started
approaching smallholders with offers for their teak. Mittelman concludes that the long
term benefits of teak can be combined with the short-term benefits of annual crops
resulting in significant income benefits for the smallholders.
Wojetkowski et al. (1988) use multiple objective linear programming (MOLP) to
evaluate multiparticipant agroforestry systems. They examine optimal allocations of
maize, cassava, leaucaena and teak in an agroforestry system implemented by a farmer
and a forester. The MOLP model discounts the forestry costs and returns at a five percent
discount rate. It does not discount farming costs and returns. The objective is to find the
best mix and density of species that will be advantageous for all participants involved.
The analysis was initially run with an original maize price and again with the maize price
doubled. In both cases, the MOLP model found that it was not in the farmers’ best
interest to engage in agroforestry. The forester benefited from the farmer’s activities by
maximizing his income, but the farmer did not benefit from the forestry activity. The
authors suggest this indicates that foresters need to provide some form of compensation
to the smallholders to encourage participation in the agroforestry farming system.
The multiple objective linear program is employed to reconcile different attributes
and constraints of two stakeholder groups, farmers and foresters, to solve for optimal
resource allocation of agroforestry and agricultural activities. This aspect of Wojtkowski,
et al.’s paper differs from this study, which considers one participant. In southern Togo,
smallholders are the farmer and the forester; it is not realistic to separate foresters and
farmers to evaluate agroforestry projects. Foresters work for the government; there are no
80
private forestry companies. Because of limitations of the government, such as a lack of
infrastructure, including payment of employees, transport services and program
development, foresters and farmers do no collaborate on projects. Additionally, the Ewé,
inhabitants of the study area maintain a distrust of centralized authority, which can be
traced back to the Kingdom of Tado and its tyrannical king. This distrust has been
augmented by almost 40 years of living under a totalitarian regime. Even if state foresters
were interested in and had the infrastructure to work with local farmers, they may find it
difficult to find willing participants. As long as the Togolese forestry sector, whether
state-owned or private, is not organized and not in touch with local stakeholders, this
multiple objective linear model worlds be misapplied when selecting the best allocation
of crops and timber for Togolese smallholders.
The MOLP problem also differs from this study in that it uses a low discount rate
of five percent for the forestry activity. This assumes that the foresters and the farmers
have a high time preference. They would often forego current earnings for future
earnings. Again, this component of the study may not be realistic for farmers who have a
higher time preference due to subsistence needs. Wojtkowski et al. agree with this study
in their final point, linear programming can be used as an effective tool for decision
making to best allocate resources given a set of circumstance and that single participant
agroforestry systems have fewer issues with conflicting goals.
Chaudhary and Jha (2004) analyzed the profitability of a teak plantation
intercropped with local agricultural crops for subsistence smallholders in Nepal. Under a
rotation plan of 35 years with a discount rate of 15 percent, they found that the cultivation
of teak was profitable. However, as with Zanin’s study, land was not limited and the
81
relationship between subsistence crops and teak was not examined. Chaudhary and Jha’s
report advises that teak production should be compared with agricultural crops, but does
not include them in their analysis of teak profitability. Subsistence smallholders do not
have the option to consider teak production and crop production separately. There is no
choice between planting timber crops and planting food crops. If a farmer is going to
produce teak, both teak and crop activities must be considered together. A teak feasibility
study designed for subsistence farmers that does not include the economic costs and
benefits of growing agricultural crops along with the costs and benefits of growing teak is
incomplete. A teak plantation may seem successful when analyzed apart from the
cropping system, but how successful can it be if the farmer involved cannot produce food
to eat? This study includes the agricultural crops necessary for family subsistence while
also producing teak. Subsistence farming needs affect the feasibility of a smallholder to
plant teak. Considering optimal allocations between staple crops and teak allows for
better management decisions of current and future farm activities.
82
Chapter Nine
Recommendations and Conclusions
Togolese smallholders depend on maize and cassava cultivation to survive.
Farmers would like to diversify their holdings to include teak production. I hypothesized
that teak production would only be feasible for farmers who owned large amounts of
land. According to the linear programming model used in this study, it is most profitable
for smallholders to grow teak on a short-term rotation and sell it on the black market,
even when constrained by subsistence crop production. This model is verified by the
management plan farmers currently employ: a shorter rotation sold to buyers on the black
market.
As the tropical timber market expands and native supply decreases, the demand
for plantation teak is growing. More and more small landholders are incorporating teak
into their farm systems to fulfill this demand (Varmola and Carle 2002). Thus far, the
majority of teak research has concentrated on the technical and economic aspects of teak.
Although there has been limited study on teak’s influence on agricultural systems, there
is a need for more. Research on the economic and ecological interactions of teak and
agricultural crops in farming systems must be carried out to ensure the production of
quality timber and profitability of teak plantations for smallholders (Nair and
Souvannavong 2002).
Farmers are attracted to teak because of potential financial benefits (Nair and
Souvannavong 2000). Many farmers currently plant teak in small plots for personal use,
and would like to increase their teak production. Other farmers view teak as a savings
account and want to start plantations as a way of having a guaranteed future income
83
(Bhat and Ok Ma 2004). Farmers who do not wish to utilize all their land with crops may
also want to plant it with teak. With this model, it is possible to ascertain an optimal teak
and crop ratio to make informed decisions on how much teak a farmer can plant and still
grow an adequate amount of subsistence food crops.
An eight percent discount rate represents farmers who are more likely to forego
current earnings for future earnings. It is not profitable to plant teak under discount rates
higher than eleven percent in most cases, except for type 4 farmers who are land rich and
labor poor. A discount rate of less than eleven percent reflects farmers who can afford to
wait for a future profit from teak. Generally this included all land rich farmers. Discount
rates can be assigned to different groups within the population to improve the ability to
forecast the likelihood of systems being adopted (Hoekstra 1985). Farmers willing to
plant teak have a lower discount rate than farmers unwilling to plant teak. For a farmer
operating under a discount rate of eight percent it is worth waiting for a larger future
profit than a smaller immediate profit. The discount rate of eleven percent reflects
farmers who are open to the idea of teak, but also put a high value on their subsistence
crops of maize and cassava. A discount rate of fifteen percent represents farmers
unwilling to plant teak without a substantially higher return and who prefer to realize
their profits sooner, whether in cash or in crops for food security.
Ultimately, the discount rate employed depends on a farmer’s preference, defined
by his personality, interests and attitudes. During the course of this study, farmers with
different preferences were interviewed. Seventy year old men opted to plant teak. Even
though they would not personally benefit from the teak, it was worthwhile for them to
invest in teak because it would financially benefit their children and grandchildren. Still
84
other farmers, who were younger and owned larger parcels of land, were not interested in
planting teak because they preferred to participate in activities with a shorter time frame
and faster financial turnover.
If the government eliminated price regulations, it may be more profitable for
smallholders to have longer rotations and larger trees. Selling teak trees to ODEF allows
farmers to navigate through the legal channels of the Togolese timber industry, as well as
ensures that the rightful owner is the actual seller of the teak. However, the governmental
regulated market creates an economic environment within which it is not feasible for
smallholders to produce teak successfully. The prices paid are not adequate to allow teak
to compete with annual crops. Smallholders do not have access to international
commercial markets. They must deal with a middleman: ODEF and the Ministry of
Environment or buyers on the black market.
The government of Togo controls thousands of hectares of teak, and is the main
competitor for smallholders selling teak. This study did not considered land tenure. The
government has an eminent domain policy that allows state seizure of lands despite local
and traditional ownership. In 2006, the Togolese Ministry of Environment notified the
residents of Agodokpé that land surrounding the village will be claimed by the
government for a national forestation campaign which involves planting hundreds of
hectares of teak. Not only are smallholders upset by the potential loss of their land, they
are also concerned about where they will grow crops for food.
Several farmers have participated in large teak planting projects with the Peace
Corps and are worried that the government will benefit from the teak that they planted.
ODEF explained the governmental seizure of land as a way for the Ministry of
85
Environment to work with farmers who want to grow teak as well as utilize uncultivated
land to plant with teak.
If farmers choose to plant teak they may want to include other income generating
activities into their farming system as well. While it is possible to find success with teak,
it can take considerable planning. It is difficult to predict the financial viability of teak
plantations. Success depends on many factors, including the costs of establishing and
managing the plantations, and the prices that can be obtained upon harvesting (Keogh
2004). In addition to these considerations for teak, the farmers must consider how to
achieve adequate crop production to fulfill his family’s needs.
Teak production in Togo can be problematic because of lack of infrastructure,
such as access roads and transportation, finding quality genetic stock and strict
government regulations. Teak production may become even more difficult because the
future risk of an encroaching teak pathogen (Nair and Souvannavong 2000). According to
ODEF foresters, a fungus is spreading among teak plantations from Cote D’Ivoire
through Ghana and could eventually infect trees in Togo. Researchers at ODEF
recommend that teak be planted in mixed stands instead of plantations. They advise
including other species such as Terminalia superba (limba) and Chlorophora excelsa
(iroko) in plantations would help reduce the impact of this pathogen. Currently, this
advice is unheeded and the Togolese government and smallholders continue to plant teak
monocultures.
It can be difficult for Togolese smallholders to profit from teak. They often must
act as the forester and the farmer. Information on teak establishment, management and
prices are not readily available or easily accessed (Nair and Souvannavong 2002).
86
Government prices are much lower than international prices and are not adequate to
cover costs of growing and establishing teak. Farmers who do sell on the black market
are often unaware of fair teak prices and sell their teak for less than market value. It has
been documented that villagers in West Africa have received prices less than one-quarter
of the international value (Keogh 2004).
Despite limitations, teak can still be considered a viable income generating
activity for the small landholder. Global demand for teak is increasing while native
supplies are decreasing. As demand for teakwood increases, stakeholders in tropical
countries are establishing more and more teak plantations to address the increasing
demand (Keogh 2004). Plantations provide an alternative source of timber to meet the
need for teakwood (Varmola and Carle 2002). International and domestic markets exist
for Togolese teak. Farmers in the study area who have planted teak have found success
with plantations and recommend it to others.
This study suggests that teak production is feasible for all farmer types under a
discount rate of less than eleven percent. Teak, however, is not accessible to everyone
and Togolese farmers are unsure of the correct silvicultural techniques to ensure
maximum profitability from the trees. Every farmer I worked with expressed interest in
working with teak, but some were apprehensive, thinking they would not have enough
land to produce food crops. To address this concern, the linear programming model
results presented in this paper can be used as a project planning tool for extension agents
who work with small landholders. Natural resource Peace Corps volunteers often
collaborate with farmers on teak plantation projects, but determining project size can be
difficult and is often an impediment to the progress of the project. A farmer or volunteer
87
can become overzealous in planning the project size. This linear program can serve as a
guide to help Peace Corps volunteers ascertain realistic project dimensions. Furthermore,
ICAT agents, whose responsibilities include aiding local farmers with agroforestry
activities, can apply this model and its results to their work. Finally, the Togolese
Ministry of Environment and its forestry branch, ODEF, can utilize the model to
calculate appropriate allocations of land devoted to teak and crops for farmers, if the
government is sincere about working with the smallholders to plant teak and are not using
smallholder land for their sole benefit.
Linear programming allows for better, more informed decision-making of farming
activities. Teak plantations may not be an option for all smallholders, but for those who
would like to venture into teak production, this linear program is a tool that can aid in
finding optimal resource allocation to achieve best outcomes. Contrary to my initial
assessment, farmers can produce food crops for their families as well as teak.
Furthermore, teak production can provide economic security for Togolese smallholders
whose future economic and social wellbeing are already precariously dependent upon a
dynamic unknown environment.
88
Chapter Ten
Concluding Remarks
The lives of Togolese smallholders are full of uncertainties and hardships. They
must make decisions on what to plant and how much and then depend on the crops they
grow to survive. The farmers must consider the unknown influences of weather, market
demands and family needs in their decision-making processes. After planning, the
smallholders must tirelessly work their land for months, hoping for a successful harvest
so they can send their children to school and cover medical costs.
Contrary to popular “development” opinion, smallholders are not always risk
averse and apprehensive of new projects. With increased access to healthcare and
education, along with a deterioration of the environment, a subsistence existence can no
longer cover the costs associated with contemporary Togolese life. Togolese farmers are
open to and, in fact, desperate for new income generating activities. During my Peace
Corps service I collaborated on numerous projects with smallholders. Whether it was
raising bush rats, making tofu, or planting teak, I was constantly surprised at the
determination and motivation of the farmers I worked with. In Togo, no matter how hard
life gets, people continue through it with a dogmatic determination, embodied by the
Togolese catch-phrase, “Çava aller,” literally meaning, “It’s going to go.” Said in
response to all things good or bad, the Togolese use this phrase to signify how life travels
on with or without you.
The privilege of living side by side with the people of Agodokpé has profoundly
changed me. Through interactions and experiences with my friends and families in
89
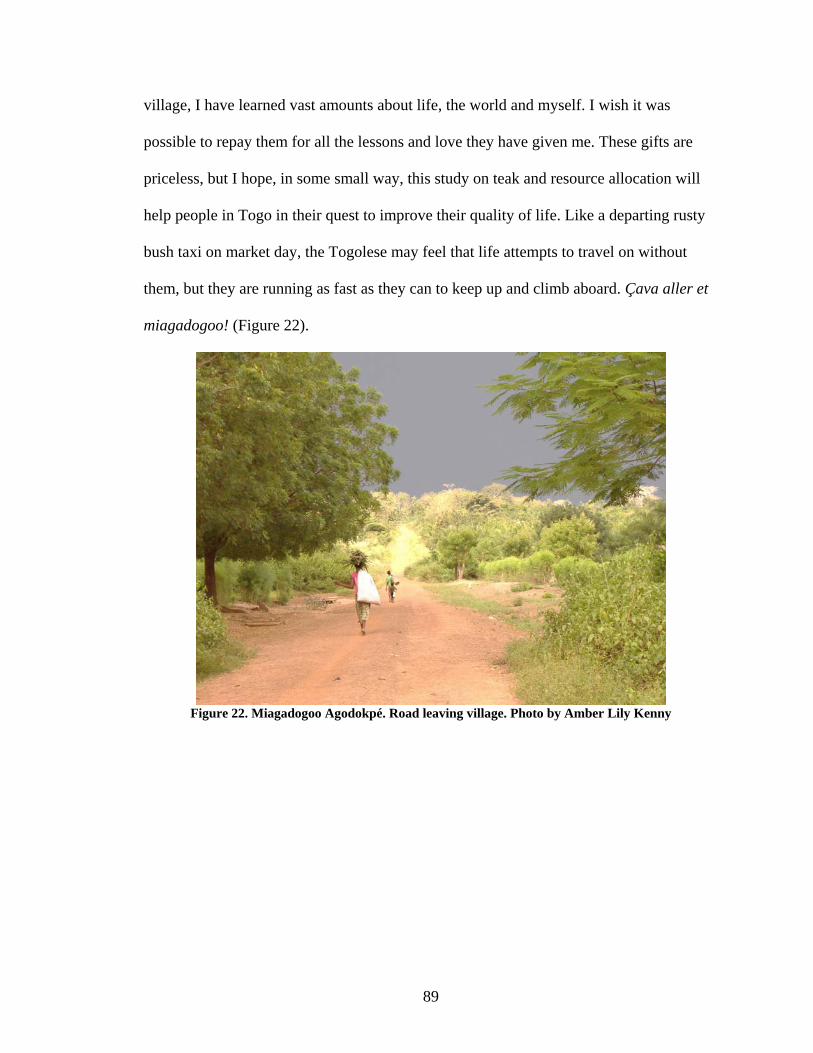
village, I have learned vast amounts about life, the world and myself. I wish it was
possible to repay them for all the lessons and love they have given me. These gifts are
priceless, but I hope, in some small way, this study on teak and resource allocation will
help people in Togo in their quest to improve their quality of life. Like a departing rusty
bush taxi on market day, the Togolese may feel that life attempts to travel on without
them, but they are running as fast as they can to keep up and climb aboard. Çava aller et