Bernhard H. Anderson Glenn Research Center, Cleveland, Ohio Daniel N. Miller Lockheed Martin Aerospace Company, Fort Worth, Texas Gregory A. Addington Wright-Patterson Air Force Base, Dayton, Ohio Johan Agrell Swedish Defence Research Agency, Bromma, Sweden Optimal Micro-Vane Flow Control for Compact Air Vehicle Inlets NASA/TM—2004-212936 February 2004 https://ntrs.nasa.gov/search.jsp?R=20040040176 2018-06-25T03:13:12+00:00Z
Transcript
Bernhard H. AndersonGlenn Research Center, Cleveland, Ohio
Daniel N. MillerLockheed Martin Aerospace Company, Fort Worth, Texas
Gregory A. AddingtonWright-Patterson Air Force Base, Dayton, Ohio
Johan AgrellSwedish Defence Research Agency, Bromma, Sweden
Optimal Micro-Vane Flow Control forCompact Air Vehicle Inlets
Since its founding, NASA has been dedicated tothe advancement of aeronautics and spacescience. The NASA Scientific and TechnicalInformation (STI) Program Office plays a key partin helping NASA maintain this important role.
The NASA STI Program Office is operated byLangley Research Center, the Lead Center forNASA’s scientific and technical information. TheNASA STI Program Office provides access to theNASA STI Database, the largest collection ofaeronautical and space science STI in the world.The Program Office is also NASA’s institutionalmechanism for disseminating the results of itsresearch and development activities. These resultsare published by NASA in the NASA STI ReportSeries, which includes the following report types:
∑ TECHNICAL PUBLICATION. Reports ofcompleted research or a major significantphase of research that present the results ofNASA programs and include extensive dataor theoretical analysis. Includes compilationsof significant scientific and technical data andinformation deemed to be of continuingreference value. NASA’s counterpart of peer-reviewed formal professional papers buthas less stringent limitations on manuscriptlength and extent of graphic presentations.
∑ TECHNICAL MEMORANDUM. Scientificand technical findings that are preliminary orof specialized interest, e.g., quick releasereports, working papers, and bibliographiesthat contain minimal annotation. Does notcontain extensive analysis.
∑ CONTRACTOR REPORT. Scientific andtechnical findings by NASA-sponsoredcontractors and grantees.
∑ CONFERENCE PUBLICATION. Collectedpapers from scientific and technicalconferences, symposia, seminars, or othermeetings sponsored or cosponsored byNASA.
∑ SPECIAL PUBLICATION. Scientific,technical, or historical information fromNASA programs, projects, and missions,often concerned with subjects havingsubstantial public interest.
∑ TECHNICAL TRANSLATION. English-language translations of foreign scientificand technical material pertinent to NASA’smission.
Specialized services that complement the STIProgram Office’s diverse offerings includecreating custom thesauri, building customizeddatabases, organizing and publishing researchresults . . . even providing videos.
For more information about the NASA STIProgram Office, see the following:
∑ Access the NASA STI Program Home Pageat http://www.sti.nasa.gov
OPTIMAL MICRO-VANE FLOW CONTROL FOR COMPACTAIR VEHICLE INLETS
ABSTRACT
The purpose of this study on micro-vane secondary flow control is to demonstratethe viability and economy of Response Surface Methodology (RSM) to optimally design micro-vane secondary flow control arrays, and to establish that the aeromechanical effects of engine facedistortion can also be included in the design and optimization process. These statistical designconcepts were used to investigate the design characteristics of “low unit strength” micro-effectorarrays. “Low unit strength” micro-effectors are micro-vanes set at very low angles-of-incidencewith very long chord lengths. They were designed to influence the near wall inlet flow over anextended streamwise distance, and their advantage lies in low total pressure loss and high effec-tiveness in managing engine face distortion. Therefore, this report examines optimal micro-vanesecondary flow control array designs for compact inlets through a Response Surface Methodology.
INTRODUCTION
The current development strategy for combat air-vehicles is directed towardsreduction in the Life-Cycle Cost (LCC) with little or no compromise to air-vehicle performanceand survivability. This strategy has been extended to the aircraft component level, in particular,the engine inlet diffuser system. One method to reduce inlet system LCC is to reduce its structuralweight and volume. Consequently, advanced combat inlet configurations are being made morecompact (or shorter) to achieve weight and volume (and LCC) reduction. However, compact S-duct diffusers are characterized by high distortion and low pressure recovery produced by extremewall curvature and strong secondary flow gradients. These characteristics are further aggravatedby maneuver conditions. The requirement to highly integrate or embed the propulsion systemoften leads to conformal inlet aperture shapes which do not lend themselves to good aerodynamicperformance. These configurations also present a challenging environment for both fan/compres-sor surge margin and aeromechanical vibration. Interest in High Cycle Fatigue (HCF) research bythe US aerospace community has been spurred by discrepancies between the expected durabilityof engine components compared to that actually experienced in the field. Recognizing that inletdistortion is a forcing function for vibration in the fan components, methods for increasing HCF
NASA/TM—2004-212936 1
Bernhard H. Anderson National Aeronautics and Space Administration
Glenn Research Center Cleveland, Ohio 44135
Daniel N. Miller
Lockheed Martin Aerospace Company Fort Worth, Texas 76101
Gregory A. Addington
Wright-Patterson Air Force Base Dayton, Ohio 45433
Johan Agrell
Swedish Defence Research Agency Bromma, Sweden SE�17290
Life Expectancy can be combined with techniques for inlet recovery and engine face distortionmanagement. Therefore, to enable acceptable performance levels in such advanced, compact inletdiffuser configurations, microscale secondary flow control methods are being developed to man-
age the recovery, distortion, and HCF aspects of these complex flow fields.(1)-(2)
One of the most difficult tasks in the design of microscale arrays for optimal inletoperation is arriving at the geometric placement, arrangement, number, size and orientation of theeffector devices within the inlet duct to achieve optimal performance. These effector devices canbe activated by either mechanical or fluidic means. This task is complicated not only by the largenumber of possible design variables available to the aerodynamicist, but also by the number ofdecision parameters that are brought into the design process. By including the HCF effects in theinlet design process, the aerodynamicist has a total of seven individual response variables whichmeasure various aspect of inlet performance. They include the inlet total pressure recovery, theinlet total pressure recovery distortion at the engine face and the first five Fourier harmonic 1/2amplitudes of distortion. Each of these responses need to be either maximized, minimized, con-strained or unconstrained while searching for the optimal combination of primary design variablevalues that satisfy the mission requirements. The design task is further complicated by the exist-ence of hard-to-control factors which effect inlet performance, i.e. the mission variables. Thedesign of inlet systems is usually accomplished at the cruise condition (the on-design condition)while variations from the cruise condition are considered as an off-design penalty. The missionvariables that cause the off-design penalty are, for example, inlet throat Mach number (enginecorrected weight flow), angle-of-incidence and angle-of-yaw. Numerical optimization proceduresthat have been successful with some aerodynamic problems give little assistance to the design ofmicroscale secondary flow arrays. It is very difficult to incorporate large numbers of independentdesign and response variables into such procedures. Further, they are very expensive to use if theindividual Computational Fluid Dynamics (CFD) experiments are solutions to the full Navier-Stokes equations in three dimensions. However, there is a statistical approach to the problemwhich combines an optimally sequenced pattern of Design-of-Experiments (DOE), statisticalmodel building, and system optimization called Response Surface Methodology (RSM). It is ide-ally suited to the design of micro-vane arrays for optimal inlet performance, particularly whenmultiple design objectives are present.
In the 1950s and 1960s, Box(3)-(4) and co-workers developed a collection of analyt-ical and statistical experimental design tools for which the term Response Surface Methodology(RSM) was coined. RSM provides an economical, reliable and systematic approach to variablescreening as well as the general exploration of the region that contains the estimated optimal con-ditions. As a result, the pragmatic use of RSM places a high priority on obtaining a better under-standing of the process system as well as estimating the optimum conditions. In the design ofmicroscale secondary flow arrays for inlets, it is just as important to understand and quantify thebehavior of the design parameters in the neighborhood of the optimal conditions as to know theoptimal conditions. Hence, an RSM approach is particularly beneficial for the design of micro-vane arrays since there are a great many design variables available to the aerodynamicist, andoften there exists multiple design objectives. Another critical aspect of RSM is its ability to studystatistical interactions among the design variables. These interactions often indicate a potential forachieving a robust control factor combination. A robust control factor combination is one forwhich variations in the individual factors has minimal effect on the response variables. Therobustness increases as the tolerable variation in the design factors increases.
NASA/TM—2004-212936 2
A statistical interaction exists between two independent factor variables X1 andX2 when the effect of X1 on response Yi is affected by the value of X2. In other words, the effectof factor X1 on response Yi is not unique, but changes as a function of factor X2. This is oftencalled a synergistic effect, and it is very important in micro-vane array design. In addition, it isoften desirable in inlet design to satisfy several objectives at one time. For example, in designingan inlet for HCF considerations, it may be desirable to determine the combination of factor set-tings that maximize inlet total pressure recovery, minimize engine face distortion, and constrain aparticular Fourier harmonic 1/2 amplitude of distortion to a given safe value at the natural reso-nance frequency of the engine fan blades. However, since the resonance frequency of the engineblades is not generally known, the desired design goal may be to collectively reduce all the Fou-rier harmonic 1/2 amplitudes of engine face distortion.
In this research study on micro-vane flow control, three objectives were consideredimportant, namely: (1) to determine the design characteristics of micro-vane secondary flow con-trol arrays, (2) to establish the ability of micro-vanes to manage the aeromechanical effects ofengine face distortion, and (3) to evaluate the effectiveness of robust parameter design methodolo-gies for high performance “open loop” micro-vane arrays designs over a range of throat Machnumbers and angle-of-incidences. This report covers the first two research objectives while
Anderson, Baust, and Agrell(5) covers the third objective and describes a design methodologywhereby the hard-to-control mission variables are explicitly included in the design of optimalrobust micro-vane arrays.
NOMENCLATURE
AIP Aerodynamic Interface Planec Effector Chord LengthCCF Central Composite Face-CenteredCFD Computational Fluid DynamicsD Engine Face DiameterDC60 Circumferential Distortion DescriptorDOE Design of Experimentsh Effector Blade HeightHCF High Cycle FatigueFk/2 kth Fourier Harmonic 1/2-AmplitudeFM/2 Mean Fourier Harmonic 1/2-AmplitudeL Inlet Diffuser LengthLCC Life Cycle CostsMSFC microscale Secondary Flow ControlMt Inlet Throat Mach Numbern Number of Effector Vanes per BandPFAVE Average Inlet Total Pressure at AIPPAVCRIT Minimum Total Pressure over Critical Sector Angle at AIPQAVE Average Dynamic Pressure at AIPR Inlet RadiusRcl Centerline RadiusRef Engine Face RadiusRthr Inlet Throat Radius
NASA/TM—2004-212936 3
ROC Robust Optimization ConceptsRe Reynold Number per ft.RSM Response Surface MethodologyS Standard DeviationSclock Standard Deviation over the Rake Clocking AnglesUAV Unmanned Air VehicleUCAV Unmanned Combact Air VehicleXcl Axial Distance Along the Duct CenterlineYA Upper 95% Confidence Interval Predicted by DOE AnalysisYCFD Response Predicted by CFD AnalysisYDOE Response Predicted by DOE AnalysisYi,j Generalized Response VariableZcl Centerline Offset Displacementα Inlet Angle-of-Incidence∆Zcl Inlet Centerline Offset
RESULTS AND DISCUSSION
Baseline Flow in the Redesigned M2129 Inlet S-Duct
The redesigned M2129 inlet S-duct used in this study was considered similar to the
original DERA/M2129 inlet S-duct defined by AGARD FDP Working Group 13 Test Case 3,(6)
using Lip No. 3 and Forward Extension No. 2. This inlet design was first proposed by Willmer,
Brown and Goldsmith,(7) and has been used extensively in the US and UK to explore inlet flowcontrol array design. The centerline for the redesigned M2129 inlet is given by the equation
(1)
The radius distribution measured normal to the inlet centerline is given by the expression
(2)
where inches, inches, inches, and inches.
The redesign of the M2129 inlet was such that the new inlet matches the static pressure gradientsnormally found in typical UAV or UCAV designs. Therefore, the new inlet is more compact thanthe original M2129 inlet S-duct. As a consequence, supersonic flow will develop in this inletwhen the inlet throat Mach number increases much above 0.70. The geometry and grid structure
for the resigned M2129 inlet S-duct is described in detail in Anderson, Baust, and Agrell.(5).Traditionally, this type of compact inlet duct would be excluded from design con-
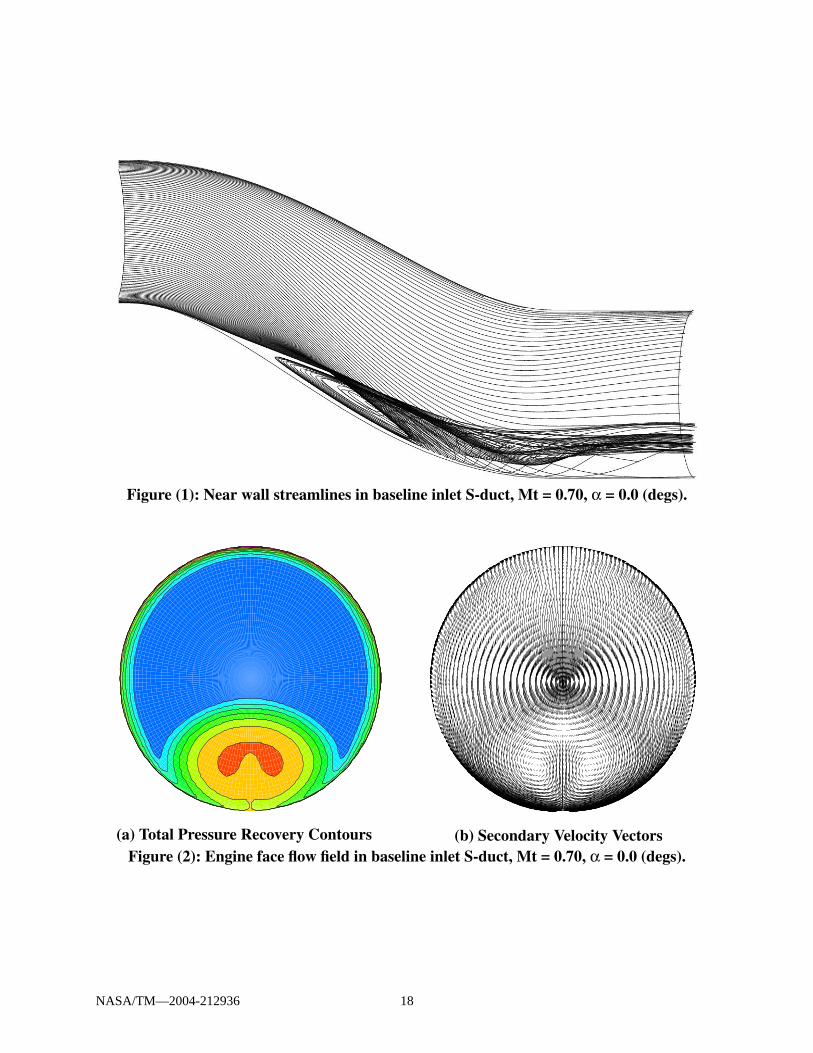
sideration since it is characterized by severe wall curvature that induces strong secondary flows.These strong secondary flow can cause a flow separation called vortex lift-off. See Figure (1).
Zcl
∆Zcl
2----------- 1 π
Xcl
L--------⋅
cos– –=
Rcl Rthr–
Ref Rthr–------------------------
3 1Xcl
L--------–
4
4 1Xcl
L--------–
3
– 1+=
Rthr 2.5355= Ref 3.0= L 15.0= ∆Zcl 5.7809=
NASA/TM—2004-212936 4
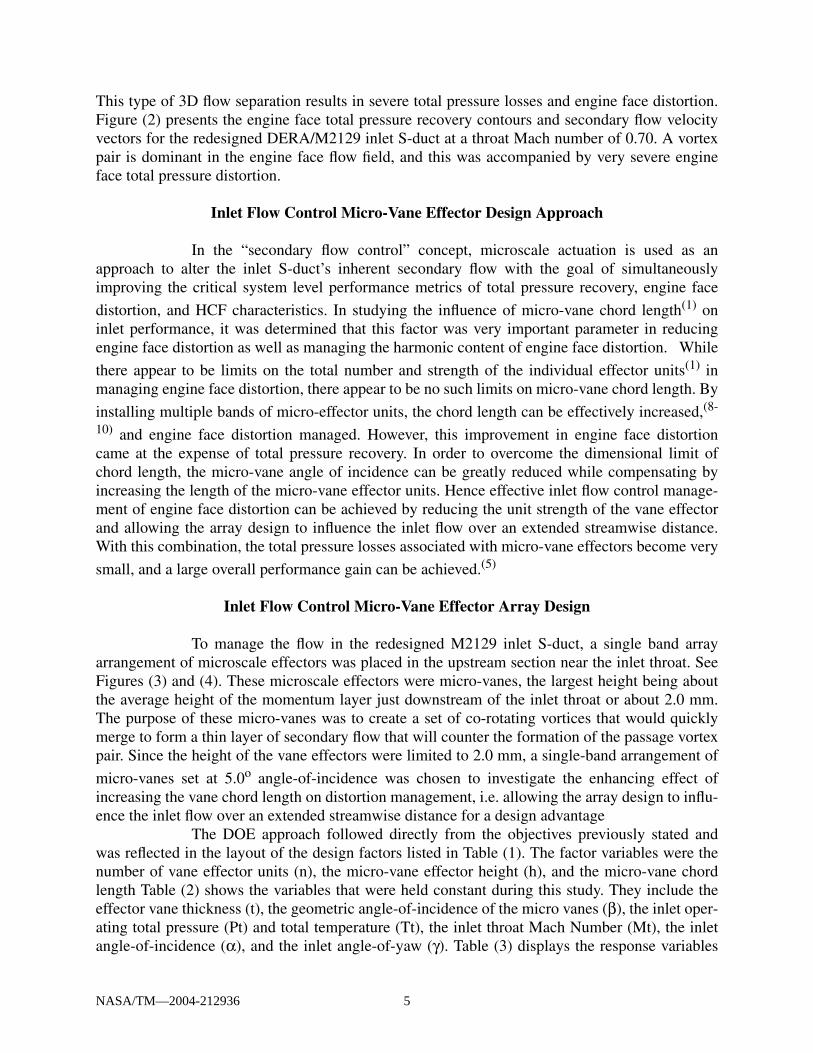
This type of 3D flow separation results in severe total pressure losses and engine face distortion.Figure (2) presents the engine face total pressure recovery contours and secondary flow velocityvectors for the redesigned DERA/M2129 inlet S-duct at a throat Mach number of 0.70. A vortexpair is dominant in the engine face flow field, and this was accompanied by very severe engineface total pressure distortion.
Inlet Flow Control Micro-Vane Effector Design Approach
In the “secondary flow control” concept, microscale actuation is used as anapproach to alter the inlet S-duct’s inherent secondary flow with the goal of simultaneouslyimproving the critical system level performance metrics of total pressure recovery, engine face
distortion, and HCF characteristics. In studying the influence of micro-vane chord length(1) oninlet performance, it was determined that this factor was very important parameter in reducingengine face distortion as well as managing the harmonic content of engine face distortion. While
there appear to be limits on the total number and strength of the individual effector units(1) inmanaging engine face distortion, there appear to be no such limits on micro-vane chord length. By
installing multiple bands of micro-effector units, the chord length can be effectively increased,(8-
10) and engine face distortion managed. However, this improvement in engine face distortioncame at the expense of total pressure recovery. In order to overcome the dimensional limit ofchord length, the micro-vane angle of incidence can be greatly reduced while compensating byincreasing the length of the micro-vane effector units. Hence effective inlet flow control manage-ment of engine face distortion can be achieved by reducing the unit strength of the vane effectorand allowing the array design to influence the inlet flow over an extended streamwise distance.With this combination, the total pressure losses associated with micro-vane effectors become very
small, and a large overall performance gain can be achieved.(5)
Inlet Flow Control Micro-Vane Effector Array Design
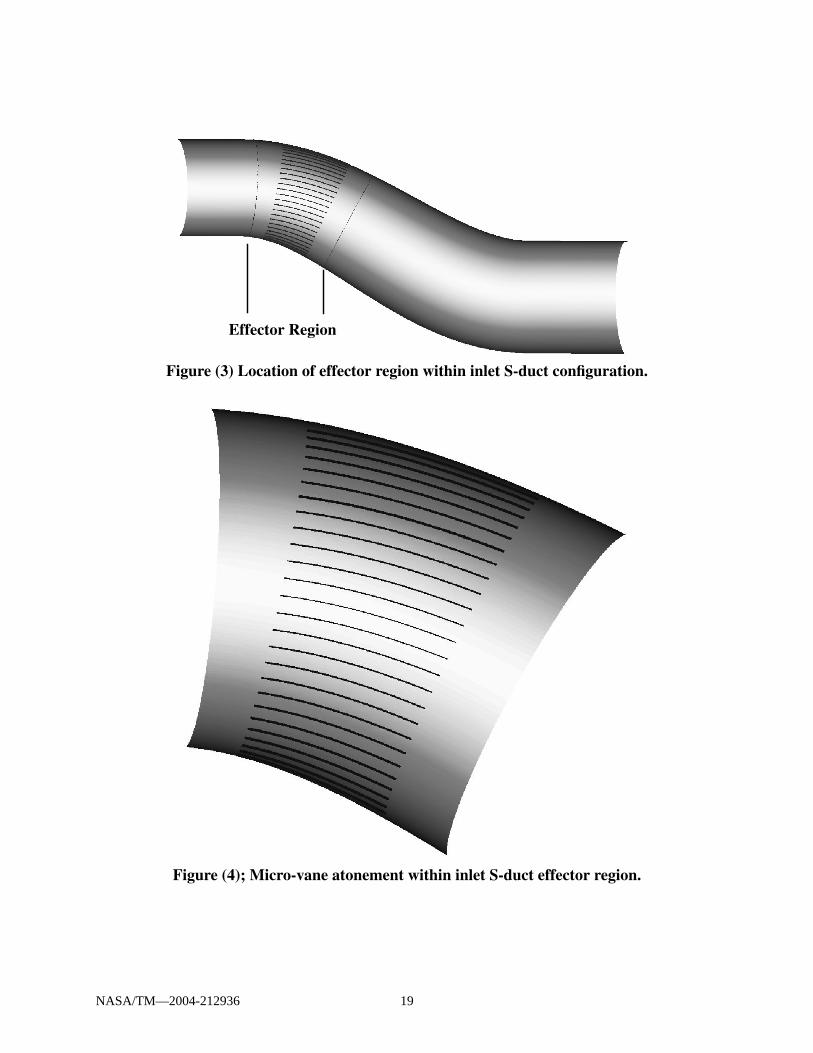
To manage the flow in the redesigned M2129 inlet S-duct, a single band arrayarrangement of microscale effectors was placed in the upstream section near the inlet throat. SeeFigures (3) and (4). These microscale effectors were micro-vanes, the largest height being aboutthe average height of the momentum layer just downstream of the inlet throat or about 2.0 mm.The purpose of these micro-vanes was to create a set of co-rotating vortices that would quicklymerge to form a thin layer of secondary flow that will counter the formation of the passage vortexpair. Since the height of the vane effectors were limited to 2.0 mm, a single-band arrangement of
micro-vanes set at 5.0o angle-of-incidence was chosen to investigate the enhancing effect ofincreasing the vane chord length on distortion management, i.e. allowing the array design to influ-ence the inlet flow over an extended streamwise distance for a design advantage
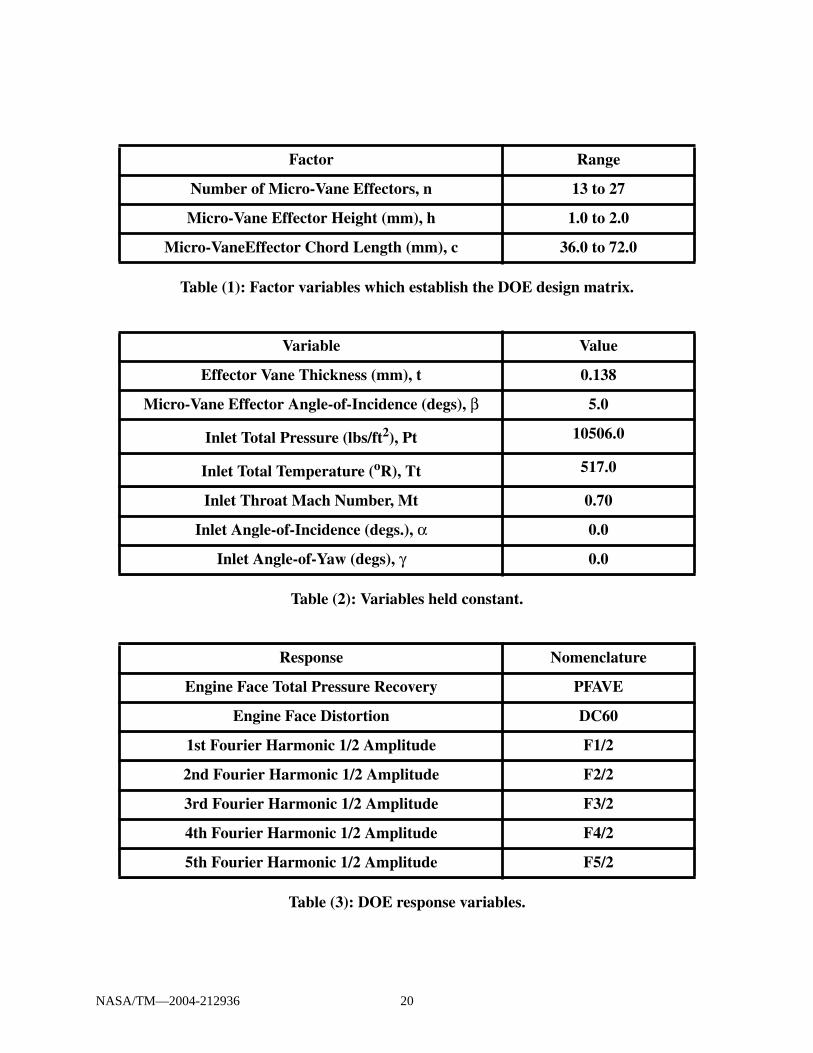
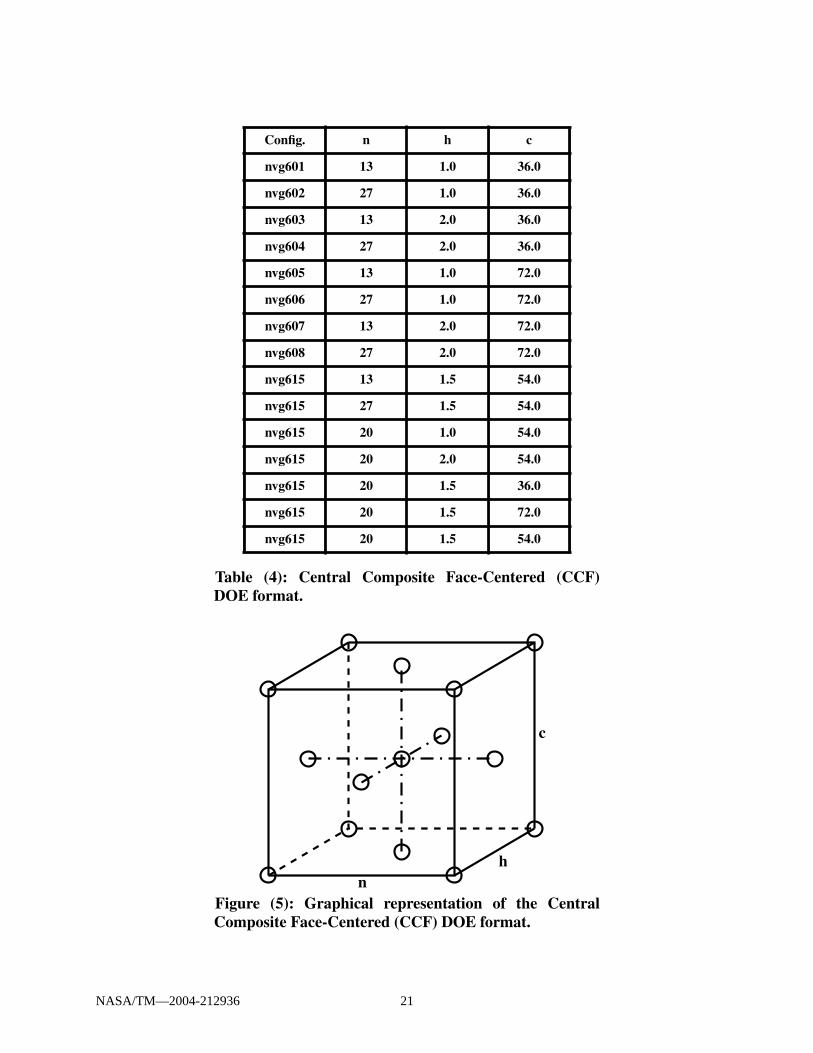
The DOE approach followed directly from the objectives previously stated andwas reflected in the layout of the design factors listed in Table (1). The factor variables were thenumber of vane effector units (n), the micro-vane effector height (h), and the micro-vane chordlength Table (2) shows the variables that were held constant during this study. They include theeffector vane thickness (t), the geometric angle-of-incidence of the micro vanes (β), the inlet oper-ating total pressure (Pt) and total temperature (Tt), the inlet throat Mach Number (Mt), the inletangle-of-incidence (α), and the inlet angle-of-yaw (γ). Table (3) displays the response variables
NASA/TM—2004-212936 5
for this study. They include the inlet total pressure recovery (PFAVE), the engine face distortion(DC60), and the first five Fourier harmonic 1/2-amplitudes of engine face distortion (F1/2, F2/2,F3/2, F4/2, and F5/2).
The DOE strategy selected was a Central Composite Face-Centered (CCF) DOE.This strategy resulted in 15 unique CFD experimental cases that are shown in Table (4). This par-ticular DOE, like most DOE strategies, varied more than one factor at a time. Further, this layoutof 15 cases permitted the estimation of both linear and curvilinear effects as well as two-factorinteractive or synergistic effects among the DOE factors. This CCF DOE strategy is superior tothe traditional approach of changing one variable at a time because that approach does not permitthe estimation of the two-factor interactions.
A graphical representation of the Central Composite Face-Centered DOE used inthe study is presented in Figure (5). The DOE cases are represented in this figure by the circularsymbols, where the symbol locations on the cube signify the factor values. This DOE is called acomposite DOE because the cases are composed of a fractional factorial part and a quadratic part.
The full-fractional factorial part of the DOE is composed of the 23 or 8 cases which are repre-sented by the eight corner locations on the cube in Figure (5). The remaining cases in Figure (5)are the quadratic part of the DOE. These cases allow for the evaluation of the curvilinear effects.All together, there are a total of 15 cases in a Central Composite Face-Centered DOE with threefactor variables. Notice the balanced layout of cases in Figure (5). This layout of cases representsthe smallest number of CCF DOE cases that allows for the evaluation of linear and curvilineareffects as well as all two-factor interactive or synergistic effects.
Each of the 15 cases in Table (4) was run with a Reynolds-averaged Navier-Stokes
code(11) that allowed for numerical simulation of micro-vane effectors without the need to physi-cally embed the vane effectors within the CFD grid structure. However, for the present study theindividual vanes were incorporated into the half cylindrical grid structure. The micro-vanes allhad a thickness of 0.138 mm. See Table (2). The computational grid surrounding the micro-vaneswas developed such that it reasonably resolved the boundary layer development on both the suc-tion and pressure surfaces of each micro-vane in the array. Because wall functions were used inthe calculations, the grid resolution for the individual micro-vanes was simplified. However, theboundary layer along the micro-vane edges was assumed to be negligible, and therefore notresolved in the computational grid. The half cylindrical grid structure was composed of threeblocks: an upstream block, an effector section containing the micro-vanes, and a downstreamblock. See Figures (3) and (4). The computational half-plane grid varied in total number of meshpoints from about 950,000 to 1,150,000 depending on the micro-vane configuration. All CFD cal-culations were accomplished assuming half cylindrical symmetry. A two-equation k-l turbulencemodel was used in this study. The model consists of a transport equation for the turbulent kineticenergy and turbulent length scale. This model also includes a near-wall model and compressiblecorrections for high speed flows.
Harmonic Analysis of Distortion
The overall methodology used to obtain the harmonic content of inlet distortion
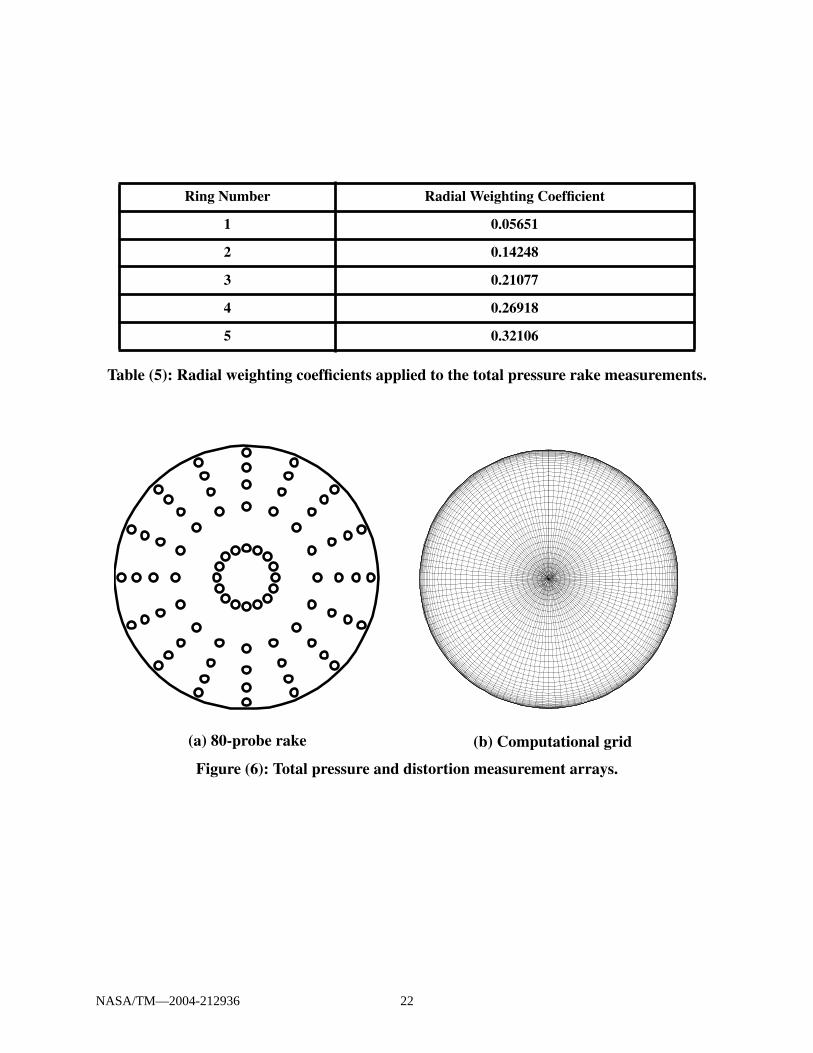
was first proposed by Ludwig(12) . This methodology is characterized by the use of radial weight-ing factors applied to the total pressure rake measurements. The radial weighting factors areshown in Table (7).These radial weighting factors compress the rake information to a single radius
NASA/TM—2004-212936 6
ring of data samples, where the number of data samples corresponds to the number of arms of the
measurement rake. A separate study was initiated by Anderson and Keller(13) to evaluate theimpact of rake geometry (specifically the number of rake arms) on the measurement error associ-ated with estimating the first five Fourier harmonic 1/2-amplitudes of engine face distortion. As aresult of that study, the rake and methodology chosen for this study was the 80-probe “clocked”AIP rake because it provided the lowest error in estimating the first five Fourier harmonic 1/2-amplitudes of engine face distortion. Clocking the AIP rake means that N separate measurementswere taken, and at each separate measurement, the angular orientation of the rake was advanced
by an amount 1/N times the rake angle. The rake angle is the ratio of 360o divided by the numberof arms in the AIP rake. For example, a standard 80-probe rake has 16-arms. Hence the rake angle
is 22.5o. Therefore total pressure measurements were obtained at each 22.5o/N angular position ofthe rake. Using the AIP instrumentation locations for the 80-probe rake, the 15 CFD solutionswere interpolated at each of the probe positions shown in Figure (6a). The span-weighted averagetotal pressure was calculated for the 80-probe rake by multiplying the probe total pressure by thespan-weighted coefficients from Table (5), and adding the results over the five probes of the rakesto form a single radius ring of data samples.
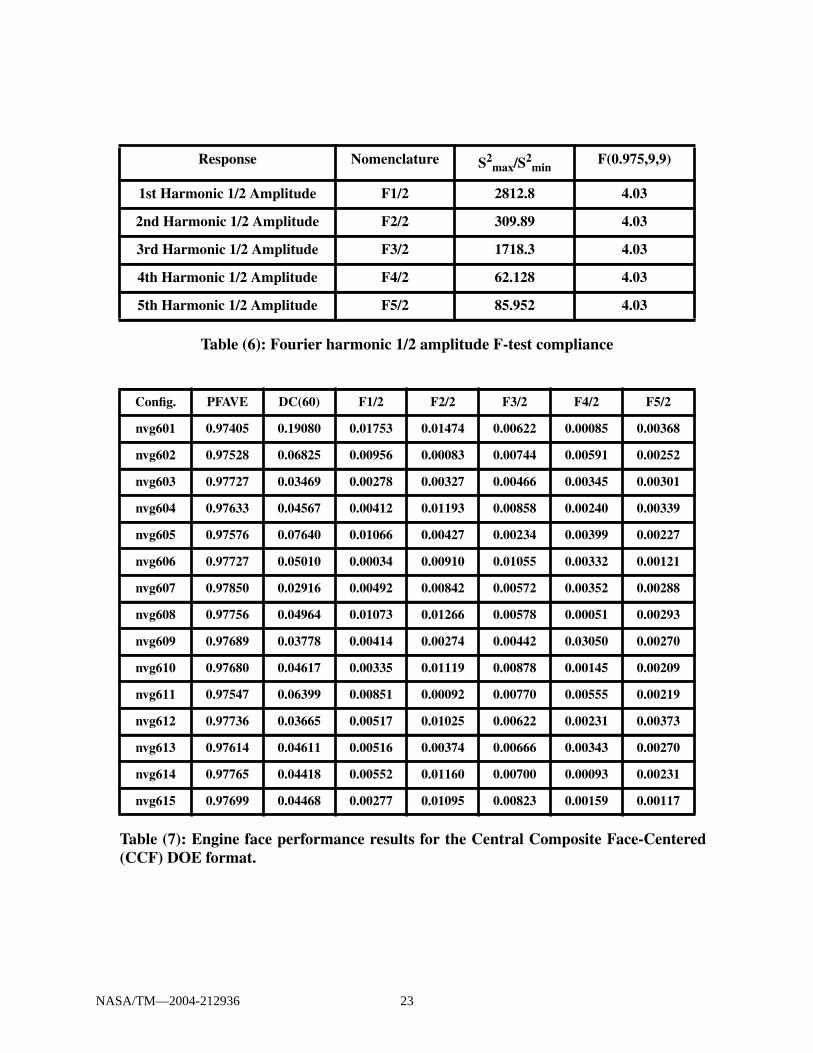
Since the rake at the engine face was “clocked”, a complete set of “repeats” wasgenerated at each experimental run in Table (4). From the engine face patterns at each of the 10clocking angles, a Fourier analysis was performed on the sample set of data and a standard devia-tion of the “repeats”, Sclock, was determined for each of the Fourier harmonic 1/2-amplitudes. Inorder to check the constant variance assumption associated with least square regression, a simpleF-test for comparing the minimum standard deviation to the maximum standard deviation (F =
S2max/S2
min) was conducted for each of the five responses. The results are presented in Table (6).Since each F-test exceeded the 95% confidence critical value of F(0.975,9,9) = 4.03, the assump-tion of constant variance across the design space had to be discarded. This meant that a regressiontechnique known as weighted least squares regression had to be employed for analyzing the 10 x
15 = 150 data samples in the DOE. The weights in these regression analyses were set to 1/S2clock.
The data reduction for the inlet total pressure recovery and engine face distortiondiffered greatly from the harmonic analysis of distortion described. There exists no recognizedmethodology to evaluate the Fourier harmonic 1/2-amplitudes of engine face distortion for morethan five probes in the radial direction. Hence, evaluating the Fourier harmonic 1/2-amplitudedirectly from the computational mesh had to be discarded. However, both the inlet total pressurerecovery and engine face distortion can and were calculated directly from the computational gridat the engine face station. This computational mesh was composed of 49 x 121 grid points in thefull-plane. The DC60 engine face distortion descriptor is defined such that it can be determined
from either a computational grid or a standard measurement rake.(14) It is the only recognized dis-tortion descriptor that has this property, and hence, was chosen for this study. The DC60 engineface distortion descriptor is a measure of the difference between the engine face or AIP averagetotal pressure (PFAVE) and the lowest average total pressure in any sector defined by a critical
angle of 60o (PAVCRIT), divided by the average dynamic pressure at the engine (AIP) face.Hence,
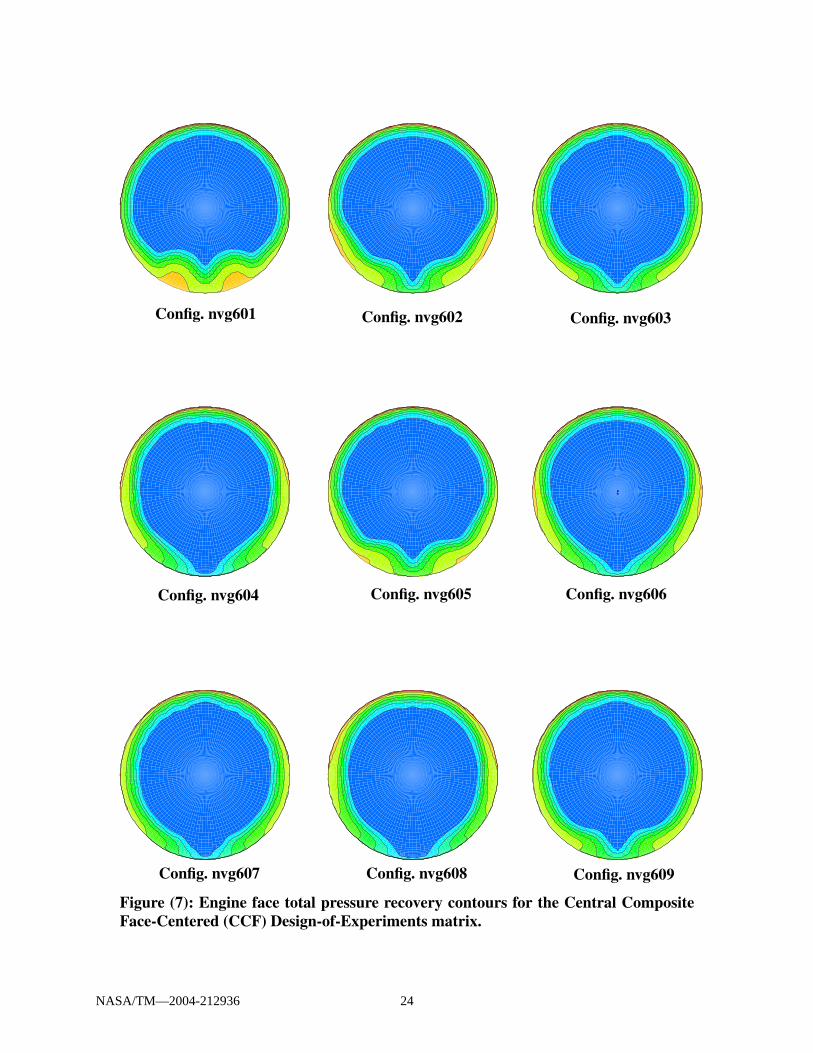
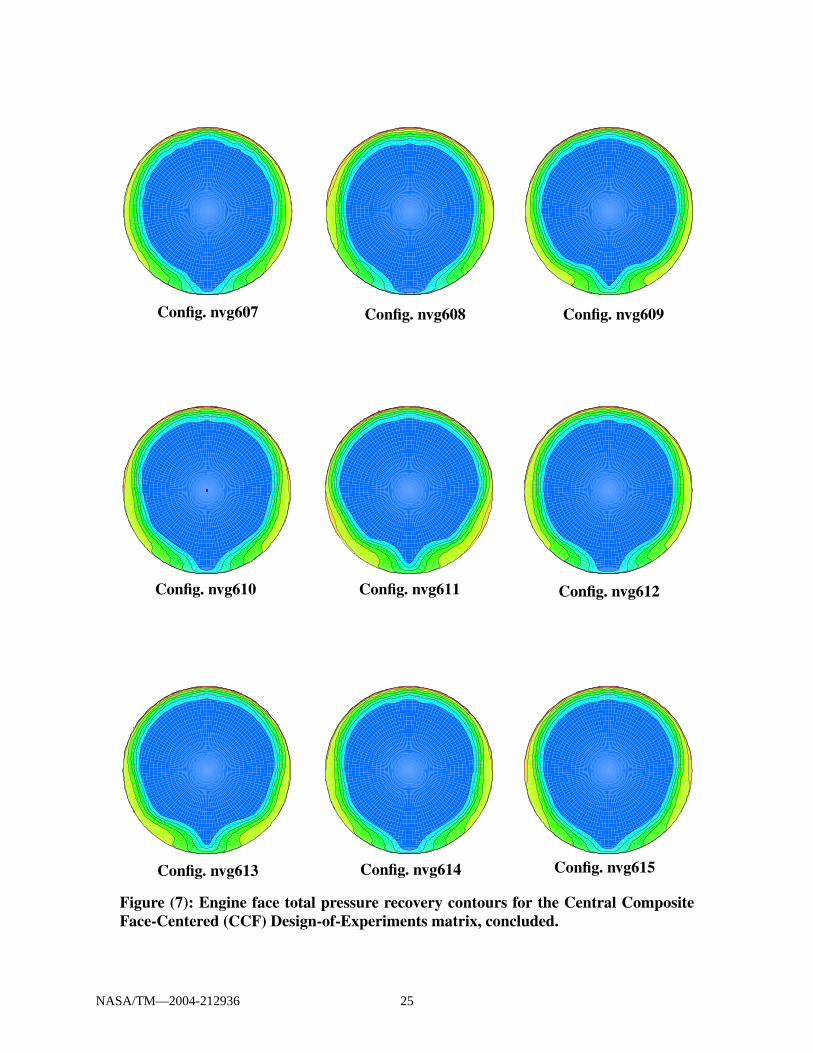
The CFD performance results for the Central Composite Face-Centered DOE for-mat involving the factor (design) variables are presented in Table (7). The inlet recovery (PFAVE)and the engine face distortion (DC60) were determined from the computation mesh. The Fourierharmonics 1/2-amplitudes of engine face distortion listed in Table (7) were determined from a“clocked” engine face rake and are the mean values over the 10 clocking angles. However, thesevalues were not used in the regression analysis since weighted regression were required as a resultof a lack of constant variance across the design space. Instead, the complete set of 10 x 15 = 150values together with their corresponding weighting factors were used in the weighted regressionto obtain the response surfaces for each of the Fourier harmonic 1/2-amplitudes of distortion. Theengine face total pressure recovery contours for the Central Composite Face-Centered DOEshown in Table (7) is presented in Figure (7).
Interactions Between the Factor Variables
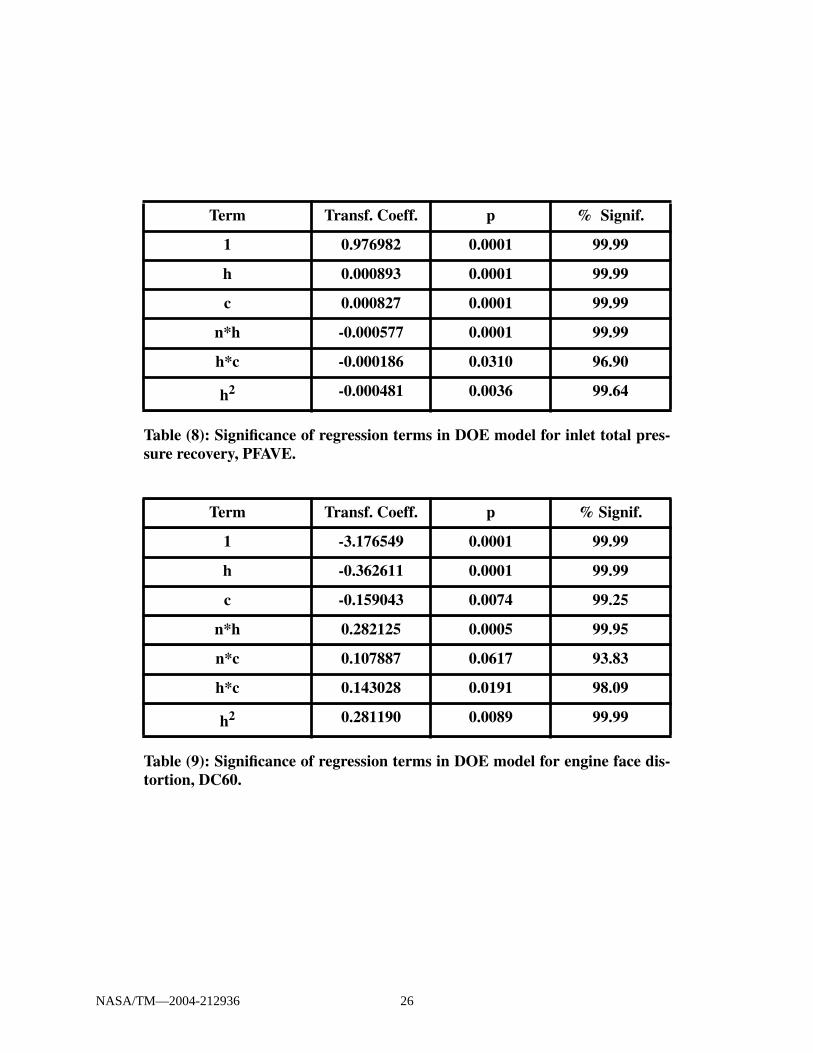
The significant terms in the DOE regression model for inlet total pressure recovery(PFAVE) are shown in Table (8), while the significant terms in the DOE regression model for theengine face distortion (DC60) are show in Table (9). There were two important two-factor interac-tions identified for inlet total pressure recovery regression model and three important two-factorinteractions identified for the DC60 distortion regression model. See Tables (8) and (9). For inlettotal pressure recovery, the (n*h) and (h*c) were considered as being significant, while the (n*h),(n*c) and (h*c) two-factor interaction where revealed to be important for the engine face distor-tion regression model. Each p-value listed on Tables (8) and (9) is defined as the probability ofobserving an absolute t-value that is greater than one calculated when there is no effect present.The regression models listed in Tables (8) and (9) were obtained from a backward elimination.Backwards elimination begins with the full model and deletes or eliminates the least significantterm in the model until all terms left in the model are statistically significant. In the models listedin Tables (8) and (9), all terms with a significant level were retained. The relationship
between and % is given by the expression:
% (4)
Therefore, the DOE regression model only includes terms that are statistically significant.A statistical interaction exists between two independent factor variables X1 and
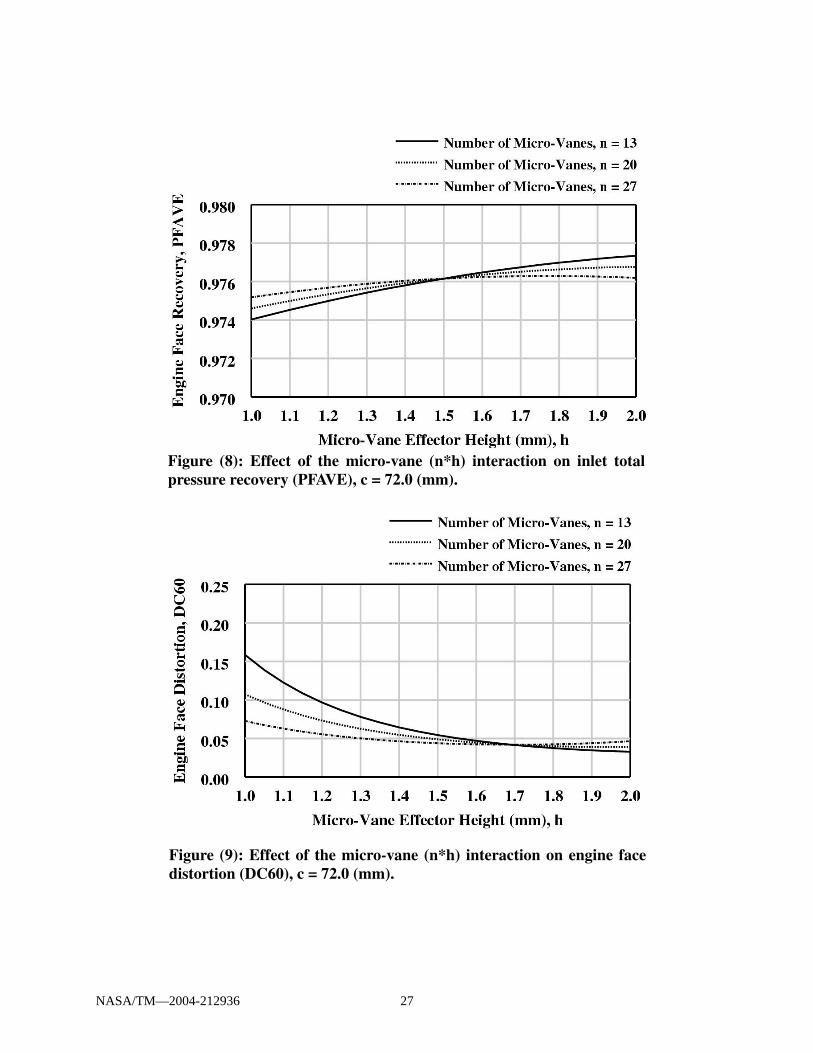
X2 when the effect of X1 on response Yi is affected by the value of X2. In other words, the effectof factor X1 on response Yi is not unique, but changes as a function of factor X2. For example,Figures (8) and (9) presents the inlet performance metrics PFAVE and DC60 as a function of themicro-vane effector height (h) at three levels of the number of micro-vane effectors (n). However,the rate of increase of PFAVE and the rate of decrease of DC60 as a function of micro-vane effec-tor height (h) depended on the number of micro-vane effectors (n). See Figures (8) and (9). Infact, the (n*h) interaction for both PFAVE and DC60 are considered strong interactions. At amicro-vane effector height (n) of 1.0 mm, the recovery increases with increasing number ofmicro-vane effectors (n), while the DC60 engine face distortion deceases with increasing numberof micro-vane effectors (n). However, at a micro-vane effector height (n) of 2.0 mm, these trendsare reverse for both inlet pressure recovery (PFAVE) and engine face distortion (DC60).
p 0.10≤p Signif
Signif 100.0 1.0 p–( )=
NASA/TM—2004-212936 8
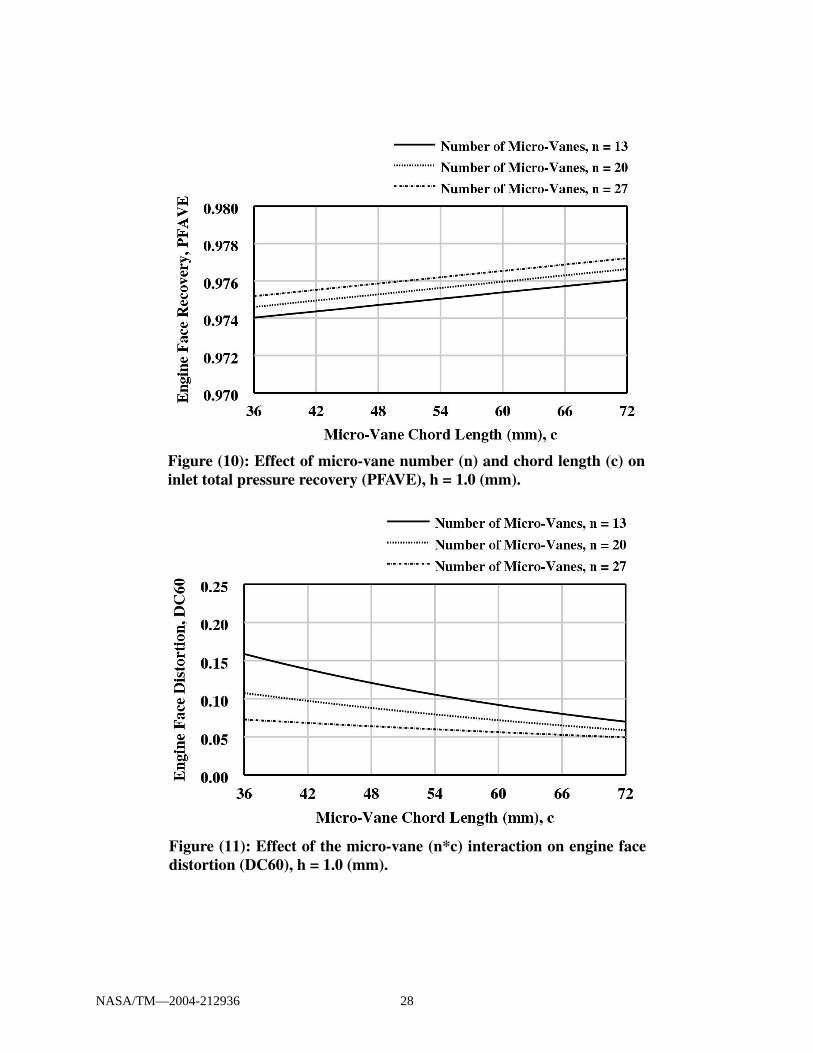
Presented in Figures (10) and (11) are the effects of micro-vane chord length (c) oninlet total pressure recovery and engine face distortion respectively for three levels of the numberof micro-vane effectors (n). Since the functional relationship between PFAVE and (c) differedonly by an additive constant between the three levels of (n), there was no significant (n*c) statisti-cal interaction for the inlet total pressure recovery (PFAVE). This is substantiated in Table (8).However, there was a (n*c) statistical two-way interaction for the DC60 engine face distortionresponse variable. See Figure (11). The rate of decrease of DC60 engine face distortion as a func-tion of micro-vane chord length (c) changes as the number of micro-vane effectors (n) wereincreased.
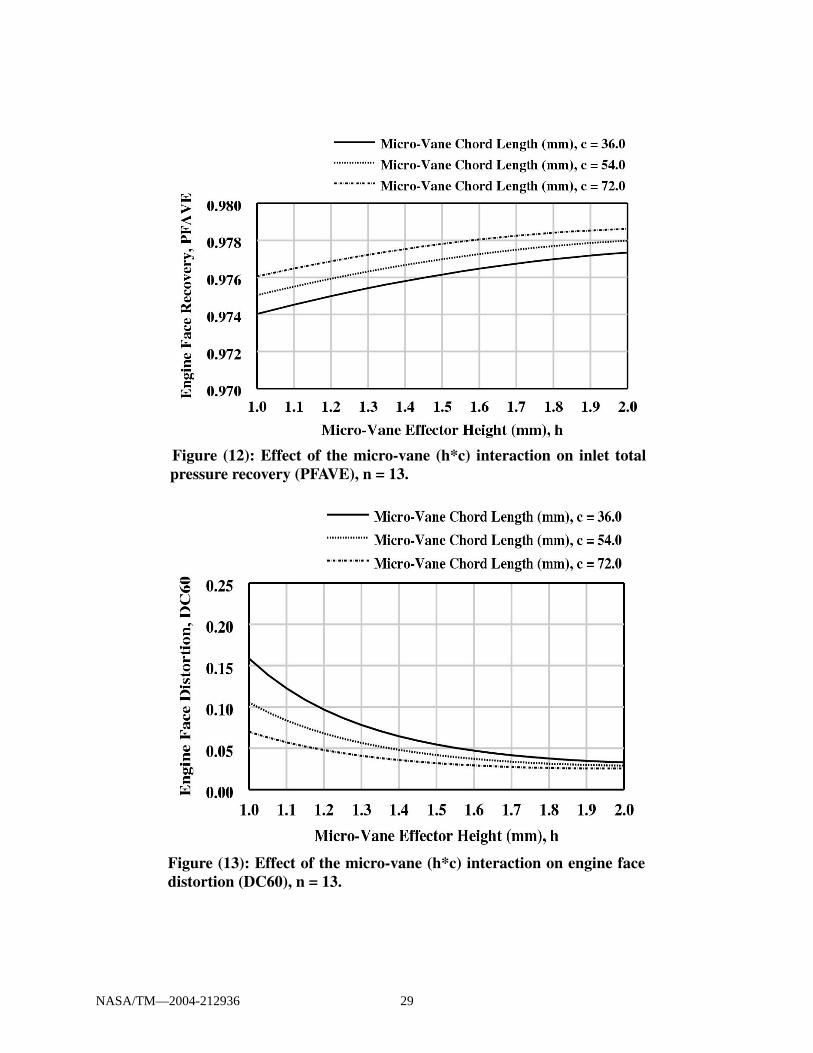
The two-factor (h*c) statistical interaction that were indicated in Tables (8) and (9)was also observed in Figures (12) and (13) for both inlet total pressure recovery and DC60 engineface distortion. The amount of variations caused by the (h*c) two-way interaction for engine facedistortion were about the same as the (n*h) interaction presented in Figures (9).
Optimal Flow Control for Three Missions
To illustrate the potential of RSM to select an optimal micro-vane array design,three mission strategies were considered for the subject inlet, namely (1) Maximum Performance,(2) Maximum Engine Stability, and (3) Maximum HCF Life Expectancy. The Maximum Perfor-mance mission minimized the inlet total pressure losses, the Maximum Engine Stability missionminimized the engine face distortion, while the Maximum HCF Life Expectancy mission mini-mized the mean of the first five Fourier harmonic amplitudes, i.e. “collectively” reduced all theharmonic 1/2-amplitudes of engine face distortion. Each of the mission strategies was subject to alow engine face distortion constraint, i.e. DC60 < 0.10, which is a level acceptable for commercialengines, and a constraint on each individual Fourier harmonic 1/2-amplitudes: Fk/2 < 0.015, k =1,2...5.
Maximum Performance Mission - To obtain the Optimal Maximum Performancearray design, a search was made of the factor design space to locate the factor combination thatminimized the inlet duct losses:
(5)
subject to the constant that
(6)
and that the individual Fourier harmonic 1/2-amplitudes of engine face distortion were each con-strained to
(7)
Maximum Engine Stability Mission - In a like manner, the Optimal MaximumEngine Stability array design was obtained through a search process over the factor design spaceto locate the factor combination that minimized decision parameter:
Y 1.0 PFAVE–( )=
DC60 0.10≤
Fk2
------ 0.015≤
NASA/TM—2004-212936 9
(8)
subject to the condition that the individual Fourier harmonic 1/2-amplitudes of engine face distor-tion were each constrained to
(9)
while the total pressure recovery (PFAVE) was unconstrained.Maximum HCF Life Expectancy Mission -The Optimal Maximum HCF Life
Expectancy MSFC array was determined through a search process over the factor variable spaceto locate that array geometry that minimized the mean of the first five Fourier harmonic 1/2-amplitudes of distortion, i.e
(10)
subject to the constant that
(11)
and that the individual Fourier harmonic 1/2-amplitudes of engine face distortion were each con-strained to
(12)
while the total pressure recovery (PFAVE) was unconstrained in the search procedure.
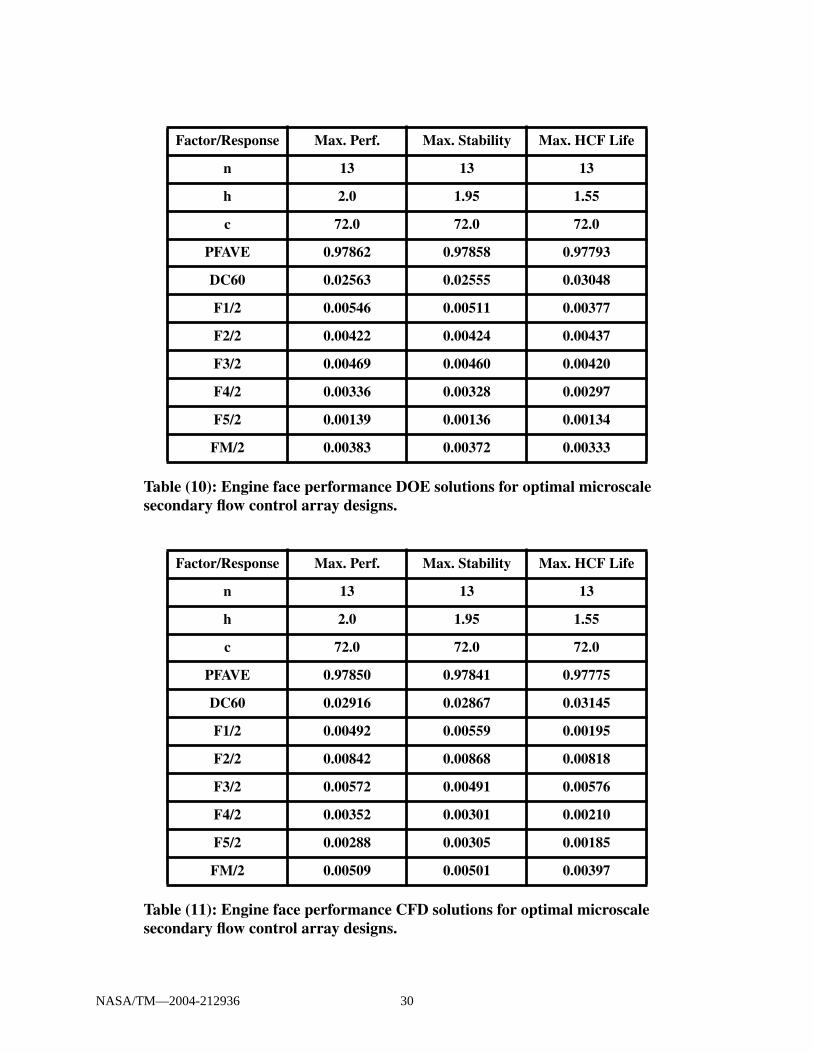
Comparison of the Optimal Array Designs
Presented in Table (10) are the results of the search process over the factor designspace for the three missions, i.e. the Maximum Performance, the Maximum Engine Stability, andthe Maximum HCF Life expectancy, to arrive at the optimal array designs as predicted by theDOE regression model., A series of three CFD validation cases listed in Table (1) were run usingthe optimal factor combinations determined by the DOE regression models. The CFD engine faceperformance results are presented in Table (11). Therefore, Tables (10) and (11) present the opti-mal engine face performance results for each of the three missions as determined from the DOEpredictions and by the CFD analyses. Seven response variables are listed in Tables (10) and (11).They include the inlet total pressure (PFAVE), the engine face distortion (DC60), the first fiveFourier harmonic 1/2 amplitudes of distortion (F1/2, F2/2, F3/2, F4/2, F5/2). The mean of the firstfive Fourier harmonic 1/2 amplitudes of distortion (FM/2) was determined from the expression:
Y DC60( )=
Fk2
------ 0.015≤
Y15--- Fk
2------
k 1=
5
∑=
DC60 0.10≤
Fk2
------ 0.015≤
NASA/TM—2004-212936 10
(13)
Comparisons of the performance of the three “Optimal Robust” array designs, i.e.the Maximum Performance, Maximum Engine Stability, and Maximum HCF Life Expectancymission designs listed in Tables (10) and (11) indicates that performance of the three optimalarray designs are remarkably similar. It is also true that the performance predicted by the DOEregression is also remarkably similar to the CFD analysis for each of the missions. This visualsimilarity will be studied objectively in the section entitled “Statistical Comparison of the CFDAnalysis and DOE Predictions”.
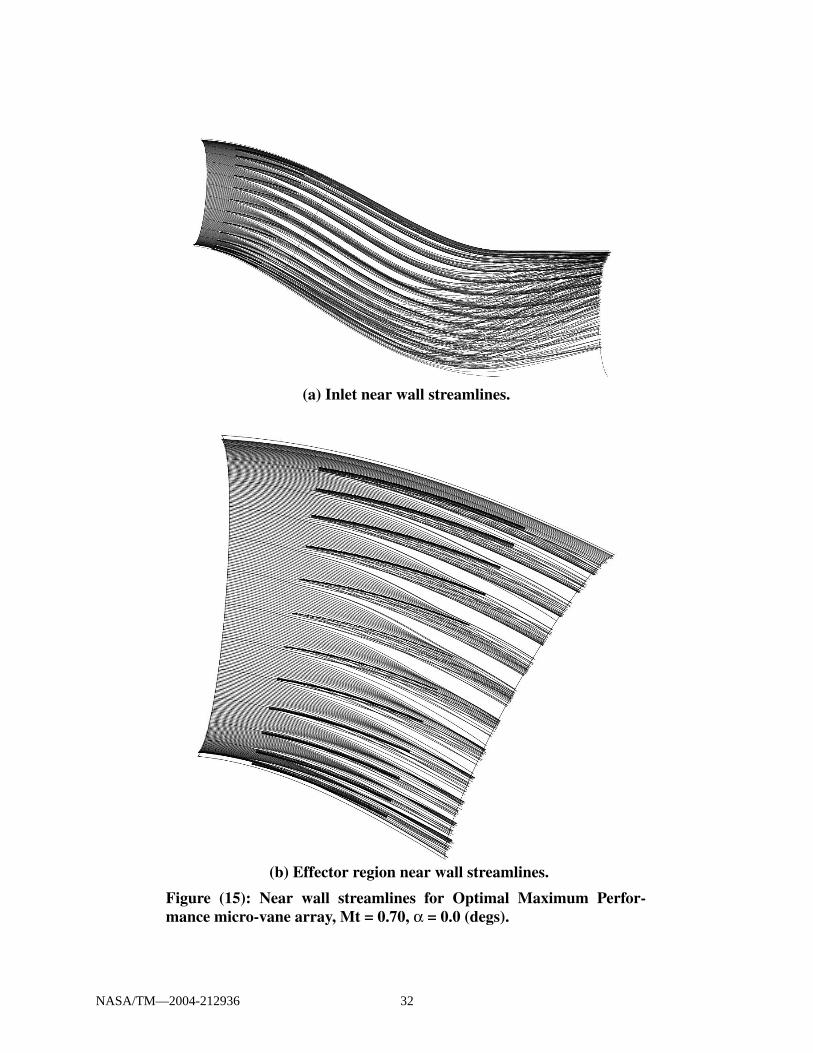
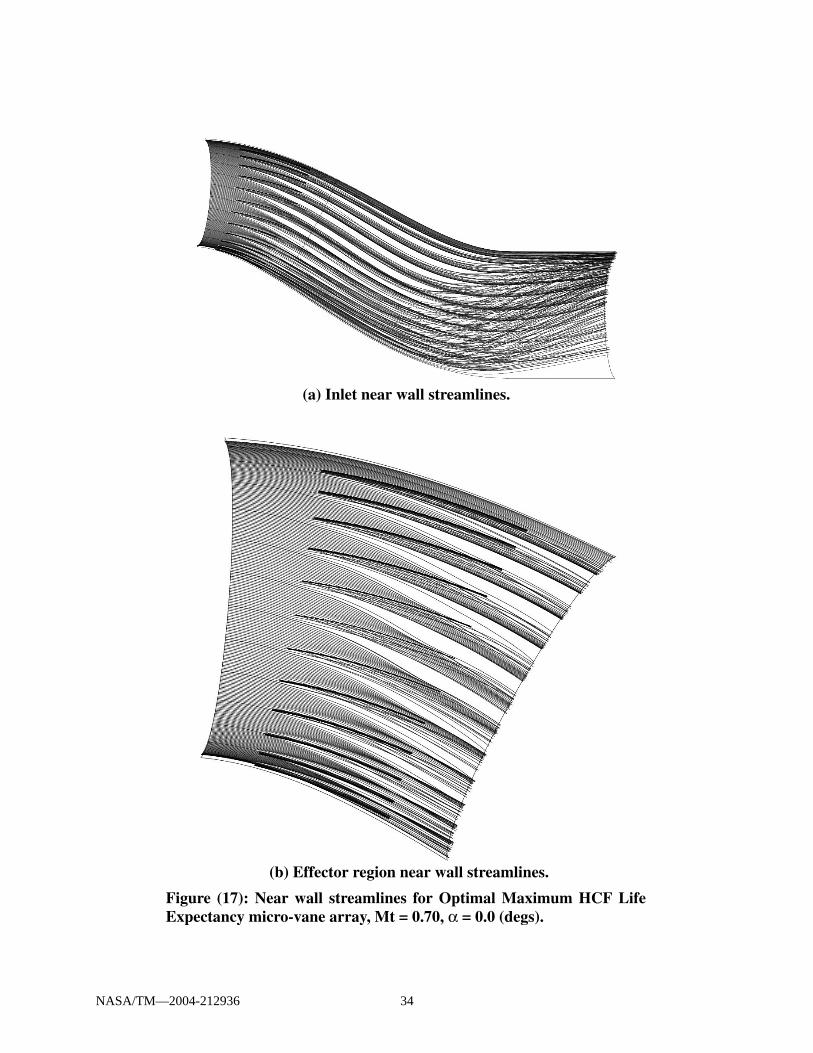
Figure (14) presents a comparison of the engine face total pressure recovery con-tours and secondary flow field for each of the validation solutions obtained from the CFD solu-tions. Although the three “Optimal Robust” array designs were generated from three verydifferent mission strategies, the engine face flow field achieved by these array designs were notvisually significantly different. Presented in Figures (15) through (17) are the near wall stream-lines for the three optimal array designs, i.e. the Maximum Performance, the Maximum EngineStability, and the Maximum HCF Life expectancy missions. Shown in these figures are both thenear wall streamlines for the entire inlet as well as an enlarge image of the effector region nearwall streamlines.
Comparison of Optimal Micro-Vane and Optimal Micro-Jet Designs
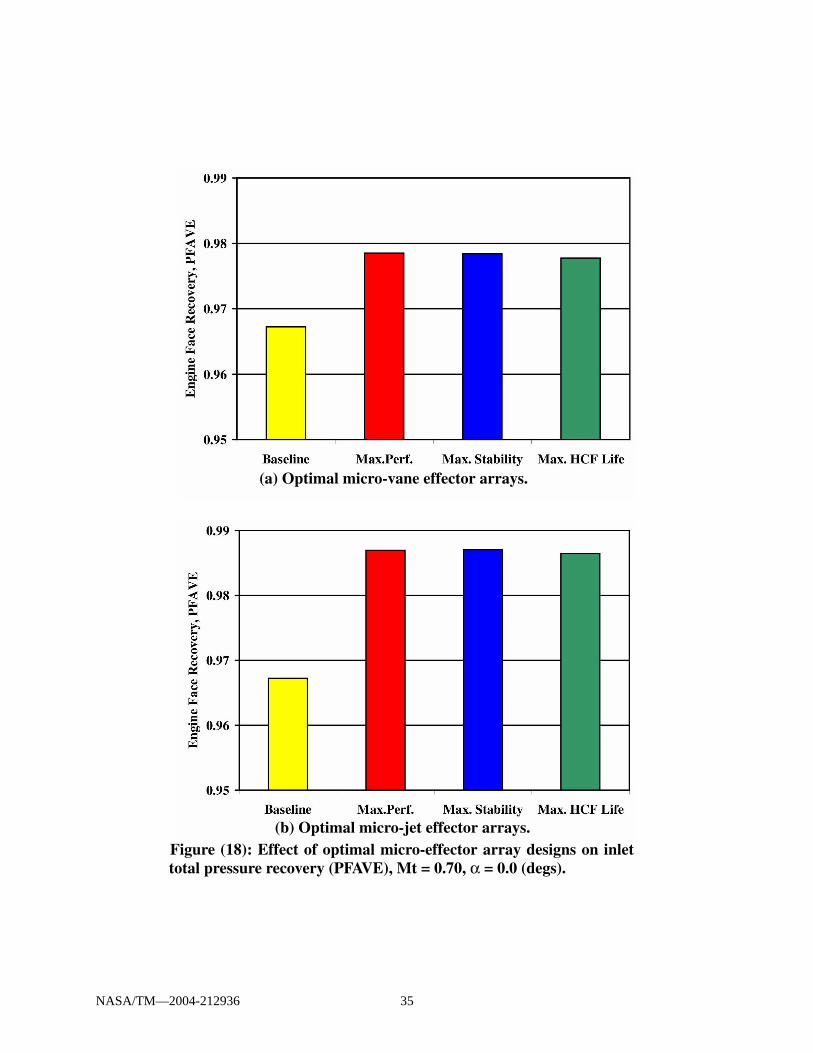
Comparison of the performance of the three “Optimal Robust” array designs, i.e.the Maximum Performance, Maximum Engine Stability, and Maximum HCF Life Expectancymission designs, are shown in Figures (18) through (20) for both the set of three optimal micro-vane designs and the set of three optimal micro-jet array designs. Optimal micro-jet arrays were
examined in Anderson, Miller, Addington, and Agrell(15) and the summary performance pre-sented in this report for comparison with the optimal micro-vane designs. These figures alsoinclude the baseline inlet performance, i.e. the performance of the redesigned M2129 inlet S-ductwithout flow control. The low strength effector units used in these designs achieved a substantialimprovement in inlet total pressure recovery (PFAVE) over the baseline performance. See Figure(18). This differs from the performance of the high strength effector units which never increased
the inlet total pressure recovery above the baseline value(5). A comparison between the set ofthree (3) optimal micro-jet arrays and the set of three (3) optimal micro-vane arrays indicates asubstantial increase in total pressure recovery as a result of using micro-jet arrays. See Figures(18a) and (18b). However, care must be taken about making judgements about the impact ofmicro-vane vs. micro-jets. The penalties associated with bleeding high pressure engine flow toincrease total pressure recovery must be evaluated through a complete vehicle system study todetermine the overall systems benefit or penalty.
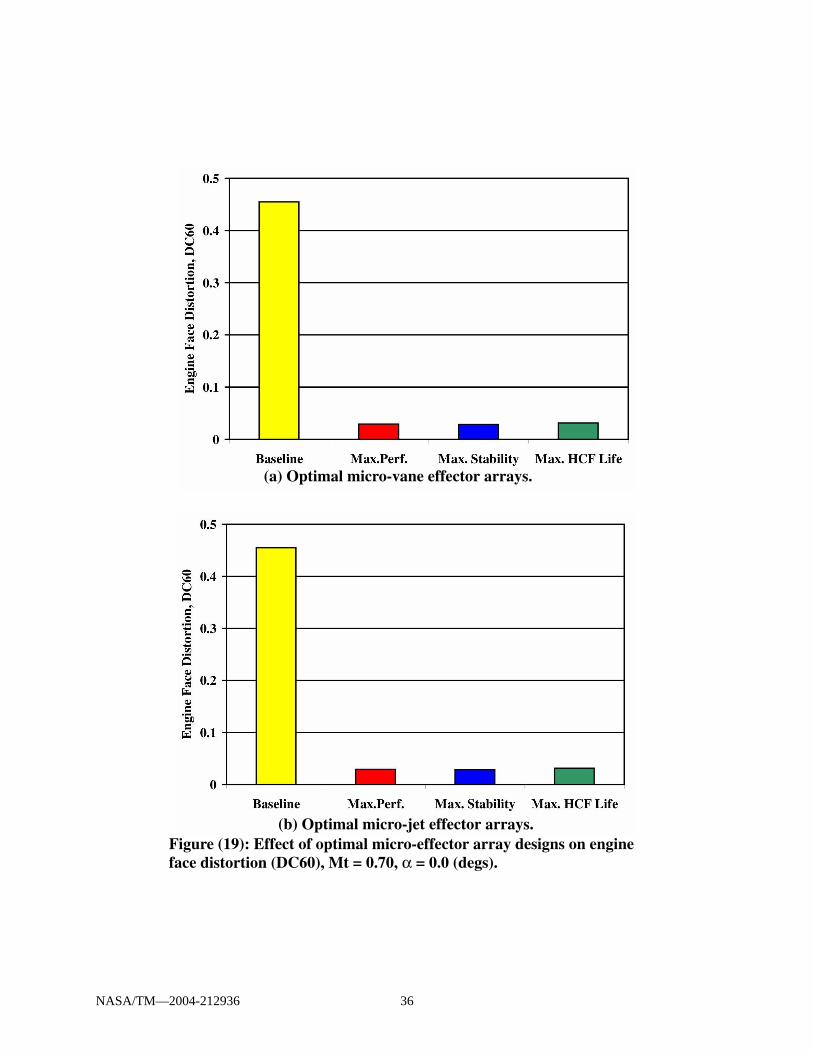
Excellent engine face distortion characteristics were also achieved with the micro-effector units, i.e both micro-jet and micro-vanes, as shown in Figure (19). Essentially no perfor-mance differences were evident between micro-vanes and micro-jet arrays with regards to engineface distortion. See Figures (19a) and (19b).
FM2
---------15--- Fk
2------
k 1=
5
∑=
NASA/TM—2004-212936 11
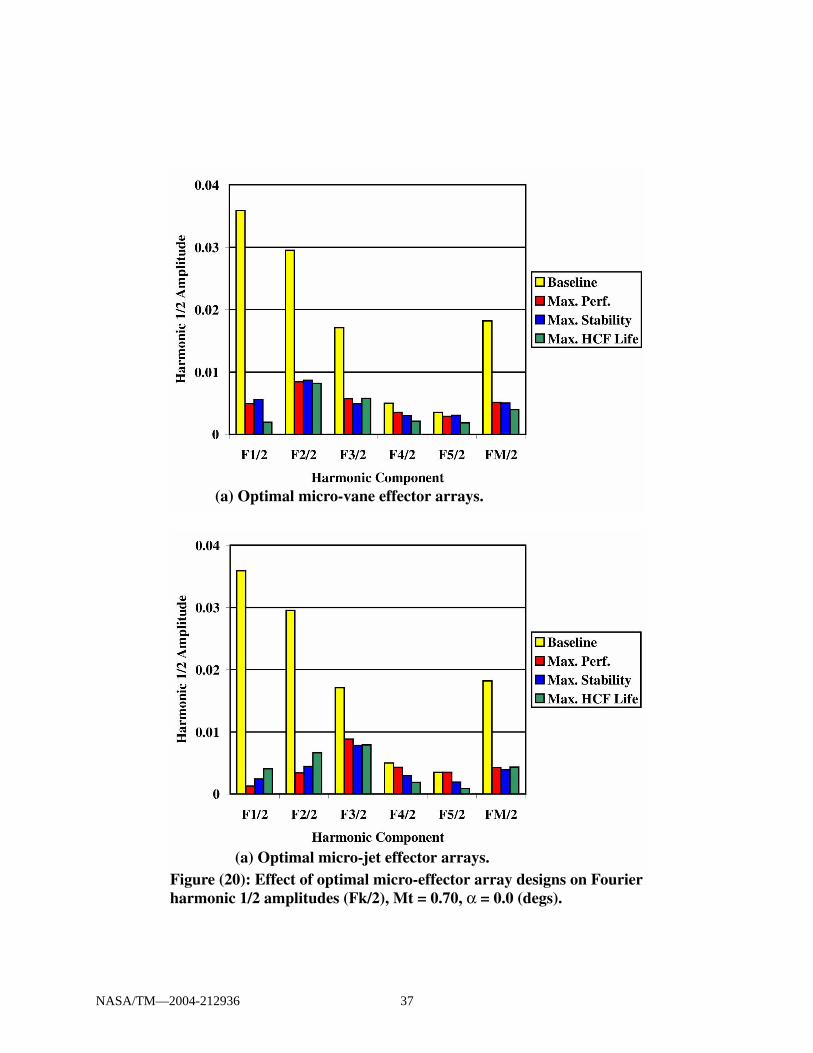
Presented in Figure (20) is a comparison of the first five Fourier harmonic 1/2-amplitudes for the set of three (3) optimal designs for both micro-jet and micro-vane arrays. Min-imizing the mean of the first five Fourier harmonic 1/2-amplitudes resulted in a substantial reduc-tion in the amplitudes of the first three harmonics 1/2-amplitudes, and very low amplitudes for thefourth and fifth harmonic components. Figures (20a) and (20b) include eighteen (18) matchedpairs of independent CFD observations for the Fourier harmonic 1/2 amplitude distortion for three(3) optimal array designs arising from three (3) mission strategies. The data has been ordered suchthat the differences in each of the eighteen (18) matched pairs of CFD observations can be testedas a paired t-test. In a paired t-test, the mean of the sample difference and the standard deviation ofthe sample difference is calculated and the following t-statistic determined:
(14)
where is the difference of each of the N-pairs of the response variable in the two
data sets.In the paired t-test, if the expression
(15)
is valid, the response values from the first data set are not statistically different from the responsevalues from the second data set at the 95% confidence level. Conversely, the response values fromthe first data set are statistically different from the response values from the second data set at the95% confidence level if the following expression is valid:
(16)
Comparing the set of three (3) Fourier micro-vane harmonic 1/2 amplitude profilesrepresented by Figure (20a) and the set of three (3) Fourier micro-jet harmonic 1/2 amplitude pro-files represented by Figure (20b), the mean of the sample difference and the
standard deviation of the sample difference . This gives a t-static
, which when compared to a t value , indicates there were nostatistically significant differences between the two (2) sets of three (3) optimal cases at the 95%confidence level. Even though there are differences between the micro-vane and micro-jet the fac-tor variables that define the optimal array designs, these factor differences did not translate intostatistically significant differences in the Fourier harmonic 1/2 amplitudes of distortion. There-fore, no conclusions can be drawn as to the relative merits of optimal micro-vane arrays as com-pared to optimal micro-jet arrays in managing the Fourier harmonic 1/2 amplitudes of engine facedistortion. There are no statistically significant differences.
t∗
1N---- ∆ j
j 1=
N
∑
∆ j ∆–( )2
N 1–( )----------------------
j 1=
n
∑------------------------------------=
∆ j Y1 Y2–( ) j=
t∗ t 0.975 νp,( )<
t∗ t 0.975 νp,( )>
MEAN 0.0021=
STDEV 0.0043=
t∗ 0.4923= t 0.975 17,( ) 2.110=
NASA/TM—2004-212936 12
Statistical Comparison of CFD Analysis and DOE Predictions
A direct statistical comparison can be made between the optimal responses pre-dicted by the DOE models (YDOE) and the actual CFD predicted performance values (YCFD)through the t-statistic:
(17)
where YA is the upper 95% confidence interval for the individual predicted response YDOE fromthe regression model, and t(0.975,N-p) is the 95% confidence t-value for N-p degrees of freedom.Equation (17) was used for the evaluation of the PFAVE regression model.
When there exist a functional relationship between the mean values and standarddeviation of the data, the data do not satisfy the requirement that the variation is normally distrib-uted. This often happens when there is a decade or more variation in the response variables rangeover the design (DOE) space. Under this condition, a transformation is often used to stabilize thevariation over the response variable range. Because this was the case with DC60 and the first fiveFourier harmonic 1/2-amplitudes, the natural logarithm of these responses was used in the DOEanalysis with the t-statistic defined by:
(18)
Equation (18) was used in the evaluation of the (DC60) and the five Fourier harmonic 1/2-ampli-tude (F1/2, F2/2, F3/2, F4/2, F5/2) regression models.
For a statistically significant difference to exist between the DOE model predictedresponse (YDOE) and the CFD validation response prediction (YCFD), the expression:
(19)
must hold. Likewise, if the expression
(20)
is valid, the YCFD is not statistically different from YDOE. Therefore, for no significant statisticaldifference to exist between the DOE model predicted response YDOE and the CFD analysisresponse YCFD, the CFD response prediction must fall within the 95% confidence interval of the
t∗YCFD( ) YDOE( )–
YA( ) YDOE( )–
t 0.975 N p–,( )-------------------------------------
----------------------------------------------=
t∗YCFD( )ln YDOE( )ln–
YA( )ln YDOE( )ln–
t 0.975 N p–,( )-------------------------------------------------
DOE model prediction for that response. For each “Optimal Robust” array design, the statisticalcomparisons were made between the corresponding responses for the cases in each set listed inTables (10) and (11).
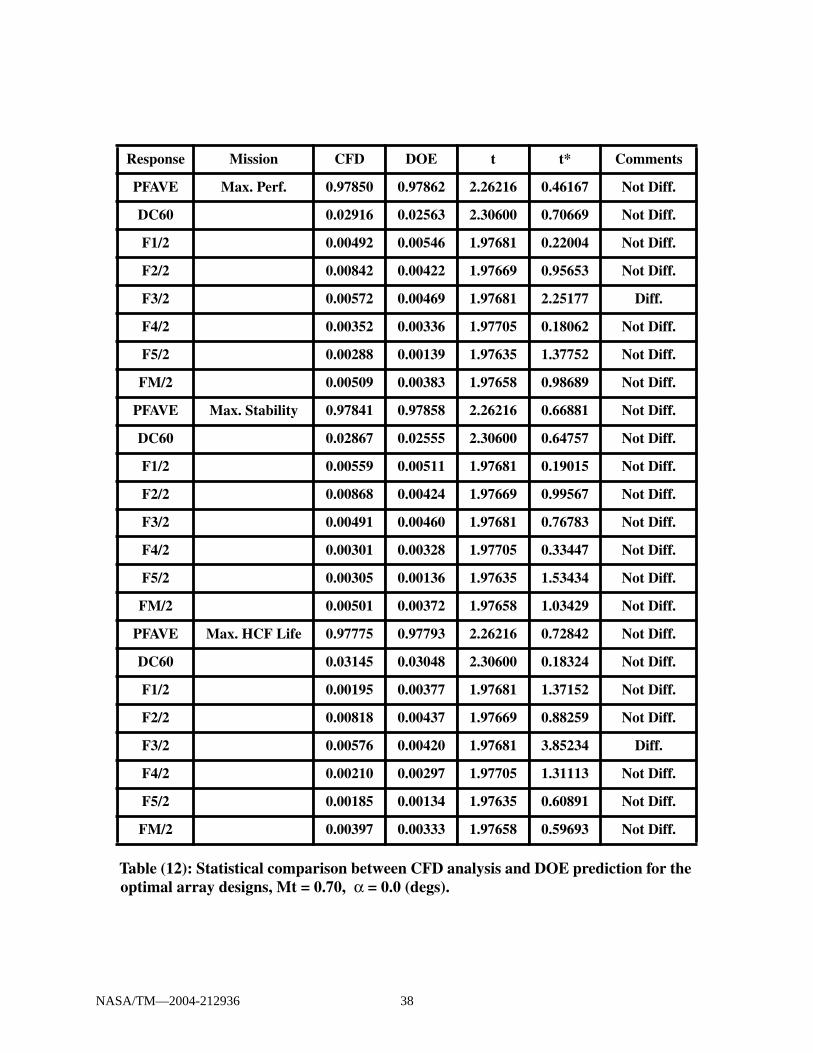
Table (12) presents the results of a statistical comparison between the CFD analysisand DOE predictions for the Maximum Performance, Maximum Engine Stability, and MaximumHCF Life Expectancy missions for the eight (8) response parameters. The eight response parame-ters include the inlet total pressure (PFAVE), the engine face distortion (DC60), the first five Fou-rier harmonic 1/2 amplitudes of distortion (F1/2, F2/2, F3/2, F4/2, F5/2), and the mean of the firstfive Fourier harmonic 1/2 amplitudes of distortion (FM/2). With the exception of two (2) cases,the comparisons indicate that the DOE prediction results are not statistically different from theCFD analysis. These CFD analysis predictions fell within the 95% confidence interval of the DOEperformance predictions generated from the DOE response surfaces. However, for those twocases in which a statistical difference were indicated, the actual differences between the CFDanalysis and DOE prediction were small relative to experimental error. Therefore, the optimalarrays determined by the DOE regression models were a statistically valid optima when comparedto the actual CFD array analyses. The accuracy of the response surfaces determined from theDOE prediction was therefore sufficient for determining optimal array designs.
CONCLUSIONS
The fundamental importance of Response Surface Methods over traditional designapproaches lies in the optimal sequenced pattern of Design-of-Experiments (DOE), the statisticalmodel building, and the systematic procedures for the optimization of design configurations.Response Surface Methods allows the number of CFD cases run to be optimized, depending onthe program objectives, for a substantial reduction in the number of CFD experiments to be run.RSM also provides an economical, reliable and systematic approach to variable screening as wellas the general exploration of the region that contains the estimated optimal conditions. As a result,the pragmatic use of RSM places a high priority on obtaining a better understanding of the pro-cess system as well as estimating the optimum conditions. In the design of microscale secondaryflow arrays for compact inlets, it is just as important to understand and quantify the behavior ofthe factor (design) parameters in the neighborhood of the optimal conditions as knowing the opti-mal conditions. Hence, an RSM approach is particularly beneficial for the design of micro-vanearrays since there are a great many factor (design) variables available to the aerodynamicist, andoften there exists multiple design objectives. Also multiple mission optimal arrays were deter-mined with Response Surface Methods without repeating the optimization procedure.
The use of micro-vane actuation in the revised M2129 S-duct was dominated bythe two-factor interactions (n*h) and (h*c) for inlet total pressure recovery (PFAVE) and threetwo-factor interactions (n*h), (n*c) and (h*c) for engine face (DC60) distortion. Without objec-tive information about these two-factor interactions, optimal micro-vane array designs can not bedetermined. In general, the optimal use of micro-vane actuation in the revised M2129 S-duct wasvery effective in simultaneously managing the inlet total pressure recovery, engine face distortionand the Fourier harmonic 1/2 amplitude content of engine face distortion.
To illustrate the potential of Response Surface Methods, three different missionstrategies were considered for the subject inlet, namely (1) Maximum Performance, (2) MaximumEngine Stability, and (3) Maximum HCF Life Expectancy. The Maximum Performance missionminimized the inlet total pressure losses, the Maximum Engine Stability mission minimized the
NASA/TM—2004-212936 14
engine face distortion (DC60), while the Maximum HCF Life Expectancy mission minimized themean of the first five Fourier harmonic amplitudes, i.e. “collectively” reduced all the harmonic 1/2-amplitudes of engine face distortion. By visually comparing the CFD validation performance ofthe three optimal arrays designs, i.e. Maximum Performance, Maximum Engine Stability, and theMaximum HCF Life Expectancy, it is obvious that they are remarkably similar. Also, a visualcomparison between the performance of the three optimal arrays designs determined by the DOEprediction and the CFD validation analysis shows remarkable similarity. A comparison betweenoptimal arrays determined by the DOE prediction and CFD analysis indicates statistically differ-ences occurred about 8% of the time, which is remarkably good. All the cases in which a statisti-cal difference were indicated involved the evaluation of the Fourier harmonic 1/2-amplitudes ofdistortion. In these particular cases, the differences between the CFD analysis and DOE predic-tion were too small to be of practical significance, i.e. they could not be experimentally measured.This indicates that the DOE prediction results were not statistically different from the CFD analy-sis results (i.e. the CFD analysis predictions fell within the 95% confidence interval of the DOEperformance predictions). It also indicated that the optimal arrays determined by the DOE modelswere a statistically valid optima when compared to the actual CFD array analyses. The accuracyof the response surfaces determined from the DOE analysis was therefore more than adequate foruse in determining an array optimum.
A comparison between the set of three (3) optimal micro-jet arrays and the set ofthree (3) optimal micro-vane arrays indicates a substantial increase in total pressure recovery as aresult of the using micro-jet arrays. However, care must be taken in making judgments aboutmicro-jets vs. micro-vane as the penalty for bleeding 1.0% engine flow has not been included inthis study. Excellent engine face distortion characteristics were also achieved with the micro-effector units, i.e both micro-jet and micro-vanes. Essentially no performance differences wereevident between micro-vanes and micro-jet arrays with regards to engine face distortion. A pairedt-test comparison between the set of three (3) optimal Fourier micro-vane harmonic 1/2 amplitudeprofiles and the set of three (3) Fourier micro-jet harmonic 1/2 amplitude profiles indicated no sta-tistical significant differences between the two (2) sets of three (3) optimal cases at the 95% confi-dence level. Even though there are differences between the micro-vane and micro-jet the factorvariables that define the optimal array designs, these factor differences did not translate into statis-tically significant differences in the Fourier harmonic 1/2 amplitudes of distortion.
NASA/TM—2004-212936 15
REFERENCES
(1) Anderson, B. H., Miller, D. N., Yagle, P. J, and Truax, P. P., “A Study of MEMS Flow Controlfor the Management of Engine Face Distortion in Compact Inlet Systems”, FEDSM99-6920, 3rdASME/JSME Joint Fluids Engineering Conference, San Francisco, CA, July 18-23, 1999.
(2) Hamstra, J. W., Miller, D. N., Truax, P. P., Anderson, B. H., and Wendt, B. J., “Active InletFlow Control Technology Demonstration,” ICAS-2000-6.11.2, 22nd International Congress of theAeronautical Sciences, Harrogate, UK, August 27th-September 1st, 2000.
(3) Box, G. E. P., and Jones, S., “Empirical Model Building and Response Surfaces,” John Wiley,New York, 1987
(4) Box, G. E. P., Hunter, W. G., and Hunter, J. S., “Statistics for Experimenters,” John Wiley, NewYork, 1978.
(5) Anderson, B. H., Baust, H. D., and Agrell, J., “Management of Total Pressure Recovery, Dis-tortion, and High Cycle Fatique in Compact Air Vehicle Inlets,” NASA/TM-2002-212000, Dec.2002.
(6) AGARD FTP Working Group 13, “Air Intakes for High Speed Vehicles”, AR-270, September1991.
(7) Willmer, A. C., Brown, T. W. and Goldsmith, E. L., “Effects of Intake Geometry on CircularPitot Intake Performance at Zero and Low Forward Speeds”, Aerodynamics of Power Plant Instal-lation, AGARD CP301, Paper 5, Toulouse, France, May 1981, pp 51-56.
(8) Anderson, B. H. and Keller, D. J., “Optimal Micro-Scale Secondary Flow Control for the Man-agement of HCF and Distortion in Compact Inlet Diffusers”, NASA/TM-2002-211686, July2002.
(9) Anderson, B. H. and Keller, D. J., “A Robust Design Methodology for Optimal Micro-Scalesecondary Flow Control in Compact Inlet Diffusers”, AIAA Paper No. 2002-0541, Jan. 2002.
(10) Anderson, B. H. and Keller, D. J., “Robust Design Methodologies for Optimal Micro-ScaleSecondary Flow Control in Compact Inlet Diffusers”, NASA/TM-2001-211477, March 2001.
(11) Bender, E. E, Anderson, B. H., and Yagle, P. J., “Vortex Generator Modeling for NavierStokes Code”, FEDSM99-69219, 3rd ASME/JSME Joint Fluids Engineering Conference, SanFrancisco, CA, July 18-23, 1999.
NASA/TM—2004-212936 16
(12) Ludwig, G. R., “Aeroelastic Considerations in the Measurement of Inlet Distortion”, 3rdNational Turbine Engine High Cycle Fatigue Conference, 1998.
(13) Anderson, B. H. and Keller, D. J., “Considerations in the Measurements of Engine Face Dis-tortion for High Cycle Fatigue in Compact Inlet Diffusers”, NASA/M-2001-211476, March 2001.
(14) Goldsmith, E. L., and Seddon, J. (eds), “Practical Intake Aerodynamics,” Blackwell ScientificPublications, Oxford, 1993.
(15) Anderson, B. H., Miller, D. N., Addington, G. A., and Agrell, J., “Optimal Micro-Jet FlowControl for Compact Air Vehicle Inlets,” Proposed NASA/TM, 2003.
NASA/TM—2004-212936 17
Figure (1): Near wall streamlines in baseline inlet S-duct, Mt = 0.70, α = 0.0 (degs).
Figure (2): Engine face flow field in baseline inlet S-duct, Mt = 0.70, α = 0.0 (degs).(a) Total Pressure Recovery Contours (b) Secondary Velocity Vectors
NASA/TM—2004-212936 18
Figure (3) Location of effector region within inlet S-duct configuration.
Figure (4); Micro-vane atonement within inlet S-duct effector region.
Effector Region
NASA/TM—2004-212936 19
Table (1): Factor variables which establish the DOE design matrix.
Table (2): Variables held constant.
Table (3): DOE response variables.
Factor Range
Number of Micro-Vane Effectors, n 13 to 27
Micro-Vane Effector Height (mm), h 1.0 to 2.0
Micro-VaneEffector Chord Length (mm), c 36.0 to 72.0
(c) Optimal “Maximum HCF Life Expectancy” CFD Solution
NASA/TM—2004-212936 31
Figure (15): Near wall streamlines for Optimal Maximum Perfor-mance micro-vane array, Mt = 0.70, α = 0.0 (degs).
(a) Inlet near wall streamlines.
(b) Effector region near wall streamlines.
NASA/TM—2004-212936 32
Figure (16): Near wall streamlines for Optimal Maximum Engine Sta-bility micro-vane array, Mt = 0.70, α = 0.0 (degs).
(a) Inlet near wall streamlines.
(b) Effector region near wall streamlines.
NASA/TM—2004-212936 33
Figure (17): Near wall streamlines for Optimal Maximum HCF LifeExpectancy micro-vane array, Mt = 0.70, α = 0.0 (degs).
(a) Inlet near wall streamlines.
(b) Effector region near wall streamlines.
NASA/TM—2004-212936 34
Figure (18): Effect of optimal micro-effector array designs on inlettotal pressure recovery (PFAVE), Mt = 0.70, α = 0.0 (degs).
(a) Optimal micro-vane effector arrays.
(b) Optimal micro-jet effector arrays.
NASA/TM—2004-212936 35
Figure (19): Effect of optimal micro-effector array designs on engineface distortion (DC60), Mt = 0.70, α = 0.0 (degs).
(a) Optimal micro-vane effector arrays.
(b) Optimal micro-jet effector arrays.
NASA/TM—2004-212936 36
Figure (20): Effect of optimal micro-effector array designs on Fourierharmonic 1/2 amplitudes (Fk/2), Mt = 0.70, α = 0.0 (degs).
(a) Optimal micro-vane effector arrays.
(a) Optimal micro-jet effector arrays.
NASA/TM—2004-212936 37
Table (12): Statistical comparison between CFD analysis and DOE prediction for theoptimal array designs, Mt = 0.70, α = 0.0 (degs).
Response Mission CFD DOE t t* Comments
PFAVE Max. Perf. 0.97850 0.97862 2.26216 0.46167 Not Diff.
DC60 0.02916 0.02563 2.30600 0.70669 Not Diff.
F1/2 0.00492 0.00546 1.97681 0.22004 Not Diff.
F2/2 0.00842 0.00422 1.97669 0.95653 Not Diff.
F3/2 0.00572 0.00469 1.97681 2.25177 Diff.
F4/2 0.00352 0.00336 1.97705 0.18062 Not Diff.
F5/2 0.00288 0.00139 1.97635 1.37752 Not Diff.
FM/2 0.00509 0.00383 1.97658 0.98689 Not Diff.
PFAVE Max. Stability 0.97841 0.97858 2.26216 0.66881 Not Diff.
DC60 0.02867 0.02555 2.30600 0.64757 Not Diff.
F1/2 0.00559 0.00511 1.97681 0.19015 Not Diff.
F2/2 0.00868 0.00424 1.97669 0.99567 Not Diff.
F3/2 0.00491 0.00460 1.97681 0.76783 Not Diff.
F4/2 0.00301 0.00328 1.97705 0.33447 Not Diff.
F5/2 0.00305 0.00136 1.97635 1.53434 Not Diff.
FM/2 0.00501 0.00372 1.97658 1.03429 Not Diff.
PFAVE Max. HCF Life 0.97775 0.97793 2.26216 0.72842 Not Diff.
DC60 0.03145 0.03048 2.30600 0.18324 Not Diff.
F1/2 0.00195 0.00377 1.97681 1.37152 Not Diff.
F2/2 0.00818 0.00437 1.97669 0.88259 Not Diff.
F3/2 0.00576 0.00420 1.97681 3.85234 Diff.
F4/2 0.00210 0.00297 1.97705 1.31113 Not Diff.
F5/2 0.00185 0.00134 1.97635 0.60891 Not Diff.
FM/2 0.00397 0.00333 1.97658 0.59693 Not Diff.
NASA/TM—2004-212936 38
This publication is available from the NASA Center for AeroSpace Information, 301–621–0390.
REPORT DOCUMENTATION PAGE
2. REPORT DATE
19. SECURITY CLASSIFICATION OF ABSTRACT
18. SECURITY CLASSIFICATION OF THIS PAGE
Public reporting burden for this collection of information is estimated to average 1 hour per response, including the time for reviewing instructions, searching existing data sources,gathering and maintaining the data needed, and completing and reviewing the collection of information. Send comments regarding this burden estimate or any other aspect of thiscollection of information, including suggestions for reducing this burden, to Washington Headquarters Services, Directorate for Information Operations and Reports, 1215 JeffersonDavis Highway, Suite 1204, Arlington, VA 22202-4302, and to the Office of Management and Budget, Paperwork Reduction Project (0704-0188), Washington, DC 20503.
NSN 7540-01-280-5500 Standard Form 298 (Rev. 2-89)Prescribed by ANSI Std. Z39-18298-102
Form Approved
OMB No. 0704-0188
12b. DISTRIBUTION CODE
8. PERFORMING ORGANIZATION REPORT NUMBER
5. FUNDING NUMBERS
3. REPORT TYPE AND DATES COVERED
4. TITLE AND SUBTITLE
6. AUTHOR(S)
7. PERFORMING ORGANIZATION NAME(S) AND ADDRESS(ES)
11. SUPPLEMENTARY NOTES
12a. DISTRIBUTION/AVAILABILITY STATEMENT
13. ABSTRACT (Maximum 200 words)
14. SUBJECT TERMS
17. SECURITY CLASSIFICATION OF REPORT
16. PRICE CODE
15. NUMBER OF PAGES
20. LIMITATION OF ABSTRACT
Unclassified Unclassified
Technical Memorandum
Unclassified
National Aeronautics and Space AdministrationJohn H. Glenn Research Center at Lewis FieldCleveland, Ohio 44135–3191
1. AGENCY USE ONLY (Leave blank)
10. SPONSORING/MONITORING AGENCY REPORT NUMBER
9. SPONSORING/MONITORING AGENCY NAME(S) AND ADDRESS(ES)
National Aeronautics and Space AdministrationWashington, DC 20546–0001
Available electronically at http://gltrs.grc.nasa.gov
February 2004
NASA TM—2004-212936
E–14375
WBS–22–708–92–24
44
Optimal Micro-Vane Flow Control for Compact Air Vehicle Inlets
Bernhard H. Anderson, Daniel N. Miller, Gregory A. Addington, and Johan Agrell
Bernhard H. Anderson, NASA Glenn Research Center; Daniel N. Miller, Lockheed Martin Aerospace Company, FortWorth, Texas 76101; Gregory A. Addington, Wright-Patterson Air Force Base, Dayton, Ohio 45433; and Johan Agrell,Swedish Defence Research Agency, Bromma, Sweden SE–17290. Responsible person, Bernhard H. Anderson,organization code 5850, 216–433–5822.
The purpose of this study on micro-vane secondary flow control is to demonstrate the viability and economy of ResponseSurface Methodology (RSM) to optimally design micro-vane secondary flow control arrays, and to establish that theaeromechanical effects of engine face distortion can also be included in the design and optimization process. Thesestatistical design concepts were used to investigate the design characteristics of “low unit strength” micro-effector arrays.“Low unit strength” micro-effectors are micro-vanes set at very low angles-of-incidence with very long chord lengths.They were designed to influence the near wall inlet flow over an extended streamwise distance, and their advantage liesin low total pressure loss and high effectiveness in managing engine face distortion. Therefore, this report examinesoptimal micro-vane secondary flow control array designs for compact inlets through a Response Surface Methodology.